Embed Size (px)
Citation preview
Title Double-slit Emittance Monitor for Pulsed Proton Beams
Author(s)Ikegami, Masanori; Kando, Masaki; Dewa, Hideki; Fujita,Hirokazu; Shirai, Toshiyuki; Iwashita, Yoshihisa; Kakigi,Sigeru; Noda, Akira; Inoue, Makoto
Citation Bulletin of the Institute for Chemical Research, KyotoUniversity (1995), 73(1): 1-10
Issue Date 1995-03-31
URL http://hdl.handle.net/2433/77603
Right
Type Departmental Bulletin Paper
Textversion publisher
Kyoto University

Bull. Inst. Chem. Res., Kyoto Univ., Vol. 73, No. 1, 1995
Double-slit Emittance Monitor for Pulsed Proton Beams
Masanori IKEGAMI*, Masaki KANDO*, Hideki DEWA*,
Hirokazu FuJITA*, Toshiyuki SHIRAI*, Yoshihisa IwASHITA*,
Sigeru KAKIGI*, Akira NODA* and Makoto INOUE*
Received January 20, 1995
At ICR, Kyoto University, an emittance monitor for beams from the DTL has been developed and installed in the beam line. With beam current of 0.7 mA at the entrance of the DTL, typical rms emittance
for x direction is measured to be 4.8 srmm•mrad. Changing the RF power fed to the DTL from 250 kW to 300 kW, the rms emittance is measured to be varied from 4.8 srmm•mrad to 9.0 ,rmm•mrad. The variation of emittance in a macro pulse is also measured and the rms emittance is found to be varied from 4.8 7rmm•mrad
to 5.9 nmm•mrad.
KEY WORDS : Beam emittance/ Pulsed. beam/ Two-slit method
1. INTRODUCTION
At ICR (Institute for Chemical Research), Kyoto University, a 7 MeV proton linac which
consists of an RFQ linac and a DTL has been under improvement to get higher beam current°.
In these days, acceleration of intense charged particle beams in a linear accelerator is of
considerable interest for variety of application. Beam evolution in a high current linac is
strongly affected by the nonlinear space charge forces and resulting emittance growth limits the
quality of the output beams. From the point of view, we have developed an emittance monitor for the beams from the DTL and installed it in the beam line.
Dependence of emittance on the RF power fed to the DTL is measured. Beam distribution
in phase space is found to be affected by the strength of the RF power fed to the DTL. The
variation of emittance within a macro pulse is also measured and the beam distribution in phase
space is found to have some variation within a macro pulse.
Because the measured results were presented at a previous paper2), in this paper the
emphasis is put on the detailed hardware structure of the emittance monitor which could not be
presented at the previous paper for lack of space.
2. EMITTANCE MONITOR
The emittance monitor is based on two-slit method and modified to measure the emittance of
the pulsed beam with duration and repetition rate of 50 ,usec and 18-180 Hz, respectively2"41.
A schematic diagram of the emittance monitor is shown in Fig. 1 and its main specifcations are
* it- .34C, 4r9 m, 1'B77* Z, ;7 rms, TW : Nuclear Science Research Facility, Institute for Chemical Research, Kyoto University, Uji, Kyoto 611,
Japan.
( 1 )

M. IKEGAMI, et al.
----------------------------------demultiplexer< digital output: pulse motorpulse motor
.1 pulse motor driver
beam collectingmovable movable plate \ proton beam —4
\[ ----- rear slit front slit
current amp\ / ~/
sample ------- 12bit A/Dpulse motor &h
/old—~convertercontroler hold timing
NEC PC9801 master triggertiming
of the RF generator------------- system------------- trigger signal
Fig. 1. A schematic diagram of the emittance monitor.
Table 1. Main specifications of the emittance monitor.
Slit width0.2 mm Slit thickness5 mm
Distance between front and rear slit 1 m Resolution of position0.2 mm
Resolution of inclination angle 0.2 mrad Desplacement of slit—20 mm-- +80 mm (in steps of 0.2 mm)
Measurement range± 10 mm X ± 10 mrad Measurement time5 min (1 mmX 1 mrad interval)
shown in Table 1. The emittance monitor has front and rear slit and the beam passed through
the two slits is collected by a beam collecting plate. This current is amplified by a current
amplifier, held by an S/H (sample and hold) circuit and led to a 12 bit A/D converter. The
measurements of the beam current are synchronized to the RF timing signal applied to the DTL
with use of the S/H circuit. Changing the hold timing, we can measure the variation of
emittance within a macro pulse. Two sets of the slits is installed in a vacuum chamber for x andy directions. The front slits
for x and y directions are installed at positions of 1,475 mm and 1,325 mm downstream from the
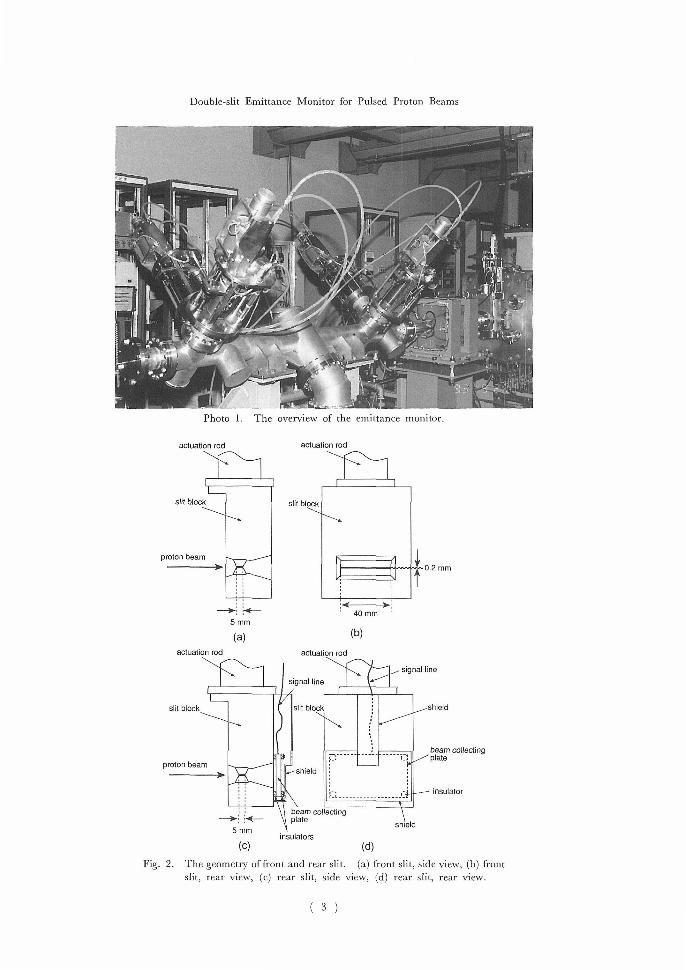
exit of the DTL, respectively. The overview of the emittance monitor is shown in Photo 1.
2.! Slit and stit actuating system
The distance between the front and rear slit is 1 m and the widths and thicknesses of the
collimating slits are 0.2 mm and 5 mm, respectively. The geometry of the front and rear slit are
shown in Fig. 2. These slits are made of copper and water-cooled. These slits can be actuated
( 2 )
Double-slit Emittance Monitor for Pulsed Proton Beams
4.
Iv .1,111
. , . Ni11, '41i\siF1.-A,`"-.,i.:,/.: . , ,_..y " i, ' , ..: ro, . ' 1,
L',4, <is
**~°I
Photo 1. The overview of the emittance monitor.
actuation rod actuation rod
bi611 slit block slit block
proton beam~~ ---~'~~- -.---~•0.2mm
E'; —~: i<-----40 mm
5 mm
(a)(b) actuation rod actuation rod
allsignal line lial signal line
slit block ' slit bloc'pshield
beam collecting
proton beam Ji_,; plate
-------------irillill shield insulator
beam collecting--- ~; :<--
11beam shield 5mm i
nsulators
(c)(d)
Fig. 2. The geometry of front and rear slit. (a) front slit, side view, (b) front slit, rear view, (c) rear slit, side view, (d) rear slit, rear view.
( 3 )

M. IKEGAMI, et al.
X-X' plane Y-Y' plane 4040
(mrad) 41`" (mrad)
High
-40-40 -20 (mm) 20 -20 (mm) 20
High DI,
Fig. 3. An example of the contour plot. Scanning all the measurable region. White area represents the measurable region.
in steps of 0.2 mm with use of pulse motors and their total displacement from the design orbit can
be varied from —20 mm to +80 mm. In this geometry, the maximum displacement and
inclination angle of the beam to pass through the two slits is 20 mm and 40 mrad, respectively.
The maximum speed of the slit actuation is 8 mm/sec. In the case of scanning the region of
± 10 mm X ± 10 mrad with 1 mm X 1 mrad intervals, it takes about 5 minutes to measure the
contour plot of the beam intensity in phase space and calculate rms emittance for both planes.
In the case of scanning all the measurable region, it takes about 12 minutes. An example of the
contour plot is shown in Fig. 3.
We have a demultiplexer to drive 4 motors with one pulse motor driver. The demultiplexer
consists of 9 relays and they are controlled by the digital outputs of the pulse motor controller.
Four of the relays are used to control the electromagnetic breaks of the pulse motors and the
others are used to switch the output of the pulse motor driver. The slit position can be measured
by potentiometers with an accuracy of ±0.1 mm.
2.2 Current detection system The beam passed through the front and rear slit is collected by the beam collecting plate.
The beam collecting plate is made of copper and shielded to supperss the noises possibly caused
by secondary electrons (see Fig. 2 (c) and (d)). The shield is made of copper. The actuation rod, the slit block and the shield are electrically contacted to the ground and no suppressing
voltage is applied. The current collected by the beam collecting plate is amplified by the current amplifier.
The circuit diagram of this amplifier is shown in Fig. 4. The current amplifier outputs a signal
which is proportional to the input current and the inverting amplifier amplify the signal. The
S/H circuit hold the output signal of the inverting amplifier. This type of circuit is adopted for
( 4 )

Double-slit Emittance Monitor for Pulsed Proton Beams
Current Amp.Invertinp Amp. Sample & Hold Circuit r ^
100k 100k '1it
t'i30k
1k100k GUARD;' I RING,'i 10k.,
INPUT. ,_+OUTPUT sr + OPA602..+D-------- 300 LF356LF396
ii), 1j
MODE CdNTROL1jI-------1000p (HOLD TII}4ING)I
1I,----n>,
.Fig. 4. The circuit diagram of the current amplifier.
10 µsec/div. 1 50.0r.1-0.00= 10.0,/ 51 RUN
r-----------................................................. _i_ .r--------------------. ;--- (a)
10µsec/div. 2 500V—O.00s ]O.O/ f1 RUN
1/
I (''.............................................
(b) Fig. 5. A typical output of the current amplifier (a) input signal (peak
current is 10 nA), (b) output signal
the current amplifier to shorten the time constant. Typical output signal and measured linearity
of the current amplifier is shown in Fig. 5 and 6, respectively. With the beam current of 3 ~ 300
nA, the nonlinearity of the current amplifier is found to be negligible'. The rise time of the
amplifier is measured to be —6,usec.
The output of the current amplifier is held by the S/H circuit and led to the A/D converter.
The hold timing of the S/H circuit and the trigger signal of the A/D converter is fed by the timing
generator.
( 5 )

M. IKEGAMI, et al.
10 ----------------------------------------------------------------
8 — —
>
t6 —— o-
o ' 4 — a -- 3• O
2 —2—
y = -0.03510 + 0.026$77x R= 0.99965 _ 0 '>
0 50 100 150 200 250 300 350
input current (nA) Fig. 6. The linearity of the current amplifier.
=50 pse c
Ner--------------Jk.-------------------- the DTLvariable
iming Hcircuit-~-----------------------------------------
samplemode
=50 psec-1 msec
.r signal ------------------------ _ D converter
Fig. 7. The timing chart.
To care for noises, we can divide them to two parts. The one is the noises which are caused
before the signal is held by the S/H circuit, and the other is the noises which are caused after the
signal is held by the S/H circuit. The latter includes the quantization noise of the A/D
converter. To smooth the latter noises, the A/D converter is triggered 7 times for every macro
pulse. The timing chart is shown in Fig. 7. To smooth the former noises, we measure the beam current for 3 macro pulses and the average of them is adopted as the measured beam current for a
measuring point in phase space.
3. DATA ANALYSIS
3.1 Measurement of the offset voltage
To evaluate the offset voltage of the current amplifier, the output of the A/D converter is read
( 6 )

Double-slit Emittance Monitor for Pulsed Proton Beams
200 times for smoothing before each measurement. The offset voltage is measured with an accuracy of ±5 mV. The accuracy of the measured emittance is mainly limited by the accuracy of the measurement of the offset voltage of the current amplifire. The accuracy of the measured emittance depends on the beam current at the exit of the DTL. With beam current of 0.6 mA at the exit of the DTL, we can measure the emittance with an accuracy of ± 1 7r mm•mrad.
3.2 Correction for the slit thickness For beams which have large inclination angle, the effective slit width is smaller than the
actual slit width because of the slit thickness. So, the measured beam current is corrected by the relation,
l Icar= d Imes
l—IxI where Imes, Icor, x', d and l denote measured current, corrected current, inclination angle, slit width and slit thickness, respectively.
3.3 Calculation of the rms emittance There are several definitions for rms emittance of ion beams. We adopt the following
definition,
2,ns= ((x— (x) )2) ((x - (x) )2) — ((x— (X')) (x (x) )) 2
ifA(x, x')g(x, x')dxdx' (A(x,x))=
f f g(x, x')dxdx' where g(x, x') denotes the continous phase space distribution function of the beam and A(x, x') denotes an arbitrary function of x and x'. It should be noted that some authors introduce the factor of 4 so that the rms emittance gives correct emittance when applied to an ideal distribution, a uniformly filled ellipse. It should also be noted that the integration in the above equation should be replaced by summation because the experimental measurement of g(x, x') is done discretely.
4. EXPERIMENTAL SETUP
At ICR proton linac, output beam quality is strongly affected by the LEBT (low energy beam transport) parameters such as applied voltage on the electric quadrupoles and the Einzel lens. During the experiments, the LEBT parameters are fixed to a set of values which enables us
to accelerate relatively higher current of beam.
In the measurement, the dependence of emittance on the RF power fed to the DTL and the
hold timing are measured2). While measuring the dependence of emittance on the RF power fed
to the DTL, hold timing and beam current at the entrance of the DTL is fixed to t3 (see Fig. 8)
and 0.7 mA, respectively. While measuring the dependence of the hold timing, beam current at
the entrance of the DTL and RF power fed to the DTL is fixed to 0.7 mA and 300 kW, respectively.
Between the emittance monitor and the exit of the DTL a newly fabricated steering magnet5)
and a quadrupole doublet are installed, and these magnets are used to steer the beam and get
( 7 )

M. IKEGAMI, et al.
;Hi=2013mV:;H2.n
.A+t-*F+'° 20sec/div Di; Pk1 DC PIID.Fill DIµ
RFQ power level-I-_i- DTL power level JI~. ~
_ t
, 1.1 1 1 111 1 1 111 I1 1 I, 1 1 1 1 1 1 beam currentI \
--- I
hold timing ----_.-.. __-i _F___ ----- ir _ _ ! I
ti t2 t3 Fig. 8. The definition of the hold timing, ti—t3.
moderate focusing at the emittance monitor. The emittance is measured scanning all the measurable region with 1 mm X 1 mrad
.intervals.
5. MEASURED RESULTS
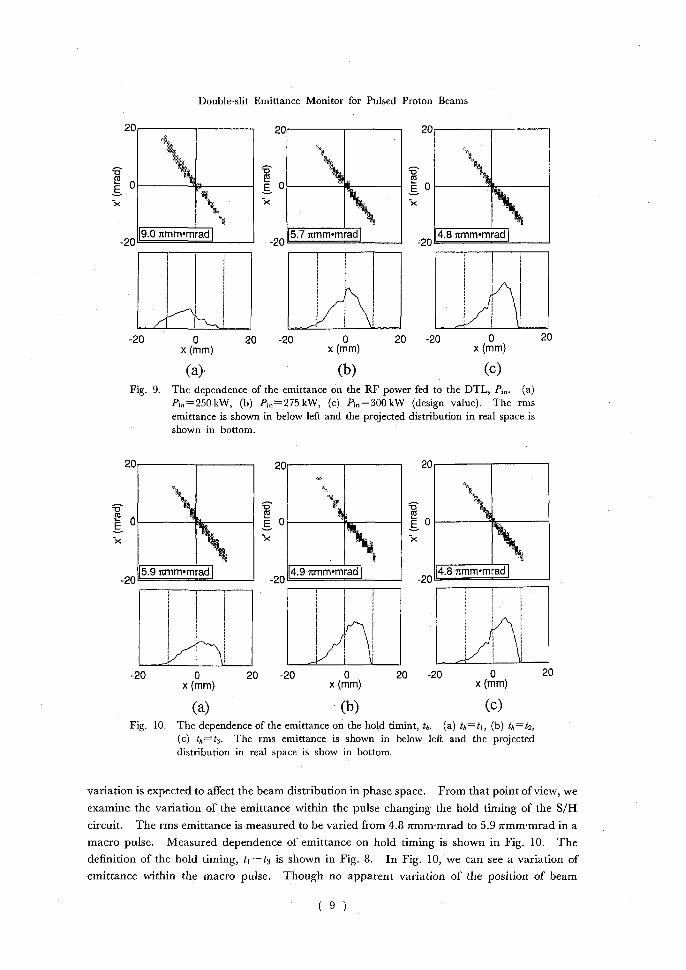
5.1 Dependence on the RF power Changing the RF power fed to the DTL from 250 kW to 300 kW, the rms emittance is
measured to be varied from 4.8 7rmm•mrad to 9.0 7rmm•mrad. Dependence of emittance on the RF power fed to the DTL is shown in Fig. 9. The figure tells us that emittance increases as the RF power is lowered, and at the same time, position of the beam centroid is shifted in phase
space. These shifts can be explained by a displacement of the beam centroid at the entrance of the DTL. Beams having a displacement at the entrance of the DTL are evolved oscillating
around the design orbit under an influence of RF defocusing forces. When the RF power fed to the DTL is lowered, the RF defocusing force decreases and it causes shift of the betatron tune.
Simulations performed with use of the PARMILA code show that about 1 mm displacement of the beam centroid at the entrance of the DTL will cause dependence of beam distribution in the
phase space on the RF power with approximately the same amplitude which is observed at the measurement, but 1 mm displacement is not consistent with the accuracy of the alignment. So, other possibilities such as alignment errors of PMQs (permanent quadrupole magnets) should be checked.
At the measurement, the transmission ratio of the DTL is measured to be —70%. So, the lost part of the beams may be responsible for the change of the measured emittance.
5.2 Variation in the macro pulse At ICR proton linac, beams have macro pulse length of 50 //sec and the RF power fed to the
DTL vary within the pulse. Considering measured results of the previous subsection, this
( 8 )
Double-slit Emittance Monitor for Pulsed Proton Beams
20-----------------------20--------------------20------------------
vve~\464% E0-------------------E0---------------------E0 -------------------------- a,rilifaiii "x
20 19.0 nmm•mrad -2015.7 nmm•mrad l 2014.8 itmm•mrad f
•
-20 0 20 -20 0 20 -20 0 20 x (mm)x (mm)x (mm)
(a),(b)(c) Fig. 9. The dependence of the emittance on the RF power fed to the DTL, P,,,. (a)
Pin =250kW, (b) Pi„=275kW, (c) P; =300kW (design value). The rms emittance is shown in below left and the projected distribution in real space is
shown in bottom.
20-------------------------20--------------------------20-------------------
-oov
EE0------------------E 0---------------------E 0 XX
20 15.9nmm•mrad ~ 2014.9 nmm•mrad l 2014.8 nmm•mrad
-20 020 -200 20 -20 0 20 x (mm)x (mm)x (mm)
(a)(b)(c) Fig. 10. The dependence of the emittance on the hold timint, th. (a) th=tl, (b) th=t2,
(c) th=t3. The rms emittance is shown in below left and the projected distribution in real space is show in bottom.
variation is expected to affect the beam distribution in phase space. From that point of view, we examine the variation of the emittance within the pulse changing the hold timing of the S/H
circuit. The rms emittance is measured to be varied from 4.8 mnm•mrad to 5.9 2rmm•mrad in a macro pulse. Measured dependence of emittance on hold timing is shown in Fig. 10. The
definition of the hold timing, t1—t3 is shown in Fig. 8. In Fig. 10, we can see a variation of emittance within the macro pulse. Though no apparent variation of the position of beam
( 9 )
M. IKEGAMI, et al.
centroid is found, the variation of emittance is relatively large, So, it seems that the variation is
difficult to be explained only by the variation of the RF power within the pulse. We should
examine the dependence of the variation on the RF phase control and other RF parameters.
Because the current amplifier has a time constant of 6,usec, measured emittance should be
considered to be an averaged value over ±3,usec around the hold timing. So, it is difficult to
examine the detailed structre with the current amplifier.
6. SUMMARY
We developed an emittance monitor for beams from the DTL. Dependence of the
emittance on the RF power fed to the DTL and the hold timing of the S/H circuit is measured.
Measured results can be summarized as follows :
1) Beam distribution in phase space is found to have a dependence on the RF power fed to
the DTL. Changing the RF power fed to the DTL from 250 kW to 300 kW, the rms emittance is
measured to be varied from 4.8 7rmm•mrad to 9.0 7rmm•mrad.
2) It is found that there is a variation of the beam distribution in phase space within a macro
pulse. The rms emittance is measured to be varied from 4.8'rmm•mrad to 5.9 7rmm•mrad in a macro pulse.
In future experiments, we plan to measure the emittance growth in the linac quantitatively.
For this purpose, an emittance monitor to measure the emittance at the exit of the ion source is
now under development.
REFERENCES
(1) M. Kando, et al., "Improvement of the Low Energy Beam Transport System at the ICR 7 MeV Proton Linac", Procs. of the 17th International Linac Conference, Tsukuba (1994) (in print).
(2) M. Ikegami, et al., "Emittance Measurement at the ICR 7 MeV Proton Linac", Procs. of the 17th International Linac Conference, Tsukuba (1994) (in print).
(3) M. Ikegami, master thesis (unpublished). (4) M. Ikegami, et al., "Emittance Measurement system for 7 MeV Proton Linac", Procs. of the 18th Linear
Accelerator Meeting in Japan, Tsukuba, pp. 118-122, (1993). (5) Y. Iwashita, et al., "The Monitor System of the 7 MeV Proton Linac at ICR", Procs. of the Beam
Instrumentations Workshop, Vancouver (1994) (in print).
• ( 10 )