Embed Size (px)
Citation preview
364
Tissue Osmolality, Cell Swelling, andReperfusion in Acute Regional Myocardial
Ischemia in the Isolated Porcine Heart
JQRGEN TRANUM-JENSEN, MICHIEL J. JANSE, JAN W.T. FIOLET, WILLEM J.G. KRIEGER,
CHRISTOPH NAUMANN D'ALNONCOURT, AND DIRK DURRER
SUMMARY We divised a method to determine tissue osmolality in intact beating hearts. Afterocclusion of the left anterior descending coronary artery (LAD) of isolated porcine hearts, tissueosmolality in the ischemic myocardium increased within 50 minutes by about 40 mOsm/kg. This rise inosmolality could be accounted for by metabolic processes, notably the conversion of glycogen intolactate, and the hydrolysis of high energy phosphates. Concomitant with the rise in osmolality, theischemic myocardium during the 1-hour period of LAD occlusion took up fluid and increased tistuewater volume by an average of 16.5%. We demonstrated that the osmolality of fixatives used formorphological studies markedly influences ischemic cell morphology. Thus, normotonic fixation of theischemic myocardium accentuates cell swelling, whereas nearly normal cell volumes result fromhypertonic fixation, adjusted according to the rise hi ischemic tissue osmolality. Normotonic reperfusionof the ischemic area after 1 hour of LAD occlusion resulted in the "no-refiow" phenomenon in themldmural and subendocardial regions. Epicardial and intramural DC-electrograms showed persistentischemic changes, i.e., T-Q depression, S-T elevation, and monophasic potentials. Tissue resistivity,which during ischemia had risen twofold, remained high. Lacate levels remained high, creatine-phosphate (CP) and adenosinetriphosphate (ATP) levels remained low. Selective hypertonic reperfusionof the LAD, followed by a gradual return to normotonic perfnsion, resulted in a normalization of DCextracellular elcctrograms, restoration of electrical resistivity to near normal, low levels of lactate,and higher levels of CP and ATP although control values were not reached. Cell morphology wascorrespondingly normalized following this procedure. We conclude that ischemic cells become hyper-osmotic and consequently take up additional fluid when exposed to normotonic blood. This increasedcell swelling compresses capillaries, prevents reperfusion, and may be a major factor in causingreperfusion damage. This damage can be prevented to a large extent by selective hypertonic reperfu-sion. Circ Res 49: 364-381, 1881
SWELLING of cells and cell organelles is recog-nized as an important pathogenic factor in ischemicdisease, be it in brain (Ames et al., 1968), kidney(Flores et al., 1972), or heart (Leaf, 1970). A directdamage due to membrane distension, loss of perme-ability characteristics, and, ultimately, membranerupture may be accompanied by indirect damagedue to compression of the microvasculaturewhereby residual flow and reperfusion, if any, isrestrained.
The mechanisms underlying the swelling phe-nomena are, however, less well identified. A basicconcept, applicable to problems of volume regula-tion in most soft mammalian tissues, is that depar-tures from osmotic equilibrium between intra- andextracellular compartments will exist only as shorttransients because water ie rapidly displaceable
From the Department of Cardiology and Clinical Physiology Univer-sity of Amsterdam, Wilhelmina Gaslhuis, Amsterdam, the InteruniversityCardiological Institute. The Netherlands; and Anatomy Department C,The Pinum Institute, University of Copenhagen, Denmark.
Supported by the Wijnarrd Pon Foundation.Address for reprints. Michiel J Janse, M.D., Department of Cardiol-
ogy and Clinical Physiology, Wilhelmina Gasthuis, Eerate HelmeruLraat104, 1064 EG Amsterdam, The Netherlands.
Received February 19,1980; accepted for publication February 2,1381.
across cell membranes (Dick, 1966,1970), and thesecannot in general carry hydrostatic pressure differ-ences of any significant magnitude. Thus, underphysiologically relevant conditions, swelling of acell or a membrane-bound organelle implies thatthe net sum of osmotic effectors, confined by themembrane—allowing for their osmotic coeffi-cients—has increased relative to that of the sur-roundings. In ischemia, at least two mechanismsmay contribute to this effect. First, depletion ofenergy stores and consequent failure of active mem-brane transport progressively leads to equilibriumof small molecules—notably Na+, K+, and CP1—across the cell membrane. Hereby a Gibbs-Donnanequilibrium, governed by the higher intracellularconcentration of proteins, is approached. Conse-quently the cell undergoes (colloid osmotic) swell-ing (Leaf, 1959; Tosteson and Hoffman, 1960; Ro-rive and Gilles, 1979). A second mechanism of cellswelling, pertinent to ischemic tissue, is the intra-cellular production of new osmotic effectors by met-abolic conversion of osmotically less active largermolecular species. The possible contribution of thislatter mechanism to ischemic cell swelling has re-ceived comparatively less attention, although it has
by guest on July 9, 2018http://circres.ahajournals.org/
Dow
nloaded from
TISSUE OSMOLALITY IN MYOCARDIAL ISCKEMIA/Tranum-Jensen et al. 365
long been known that anaerobic metabolic pro-cesses may produce a rapid and substantial increasein tissue osmolality (Conway et al., 1955; Mafflyand Leaf, 1959).
In the present study we report quantitative dataon the increase in tissue osmolality in acute regionalmyocardial ischemia, accounted for by productionof osmotically active particles through anaerobicmetabolism. Furthermore, the importance of os-motic phenomena in histological evaluation of is-chemic cell damage is shown. Finally, it is demon-strated that successful reperfusion of ischemic my-ocardium depends on the osmolality of the perfu-sate.
MethodsPigs weighing 20-25 kg were premedicated with
atropine (0.012 mg/kg, im) and Stresnil (R 1929azaperone, 12 mg/kg im), then anesthetized withHypnodil (R 8315, metomidatum 4 mg/kg, iv) andsodium pentobarbital (15 mg/kg, iv). A midsternalincision was made, and blood was collected via acatheter in the superior caval vein after iv admin-istration of 5000 I.U. of heparin. Pig plasma osmo-lality was determined by the vapor pressure method(see below) on the first blood drawn from the cath-eter. During collection of blood, 1 liter of modifiedTyrode's solution was infused via a femoral vein tokeep the circulating volume constant. The compo-sition of this modified Tyrode's solution was (mM):Na+, 156.5; K+, 4.7; Ca2+, 1.5; Mg2+, 0.7; H2PO4~ 0.5;Cl~, 137.0; HCO3", 28; glucose, 20.0; heparin, 5250I.U./liter; insulin, 10 U/liter; dextran (macrodex,MW 70.000) 60, g/liter. By this procedure of intra-corporal mixing, a total of 1500 ml blood-Tyrode'smixture was obtained, in which the hemoglobincontent was around half that of the undiluted blood.(Average Hb of mixture was 3.3, average Hb of pigblood was 6.4 mmol/liter.) Ventricular fibrillationwas induced by a small DC current to preventmyocardial air embolism during excision of theheart. The heart was rapidly connected to a Lan-gendorff system and perfused with the blood-Ty-rode's mixture thermostated at 37°C. In one exper-iment a thermistor probe was inserted into themyocardium to assure a myocardial temperature of37°C. The pH and the aortic flow of perfused fluidwas monitored constantly and regulated to withinpH 7.30-7.35, and 150-160 ml/min, respectively.Details of the perfusion system can be found else-where (Downar et al., 1977).
Intramural electrodes and "osmodes" (see below)were inserted into the left ventricle. The heart thenwas defibrillated and paced from the atrium at abasic cycle length of 450 msec (133 beats/min).
Electrophysiological MethodsDC extracellular electrograms were recorded
from epicardial and intramural sites. The electrodeshave been described previously (Janse et al., 1979)
and consisted in principle of thin polyethylene tubesfilled with isotonic saline and cotton wicks. Theywere constructed in such a way that, at one location,the DC potential of the extracellular space at thesubepicardium and at intramural sites 4 mm and 8mm below the epicardial surface were recorded.Intramural tissue resistivity was measured accord-ing to the method described by van Oosterom et al.(1979). Multiterminal electrode needles containing20 terminals were introduced into the left ventric-ular wall. The method used is the "four-pointmethod," the four points being successive terminalson the intramural needle. Alternating current (10juA peak, frequency 1000 Hz) is passed through theouter two terminals and potential difference acrossthe inner two electrodes is measured. By use of amultiswitch, the sequence of four points can beselected along the entire multiterminal needle sothat resistivity can be measured at 17 differentlevels. Before each experiment, we calibrated eachneedle by submerging the needle in a large con-tainer holding a solution of known resistivity andby relating the measured voltage to the knownimpressed current.
Biochemical MethodsA hollow cylindrical drill (internal diameter 4
mm) was used to obtain transmural tissue biopsies.For the determination of tissue levels of adenosi-netriphosphate (ATP), creatine phosphate (CP),lactate, glycogen, and glucose-6-phosphate, biopsieswere, within seconds after drilling, plunged intoliquid nitrogen and, later, freeze dried. ATP, CP,and lactate were determined according to standardmethods (Lamprecht et al., 1970) and expressed as/imol/g dry weight. Tissue glycogen content wasdetermined as total glucose after complete hydrol-ysis with a-amylase and amyloglucosidase. To thisend, the freeze-dried biopsy was homogenized in 4%perchloric acid, brought to pH 4.8 with acetatebuffer, and incubated for 2 hours at 30 °C with a-amylase plus amyloglucosidase. After centrifuga-tion, the supernatant was assayed for glucose witha commercial kit (Merck, Darmstadt, prod. nr.3389) and corrected for glucose content presentbefore hydrolysis.
For determination of the wet weight: dry weightratios, and for tissue levels of sodium and potas-sium, drilled biopsies were rolled once on filterpaper without applying pressure and immediatelysealed in preweighed tubes. Wet weight was thenmeasured and the biopsy was freeze dried. Sodiumand potassium were determined by flame photom-etry. Statistical analysis was performed using Stu-dent's t-teat.
Measurement of the Tissue Osmolality of theIntact Left Ventricle
To determine tissue osmolality, we developed adevice which, for want of a better word, will be
by guest on July 9, 2018http://circres.ahajournals.org/
Dow
nloaded from
366 CIRCULATION RESEARCH VOL. 49, No. 2 AUGUST 1981
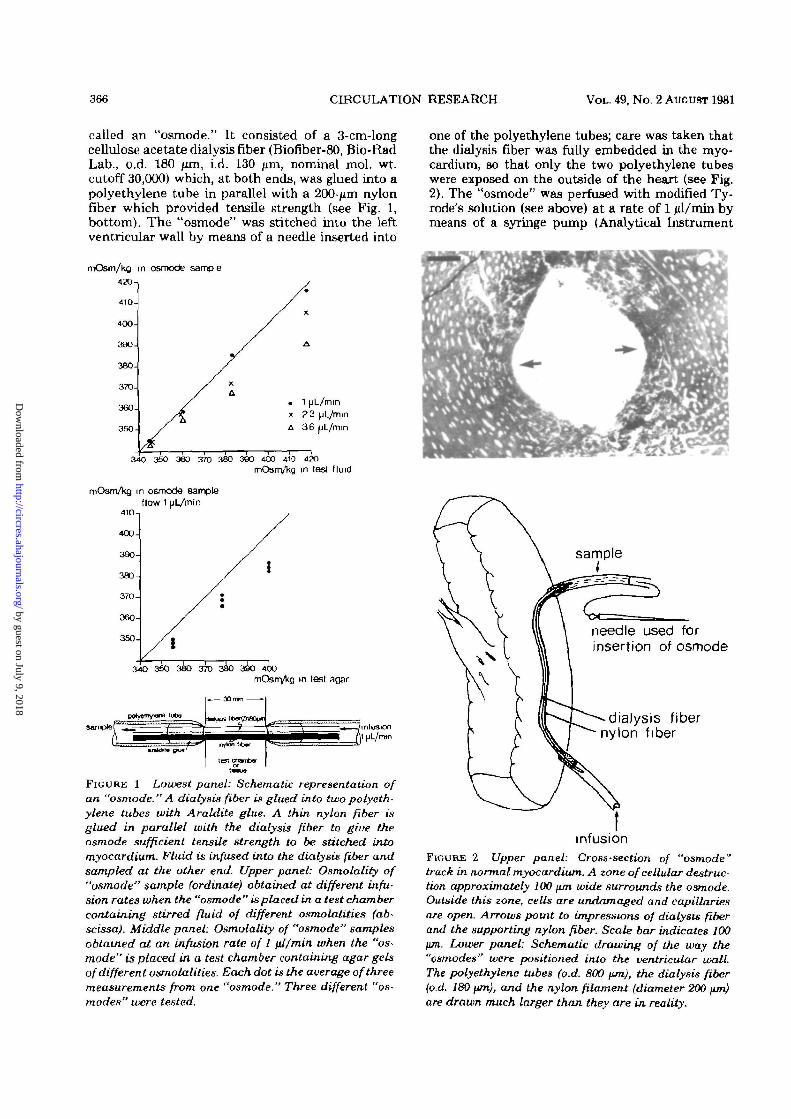
called an "osmode." It consisted of a 3-cm-longcellulose acetate dialysis fiber (Biofiber-80, Bio-RadLab., o.d. 180 nm, i.d. 130 /am, nominal mol. wt.cutoff 30,000) which, at both ends, was glued into apolyethylene tube in parallel with a 200-jim nylonfiber which provided tensile strength (see Fig. 1,bottom). The "osmode" was stitched into the leftventricular wall by means of a needle inserted into
mOsm/ka in osmode sample
*2O-,
410-
400-
390-
380-
370-
; S ° '• x 23HL/mm
350-1 / A 36 |
340 350 360 370 380 390 400 410 420mO3nVkg in test fluid
mOsm/kg in osmode sampleflow 1 uL/min
410-.
400-
380-
380
370-
360-
350-
340 360 350 370 3 &0 400mOsnykg in test agar
aampte'
FIGURE 1 Lowest panel: Schematic representation ofan "osmode." A dialysis fiber is glued into two polyeth-ylene tubes with Araldite glue. A thin nylon fiber isglued in parallel with the dialysis fiber to giue theosmode sufficient tensile strength to be stitched intomyocardium. Fluid is infused into the dialysis fiber andsampled at the other end. Upper panel: Osmolality of"osmode" sample (ordinate) obtained at different infu-sion rates when the "osmode" is placed in a test chambercontaining stirred fluid of different osmolalities (ab-scissa). Middle panel: Osmolality of "osmode" samplesobtained at an infusion rate of I \dlmin when the "os-mode" is placed in a test chamber containing agar gelsof different osmolalities. Each dot is the average of threemeasurements from one "osmode." Three different "os-modes" were tested.
one of the polyethylene tubes; care was taken thatthe dialysis fiber was fully embedded in the myo-cardium, BO that only the two polyethylene tubeswere exposed on the outside of the heart (see Fig.2). The "osmode" was perfused with modified Ty-rode's solution (see above) at a rate of 1 jd/min bymeans of a syringe pump (Analytical Instrument
needle used forinsertion of osmode
dialysis fibernylon fiber
infusionFIGURE 2 Upper panel: Cross-section of "osmode"track in normal myocardium. A zone of cellular destruc-tion approximately 100 fim wide surrounds the osmode.Outside this zone, cells are undamaged and capillariesare open. Arrows point to impressions of dialysis fiberand the supporting nylon fiber. Scale bar indicates 100jim. Lower panel: Schematic drawing of the way the"osmodes" were positioned into the ventricular wall.The polyethylene tubes (o.d. 800 fun), the dialysis fiber(o.d. 180 \tm), and the nylon filament (diameter 200 \un)are drawn much larger than they are in reality.
by guest on July 9, 2018http://circres.ahajournals.org/
Dow
nloaded from
TISSUE OSMOLALITY IN MYOCARDIAL ISCHEMIA/Tranum-Jensen et al. 367
Specialities) attached to one of the polyethylenetubes. A volume of 10 ̂ il was infused over a periodof 10 minutes. The fluid, having passed the dialysisfiber, accumulated in the other polyethylene tube.This fluid was aspired into a Hamilton syringe witha needle fitting loosely into the polyethylene tube.The osmolality of this sample was determined in aWescor vapor pressure osmometer (type 5100 B),calibrated with 0.1566 and 0.5514 molal NcCl asstandards of 290 and 1000 mOsm/kg, respectively.
The accuracy of the method was assessed in twoways. First, "osmodes" were passed through a ther-mostated (37 °C) chamber containing stirred solu-tions of different osmolalities, varying from 330 to420 mOsm/kg. The osmolality was varied by addi-tion of dZ-sodium lactate to the modified Tyrode'ssolution. The "osmodes" were perfused with Ty-rode's solution at different rates to determine themaximum perfusion rate which allowed osmoticequilibrium between perfusate and surroundingfluid to be established. This rate was in the order of3 jd/min, when the osmolality of the surroundingfluid was between 330 and 360 mOsm/kg (see Fig.1, upper graph). At higher osmolalities, a slowerperfusion rate was required. To ensure a margin ofsafety, we chose a standard perfusion rate of 1 ul/min. We performed a second test by inserting the"osmodes" in 4% agar gels, prepared from solutionsof different osmolalities, according to variations inlactate concentration. The gels were thermostatedat 37°C during measurements. The osmolality ofthe gel fluid was measured on fluid collected in awell cast in the gel. As shown in Figure 1, lowergraph, the osmolalities of the "osmode" samplesdeviate from those of the surrounding agar by 2 to4%. (Each dot indicates the average of three mea-surements from each of three different osmodestested at three different osmolalities.)
After collection of preocclusion baseline samplesfrom the contracting left ventricle, regional is-chemia was produced by clamping the left anteriordescending coronary artery (LAD) for periods of 50to 70 minutes. During occlusion, osmode sampleswere collected at varying times after occlusion (seeFig. 3). Each sampling period lasted 10 minutes. Inthree preliminary experiments, three osmodes wereinserted in parallel, 5 mm apart, in the centralischemic region. One osmode was perfused inter-mittantly with a 10-minute pause between samplingperiods. Perfusion of the second and third osmodewas initiated simultaneously with the second andthird perfusion of the first osmode. In this way, itwas found that the osmolality of samples drawnintermittently from one osmode did not differ sys-tematically from samples drawn after the first per-fusion of another osmode. Tissue damage producedby insertion of osmodes was evaluated from biopsiescut across the osmode tracks following fixation ofthe hearts. It was found that a zone of destroyedcells of about 100 /un width surrounded the osmode(see Fig. 2). In most experiments, two osmodes were
gQ re*a1i\e to perfuson fluid1 at start of LAD occlusion
0 LAD aieax normal myocardium1 perlusoi fluid
4 0 -
30-
'Jt ' .
10 20 30 40 50 60 TOmm post occiusiOn
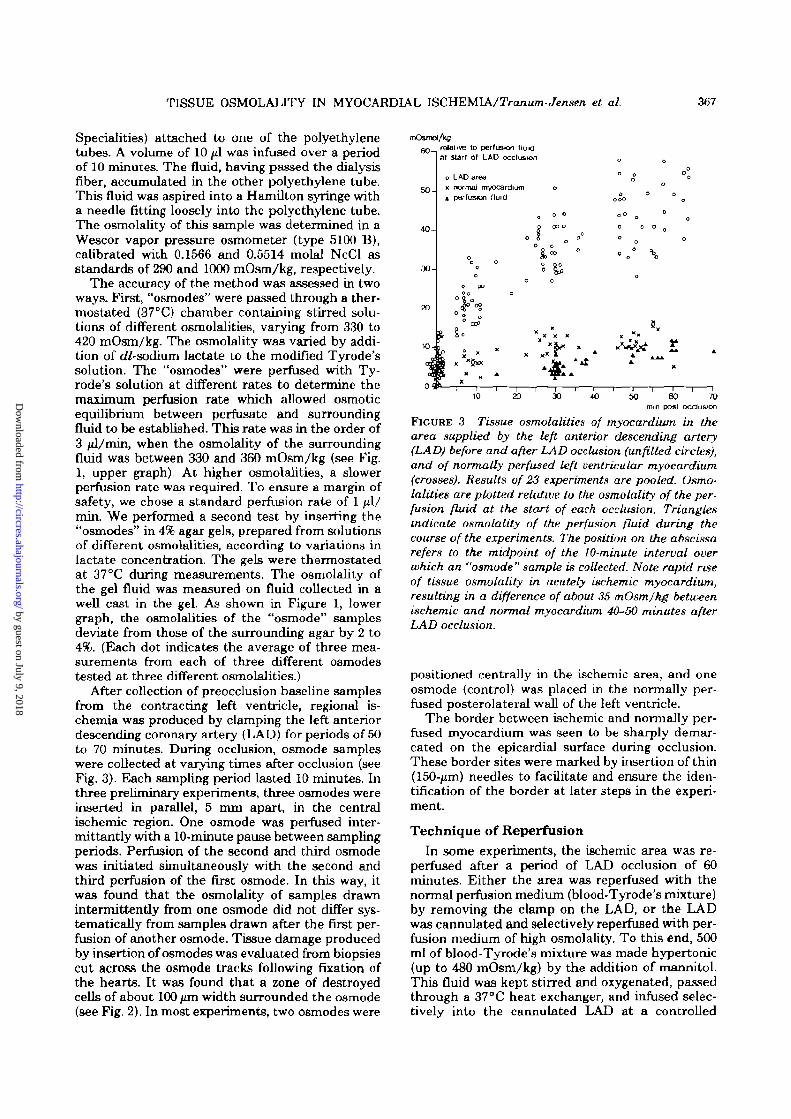
FIGURE 3 Tissue osmolalities of myocardium in thearea supplied by the left anterior descending artery(LAD) before and after LAD occlusion (unfilled circles),and of normally perfused left ventricular myocardium(crosses). Results of 23 experiments are pooled. Osmo-lalities are plotted relative to the osmolality of the per-fusion fluid at the start of each occlusion. Trianglesindicate osmolality of the perfusion fluid during thecourse of the experiments. The position on the abscissarefers to the midpoint of the 10-minute interval overwhich an "osmode" sample is collected. Note rapid riseof tissue osmolality in acutely ischemic myocardium,resulting in a difference of about 36 mOsmJkg betweenischemic and normal myocardium 40-50 minutes afterLAD occlusion.
positioned centrally in the ischemic area, and oneosmode (control) was placed in the normally per-fused posterolateral wall of the left ventricle.
The border between ischemic and normally per-fused myocardium was seen to be sharply demar-cated on the epicardial surface during occlusion.These border sites were marked by insertion of thin(150-jum) needles to facilitate and ensure the iden-tification of the border at later steps in the experi-ment.
Technique of ReperfusionIn some experiments, the ischemic area was re-
perfused after a period of LAD occlusion of 60minutes. Either the area was reperfused with thenormal perfusion medium (blood-Tyrode's mixture)by removing the clamp on the LAD, or the LADwas cannulated and selectively reperfused with per-fusion medium of high osmolality. To this end, 500ml of blood-Tyrode's mixture was made hypertonic(up to 480 mOsm/kg) by the addition of mannitol.This fluid was kept stirred and oxygenated, passedthrough a 37°C heat exchanger, and infused selec-tively into the cannulated LAD at a controlled
by guest on July 9, 2018http://circres.ahajournals.org/
Dow
nloaded from

368 CIRCULATION RESEARCH VOL. 49, No. 2 AUGUST 1981
constant pressure equal to the perfusion pressure inthe aorta.
During hypertonic LAD perfusion, the first 500ml of perfusate emerging from the right atrium andventricle were collected in order to prevent majorhypertonic contamination of the normotonic per-fusion fluid supplying the rest of the heart. Thetonicity of the LAD perfusate was lowered gradu-ally to normal levels by addition of normal perfusionmedium to the stirred reservoir feeding the LAD.Generally, within 15-20 minutes of selective LADperfusion, the osmolality had returned to normallevels. After an additional 10- to 15-minute periodof perfusion at normal levels, the experiment wasconcluded.
Morphological MethodsAt various stages after coronary artery occlusion,
the hearts were fixed for morphological studies. Thefixative used was 2% glutaraldehyde contained in avehicle of 110 mmol/liter sodium phosphate buffer,pH 7.2, and 6% wt/vol dextran T-70 (Pharmacia).The osmolality of the fixative vehicle was varied byaddition of D-mannitol. The standard normotonicfixative used for fixation after 1 hour of LAD occlu-sion contained 60 mmol/liter of mannitol to achievean osmolality of this vehicle of 312 mOsm/kg. Forhypertonic fixations, mannitol was added to achievetonicities of the fixative vehicle of 372 and 400mOsm/kg. One liter of fixative was introduced intothe heart through a side arm of the aortic cannulaso that fixative was fed into the coronary arteriesat an aortic pressure of 150 cm H2O. This fixationpressure was chosen to be 50-80 cm H2O higherthan the perfusion pressure during the experimentto ensure adequate fixation during all perfusionconditions. At the moment of fixation, the clamp onthe LAD was removed. The heart thus fixed wasleft overnight in the fixative at 4°C. The heart thenwas sliced transversely into 3- to 4-mm slabs. Non-ischemic myocardium was always found uniformlyfixed, and showed a brownish-yellow color and hardconsistency. Fixed ischemic tissue displayed a sim-ilar hard consistency, but showed a different color,usually lighter, depending on the osmolality of thefixative and the conditions of reperfusion, if applied(see below).
The ischemic border, taking as initial landmarkone of the needles inserted at the visible border onthe epicardium during occlusion, always could beclearly traced transmurally by these color differ-ences. Also, in experiments with successful reper-fusion, slight but well-defined color differences per-mitted tracing of the previous ischemic border.Likewise, color differences permitted identificationof nonperfused tissue. Patches of unfixed (soft)tissue were found in the ischemic area of somehearts. This was the case particularly when thehearts were fixed following normotonic reperfusion.
In reperfusion experiments, the volume ratio of
reperfused to total (original) ischemic area wasestimated by drawing the outline of the originallyischemic tissue together with the outlines of non-reperfused tissue on transparent acetate foil (14mg/cm2) for each of the slabs cut transverselythrough the ischemic region. After the foil was cut,the volume ratio was estimated as the weight ratioof foil covering reperfused tissue to the foil coveringthe whole of the ischemic area.
Small blocks (1-2 mm3) were cut from the slabsat two different sites in the fixed ischemic and inthe nonischemic myocardium at three differentdepths at each site, viz., subepicardially, midmur-ally, and subendocardially. Blocks from ischemictissue were cut well away from the ischemic borderand close to an intramural recording electrode toensure that the tissue was representative of is-chemic myocardium. The blocks were transferredto Na-phosphate buffer (110 mmol/liter, pH 7.2)through a slow and continuous gradient proceduredescribed elsewhere (Rostgaard and Tranum-Jen-sen, 1980). The blocks were postfixed in 2% Os(X, in110 mmol/liter phosphate buffer for 2 hours atroom temperature and washed three times in thebuffer, followed by dehydration and infiltrationwith Epon by a continuous procedure (Rostgaardand Tranum-Jensen, 1980). Sections 2 /xm thickwere cut on glass knives and stained with p-phen-ylendiamin or toluidin blue for light microscopy.Only tissue exhibiting uniformly open and emptycapillaries, indicating that fixative had flushed thevascular bed, was accepted in the material. Ultra-thin sections were prepared with a diamond knifeand stained with uranyl acetate and lead citrate forelectron microscopy.
To obtain a quantitative estimate of differencesin myocardial cell volume in the different groupsand between normal and ischemic myocardium inindividaul hearts, we measured cell diameters atthe nuclear level in 2-/un sections of blocks cut 3-4mm below the epicardial surface. Measurementswere performed on one section of each of two blockstaken at different sites in the ischemic zone andsimilarly on two blocks taken from the normalmyocardium. The sections were scanned systemat-ically at a magnification of 625:1 and the smallestdiameter across nuclei was measured using an ocu-lar screw micrometer (Leitz) calibrated with a pre-cision object micrometer (Leitz). Fifty cell diame-ters were measured in each section to give a total of100 measurements on ischemic and 100 measure-ments on normal myocardium in each heart.
Results
Changes in Tissue Osmolality during RegionalIschemia
Figure 3 shows measurements of tissue osmolal-ity in ischemic and normal myocardium at varioustimes after LAD occlusion. The results of 23 exper-
by guest on July 9, 2018http://circres.ahajournals.org/
Dow
nloaded from
TISSUE OSMOLALTTY IN MYOCARDIAL ISCHEMIA/Tranum-Jensen et al. 369
imente are pooled. The position on the abscissaindicates the midpoint of the 10-minute intervalduring which a sample was collected from an os-mode. Tissue osmolalities are plotted relative to theosmolality of the perfusion medium at the beginningof the occlusion. The osmolality of plasma takenfrom 23 pigs was 303 ± 2 mOsm/kg. Numericalfigures here and elsewhere in the text are given asthe arithmic mean ± 2x standard error of the mean(SEM). Average osmolality of the blood-Tyrode'smixture used to perfuse the hearts was 313 ± 2.5mOsm/kg at the start of perfusion. As can be seen,with time, the osmolality of the perfusion fluidincreased, as did the osmolality of the normal my-ocardium. This increase is due mainly to evapora-tion from the fierfusion system during the experi-ment. At the start of occlusion, the osmolality ofthe perfusion fluid was 319.2 ± 2.5 mOsmAg, thetissue osmolality in the future ischemic myocar-dium was 325.7 ± 2.7, and that in the posterolateralwall of the left ventricle 324.6 ± 2.6 mOsm/kg. It isevident that tissue osmolality in the ischemic regionquickly rose above normal to reach a level of 360.4±3.1 mOsm/kg 45-60 minutes after coronary arteryocclusion. At this time the tissue osmolality of thenormal myocardium was 330.4 ± 3.4 mOsm/kg.Based on the testing procedure in agar-gels, weestimated that our method underestimated truetissue osmolalities in the higher range by 5-8mOsm/kg. Thus, relative to the start of occlusion,osmolality in the ischemic area had risen by roughly40 mOsm/kg (360.4 - 325.7 + (5 to 8) after 45-60minutes of LAD occlusion. At this time a differenceof roughly 35 mOsm/kg existed between ischemicand normal myocardium.
Changes in Tissue Hydration and Na+, K+,ATP, CP, Lactate, and Glycogen Content
In four experiments the wet weight: dry weightratios and tissue content of Na+ and K+ were deter-mined in each biopsy taken after 60 minutes ofLAD occlusion from the central ischemic area andfrom the normal myocardium. In the central is-chemic area, the mean wet weightdry weight ratiowas 4.74 ± 0.10 (24 biopsies), whereas in normalmyocardium this ratio was 4.21 ± 0.10 (21 biopsies)(Fig. 4, lower panel), the difference being significant(P < 0.01). It follows that the volume of total tissuewater per gram dry weight in normal myocardiumis 3.21 ml. The increase of 0.53 ml in ischemicmyocardium thus amounts to a 16.5% (0.53/3.21)increase in tissue water volume.
The mean Na+ contents of ischemic and normalmyocardium were 263.9 ± 12.5 and 239.9 ± 10.5/imol/g dry weight, respectively. This difference wassignificant (P < 0.01). The K+ content was 415.6 ±6.9 in ischemic tissue and 410.7 ± 12.4 in normalmyocardium (no significant difference). Thus, therewas a gain in Na+ content in ischemic myocardium
'"nvnoleVL tissue '
140-
130-
120-
110-
100-
o o
o o oi• i3chennc myocardiumo normal
—i 1 F 1 1 1SO 60 70 80 90 100 Na+ mmoles/L tissue water
35 45
I50 wet wei^it/dry weight ratio
4 2 1 1 0 1 0 4.7410.10 (average tlxSEW)
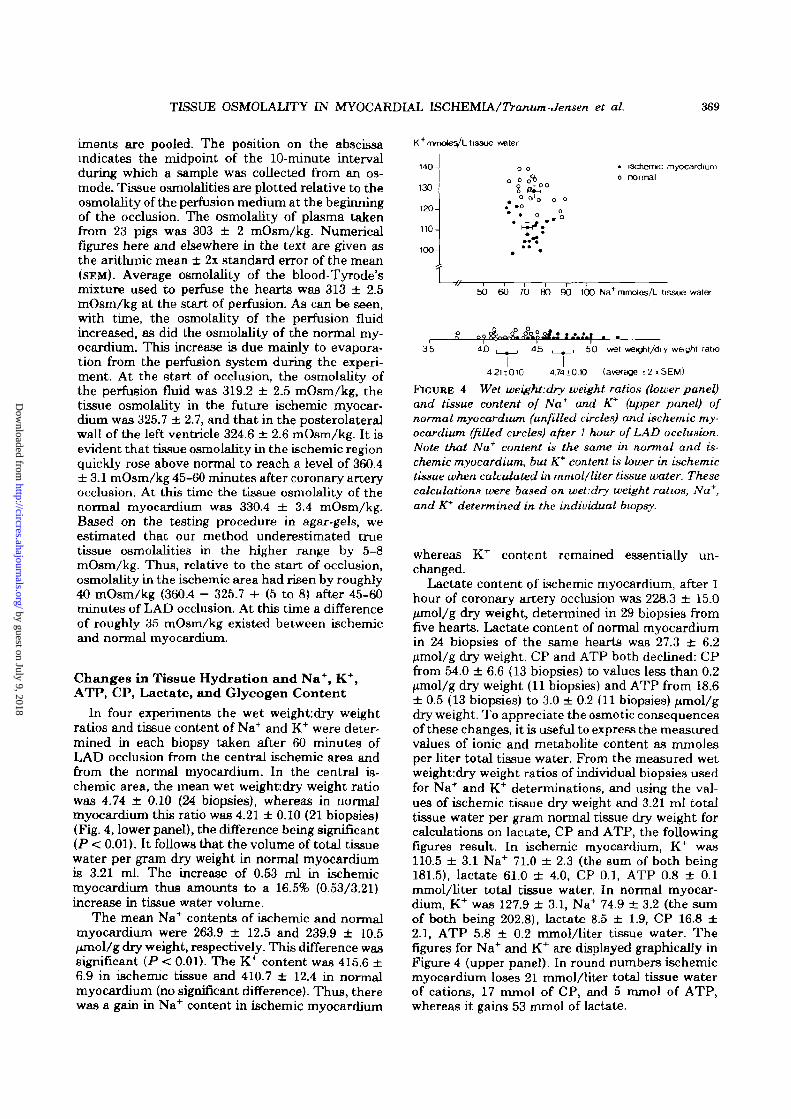
FIGURE 4 Wet weight.dry weight ratios (lower panel)and tissue content of Na+ and K* (upper panel) ofnormal myocardium (unfilled circles) and ischemic my-ocardium, (filled circles) after 1 hour of LAD occlusion.Note that Na* content is the same in normal and is-chemic myocardium, but K+ content is lower in ischemictissue when calculated in mmol/liter tissue water. Thesecalculations were based on wet:dry weight ratios, Na+,and K+ determined in the individual biopsy.
whereas K+ content remained essentially un-changed.
Lactate content of ischemic myocardium, after 1hour of coronary artery occlusion was 228.3 ± 15.0/xmol/g dry weight, determined in 29 biopsies fromfive hearts. Lactate content of normal myocardiumin 24 biopsies of the same hearts was 27.3 ± 6.2lumol/g dry weight. CP and ATP both declined: CPfrom 54.0 ± 6.6 (13 biopsies) to values less than 0.2fxmol/g dry weight (11 biopsies) and ATP from 18.6± 0.5 (13 biopsies) to 3.0 ± 0.2 (11 biopsies) /xmol/gdry weight. To appreciate the osmotic consequencesof these changes, it is useful to express the measuredvalues of ionic and metabolite content as mmolesper liter total tissue water. From the measured wetweight:dry weight ratios of individual biopsies usedfor Na+ and K+ determinations, and using the val-ues of ischemic tissue dry weight and 3.21 ml totaltissue water per gram normal tissue dry weight forcalculations on lactate, CP and ATP, the followingfigures result. In ischemic myocardium, K was110.5 ± 3.1 Na 71.0 ± 2.3 (the sum of both being181.5), lactate 61.0 ± 4.0, CP 0.1, ATP 0.8 ± 0.1mmol/liter total tissue water. In normal myocar-dium, K was 127.9 ± 3.1, Na 74.9 ± 3.2 (the sumof both being 202.8), lactate 8.5 ± 1.9, CP 16.8 ±2.1, ATP 5.8 ± 0.2 mmol/liter tissue water. Thefigures for Na and K are displayed graphically inFigure 4 (upper panel). In round numbers ischemicmyocardium loses 21 mmol/liter total tissue waterof cations, 17 mmol of CP, and 5 mmol of ATP,whereas it gains 53 mmol of lactate.
by guest on July 9, 2018http://circres.ahajournals.org/
Dow
nloaded from
370 CIRCULATION RESEARCH VOL. 49, No. 2 AUGUST 1981
In two experiments, total glucose (glycogen +free glucose) was determined from biopsies takenimmediately before occlusion of the LAD. Averagevalues were 148.1 ± 8.7 {n = 8) junol/g dry weight.After 1 hour of LAD occlusion, total residual glu-cose was 20.3 ± 5.4 (n = 11). In the same biopsies,the change in lactate was found to be from 19.7 ±5.8 before the occlusion to 262.3 + 21.8 /imol/g dryweight after the occlusion. Thus, the increase inlactate of 243 /^mol/g dry weight corresponded wellto the 128 /unol/g dry weight of glucose residueswhich disappeared. This, together with the K+ fig-ures given above, indicates that little washout oc-curs in the central ischemic area during the 1-hourperiod of occlusion. It should be stated here thatbiopsies taken from normal myocardium at the endof the experiment had a glycogen content that wasnearly twice as high as in biopsies from normalmyocardium taken at the beginning of the experi-ment. This indicates that, during the perfusion withblood-Tyrode's mixture containing at least 10 mmolof glucose per liter, the normally perfused cellsaccumulated glycogen.
Influence of Osmolality of the Fixative onCell Morphology
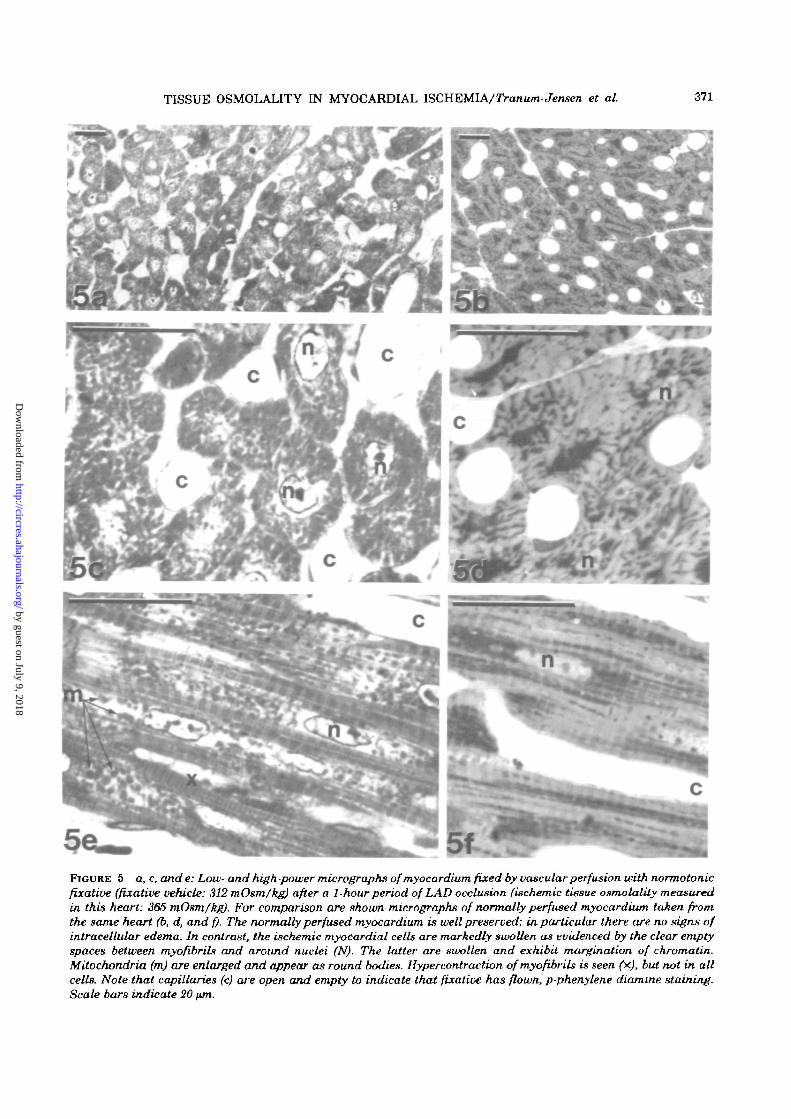
When ischemic myocardium is exposed to a fix-ative, which is isotonic with respect to normal my-ocardium, the ischemic cells may be expected totake up water from the relatively hypo-osmoticfixative. We have tried to assess such artificialswelling phenomena by fixing ischemic myocardiumat different osmolalities. In these studies, only suchtissue was considered that exhibited open, emptycapillaries, indicating that fixative had flushed thecapillary bed. This was intended to ensure uniformconditions of exposure to the fixative. Figure 5shows photomicrographs of ischemic and normalmyocardium fixed 1 hour after occlusion of the LADwith a fixative that was normotonic with respect tonormal myocardium (osmolality of the fixative ve-hicle 312 mOsm/kg). Under these conditions, amarked intracellular edema was observed in theischemic cells, as is evident from the clear emptyspaces around the nuclei and the separation ofmyofibrils. Myocardial cell nuclei are extremelyswollen and exhibit marginal condensation of chro-matin. Figure 6 depicts the histological appearanceof ischemic and normal myocardium from a hearttreated identically to that of Figure 5 except thatthe fixative was hypertonic. This particular heartdeveloped an osmolality in the ischemic area of 372mOsm/kg, and the fixative was adjusted by theaddition of mannitol to achieve an osmolality of thevehicle identical to the tissue osmolality. Underthese conditions the intracellular edema was muchless pronounced. Cell nuclei also are less swollen,but do exhibit a distinct margination of chromatin.As expected, the normal myocardium of the hyper-
tonically fixed heart is shrunken, compared to thenormotonically fixed normal myocardium.
To obtain a quantitative estimate of cell size, wemeasured cell diameters across cell nuclei in is-chemic and normal myocardium in three pairs ofhearts fixed at fixative vehicle tonicities of 312, 372,and 400 mOsm/kg, respectively. The results aresummarized in Table 1. Cell diameters in ischemicmyocardium decrease with increasing fixative to-nicity. Ischemic cell diameters of any of the twohearts fixed at 312 mOsm/kg differ significantly (P< 0.01) from any heart in the other two pairs. Innormal myocardium, no further shrinkage is de-tected between 372 and 400 mOsm/kg, indicatingthat the cells have approached a maximally shrun-ken state already at 372 mOsm/kg. At all tonicities,the ischemic cell diameters are significantly (P <0.001) larger than the non-ischemic cell diametersin the same heart. At the high tonicities, the is-chemic cells exhibit diameters found in normal my-ocardium by normotonic fixation.
In Figure 7, electron micrographs of normotoni-cally and hypertonically fixed ischemic myocardium(1 hour after LAD occlusion, corresponding to Figs.5 and 6) are shown. In both cases the mitochondriaare swollen, with distinct cristae in a clear matrix,though most pronounced in the first case. Cellnuclei exhibit, in both cases, a distinct marginationof chromatin. However, in the normotonically fixedheart, the degree of intracellular edema is distinctlygreater than in the hypertonically fixed ischemicmyocardium. As expected, in both cases glycogenstores Eire depleted.
Normotonic and Hypertonic ReperfusionReperfusion of an ischemic area with normotonic
fluid can be expected to induce a rapid additionalcell swelling, which in itself may injure the cells,and also, becuase of accompanying compression ofcapillaries, may impede reperfusion. We thereforecompared the effects of normotonic and hypertonicreperfusion of the LAD area after a 60-minuteperiod of ischemia.
Figure 8 shows epicardial and intramural DC-extracellular electrograms recorded during ischemiaand after normotonic and hypertonic reperfusion,respectively. Normotonic reperfusion was accom-plished by simply removing the clamp on the LADafter a 60-minute period of LAD occlusion. Selec-tive hypertonic reperfusion of the LAD area wasperformed by cannulating the LAD and perfusingit, after 1 hour of ischemia, with a blood-Tyrode'smixture made hypertonic by the addition of man-nitol to achieve 480 mOsm/kg. The LAD was per-fused with this hypertonic perfusate for 8 minutes,and then the osmolality was gradually decreasedover a period of about 20 minutes to normal levels.
As can be seen, in both experiments, the epicar-dial and intramural DC electrograms were mono-phasic after 60 minutes of LAD occlusion, indicating
by guest on July 9, 2018http://circres.ahajournals.org/
Dow
nloaded from
TISSUE OSMOLALITY IN MYOCARDIAL ISCHEMIA/Tranum-Jensen et at. 371
FIGURE 5 a, c, and e: Low- and high-power micrographs of myocardium fixed by vascular perfusion with normotonicfixative (fixative vehicle: 312 mOsm/kg) after a 1-hour period of LAD occlusion (ischemic tissue osmolality measuredin this heart: 365 mOsm/kg). For comparison are shown micrographs of normally perfused myocardium taken fromthe same heart (b, d, and f). The normally perfused myocardium is well preserved; in particular there are no signs ofintracelUdar edema. In contrast, the ischemic myocardial cells are markedly swollen as evidenced by the clear emptyspaces between myofibribi and around nuclei (N). The latter are swollen and exhibit margination of chromatin.Mitochondria (m) are enlarged and appear as round bodies. Hypercontraction ofmyofibrils is seen (x), but not in allcells. Note that capillaries (c) are open and empty to indicate that fixative has flown, p-phenylene diamme staining.Scale bars indicate 20 tun.
by guest on July 9, 2018http://circres.ahajournals.org/
Dow
nloaded from

372 CIRCULATION RESEARCH VOL. 49, No. 2 AUGUST 1981
FIGURE 6 a, c, and e: Low- and high-power micrographs of myocardium fixed with hypertonic fixative (fixativevehicle: 372 mOsm/kg) after a 1-hour period of LAD occlusion (ischemic tissue osmolality measured: 372 mOsm/kg).For comparison are shown micrographs of normally perfused myocardium from the same heart (b, d, and f). The cellsof the normally perfused myocardium appear slightly shrunken. The ischemic myocardial cells exhibit only a slightedema compared to the normotonically fixed heart of Figure 5. Also their nuclei (n) are less swollen but do exhibitmarginalion of chromatin as in Figure 5- Myofibrils generally are hypercontracted. c. Open empty capillaries, p-phenylene diamine staining. Scale bars indicate 20 pm.
by guest on July 9, 2018http://circres.ahajournals.org/
Dow
nloaded from

TISSUE OSMOLALITY IN MYOCARDIAL ISCHEMIA/Tranum-Jensen et al. 373
TABLE 1 Mean ± 2 SEM of Smallest Cell Diameters (\un) Measured across Cell Nucleiin Ischemic and Normal Myocardium Fixed at Different Tonicities
Osmolality offixative vehicle
400 mOsm/kg
372 mOsm/kg
312 mOsm/kg
Experiment
AB
CD
EF
Mean of smallest cell diameters at the level of nuclei (jim)
Ischemic
12.13 ± 0.3412.07 ± 0 34
13.58 ± 0.3812.68 ± 0.37
15.46 ± 0.5014.75 ± 0.42
Normal
10.49 ± 0.2810.42 ± 0.24
10.17 ± 0.2910.73 ± 0.34
13.17 ± 0.3812.08 ± 0.34
iBchemic(pooled)
A + B12.10 ± 0.24
C + D13.12 ± 0.27
E + F15.10 ± 0.33
Normal(pooled)
A ± B10.44 ± 0.18
C + D10.49 ± 0.21
E + F12.63 ± 0.26
Each value is derived from 100 measurements obtained by pooling two sets of 50 measurementsfrom two different sites in ischemic or normal myocardium In the two columns on the right,measurements on similarly treated hearts are pooled.
unresponsiveness of the ischemic myocardium (Kle-ber et al., 1978). After normotonic reperfusion, someelectrical activity returns in the subepicardial lay-ers, whereas deeper tissue remains unresponsive. In
all signals, there is an appreciable amount of TQ-segment depression and ST-elevation, indicatingloss of resting membrane potential and decrease inaction potential amplitude, respectively, or—in the
7bFIGURE 7 a and b: Electron micrographs of cross-sectioned ischemic cells subjected to normotonic and hypertonicfixation, m a and b, respectively (Same hearts as in Figure 5 and 6.) The marked intracellular edema in thenormotonically fixed ischemic cells produce large empty spaces separating myo fibrils (mf) and mUochondria (m), andaround the nucleus (N). This edema is less pronounced in the hypertonicaUy fixed ischemic cells, c: Capillaries. Scalebars indicate 1 pm.
by guest on July 9, 2018http://circres.ahajournals.org/
Dow
nloaded from
374 CIRCULATION RESEARCH VOL. 49, No. 2 AUGUST 1981
250 msec
4 mm — =
8 mm ,
control 60'occL 30'normotor»creperfusion
epi L
4 mm
Rmm j
-10OmV
-10
250 msec
\ /40'reperfuGJ0nf hyportofiic _
normotone)
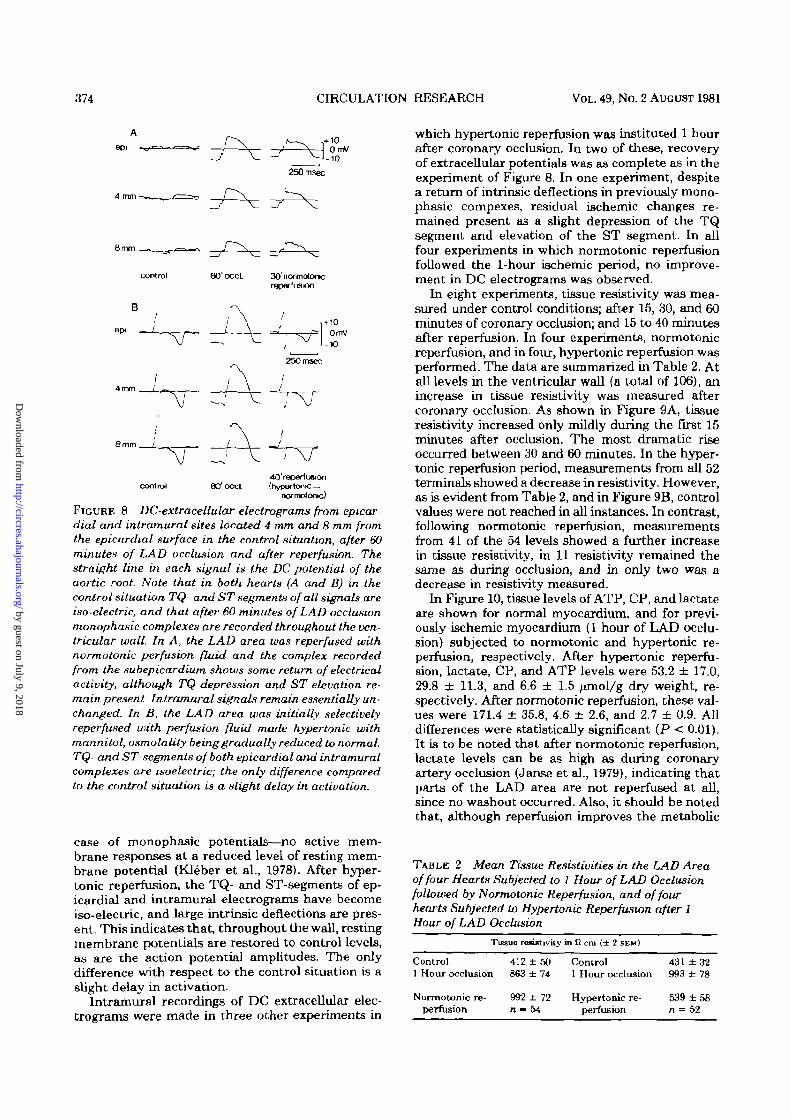
FIGURE 8 DC-extracellular electrograms from epicardial and intramural sites located 4 mm and 8 mm fromthe epicardial surface in the control situation, after 60minutes of LAD occlusion and after reperfusion. Thestraight line in each signal is the DC potential of theaortic root. Note that in both hearts (A and B) in thecontrol situation TQ- and ST segments of all signals areiso-electric, and that after 60 minutes of LAD occlusionmonophasic complexes are recorded throughout the ven-tricular wall. In A, the LAD area was reperfused withnormotonic perfusion fluid and the complex recordedfrom the subepicardium shows some return of electricalactivity, although TQ depression and ST elevation re-main present Intramural signals remain essentially un-changed. In B, the LAD area was initially selectivelyreperfused with perfusion fluid made hypertonic withmannitol, osmolality being gradually reduced to normal.TQ- and ST-segments of both epicardial and intramuralcomplexes are isoelectric; the only difference comparedto the control situation is a slight delay in activation.
case of monophasic potentials—no active mem-brane responses at a reduced level of resting mem-brane potential (Kleber et al., 1978). After hyper-tonic reperfusion, the TQ- and ST-segments of ep-icardial and intramural electrograms have becomeiso-electric, and large intrinsic deflections are pres-ent. This indicates that, throughout the wall, restingmembrane potentials are restored to control levels,as are the action potential amplitudes. The onlydifference with respect to the control situation is aslight delay in activation.
Intramural recordings of DC extracellular elec-trograms were made in three other experiments in
which hypertonic reperfusion was instituted 1 hourafter coronary occlusion. In two of these, recoveryof extracellular potentials was as complete as in theexperiment of Figure 8. In one experiment, despitea return of intrinsic deflections in previously mono-phasic compexes, residual ischemic changes re-mained present as a slight depression of the TQsegment and elevation of the ST segment. In allfour experiments in which normotonic reperfusionfollowed the 1-hour ischemic period, no improve-ment in DC electrograms was observed.
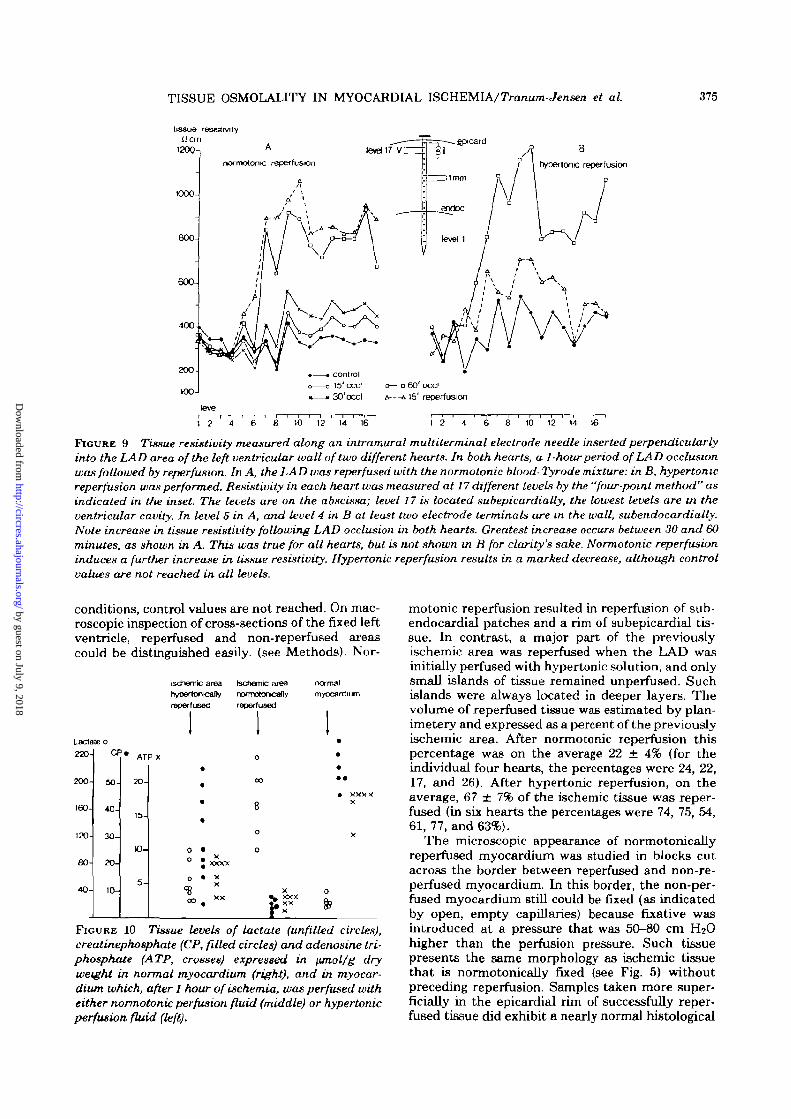
In eight experiments, tissue resistivity was mea-sured under control conditions; after 15, 30, and 60minutes of coronary occlusion; and 15 to 40 minutesafter reperfusion. In four experiments, normotonicreperfusion, and in four, hypertonic reperfusion wasperformed. The data are summarized in Table 2. Atall levels in the ventricular wall (a total of 106), anincrease in tissue resistivity was measured aftercoronary occlusion. As shown in Figure 9A, tissueresistivity increased only mildly during the first 15minutes after occlusion. The most dramatic riseoccurred between 30 and 60 minutes. In the hyper-tonic reperfusion period, measurements from all 52terminals showed a decrease in resistivity. However,as is evident from Table 2, and in Figure 9B, controlvalues were not reached in all instances. In contrast,following normotonic reperfusion, measurementsfrom 41 of the 54 levels showed a further increasein tissue resistivity, in 11 resistivity remained thesame as during occlusion, and in only two was adecrease in resistivity measured.
In Figure 10, tissue levels of ATP, CP, and lactateare shown for normal myocardium, and for previ-ously ischemic myocardium (1 hour of LAD occlu-sion) subjected to normotonic and hypertonic re-perfusion, respectively. After hypertonic reperfu-sion, lactate, CP, and ATP levels were 53.2 ± 17.0,29.8 ± 11.3, and 6.6 ± 1.5 ^mol/g dry weight, re-spectively. After normotonic reperfusion, these val-ues were 171.4 ± 35.8, 4.6 ± 2.6, and 2.7 ± 0.9. Alldifferences were statistically significant (P < 0.01).It is to be noted that after normotonic reperfusion,lactate levels can be as high as during coronaryartery occlusion (Janse et al., 1979), indicating thatparts of the LAD area are not reperfused at all,since no washout occurred. Also, it should be notedthat, although reperfusion improves the metabolic
TABLE 2 Mean Tissue Resistivities in the LAD Areaof four Hearts Subjected to 1 Hour of LAD Occlusionfollowed by Normotonic Reperfusion, and of fourhearts Subjected to Hypertonic Reperfusion after 1Hour of LAD Occlusion
Tissue re•flUtivity in fl cm (± 2 SEM)
Control1 Hour occlusion
Normotonic re-perfusion
412 ± 50863 ± 74
992 ±72n - 54
Control1 Hour occlusion
Hypertonic re-perfusion
431 ± 3 2993 ± 78
539 ± 5 8n 4 52
by guest on July 9, 2018http://circres.ahajournals.org/
Dow
nloaded from
TISSUE OSMOLALITY IN MYOCARDIAL ISCHEMIA/Tranum-Jensen et aL 375
tissue resistivity
1200-1ilcm A
normotonic reperfusion
1000
800-
frypettonic reperfusiori
1 2
FIGURE 9 Tissue resistivity measured along an intramural muUiterminal electrode needle inserted perpendicularlyinto the LAD area of the left ventricular wall of two different hearts. In both hearts, a 1-hour period of LAD occlusionwas followed by reperfusion. In A, the LAD was reperfused with the normotonic blood- Tyrode mixture: in B, hypertonicreperfusion was performed. Resistivity in each heart was measured at 17 different levels by the "four-point method" asindicated in the inset. The levels are on the abscissa; level 17 is located subepicardially, the lowest levels are in theventricular cavity. In level 5 in A, and level 4 in B at least two electrode terminals are m the wall, subendocardially.Note increase in tissue resistivity following LAD occlusion in both hearts. Greatest increase occurs between 30 and 60minutes, as shown in A. This was true for all hearts, but is not shown in B for clarity's sake. Normotonic reperfusioninduces a further increase in tissue resistivity. Hypertonic reperfusion results in a marked decrease, although controlvalues are not reached in all levels.
conditions, control values are not reached. On mac-roscopic inspection of cross-sections of the fixed leftventricle, reperfused and non-reperfused areascould be distinguished easily, (see Methods). Nor-
Lactateo
220-
200-
160-
120-
80-
40-
CF
50-
40-
30-
20-
10-
# ATP X
20-
15-
10-
5 -
Ischemic areahypartooicaflvreperfused
II
*0 to • x
J xxxxo • x
XS300 x x
tectiemic areanofmotor»canvreperfused
II0
CD
8
0
0
X^ XXX£ XXr x
normalmyocardiLm
I
•••• xxxx
X
X
0
fc
FIGURE 10 Tissue levels of lactate (unfilled circles),creatinephosphate (CP, filled circles) and adenosine tri-phosphate (ATP, crosses) expressed in jimol/g dryweight in normal myocardium (right), and in myocar-dium which, after 1 hour of ischemia, was perfused witheither normotonic perfusion fluid (middle) or hypertonicperfusion fluid (left).
motonic reperfusion resulted in reperfusion of sub-endocardial patches and a rim of subepicardial tis-sue. In contrast, a major part of the previouslyischemic area was reperfused when the LAD wasinitially perfused with hypertonic solution, and onlysmall islands of tissue remained unperfused. Suchislands were always located in deeper layers. Thevolume of reperfused tissue was estimated by plan-imetery and expressed as a percent of the previouslyischemic area. After normotonic reperfusion thispercentage was on the average 22 ± 4% (for theindividual four hearts, the percentages were 24, 22,17, and 26). After hypertonic reperfusion, on theaverage, 67 ± 7% of the ischemic tissue was reper-fused (in six hearts the percentages were 74, 75, 54,61, 77, and 63%).
The microscopic appearance of normotonicallyreperfused myocardium was studied in blocks cutacross the border between reperfused and non-re-perfused myocardium. In this border, the non-per-fused myocardium still could be fixed (as indicatedby open, empty capillaries) because fixative wasintroduced at a pressure that was 50-80 cm H2Ohigher than the perfusion pressure. Such tissuepresents the same morphology as ischemic tissuethat is normotonically fixed (see Fig. 5) withoutpreceding reperfusion. Samples taken more super-ficially in the epicardial rim of successfully reper-fused tissue did exhibit a nearly normal histological
by guest on July 9, 2018http://circres.ahajournals.org/
Dow
nloaded from

376 CIRCULATION RESEARCH VOL. 49, No. 2 AUGUST 1981
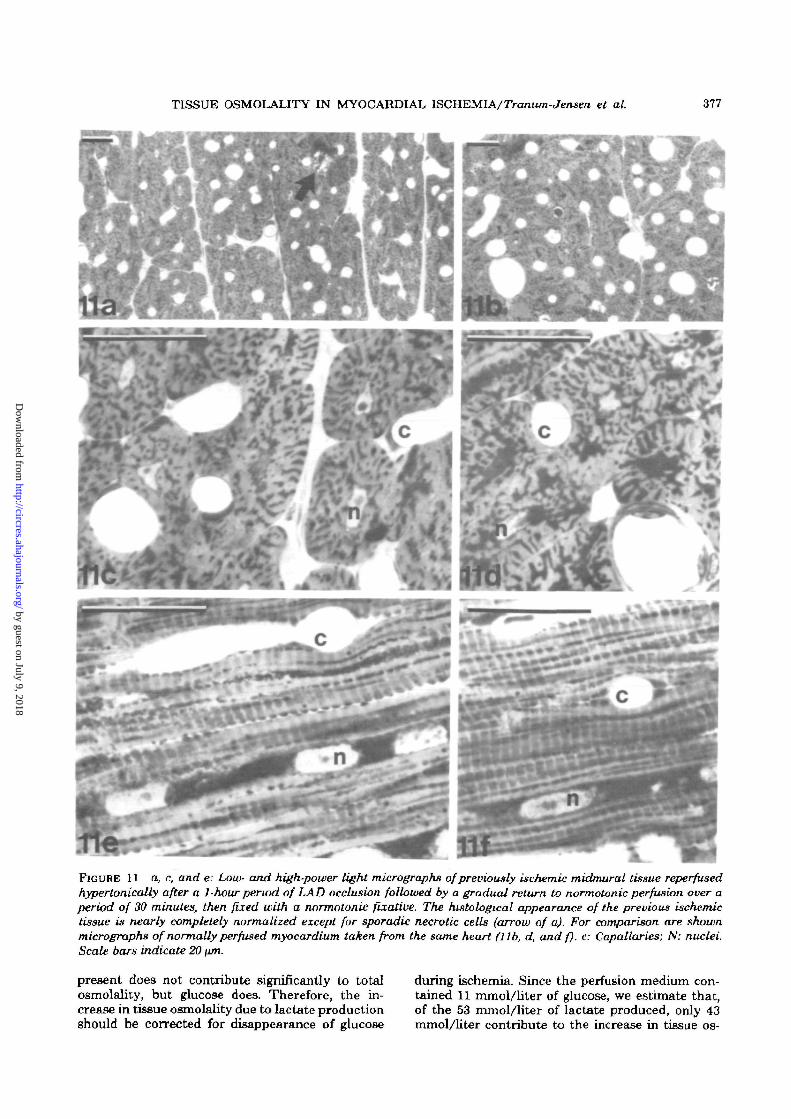
structure. In contrast, the hypertonically reperfusedmyocardium shows a nearly completely normal his-tological appearance, whether samples were takenfrom subepicardial, midmural, and subendocardiallayers of reperfused tissue, sporadic necrotic cellsand scattered bands of hypercontracted myofibrilsbeing the only stigma of the previous ischemia (Fig.11).
In Table 3 are given measurements of ceLl diam-eters at the nuclear level in midmural myocardiumof four hearts subjected to hypertonic reperfusion.In the first three hearts, the differences in celldiameter in the non-ischemic and previously is-chemic myocardium were statistically not signifi-cantly different. In heart iv, a significant differencewas found; cells in the previously ischemic arearemained swollen, whereas cells in the normal areafor unknown reasons were unusually small (com-pare with Table I).
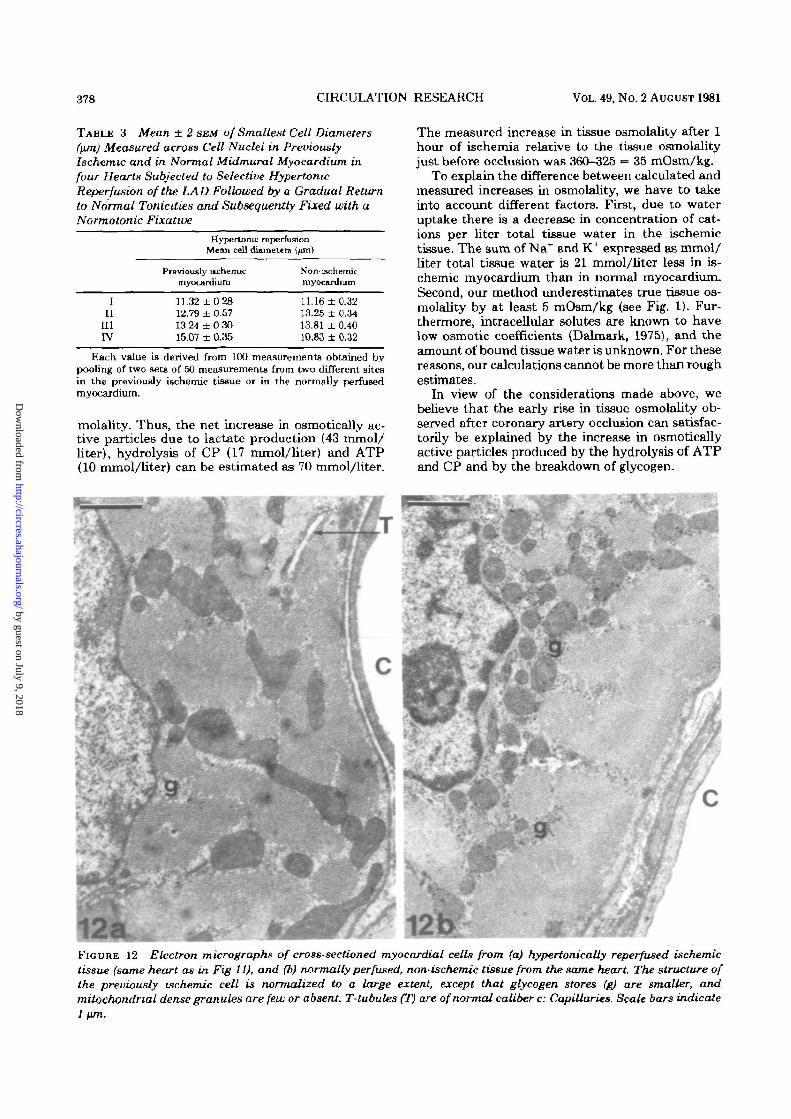
In Figure 12, an electron micrograph of suben-docardial myocardium hypertonically reperfusedafter 1 hour of ischemia is compared with an elec-tron micrograph of normal myocardium from thesame heart. The only differences detected are aslightly woolly appearance of mitochondria in thepreviously ischemic area, and a higher content ofglycogen granules in the normal myocardium. In allother respects, the ultrastructure of the previouslyischemic cell is normalized. It does appear thatnormotonic reperfusion of the LAD prevents thereperfusion of large parts of the LAD area. If,however, reperfusion is achieved as in the subepi-cardium, the cells regain their normal histologicalappearance in the same way as does the major partof the myocardium following hypertonic LAD re-perfusion.
DiscussionThe main results of this study can be summarized
as follows. Following coronary artery occlusion, tis-sue osmolality rises so that after 50 minutes adifference between ischemic and normal myocar-dium of about 35-40 mOsm/kg is established. Thisincrease in osmolality can be accounted for bymetabolic processes, in particular the conversion ofglycogen into lactate, and the hydrolysis of highenergy phosphate compounds. Concomitantly, theischemic tissue takes up fluid whereby tissue watervolume increases by an average of 16.5%. Part ofthis extra fluid is located intracellularly so thatischemic cells swell.
Because of the increased osmolality, ischemiccells will undergo an additional swelling whenbrought into contact with normotonic fluids, be itfixative or normotonic perfusion fluid. This implieson the one hand that morphometric measurementson ischemic tissue can be misleading unless thetonicity of the fixative is adjusted according to theincreased osmolality of the ischemic tissue. On theother hand, normotonic reperfusion may inducesufficient cell swelling to cause failure of capillary
circulation, especially in subendocardial and mid-mural layers. Reperfusion, and thus recovery ofischemic cells, can be accomplished by initial reper-fusion of an ischemic area with hypertonic fluids,followed by a gradual return to normal levels.
The Mechanisms of the Increase in TissueOsmolality in Ischemia
Cell swelling is known to occur in myocardialischemia, and attention has been drawn to "thevicious cycle of cell swelling, vascular obstruction,sustained ischemia, and eventual cell death" (Leaf,1970). Cell swelling in ischemia has been attributedto an insufficiency of the Na+-K+ exchange pump{Leaf, 1970). The insufficiency of active membranetransport mechanisms to balance passive leaks willlead ultimately to equilibrium of small moleculesacross the cell membrane. Hereby a Gibbs-Donnanequilibrium, governed by the higher intracellularconcentration of colloid anions, is approached. Thecell membranes cannot resist a hydrostatic pressuredifference of any significant magnitude, and conse-quently the cells will swell (Leaf, 1959; Tostesonand Hoffman, 1960; Rorive and Gilles, 1979). Thetime scale and extent to which this mechanism willoperate in ischemic myocardium is difficult to as-sess due to incomplete knowledge about the passiveionic permeabilities in ischemic myocardial cells, aswell as to insufficient characterization of intracel-lular proteins. Pine et al. (1977, 1978) found that 60minutes of total metabolic blockade of papillarymuscle did not result in cell swelling despite inhi-bition of Na+-K+ exchange pump activity. This inour opinion would indicate that the above-men-tioned colloid osmotic phenomena, at least on arelatively short time scale, are insufficient to explainischemic swelling of myocardial cells, and othermechanisms must contribute, such as the osmoticgradients likely to be created by anaerobic metabo-lites.
A rough estimate of the increase in osmolality inischemic tissue due to hydrolysis of ATP and CPand the production of lactate can be made based onthe measurements of the tissue content of thosecompounds. When tissue levels are expressed asmmol/liter total tissue water (see Results), it canbe calculated that, in an ischemic period of 1 hour,5 mmol/liter of ATP and 17 mmol/liter of CP arehydrolyzed, whereas 53 mmol/liter of lactate areproduced. Complete hydrolysis of 5 mmol/liter ofATP will produce 15 mmol/liter of inorganic phos-phate. However, the net increase in inorganic phos-phate will be less, due mainly to increases in AMPand glucose-6-phosphate. We estimate that the hy-drolysis of ATP will give rise to an increase inosmotically active inorganic phosphate of 10 mmol/liter total tissue water. The increase in lactate inischemic myocardium is due mainly to glycogenol-ysis, but also partly to breakdown of glucose, pres-ent at the start of occlusion. Glycogen originally
by guest on July 9, 2018http://circres.ahajournals.org/
Dow
nloaded from
TISSUE OSMOLALITY IN MYOCARDIAL ISCHEMIA/Tranum-Jensen et al. 377
FIGURE 11 a, c, and e: Low- and high-power light micrographs of previously ischemic midmural tissue reperfusedhypertonically after a 1-hour period of LAD occlusion followed by a gradual return to normotonic perfusion over aperiod of 30 minutes, then fixed with a normotonic fixative. The histological appearance of the previous ischemictissue is nearly completely normalized except for sporadic necrotic cells (arrow of a). For comparison are shownmicrographs of normally perfused myocardium taken from the same heart (lib, d, and f). c: Capallaries; N: nuclei.Scale bars indicate 20 \un.
present does not contribute significantly to totalosmolality, but glucose does. Therefore, the in-crease in tissue osmolality due to lactate productionshould be corrected for disappearance of glucose
during ischemia. Since the perfusion medium con-tained 11 mmol/liter of glucose, we estimate that,of the 53 mmol/liter of lactate produced, only 43mmol/liter contribute to the increase in tissue os-
by guest on July 9, 2018http://circres.ahajournals.org/
Dow
nloaded from
378 CIRCULATION RESEARCH VOL. 49, No. 2 AUGUST 1981
TABLE 3 Mean ± 2 SEM of Smallest Cell Diameters(ftm) Measured across Cell Nuclei in PreviouslyIschemic and in Normal Midmural Myocardium infour Hearts Subjected to Selective HypertonicReperfusion of the LAD Followed by a Gradual Returnto Normal Tonicities and Subsequently Fixed with aNormotonic Fixative
Hypertonic reperfusionMean cell diameters {prc\)
Previously lschemicmyocardium
Non-iBchemicmyocardium
III
III
rv
11.32 ±02812.79 ± 0.5713 24 ± 0 3015.07 ± 0.35
11.16 ± 0.3213.25 ± 0.3413.81 ± 0.4fl10.83 ± 0.32
Each value is derived from 100 measurements obtained bypooling of two sets of 50 measurements from two different sitesin the previously ischemic tissue or in the normally perfusedmyocardium.
molality. Thus, the net increase in osmoticaUy ac-tive particles due to lactate production (43 mmol/liter), hydrolysis of CP (17 mmol/liter) and ATP(10 mmol/liter) can be estimated as 70 mmol/liter.
The measured increase in tissue osmolality after 1hour of ischemia relative to the tissue osmolalityjust before occlusion was 360-325 = 35 mOsm/kg.
To explain the difference between calculated andmeasured increases in osmolality, we have to takeinto account different factors. First, due to wateruptake there is a decrease in concentration of cat-ions per liter total tissue water in the ischemictissue. The sum of Na+ and K+ expressed as mmol/liter total tissue water is 21 mmol/liter less in is-chemic myocardium than in normal myocardium.Second, our method underestimates true tissue os-molality by at least 5 mOsm/kg (see Fig. 1). Fur-thermore, intracellular solutes are known to havelow osmotic coefficients (Dalmark, 1975), and theamount of bound tissue water is unknown. For thesereasons, our calculations cannot be more than roughestimates.
la view of the considerations made above, webelieve that the early rise in tissue osmolality ob-served after coronary artery occlusion can satisfac-torily be explained by the increase in osmotdcallyactive particles produced by the hydrolysis of ATPand CP and by the breakdown of glycogen.
12a mFIGURE 12 Electron micrographs of cross-sectioned myocardial cells from (a) hypertonically reperfused ischemictissue (same heart as in Fig 11), and (b) normally perfused, non-ischemic tissue from the same heart. The structure ofthe previously ischemic cell is normalized to a large extent, except that glycogen stores (g) are smaller, andmitochondnal dense granules are few or absent T-tubules (T) are of normal caliber c: Capillaries. Scale bars indicate1 nm.
by guest on July 9, 2018http://circres.ahajournals.org/
Dow
nloaded from

TISSUE OSMOLALITY IN MYOCARDIAL ISCHEMIA/Tranum-Jensen et al. 379
Cell Swelling and Increase in Tissue Water
In 1928, Eggleton et al. determined the coefficientof diffusion of lactate in skeletal muscle and foundit to decrease in fatigue. They wrote "as the osmoticpressure inside the fibers rises in fatique, the lymph(i.e., the extracellular fluid) is absorbed and thediffusion constant (of lactate) gradually diminishesto the value characteristic of the fibers closelypacked." This would indicate that the sarcolemmais a significant barrier to lactate diffusion. In ratmyocardium made partially ischemic, in that aresidual flow of anoxic medium was maintained.Rovetto et al. (1973) calculated, based on measure-ments of sorbitol space and lactate content of theischemic myocardium and effluent, that a gradientbetween intra- and extracellular lactate as high as20 mmol/liter can exist in ischemic tissue.
The reason why, in ischemia, lactate would dif-fuse with difficulty through the cell membrane isfar from clear. However, it has been found that, insuperfused skeletal muscle, under conditions inwhich extracellular buffer capacity was low, lactateefflux rate is decreased further when the musclefibers are depolarized with high K+ (Mainwood andWorsley-Brown, 1975). It is known that myocardialcells depolarize rapidly after coronary artery occlu-sion (Kleber et al., 1978) and that lactate content ofischemic myocardium in the isolated pig heart risesfourfold within 10 minutes after coronary arteryocclusion (Janse et al., 1979). Moreover, within 4minutes of ischemia, CP levels have decreased topractically zero and ATP has decreased as well(Janse et al., 1979). Thus, it is very likely that, inthe very first minutes of regional myocardial is-chemia, the majority of the breakdown products ofthe high energy compounds and glycogen remainintracellularly, thus creating an osmotic gradientacross the cell membrane by which extracellularwater is drawn into the cell, and osmotic equilib-rium between intra- and extracellular compart-ments is restored. A volume of normotonic fluidsubsequently entering the ischemic tissue will bedistributed roughly according to the proportion ofintra- to extracellular volumes existing in the is-chemic tissue. This will be so as long as the cellmembranes remain much more permeable to waterthan to the osmotically active solutes, and, partic-ularly, this mechanism will not be affected by aslow equilibrium between intra- and extracellularcompartments of the newly produced osmotic effec-tors as long as washout does not take place. Ourdata on the glycogen-lactate balance and the con-stancy of K per gram dry weight in the centralischemic region do indicate that washout is minimalduring the 1-hour period of ischemia. We have notdetermined the proportion of intra- to extracellularvolumes initially in the ischemic area, but it is likelyto be high due to vascular collapse. For these rea-sons, most of the fluid entering the ischemic zone islikely to end up intracellularly. In our experiments,the ischemic tissue water volume increases by an
average of 16.5% within 1 hour of coronary occlusionthrough the uptake of fluid, as determined by thewet weight:dry weight ratios. The main route ofentrance for this fluid must, in the pig heart, wherevery few arterial collaterals exist (Schaper, 1971),be the veins. The uptake of fluid lowers the in-creased tissue osmolality so that tissue osmolalitymeasured is the result of two opposing processes,namely (1) the production of osmotically activeparticles, and (2) their dilution by the uptake offluid.
Effects of Ischemic Tissue Oemolality onMorphology
Although cell swelling is recognized widely to beassociated with ischemia, an accurate determina-tion of the degree of swelling is very difficult toobtain. Classical methods of determining extracel-lular space, such as inulin or sorbitol space deter-minations, cannot readily be applied in a trulyischemic situation because they imply equilibriumwith an external fluid after ischemia is established.This inherently will interfere with the ischemia,and the method is further complicated by the os-motic phenomena. A potentially direct method fordetermining cell volume is morphometry. However,the results of morphometric measurements can begrossly misleading for several reasons. The first ofthese is the use of standard fixation, dehydration,and embedding procedures.
Thus, it has been shown that the use of discon-tinuous dehydration and embedding proceduresmay result in a reduction of cell volume by as muchas 40% (Rostgaard and Tranum-Jensen, 1980). Sucheffects are particularly pronounced when swollencells of little mechanical strength are processed.Second, it is known that the osmolality of fixativescan significantly alter cell volumes when not ad-justed to the actual osmolality of the tissue to befixed (Maunsbach, 1966). Our results on the effectof variations in fixative tonicity indicate that is-chemic cell volume is influenced significantly bythis parameter. Thus, since the osmolality in is-chemic myocardium increases, the fixative usedshould be adjusted accordingly to prevent artefac-tual changes in cell volume. Ideally, since the os-molality increase varies from heart to heart, fixa-tives should be adjusted according to the measuredincrease in osmolality in each individual heart. Theuse of a fixative which is normotonic with respectto normal myocardium will lead to a significantoverestimation of cell swelling in ischemic myocar-dium. It is a general, though not well understoodexperience, that the osmotic effect of a glutaralde-hyde fixative is determined primarily by the tonicityof the fixative vehicle, the fixative itself contributingmuch less, at least in the range of concentrationsnormally used (Maunsbach, 1966). The vehicle ofour normotonic fixative used after 1 hour of occlu-sion had an osmolality of 312 mOsm/kg. At thisstage of the experiment, the osmolality of the nor-
by guest on July 9, 2018http://circres.ahajournals.org/
Dow
nloaded from
380 CIRCULATION RESEARCH VOL. 49, No. 2 AUGUST 1981
mally perfused myocardium was measured to bearound 330 mOsm/kg; this allows about 18 mOsm/kg for the effective tonicity of the 2% glutaralde-hyde. The addition of colloids, e.g., dextran, tosimulate the colloid osmotic properties of plasmaproteins is important to avoid artificial widening ofextracellular spaces during fixation by vascular per-fusion (Bohman and Maunsbach, 1970).
It is our opinion that data on ischemic tissuemicromorphology should be interpreted with greatcaution because the interaction of fixatives withischemic tissue presents special problems, amongwhich correction for tissue osmolality changes maybe an important one. The morphological presenta-tion we obtained by using a fixative vehicle of 372mOsm/kg thus would come closer to the true mor-phology of the ischemic cells than that obtainedwith a normotonic fixative.
Reperfusion of Ischemic MyocardiumA practical consequence of our findings is that
reperfusion of ischemic tissue with normotonicfluids will lead to abrupt cell swelling. This may beso severe as to obstruct capillaries and result in thewell known "no-reflow phenomenon" (Jennings etal., 1960; Flores et al., 1972; Whalen et al., 1974).Flores et al. (1972) prevented the no-reflow pheno-menin in ischemic renal tissue by infusing the ani-mal during renal artery obstruction with hypertonicmannitol. Willerson et al. (1975) prevented the in-crease in coronary artery resistance, or reduced itin the subendocardium after 2 hours of ischemia byhypertonic mannitol. They stated that the mecha-nism was unclear, but that it could be due both toa reduction of cell swelling and to a direct reductionof vascular smooth muscle tone. Powell et al. (1976)showed that an increase in the osmolality at reper-fusion of ischemic dog myocardium could reducemyocardial necrosis. Their findings showed that thechanges of myocrdial cells after 1 hour of ischemiawere not irreversible and that reduction of cellswelling may reduce necrosis.
The dog heart differs from the pig heart in thatpre-existing collaterals are nearly absent in the pig,whereas they are abundant in the dog (Schaper,1971). Coronary artery occlusion in the pig leads toa sharply demarcated transmural ischemia (Janseet al., 1979) whereas, in the dog, coronary occlusiondoes not lead to a total absence of flow, especiallyin the subepicardium (Willerson et al., 1975), andischemic damage is not distributed equally over thewall (Reimer et aL, 1977). Our reperfusion experi-ments confirm earlier findings (Willerson et al.,1975; Powell et al., 1976) and show that even intransmural ischemia, hypertonic reperfusion can toa great extent reverse ischemic changes after a 1-hour ischemic period. Thus, normotonic reperfusionresulted in reperfusion of on the average 22% of theischemic area, whereas, after hypertonic reperfu-sion, an average of 67% of the ischemic myocardiumwas reperfused.
As shown in Figure 8, intramural and epicardialextracellular potentials return to control values, orshow at least a substantial recovery in electricalactivity following hypertonic reperfusion, whereasnormotonic reperfusion after 1 hour of ischemia didnot improve the electrical activity. The results oftissue resistivity measurements are more difficultto interpret. Since part of the applied subthresholdcurrent flows through the extracellular space, andanother part through the intracellular compart-ments, both extracellular and intracellular resist-ance are represented, but each to an unknown de-gree, in the measured tissue resistivity. The abso-lute value determined will be influenced also byfactors such as fiber direction and the presence oflarge blood vessels in the neighborhood which pro-duce varying degrees of anisotropy. The increase intissue resistivity following coronary artery occlusioncould be due therefore both to an increase in extra-cellular resistance caused by cell swelling and to anincrease in intracellular resistance. That the resist-ance of the intracellular compartment can increaseas a consequence of an increase in coupling resist-ance in ischemia is more than likely, since this hasbeen shown to occur in hypoxia (Wojtczak, 1979).It is possible that the fact that tissue resistivitydoes not completely return to control values afterhypertonic reperfusion (Table 2, Fig. 9) reflects alasting increase in coupling resistance caused byischemia that is not (entirely) reversible. This couldaccount for the slight delay in activation found afterhypertonic reperfusion. The fall in tissue resistivityupon hypertonic reperfusion, in contrast to the in-crease measured after normotonic reperfusion,could easily be explained by a reduction of extra-cellular resistance due to a decrease in cell swelling.
In our studies, as in others, mannitol was used toincrease the osmolality of the blood-Tyrode mixtureused to reperfuse the LAD. There are indications,however, that mannitol may enter the intracellularcompartment. Thus, Grochowski et al. (1976) foundthe mannitol space in dog myocardium to be largerthan the inulin space. Therefore, hypertonic reper-fusion with extra mannitol followed by a fairly rapidreturn to normal levels of osmolality may induce arebound effect when mannitol is indeed taken upby ischemic cells. Possibly the choice of a largermolecule than mannitol may lead to better results.
AcknowledgmentsWe gratefully acknowledge the excellent technical assistance
of Wun ter Smitte, Charles Beltennan, and Iisette Hansen andthe fine photographical work of Dirk van der Moot and BirgitRisto. The diagrams and drawings were skillfully prepared bySylvia Teengs, and the manuscript was typed by Jenny Botter-
ReferencesAmes A, Wright RL, Kowada M, Thurston JM, Majno G (1968)
Cerebral ischemia II. The no-reflow phenomenon. Am J Pa-thol 52: 437-453
Bohman S, Maunsbach AB (1970) Effects on tissue fine structure
by guest on July 9, 2018http://circres.ahajournals.org/
Dow
nloaded from
TISSUE OSMOLALITY IN MYOCARDIAL ISCHEMIA/Tranum-Jensen et aL 381
of variations in colloid osmotic pressure of glutaraldehydefixatives. J Ultrastruct Res 30: 195-208
Conway EJ, Geoghegan H, McCormack JI (1955) Autolyticchanges at zero centrigrade in ground mammalian tissues. JPhysiol (Lond) 130: 427-437
Dalmark M (1975) Chloride and water distribution in human redcells. J Physiol (Lond) 260: 65-84
Dick DAT (1966) Cell water. London, Butterworth, p 83Dick DAT (1970) Water movement in cells. In Membranes and
Ion Transport, edited by EE Bittar. New York, Wiley-Inter-science, pp 211-250
Downar E, Janse MJ, Durrer D (1977) The effect of acutecoronary artery occlusion on subepicardial transmembranepotentials in the intact porcine heart Circulation 56: 217-224
Eggleton GP, Ejgleton P, Hill AV (1928) The coefficient ofdiffusion of Lactic add through muscle. Proc R Soc Lond (Biol)103: 620-628
Florea J, Di Bona DR, Beck CH, Leaf A (1972) The role of cellswelling in ischemic renal damage and the protective effect ofhypertonic solute. J Clin Invest 61: 118-126
Grochowski EC, Ganote CE, Hill ML, Jennings, RB (1976)Experimental myocardial uschemic injury. I. A comparison ofStadie-Riggs and free-hand slicing techniques on tissue ultra-structure, water and electrolytes during in vitro incubation. JMol Cell Cardiol 8: 73-187
Janee MJ, Cinca J, Morena H, Fiolet JWT, Kleber AG, de VriesGP, Becker AE, Durrer D (1979) The "border zone" in myo-cardial ischemia. An electrophysiological, metabolic and his-tochemical correlation in the pig heart. Circ Res 44: 576-688
Jennings RB, Sommers HM, Smyth GA, Flack HA, Linn H(1960) Myocardial necrosis induced by temporary occlusion ofa coronary artery in the dog. Arch Pathol 70: 68-78
Kleber AG, Janse MJ, van Capelle FJL, Durrer D (1978) Mech-anism and time course of S-T and T-Q segment changes duringacute regional myocardial ischemia in the pig's heart deter-mined by extracellular recordings. Circ Res 42: 603-613
Lamprecht W, Stein P, Heinz F, Weisser H (1970) Creatinphos-phate In Methoden der enzvmatischen Analyse, ed. 3, editedby HU Bergmeyer. Weinheim VerLag Chemie, pp 1729-1737
Leaf A (1959) Maintenance of concentration gradients and reg-ulation of cell volume. Ann NY Acad Sci 72: 396-404
Leaf A (1970) Regulation of intracelluJar fluid volume and dis-ease. Am J Med 49: 291-295
Maffly RH, Leaf A (1959) The potential of water in mammaliantissues. J Gen Physiol 42: 1257-1275
Mainwood GW, Worsley-Brown P (1975) The effects of extra-cellular pH and buffer concentration on the efflux of lactatefrom frog sartorius muscle. J Physiol (Lond) 260: 1-22
Maunsbach AB (1966) The influence of different fixatives and
fixation methods on the ultrastructure of rat kidney proximaltubule cells. II. Effects of varying osmolality, ionic strength,buffer system and fixative concentration of glutaraldehydesolutions. J Ultrastructure Res 15: 283-309
Pine MB, Bing OHL, Abelman WH (1977) Comparison ofchanges in tissue water and electrolytes after metabolic block-ade and after inhibition of the Na-K exchange pump in heartand kidney slices (abstr). Am J Cardiol 39: 313
Pine MB, Bing OHL, Brooks WW, Abelman WH (1979) Changesin vitro myocardial hydration and performance in response totransient metabolic blockade in hypertonic, isotonic and hy-potonic media. Cardiovas Res 12: 569-577
Powell WJ, Di Bona DR, Flores J, Frega N, Leaf A (1976)Effects of hyperosmotic mannitol in reducing ischemic cellswelling and minimizing myocardial necrosis. Circulation 53(suppl I): 45-19
Reimer KA, Lowe JR, Rasmussen MM, Jennings RB (1977) Thewavefront phenomenon of iscbemic cell death. I. Myocardialinfarct size vs duration of coronary occlusion in dogs. Circu-lation 56: 786-794
Rorive G, Gilles R (1979) Intracellular inorganic osmotic effec-tors. In Mechanisms of Osmoregulation in Animals, edited byR Gilles. John Wiley & Sons, Ltd, pp. 83-109.
Rostgaard J, Tranum-Jensen J (1980) A procedure for minimiz-ing cellular shrinkage in electron microscope preparation. Aquantitative study on frog gall bladder. J Microsc (Oxf) 119:213-232
Rovetto MJ, Whitmer JT, Neely JR (1973) Comparison of theeffects of anoxia and whole heart ischemia on carbohydrateutilization in isolated working rat hearts. Circ Res 22: 699-711
Schaper W (1971) The collateral circulation of the heart Am-sterdam, London, North-Holland Publishing Company, pp 5-18
Tosteson DC, Hoffman JF (1960) Regulation of cell volume byactive cation transport in high and low potassium in sheep redcells. J Gen Physiol 44: 169-194
van Oosterom A, de Boer RW, van Dam RTh. —1979) Intra-mural resistivity of cardiac tissue. Med Biol Eng Comp 17:337-343
Whalen DA, Hamilton DG, Ganote CE, Jennings RB (1974)Effect of a transient period of ischemia on myocardial cells I.Effects on cell volume regulation. Am J Pathol 74: 381-397
Willerson JT, Watson JT, Hutton I, Templeton GH, Fixler DE(1975) Reduced myocardial reflow and increased coronaryvascular resistance following prolonged myocardial ischemiain the dog. Circ Res 36: 771-781
Wojtczak J (1979) Contracturea and increase in internal longi-tudinal resistance of cow ventricular muscle induced by hy-poxia. Circ Res 44: 88-95
by guest on July 9, 2018http://circres.ahajournals.org/
Dow
nloaded from
J Tranum-Jensen, M J Janse, W T Fiolet, W J Krieger, C N D'Alnoncourt and D Durrerisolated porcine heart.
Tissue osmolality, cell swelling, and reperfusion in acute regional myocardial ischemia in the
Print ISSN: 0009-7330. Online ISSN: 1524-4571 Copyright © 1981 American Heart Association, Inc. All rights reserved.is published by the American Heart Association, 7272 Greenville Avenue, Dallas, TX 75231Circulation Research
doi: 10.1161/01.RES.49.2.3641981;49:364-381Circ Res.
http://circres.ahajournals.org/content/49/2/364.citationWorld Wide Web at:
The online version of this article, along with updated information and services, is located on the
http://circres.ahajournals.org//subscriptions/
is online at: Circulation Research Information about subscribing to Subscriptions:
http://www.lww.com/reprints Information about reprints can be found online at: Reprints:
document. Permissions and Rights Question and Answer about this process is available in the
located, click Request Permissions in the middle column of the Web page under Services. Further informationEditorial Office. Once the online version of the published article for which permission is being requested is
can be obtained via RightsLink, a service of the Copyright Clearance Center, not theCirculation Research Requests for permissions to reproduce figures, tables, or portions of articles originally published inPermissions:
by guest on July 9, 2018http://circres.ahajournals.org/
Dow
nloaded from