Embed Size (px)
Citation preview
Article
Time-Course Statistical Evaluation of IntercellularAdhesion Maturation by Femtosecond LaserImpulse
Takanori Iino,1,* Man Hagiyama,2 Tadahide Furuno,3 Akihiko Ito,2 and Yoichiroh Hosokawa1,*1Graduate School of Materials Science, Nara Institute of Science and Technology, Nara, Japan; 2Department of Pathology, Kindai UniversityFaculty of Medicine, Osaka, Japan; and 3School of Pharmacy, Aichi Gakuin University, Nagoya, Japan
ABSTRACT The maturation of intercellular adhesion is an essential process for establishing the signal transduction network inliving cells. Although the maturation is naturally considered to enhance the signal transduction, the relationship between thesignal transduction and the maturation process has not been revealed in detail using time-course data. Here, using a cocultureof mast cells and neurites, differences in maturation between individual cells were estimated as a function of the adhesionstrength by our original single-cell measurement method utilizing a laser-induced impulsive force. When an intense femtosecondlaser is focused into a culture medium under a microscope, shock and stress waves are generated at the laser focal point thatexert an impulsive force on individual cells. In our method, this impulse is used to break the adhesion between a mast cell and aneurite. The magnitude of the impulse is then quantified by a local force-measurement system utilizing an atomic force micro-scope, and the adhesion strength is estimated from the threshold of the impulse required to break the adhesion. The measure-ment is conducted within 1 min/cell, and thus, data on the individual differences of the adhesion strength can be obtained withinonly a few hours. Coculturing of neurites and mast cells for 4 h resulted in a specific adhesion that was stronger than the nonspe-cific adhesions between the substrate and mast cells. In the time-course investigation, we identified two distinct temporalpatterns of adhesion: 1) the strength at 24 h was the same as the initial strength; and 2) the strength increased threefoldfrom baseline and became saturated within 24 h. Based on these results, the distribution of CADM1 adhesion moleculesin the neurites was suggested to be inhomogeneous, and the relationship between adhesion maturation and the signal-trans-duction process was considered.
INTRODUCTION
Maturation of intercellular adhesion is an important pro-cess for the functionalization of cells. For example, thesignal transduction network of neurons is constructedbased on the contact between their neurites and other cells.Although the time evolution of intercellular adhesionstrength is essential information for understanding thematuration, there have been no reports quantifying thisdata. The main difficulty in determining the time evolutionis that it differs widely among individual cells. This issuecould be solved if we could obtain a large number of theindividual strengths in a short time, e.g., with a frequencyof >100 cells/h. However, the conventional methods formeasuring the adhesion strength of individual cells aretoo slow to obtain such data. For example, single-cell force
Submitted April 4, 2016, and accepted for publication September 6, 2016.
*Correspondence: [email protected] or [email protected]
Editor: Elsa Yan.
http://dx.doi.org/10.1016/j.bpj.2016.09.044
� 2016 Biophysical Society.
spectroscopy is a novel and widely used method formeasuring the strength of individual cells (1–3).Thistechnique allows us to precisely estimate the strengthas the time required to break a single protein-protein bind-ing, but it is difficult to make such estimations at a fre-quency >100 cells/h.
Recently, we developed, to our knowledge, an originalmeasurement method to estimate the strength of indi-vidual cells utilizing a femtosecond laser. When a near-in-frared femtosecond laser is tightly focused in an aqueoussolution under a microscope, shock and stress waves aregenerated at the laser focal point (4–6). These waveslocalize in a micrometer-sized space around the laserfocal point (4) and they act as an impulsive force on amicrometer-sized object, such as a single cell, which islocated near the laser focal point (7–10). We previouslysucceeded in quantifying the magnitude of the micro-meter-sized impulsive force using atomic force micro-scopy (AFM) (11,12). The quantified impulsive force
Biophysical Journal 111, 2255–2262, November 15, 2016 2255
Iino et al.
has been applied as an external force to break the inter-cellular adhesion, and the adhesion strength has been esti-mated as a breaking force (13). Since the breaking couldbe induced in a short time, e.g., <10 ms, we can obtain alarge number of the intracellular adhesions within only afew hours.
As a model system to study the adhesion maturation, acoculture system of nerve and mast cells was selected.Mast cells distribute in various systemic organs and tissues,e.g., the respiratory mucosa, skin dermis, or dura mater(14–19). In such tissues, they tend to exist near or in contactwith neurites of nerve cells (20); electron microscopicobservation has revealed that the intercellular distanceis generally <20 nm (21,22). Many mast cells adhere toneurites when neurogenic inflammation occurs (23), andFuruno et al. reported that mast cells and nerve cells bidirec-tionally transduce signal molecules in an adhesion-depen-dent manner (24,25). From these reports, the coculturesystem is generally regarded as a reproductive model ofthe anatomical and functional relationship between them.The adhesion is considered to be formed by specific bondsbetween cell adhesion molecules known as cell adhesionmolecule-1s (CADM1s) (24,26–28), which are membrane-spanning glycoproteins belonging to the immunoglobulin(Ig) superfamily (29–32) and function by forming a dimeron the cell membrane (33–35).
In a previous study, our group evaluated the adhesionbehavior between neuroblastoma cells (neuro2a) and mastcells, in which several isoforms of CADM1 were expressedexogenously (36). The results indicated that the spatialdistribution of CADM1s on the neurite differed amongthe isoforms, resulting in different adhesion strengths.Cell pairs with CADM1 isoforms conferring higher adhe-sion strength tended to more effectively transduce thesignal than pairs with isoforms conferring lower adhesionstrength. Furthermore, it seemed that at least 14 h of cocul-turing was needed to observe the signal transduction in allisoforms, whereas the adhesions were formed within ~3 h.This finding indicated the importance of investigating thematuration process to better understand the signal transduc-tion mechanism.
In this study, we estimated the time course of theadhesion strength between a neurite and a mast cell asthe femtosecond-laser-induced impulsive force requiredto break the adhesion at the single-cell level withoutapparent damage to both of the cells. The magnitude ofthe impulsive force required to break the adhesion wasestimated by AFM. We were able to measure the breakingforce for 200 cells within 90 min at maximum, and thesedata were obtained at 4, 8, 18.5, 21.5, and 24.5 h aftercoculturing. On the basis of these results, the differencein adhesion maturation among individual cells was dis-cussed. Conclusively, our results suggest that the matura-tion of adhesion progresses via specific bonds betweenCADM1s.
2256 Biophysical Journal 111, 2255–2262, November 15, 2016
MATERIALS AND METHODS
Mice, cells, and establishment of neurite cultureand coculture with mast cells
C57BL/6 and ICR mice were purchased from Japan SLC (Hama-
matsu, Japan). Bone-marrow-derived cultured mast cells (BMMCs) from
C57BL/6 were established as described elsewhere (37). Neuro2a cells
were from the American Type Culture Collection (Rockville, MD).
Neuro2a cells were plated at a density of 4.8 � 104 cells/dish onto glass-
bottom culture dishes of 35-mm diameter (m-Dish, Ibidi, Munich, Ger-
many) coated with matrigel (BD Biosciences, San Jose, CA). They were
cultured in glial conditioned medium (MB-X9501, Sumitomo, Tokyo,
Japan) containing 40 ng/mL brain-derived neurotrophic factor (R&D Sys-
tems, Minneapolis, MN) and 2 mg/mL all-trans retinoic acid (Wako, Tokyo,
Japan). After 2 days of culture, when neuro2a cells had extended their
neurites enough, the resulting neuron cultures were overlaid with MEM-a
medium containing 1.0 � 104 cells/dish BMMCs. After 4–24.5 h of cocul-
ture in the presence of 3 ng/mL interleukin 3 (R&D Systems), the dishes
were washed twice with Dulbecco’s modified Eagle’s medium to remove
nonadherent BMMCs and the remaining cells were then subjected to
measurements.
Experimental setup
Microscopic femtosecond laser irradiation system
A fundamental pulse (wavelength, 780 nm; pulse duration, 250 fs; pulse
repetition, 20 Hz) from a regeneratively amplified Ti:sapphire femtosecond
laser system (IFRIT SP-01, Cyber Laser, Tokyo, Japan) was introduced to
an inverted microscope (IX-72, Olympus, Tokyo, Japan) on which a cocul-
ture system of neurites and mast cells was set as shown in Fig. 1 a. A single
pulse was extracted from the pulse train using a mechanical shutter with a
gate time of 50 ms. After the pulse energy was tuned by a half-wave plate,
polarizers, and a gradational neutral density filter, a single pulse was
focused near the targeted cell through a 10� objective lens (NA 0.25;
PlanN, Olympus) (Fig. 1 a). The diameter of the focused laser was esti-
mated to be ~5 mm. To avoid laser ablation of the substrate, the laser focal
position in the Z-direction was adjusted to be 30 mm above the image plane
by collimator lenses, which were placed before the microscope.
Local-force-measurement system using an AFM
Quantification of the impulsive force was conducted separately from quan-
tification of the adhesion break by setting an AFM head onto the stage of the
microscope instead of the coculture system. In this method, the magnitude
of the impulsive force is measured from the amplitudes of the oscillation of
the cantilever induced by the impulsive force (11).
A tipless AFM cantilever (thickness, 3.80 mm; width, 27 mm; length,
123 mm; spring constant, 35 N/m; resonance frequency, 325 kHz in air)
(TL-NCH-10, Nano World, Neuchatel, Switzerland) was magnetically
attached to an AFM head (Nano-R2, Pacific Nanotechnology, Santa Clara,
CA) and the head was mounted on the stage. By mounting the head, the
cantilever was soaked in a water droplet which was put on the glass sub-
strate in advance, as depicted in Fig. 1 b. After the soaking, the top of
the cantilever was aligned with the image plane of the microscope by me-
chanically shifting the cantilever height, and this position was set as Z ¼ 0.
The top of the cantilever was then moved to a position 10 mm from the laser
focal point by moving the stage (Fig. 1 c).
Transient oscillation of the cantilever, induced by the laser irradiation,
was directly detected and monitored by an oscilloscope (DP4104, Tektro-
nix, Beaverton, OR) as the voltage differences between the top- and
bottom-side photodiodes of a quadrant photodiode. The signal was con-
verted to the cantilever’s shift with a linear coefficient of 6.5 mV/nm.
This coefficient was determined to push the cantilever onto the glass sub-
strate using a piezoelectric motor.
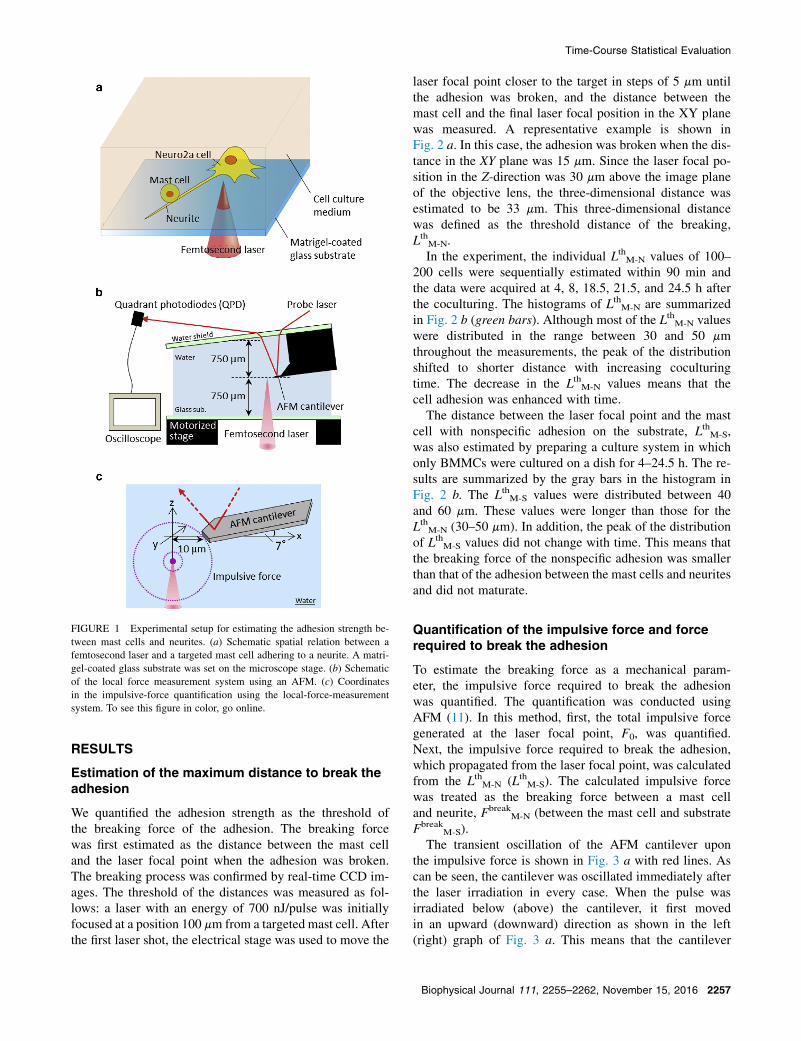
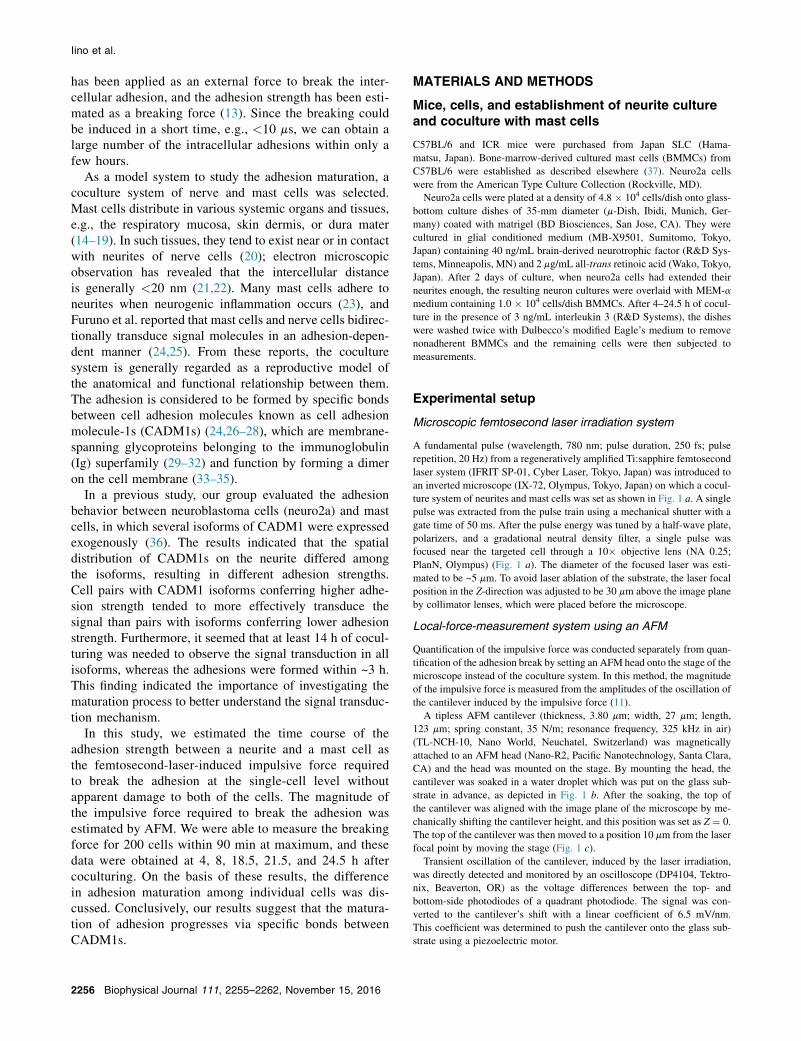
FIGURE 1 Experimental setup for estimating the adhesion strength be-
tween mast cells and neurites. (a) Schematic spatial relation between a
femtosecond laser and a targeted mast cell adhering to a neurite. A matri-
gel-coated glass substrate was set on the microscope stage. (b) Schematic
of the local force measurement system using an AFM. (c) Coordinates
in the impulsive-force quantification using the local-force-measurement
system. To see this figure in color, go online.
Time-Course Statistical Evaluation
RESULTS
Estimation of the maximum distance to break theadhesion
We quantified the adhesion strength as the threshold ofthe breaking force of the adhesion. The breaking forcewas first estimated as the distance between the mast celland the laser focal point when the adhesion was broken.The breaking process was confirmed by real-time CCD im-ages. The threshold of the distances was measured as fol-lows: a laser with an energy of 700 nJ/pulse was initiallyfocused at a position 100 mm from a targeted mast cell. Afterthe first laser shot, the electrical stage was used to move the
laser focal point closer to the target in steps of 5 mm untilthe adhesion was broken, and the distance between themast cell and the final laser focal position in the XY planewas measured. A representative example is shown inFig. 2 a. In this case, the adhesion was broken when the dis-tance in the XY plane was 15 mm. Since the laser focal po-sition in the Z-direction was 30 mm above the image planeof the objective lens, the three-dimensional distance wasestimated to be 33 mm. This three-dimensional distancewas defined as the threshold distance of the breaking,LthM-N.
In the experiment, the individual LthM-N values of 100–200 cells were sequentially estimated within 90 min andthe data were acquired at 4, 8, 18.5, 21.5, and 24.5 h afterthe coculturing. The histograms of LthM-N are summarizedin Fig. 2 b (green bars). Although most of the LthM-N valueswere distributed in the range between 30 and 50 mmthroughout the measurements, the peak of the distributionshifted to shorter distance with increasing coculturingtime. The decrease in the LthM-N values means that thecell adhesion was enhanced with time.
The distance between the laser focal point and the mastcell with nonspecific adhesion on the substrate, LthM-S,was also estimated by preparing a culture system in whichonly BMMCs were cultured on a dish for 4–24.5 h. The re-sults are summarized by the gray bars in the histogram inFig. 2 b. The LthM-S values were distributed between 40and 60 mm. These values were longer than those for theLthM-N (30–50 mm). In addition, the peak of the distributionof LthM-S values did not change with time. This means thatthe breaking force of the nonspecific adhesion was smallerthan that of the adhesion between the mast cells and neuritesand did not maturate.
Quantification of the impulsive force and forcerequired to break the adhesion
To estimate the breaking force as a mechanical param-eter, the impulsive force required to break the adhesionwas quantified. The quantification was conducted usingAFM (11). In this method, first, the total impulsive forcegenerated at the laser focal point, F0, was quantified.Next, the impulsive force required to break the adhesion,which propagated from the laser focal point, was calculatedfrom the LthM-N (LthM-S). The calculated impulsive forcewas treated as the breaking force between a mast celland neurite, Fbreak
M-N (between the mast cell and substrateFbreak
M-S).The transient oscillation of the AFM cantilever upon
the impulsive force is shown in Fig. 3 a with red lines. Ascan be seen, the cantilever was oscillated immediately afterthe laser irradiation in every case. When the pulse wasirradiated below (above) the cantilever, it first movedin an upward (downward) direction as shown in the left(right) graph of Fig. 3 a. This means that the cantilever
Biophysical Journal 111, 2255–2262, November 15, 2016 2257

FIGURE 2 Statistical evaluation of the adhesion-breaking force between a mast cell and a neurite. (a) Representative result of breaking of the adhesion
between a mast cell and neurite. The laser focal point was sequentially moved closer to the mast cell, as indicated by the X marks on the dashed arrow in the
photograph at right. (b) Histograms of the threshold distance between the laser focal point and the mast cell to break the adhesion. Green and gray bars
indicate individual differences in LthN-M and LthM-S, respectively. The time on the top of the graph is the coculturing time. (c) Histograms of the adhesion
breaking force. Red and gray bars indicate individual differences in FbreakN-M and Fbreak
M-S, respectively. The threshold distances in (b) were converted to
adhesion-breaking forces by Eq. 2, with the same coculturing times as in (b). To see this figure in color, go online.
Iino et al.
was pushed by the impulsive force immediately after thelaser irradiation.
Assuming the force loaded on the cantilever could beapproximated as an impulse (F � d(t)), the oscillation wasexpressed by
YðtÞ ¼ u2 þ a2
u
FAFM
ke�a� t � sinðu � tÞ; (1)
where FAFM is the impulse loaded on the cantilever (theintegral of the force with respect to time (Ns)) and u,a, and k are the angular velocity, damping constant, andspring constant of the cantilever, respectively. Althougha simple damping oscillation is predicted in the equation,an irregular vibration was observed at the early stageof the experimental data collection. The irregularity canbe interpreted as follows: 1) the time evolution of theimpulsive force was not a simple impulse; 2) the bendingmodes of the cantilever, except for the fundamentalmode with frequency u, were simultaneously excitedand interfered with each other; or 3) the amplitude of theoscillation was out of the detection range of the quadrantphotodiode. As an approximation assuming that the influ-
2258 Biophysical Journal 111, 2255–2262, November 15, 2016
ence of these phenomena is minimized by extrapolatingthe former vibration by the latter oscillation, least-squaresfitting by Eq. 1 was performed for the experimental data.The fitted results are shown by the blue lines in Fig. 3 a.In every case, oscillations later than 30 ms were well-fitted.The damping constant and the oscillation frequency werehardly dependent on the laser focal point in the Z-direction,though only FAFM was considerably changed with theZ-position.
Fig. 3 b shows the Z-position dependence of FAFM. TheZ-position dependence of FAFM was calculated based ona spatial relationship between the cantilever and the laserfocal point and fitted to the experimental data (Fig. 3 b,green line). The detailed procedure has been describedin a previous study (13); we followed this procedurewith F0, which was proportional to the amplitude of thecurve, being the only variable parameter in the fitting.The shape of the curve was determined by spatial con-stants with the relationship between the cantilever andthe laser focal point. The fitting results were as accu-rate as those in our previous work (13). The estimatedF0 with a pulse energy of 700 nJ/pulse was 3.80 �10�10 (Ns).
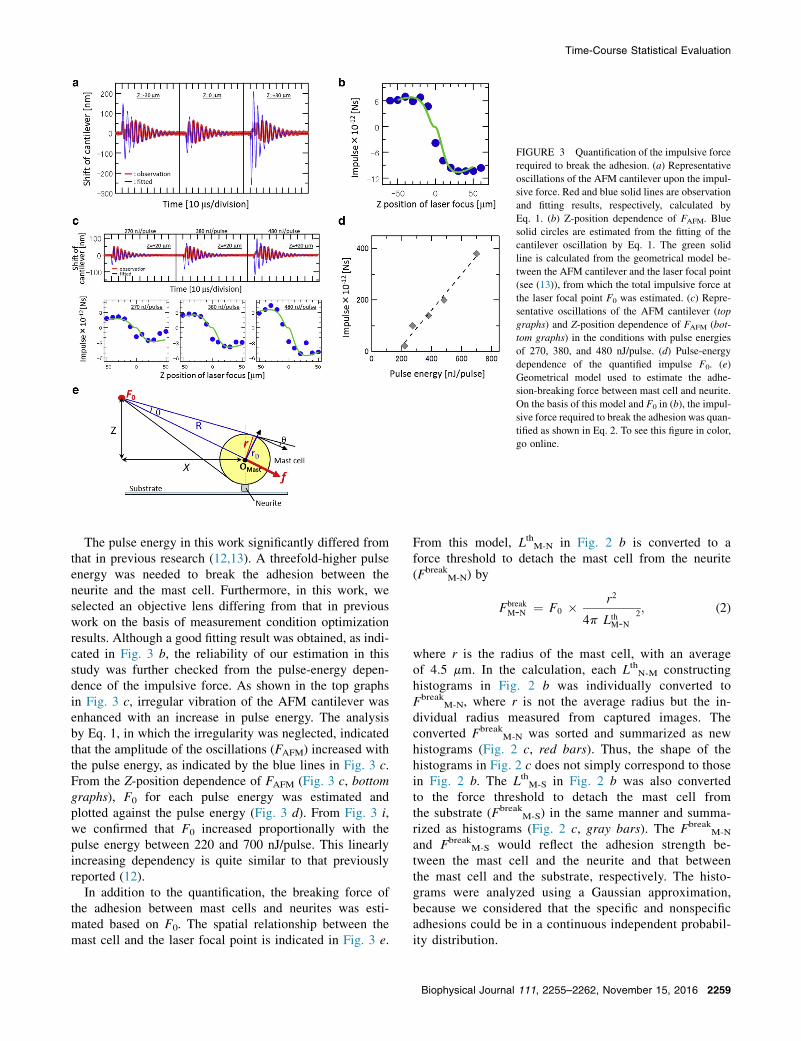
FIGURE 3 Quantification of the impulsive force
required to break the adhesion. (a) Representative
oscillations of the AFM cantilever upon the impul-
sive force. Red and blue solid lines are observation
and fitting results, respectively, calculated by
Eq. 1. (b) Z-position dependence of FAFM. Blue
solid circles are estimated from the fitting of the
cantilever oscillation by Eq. 1. The green solid
line is calculated from the geometrical model be-
tween the AFM cantilever and the laser focal point
(see (13)), from which the total impulsive force at
the laser focal point F0 was estimated. (c) Repre-
sentative oscillations of the AFM cantilever (top
graphs) and Z-position dependence of FAFM (bot-
tom graphs) in the conditions with pulse energies
of 270, 380, and 480 nJ/pulse. (d) Pulse-energy
dependence of the quantified impulse F0. (e)
Geometrical model used to estimate the adhe-
sion-breaking force between mast cell and neurite.
On the basis of this model and F0 in (b), the impul-
sive force required to break the adhesion was quan-
tified as shown in Eq. 2. To see this figure in color,
go online.
Time-Course Statistical Evaluation
The pulse energy in this work significantly differed fromthat in previous research (12,13). A threefold-higher pulseenergy was needed to break the adhesion between theneurite and the mast cell. Furthermore, in this work, weselected an objective lens differing from that in previouswork on the basis of measurement condition optimizationresults. Although a good fitting result was obtained, as indi-cated in Fig. 3 b, the reliability of our estimation in thisstudy was further checked from the pulse-energy depen-dence of the impulsive force. As shown in the top graphsin Fig. 3 c, irregular vibration of the AFM cantilever wasenhanced with an increase in pulse energy. The analysisby Eq. 1, in which the irregularity was neglected, indicatedthat the amplitude of the oscillations (FAFM) increased withthe pulse energy, as indicated by the blue lines in Fig. 3 c.From the Z-position dependence of FAFM (Fig. 3 c, bottomgraphs), F0 for each pulse energy was estimated andplotted against the pulse energy (Fig. 3 d). From Fig. 3 i,we confirmed that F0 increased proportionally with thepulse energy between 220 and 700 nJ/pulse. This linearlyincreasing dependency is quite similar to that previouslyreported (12).
In addition to the quantification, the breaking force ofthe adhesion between mast cells and neurites was esti-mated based on F0. The spatial relationship between themast cell and the laser focal point is indicated in Fig. 3 e.
From this model, LthM-N in Fig. 2 b is converted to aforce threshold to detach the mast cell from the neurite(Fbreak
M-N) by
FbreakM-N ¼ F0 � r2
4p�LthM-N
�2; (2)
where r is the radius of the mast cell, with an averageof 4.5 mm. In the calculation, each LthN-M constructinghistograms in Fig. 2 b was individually converted toFbreak
M-N, where r is not the average radius but the in-dividual radius measured from captured images. Theconverted Fbreak
M-N was sorted and summarized as newhistograms (Fig. 2 c, red bars). Thus, the shape of thehistograms in Fig. 2 c does not simply correspond to thosein Fig. 2 b. The LthM-S in Fig. 2 b was also convertedto the force threshold to detach the mast cell fromthe substrate (Fbreak
M-S) in the same manner and summa-rized as histograms (Fig. 2 c, gray bars). The Fbreak
M-N
and FbreakM-S would reflect the adhesion strength be-
tween the mast cell and the neurite and that betweenthe mast cell and the substrate, respectively. The histo-grams were analyzed using a Gaussian approximation,because we considered that the specific and nonspecificadhesions could be in a continuous independent probabil-ity distribution.
Biophysical Journal 111, 2255–2262, November 15, 2016 2259

Iino et al.
DISCUSSION
Reliability of the estimation of the breaking force
In this investigation, the pulse energy was a critical param-eter in obtaining a reliable LthM-N. When the pulse energywas low, meaning the impulsive force was weak, some ofthe adhesions were not broken, even though the laser focalpoint contacted the edge of the targeted cells. Conversely,when we used high pulse energy, generating an intenseimpulsive force, many of the adhesions were broken bythe first shot, even though the laser focal point was farenough from the targeted cell. In this case, it is difficult todetermine LthM-N. We therefore explored the pulse energythat would best allow us to clearly estimate the distance.
We found that the most suitable pulse energy was in therange 650–700 nJ/pulse. In this range, throughout the mea-surement period, almost all of the adhesions were notbroken by the first laser shot but were broken in the dis-tances to be reliably estimated. In all the other ranges exam-ined, the LthM-N was difficult to determine for the reasonsmentioned above. In particular, when a laser shot with apulse energy >700 nJ/pulse was used, the neurites wereoften destroyed. In the reliable range, the use of a moreintense pulse energy could shorten the time required forbreaking, since fewer loadings of the impulsive force wereneeded before the break. Therefore, the pulse energy wastuned to 700 nJ/pulse and this value was maintainedthroughout the measurements.
Since the pulse energy of 700 nJ/pulse was over threetimes higher than that used in previous studies, obviousirregular vibration of the AFM cantilever was induced, asshown in Fig. 3 b. As a result of the analysis by extrapolationusing the latter regular vibration, the linearly increasingdependency of the impulsive force was confirmed in thepulse energy ranging from 220 to 700 nJ/pulse (Fig. 3 d).The dependency is quite similar to that previously reported(12). It is known that a pulse with extremely high en-ergy leads the nonlinear absorption to the saturation pointbecause of the absence of ground-state molecules at thelaser focal point, and the excited molecules, which areexcited by single-photon absorption, dominate the absorp-tion (38,39). Considering this phenomenon, the linearlyincreasing dependency in Fig. 3 d is reasonable, suggestingthat the analysis using simple extrapolation is reliable in thisstudy.
FIGURE 4 Schematic presentation of the adhesion maturation process of
mast cells on neurites with an inhomogeneous distribution of CADM1s. To
see this figure in color, go online.
Maturation process between the neurites andmast cells
The adhesion between the neurites and mast cells wasconsidered to be formed by specific bonds betweenCADM1 molecules (24,26–28), which exist on the cellmembrane of both neurites and mast cells. In addition,because the nonspecific adhesion due to electrostatic inter-
2260 Biophysical Journal 111, 2255–2262, November 15, 2016
action would not be negligible, the contribution of thenonspecific bonds was also evaluated as Fbreak
M-S. The dis-tribution of Fbreak
M-S values could be approximated by a sin-gle Gaussian profile with a peak at 0.2 � 10�12 Ns, and itwas almost constant throughout the measurement period(Fig. 2 c). On the other hand, the distribution of Fbreak
M-N
values was dynamically changed with the coculturingtime. An increase of Fbreak
M-N represented an enhancementof the adhesion strength between the mast cell and neurite.The distribution of Fbreak
M-N values at 4 h is nearly indicatedas a single Gaussian profile with a peak at 0.4 � 10�12 Ns,which is about two times larger than that of Fbreak
M-S (0.2 �10�12 Ns). After 8 h, although the peak at 0.4� 10�12 Nsremained, a distribution with a peak at 0.8 � 10�12 Nsseemed to increase relatively with time. The bimodal distri-bution with peaks at 0.4� 10�12 Ns and 0.8� 10�12 Ns wasalmost the same after 18.5 h. From these analyses, we foundthat 1) the adhesion maturation does not occur in all of themast cells adhering on the neurite; and 2) the adhesion hastwo stable states before and after the adhesion maturation.
This fact indicates that the density of CADM1s onthe neurite may be inhomogeneous, as shown in Fig. 4.After the mast cell contacts the neurite, the connectionbetween CADM1s on the mast cell and neurite wouldbe made during migration of CADM1s on their membranesdue to fluidity of the membrane. When the density ofCADM1s on the neurite is sufficiently lower than that onthe mast cell (Fig. 4, left), the CADM1 on the neurite wouldbe able to find easily the counter-CADM1 on the mast cell.In this case, the adhesion is matured immediately after
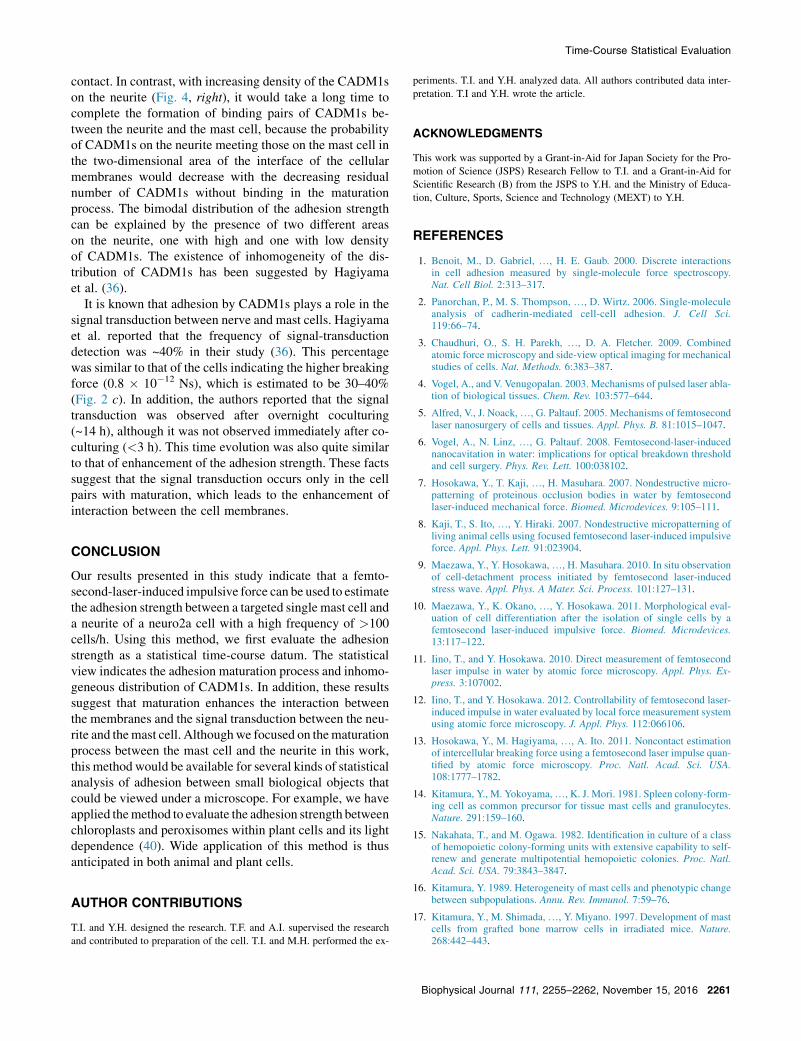
Time-Course Statistical Evaluation
contact. In contrast, with increasing density of the CADM1son the neurite (Fig. 4, right), it would take a long time tocomplete the formation of binding pairs of CADM1s be-tween the neurite and the mast cell, because the probabilityof CADM1s on the neurite meeting those on the mast cell inthe two-dimensional area of the interface of the cellularmembranes would decrease with the decreasing residualnumber of CADM1s without binding in the maturationprocess. The bimodal distribution of the adhesion strengthcan be explained by the presence of two different areason the neurite, one with high and one with low densityof CADM1s. The existence of inhomogeneity of the dis-tribution of CADM1s has been suggested by Hagiyamaet al. (36).
It is known that adhesion by CADM1s plays a role in thesignal transduction between nerve and mast cells. Hagiyamaet al. reported that the frequency of signal-transductiondetection was ~40% in their study (36). This percentagewas similar to that of the cells indicating the higher breakingforce (0.8 � 10�12 Ns), which is estimated to be 30–40%(Fig. 2 c). In addition, the authors reported that the signaltransduction was observed after overnight coculturing(~14 h), although it was not observed immediately after co-culturing (<3 h). This time evolution was also quite similarto that of enhancement of the adhesion strength. These factssuggest that the signal transduction occurs only in the cellpairs with maturation, which leads to the enhancement ofinteraction between the cell membranes.
CONCLUSION
Our results presented in this study indicate that a femto-second-laser-induced impulsive force can be used to estimatethe adhesion strength between a targeted single mast cell anda neurite of a neuro2a cell with a high frequency of >100cells/h. Using this method, we first evaluate the adhesionstrength as a statistical time-course datum. The statisticalview indicates the adhesion maturation process and inhomo-geneous distribution of CADM1s. In addition, these resultssuggest that maturation enhances the interaction betweenthe membranes and the signal transduction between the neu-rite and themast cell. Althoughwe focused on thematurationprocess between the mast cell and the neurite in this work,this method would be available for several kinds of statisticalanalysis of adhesion between small biological objects thatcould be viewed under a microscope. For example, we haveapplied themethod to evaluate the adhesion strength betweenchloroplasts and peroxisomes within plant cells and its lightdependence (40). Wide application of this method is thusanticipated in both animal and plant cells.
AUTHOR CONTRIBUTIONS
T.I. and Y.H. designed the research. T.F. and A.I. supervised the research
and contributed to preparation of the cell. T.I. and M.H. performed the ex-
periments. T.I. and Y.H. analyzed data. All authors contributed data inter-
pretation. T.I and Y.H. wrote the article.
ACKNOWLEDGMENTS
This work was supported by a Grant-in-Aid for Japan Society for the Pro-
motion of Science (JSPS) Research Fellow to T.I. and a Grant-in-Aid for
Scientific Research (B) from the JSPS to Y.H. and the Ministry of Educa-
tion, Culture, Sports, Science and Technology (MEXT) to Y.H.
REFERENCES
1. Benoit, M., D. Gabriel, ., H. E. Gaub. 2000. Discrete interactionsin cell adhesion measured by single-molecule force spectroscopy.Nat. Cell Biol. 2:313–317.
2. Panorchan, P., M. S. Thompson, ., D. Wirtz. 2006. Single-moleculeanalysis of cadherin-mediated cell-cell adhesion. J. Cell Sci.119:66–74.
3. Chaudhuri, O., S. H. Parekh, ., D. A. Fletcher. 2009. Combinedatomic force microscopy and side-view optical imaging for mechanicalstudies of cells. Nat. Methods. 6:383–387.
4. Vogel, A., and V. Venugopalan. 2003. Mechanisms of pulsed laser abla-tion of biological tissues. Chem. Rev. 103:577–644.
5. Alfred, V., J. Noack,., G. Paltauf. 2005. Mechanisms of femtosecondlaser nanosurgery of cells and tissues. Appl. Phys. B. 81:1015–1047.
6. Vogel, A., N. Linz, ., G. Paltauf. 2008. Femtosecond-laser-inducednanocavitation in water: implications for optical breakdown thresholdand cell surgery. Phys. Rev. Lett. 100:038102.
7. Hosokawa, Y., T. Kaji, ., H. Masuhara. 2007. Nondestructive micro-patterning of proteinous occlusion bodies in water by femtosecondlaser-induced mechanical force. Biomed. Microdevices. 9:105–111.
8. Kaji, T., S. Ito, ., Y. Hiraki. 2007. Nondestructive micropatterning ofliving animal cells using focused femtosecond laser-induced impulsiveforce. Appl. Phys. Lett. 91:023904.
9. Maezawa, Y., Y. Hosokawa,., H. Masuhara. 2010. In situ observationof cell-detachment process initiated by femtosecond laser-inducedstress wave. Appl. Phys. A Mater. Sci. Process. 101:127–131.
10. Maezawa, Y., K. Okano, ., Y. Hosokawa. 2011. Morphological eval-uation of cell differentiation after the isolation of single cells by afemtosecond laser-induced impulsive force. Biomed. Microdevices.13:117–122.
11. Iino, T., and Y. Hosokawa. 2010. Direct measurement of femtosecondlaser impulse in water by atomic force microscopy. Appl. Phys. Ex-press. 3:107002.
12. Iino, T., and Y. Hosokawa. 2012. Controllability of femtosecond laser-induced impulse in water evaluated by local force measurement systemusing atomic force microscopy. J. Appl. Phys. 112:066106.
13. Hosokawa, Y., M. Hagiyama, ., A. Ito. 2011. Noncontact estimationof intercellular breaking force using a femtosecond laser impulse quan-tified by atomic force microscopy. Proc. Natl. Acad. Sci. USA.108:1777–1782.
14. Kitamura, Y., M. Yokoyama,., K. J. Mori. 1981. Spleen colony-form-ing cell as common precursor for tissue mast cells and granulocytes.Nature. 291:159–160.
15. Nakahata, T., and M. Ogawa. 1982. Identification in culture of a classof hemopoietic colony-forming units with extensive capability to self-renew and generate multipotential hemopoietic colonies. Proc. Natl.Acad. Sci. USA. 79:3843–3847.
16. Kitamura, Y. 1989. Heterogeneity of mast cells and phenotypic changebetween subpopulations. Annu. Rev. Immunol. 7:59–76.
17. Kitamura, Y., M. Shimada,., Y. Miyano. 1997. Development of mastcells from grafted bone marrow cells in irradiated mice. Nature.268:442–443.
Biophysical Journal 111, 2255–2262, November 15, 2016 2261
Iino et al.
18. Austen, K. F., and J. A. Boyce. 2001. Mast cell lineage developmentand phenotypic regulation. Leuk. Res. 25:511–518.
19. Khalil, M., J. Ronda, ., A. J. Silverman. 2007. Brain mast cellrelationship to neurovasculature during development. Brain Res.1171:18–29.
20. Selye, H. 1965. The Mast Cells. Butterworths, Washington, D.C..
21. Stead, R. H., M. Tomioka,., J. Bienenstock. 1987. Intestinal mucosalmast cells in normal and nematode-infected rat intestines are in inti-mate contact with peptidergic nerves. Proc. Natl. Acad. Sci. USA.84:2975–2979.
22. Stead, R. H., M. F. Dixon, ., J. Bienenstock. 1989. Mast cells areclosely apposed to nerves in the human gastrointestinal mucosa.Gastroenterology. 97:575–585.
23. Piche, T., M. C. Saint-Paul, ., X. Hebuterne. 2008. Mast cells andcellularity of the colonic mucosa correlated with fatigue and depressionin irritable bowel syndrome. Gut. 57:468–473.
24. Furuno, T., A. Ito,., Y. Kitamura. 2005. The spermatogenic Ig super-family/synaptic cell adhesion molecule mast-cell adhesion moleculepromotes interaction with nerves. J. Immunol. 174:6934–6942.
25. Koma, Y., T. Furuno, ., A. Ito. 2008. Cell adhesion molecule 1 is anovel pancreatic-islet cell adhesion molecule that mediates nerve-isletcell interactions. Gastroenterology. 134:1544–1554.
26. Ito, A., T. Jippo,., Y. Kitamura. 2003. SgIGSF: a new mast-cell adhe-sion molecule used for attachment to fibroblasts and transcriptionallyregulated by MITF. Blood. 101:2601–2608.
27. Furuno, T., D. Ma, ., J. Bienenstock. 2004. Bone marrow-derivedmast cells in mice respond in co-culture to scorpion venom activationof superior cervical ganglion neurites according to level of expressionof NK-1 receptors. Neurosci. Lett. 372:185–189.
28. Suzuki, A., R. Suzuki,., M. Nakanishi. 2004. N-cadherin plays a rolein the synapse-like structures between mast cells and neurites. Biol.Pharm. Bull. 27:1891–1894.
29. Kuramochi, M., H. Fukuhara, ., Y. Murakami. 2001. TSLC1 is a tu-mor-suppressor gene in human non-small-cell lung cancer. Nat. Genet.27:427–430.
2262 Biophysical Journal 111, 2255–2262, November 15, 2016
30. Yageta, M., M. Kuramochi, ., Y. Murakami. 2002. Direct associationof TSLC1 and DAL-1, two distinct tumor suppressor proteins in lungcancer. Cancer Res. 62:5129–5133.
31. Shingai, T., W. Ikeda, ., Y. Takai. 2003. Implications of nectin-like molecule-2/IGSF4/RA175/SgIGSF/TSLC1/SynCAM1 in cell-cell adhesion and transmembrane protein localization in epithelialcells. J. Biol. Chem. 278:35421–35427.
32. Fukuhara, H., M. Masuda, ., Y. Murakami. 2003. Association of alung tumor suppressor TSLC1 with MPP3, a human homologue ofDrosophila tumor suppressor Dlg. Oncogene. 22:6160–6165.
33. Masuda, M., M. Yageta,., Y. Murakami. 2002. The tumor suppressorprotein TSLC1 is involved in cell-cell adhesion. J. Biol. Chem.277:31014–31019.
34. Takai, Y., J. Miyoshi, ., H. Ogita. 2008. Nectins and nectin-like mol-ecules: roles in contact inhibition of cell movement and proliferation.Nat. Rev. Mol. Cell Biol. 9:603–615.
35. Wakayama, T., H. Koami,., S. Iseki. 2003. Expression and functionalcharacterization of the adhesion molecule spermatogenic immunoglob-ulin superfamily in the mouse testis. Biol. Reprod. 68:1755–1763.
36. Hagiyama, M., T. Furuno, ., A. Ito. 2011. Enhanced nerve-mast cellinteraction by a neuronal short isoform of cell adhesion molecule-1.J. Immunol. 186:5983–5992.
37. Ito, A., M. Hagiyama, ., M. Takaki. 2007. Involvement of theSgIGSF/Necl-2 adhesion molecule in degranulation of mesentericmast cells. J. Neuroimmunol. 184:209–213.
38. Noack, J., and V. Alfred. 1999. Laser-induced plasma formation in wa-ter at nanosecond to femtosecond time scales: calculation of thresholds,absorption coefficients, and energy density. IEEE J. Quantum Electron.35:1156–1167.
39. Fukumura, H., and H. Masuhara. 1993. The mechanism of dopant-induced laser ablation. Possibility of cyclic multiphotonic absorptionin excited states. Chem. Phys. Lett. 221:373–378.
40. Oikawa, K., S. Matsunaga, ., M. Nishimura. 2015. Physical interac-tion between peroxisomes and chloroplasts elucidated by in situ laseranalysis. Nat Plants. 1:15035.