Embed Size (px)
Citation preview
VIETNAM TILAPIA 2015 : ACCELERATING START
Dr. Nguyen Huu Dzung
Vice President Vietnam Association of Seafood Exporters and Producers (VASEP)
Kuala Lumpur – April 2 - 4, 2015
TILAPIA 2015 KUALA LUMPUR
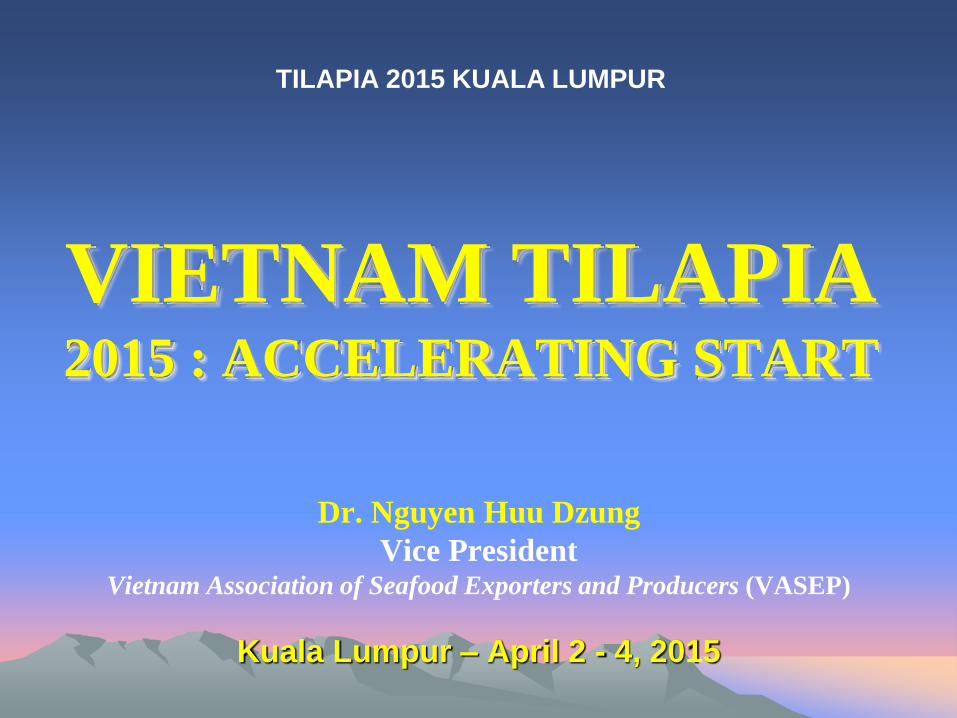
Vietnam Fisheries 2014: An overview
• Land area: 329,560 sq km
• Coast line: 3,260 km
• EEZ area: 1 million sq. km
• Total production : 6.30 million MT (+ 4.4% to 2013)
Catching: 2.71 million MT (+
Aquaculture: 3.61 million MT (+ 4.8% to 2013)
• Export turnover : US$ 7.836 billions (+ 16.5% to 2013).
• Labour force: more than 4.5 millions
• Fisheries continued to be a key national economic sector:
Take 4-5% GDP;
Take 5 -6% of total national export turn-over.
Rank 4th Global for seafood export (follow: China, Norway, Thailand)
Rank 5th national for export value (follow: electronics, garment, crude oil, shoes)
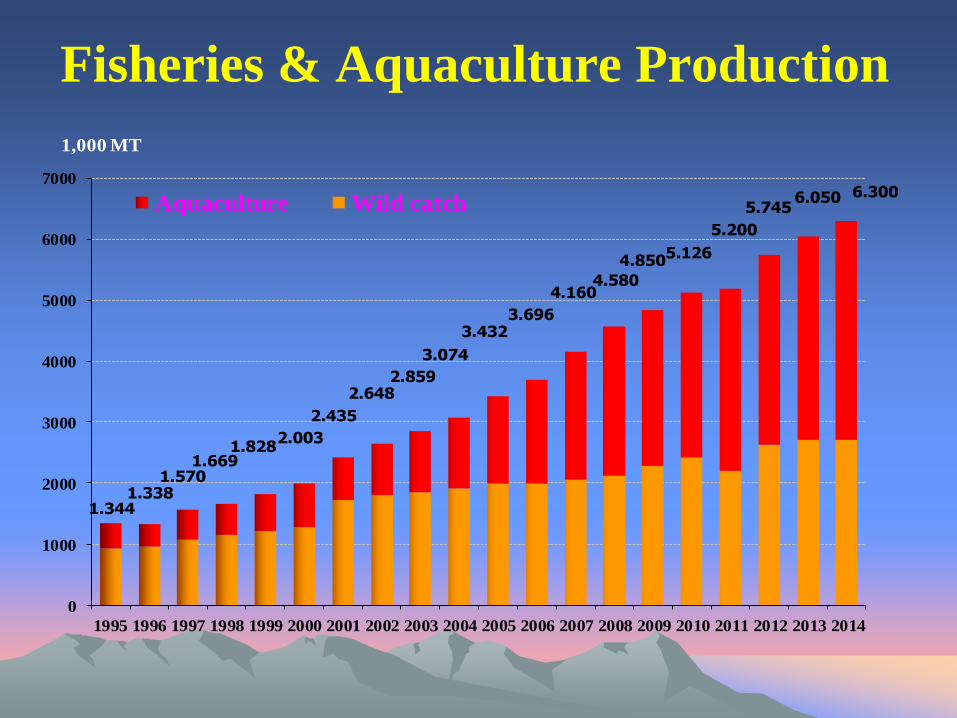
Fisheries & Aquaculture Production
1.3441.3381.5701.669
1.8282.003
2.435
2.6482.859
3.074
3.4323.696
4.1604.580
4.8505.126
5.200
5.7456.050 6.300
0
1000
2000
3000
4000
5000
6000
7000
1995 1996 1997 1998 1999 2000 2001 2002 2003 2004 2005 2006 2007 2008 2009 2010 2011 2012 2013 2014
1,000 MT
Aquaculture Wild catch

Aquaculture Area & Production

5
• 567 seafood industrial processing plants
• 455 plants qualified for exporting to the EU (compared to 1999:
17 only)
• More than 550 plants are meeting national standards of hygiene
and safety, including GMP, SSOP, HACCP and ISO
• Processed seafood volume was over 1,500,000 tons
• Lacking of running capital, weak access possibility to the bank
• Shortage of raw materials: bigger from year to year
• Imported raw seafood for re-processing increased
• Product diversification enlarged, value-added products accepted
by many supermarket chains in the US, EU & Japan
Seafood Processing Industry 2014

Vietnam Seafood Exports 1993-2014
368.0456.0
550.0 670.0 780.0 817.0
971.01478.0
1777.0
2023.0
2240.0
2401.0
2739.03348.0
3762.0
4500.04250.0
5033.0
6118.0
6134.0
6725.0
7836.0
21.0
24.
21.
22.
16.
5.
19.
52.
20.
12.510.7
7.2
14.1
22.2
12.4
19.6
-5.7
18.4
21.5
.3
9.6
16.5
-10
0
10
20
30
40
50
60
0
1000
2000
3000
4000
5000
6000
7000
8000
9000 %US$ millions
Export value
Growth rate

Export Markets Structure 2014
(By Value)

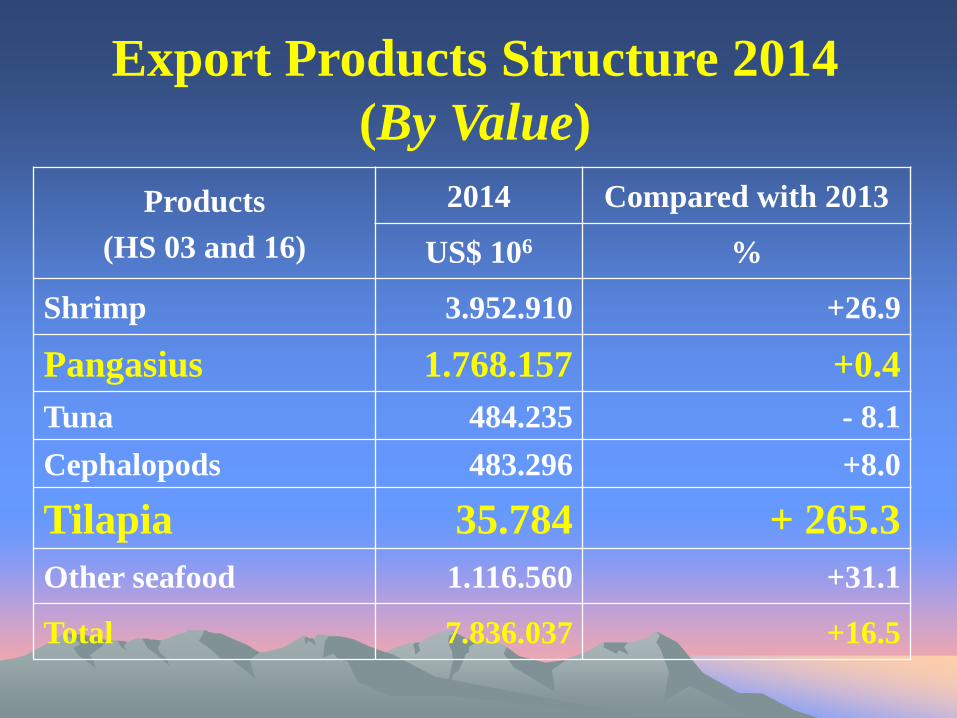
Export Products Structure 2014
(By Value)
Export Products Structure 2014
(By Value)
Products
(HS 03 and 16)
2014 Compared with 2013
US$ 106 %
Shrimp 3.952.910 +26.9
Pangasius 1.768.157 +0.4
Tuna 484.235 - 8.1
Cephalopods 483.296 +8.0
Tilapia 35.784 + 265.3
Other seafood 1.116.560 +31.1
Total 7.836.037 +16.5

10
Vietnam’s Pangasius Story
• Vietnam’s 2nd important farmed species, after shrimp
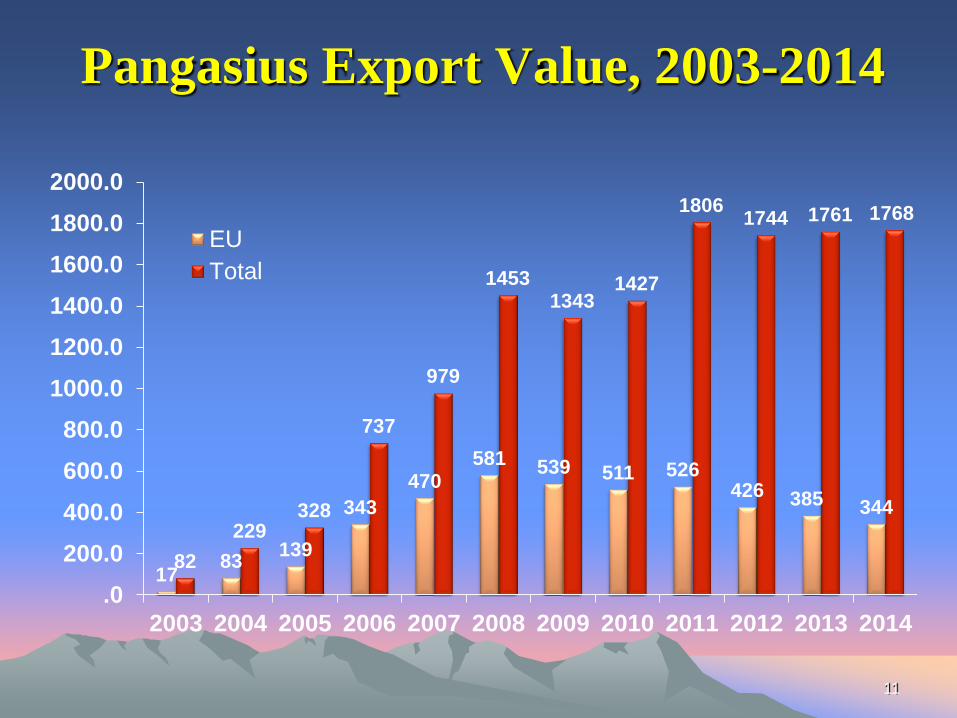
• Export value in 2014 was US$ 1.768 bill.
• Fastest development: from 2003 to 2008: 1.5 mill. tons
• Very high productivity: 500 ton/ha/crop
• Most vertically integrated farmed fish in Vietnam, 70%
fish volume farmed by processors, modernization of
farming and processing technology
• Many producers certified by BAP, Global GAP; first 27
farms ASC certified, with more 20% total production
• Against by US catfish : Antidumping case from 2002
• Good fish but link with bad opinions in some markets
11
Pangasius Export Value, 2003-2014
17 83
139
343
470 581 539 511 526
426 385 344
82
229 328
737
979
1453 1343
1427
1806 1744 1761 1768
.0
200.0
400.0
600.0
800.0
1000.0
1200.0
1400.0
1600.0
1800.0
2000.0
2003 2004 2005 2006 2007 2008 2009 2010 2011 2012 2013 2014
EU
Total
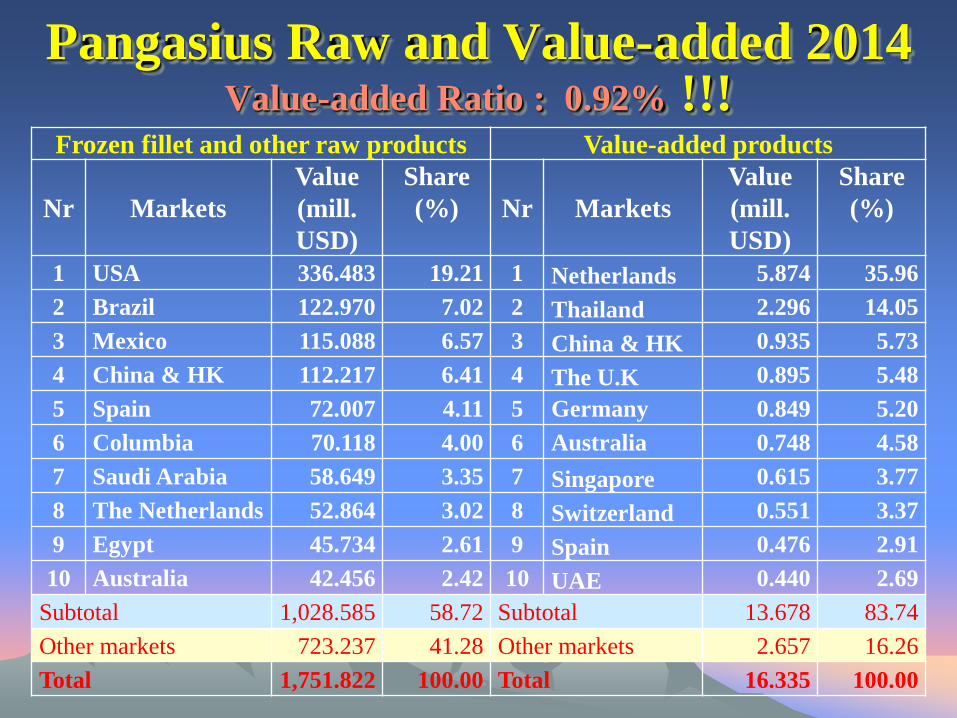
Pangasius Raw and Value-added 2014 Value-added Ratio : 0.92% !!!
12
Frozen fillet and other raw products Value-added products
Nr Markets
Value
(mill.
USD)
Share
(%) Nr Markets
Value
(mill.
USD)
Share
(%)
1 USA 336.483 19.21 1 Netherlands 5.874 35.96
2 Brazil 122.970 7.02 2 Thailand 2.296 14.05
3 Mexico 115.088 6.57 3 China & HK 0.935 5.73
4 China & HK 112.217 6.41 4 The U.K 0.895 5.48
5 Spain 72.007 4.11 5 Germany 0.849 5.20
6 Columbia 70.118 4.00 6 Australia 0.748 4.58
7 Saudi Arabia 58.649 3.35 7 Singapore 0.615 3.77
8 The Netherlands 52.864 3.02 8 Switzerland 0.551 3.37
9 Egypt 45.734 2.61 9 Spain 0.476 2.91
10 Australia 42.456 2.42 10 UAE 0.440 2.69
Subtotal 1,028.585 58.72 Subtotal 13.678 83.74
Other markets 723.237 41.28 Other markets 2.657 16.26
Total 1,751.822 100.00 Total 16.335 100.00
13
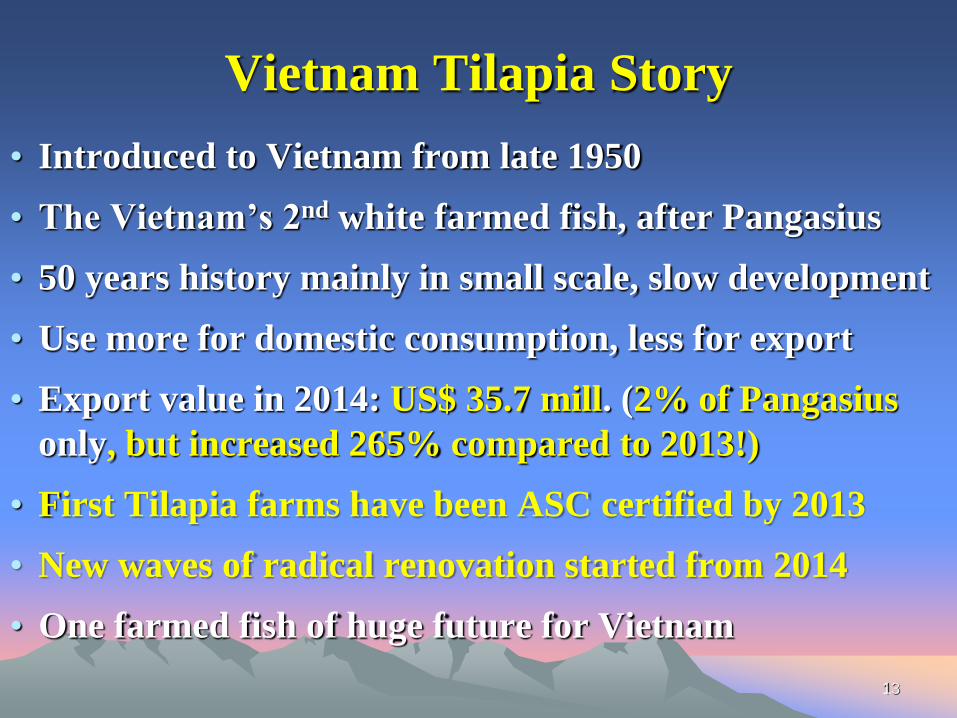
Vietnam Tilapia Story
• Introduced to Vietnam from late 1950
• The Vietnam’s 2nd white farmed fish, after Pangasius
• 50 years history mainly in small scale, slow development
• Use more for domestic consumption, less for export
• Export value in 2014: US$ 35.7 mill. (2% of Pangasius
only, but increased 265% compared to 2013!)
• First Tilapia farms have been ASC certified by 2013
• New waves of radical renovation started from 2014
• One farmed fish of huge future for Vietnam

14
Present Vietnam Tilapia Farming
Two main species:
• Red (Oreochromis sp.) mainly for domestic
• Black (Oreochromis niloticus) mainly for export
Two main farming models:
• Monoculture
• Poly-culture with shrimp to reduce EMS
Two main kinds of farming facilities:
• Cages in rivers, reservoirs and lakes
• Earth ponds
Pond: 15,992 ha (3% national freshwater farming area)
Cage’s volume in rivers and lakes : 410.732 m3
Source: D-Fish report by Nov. 2014
15
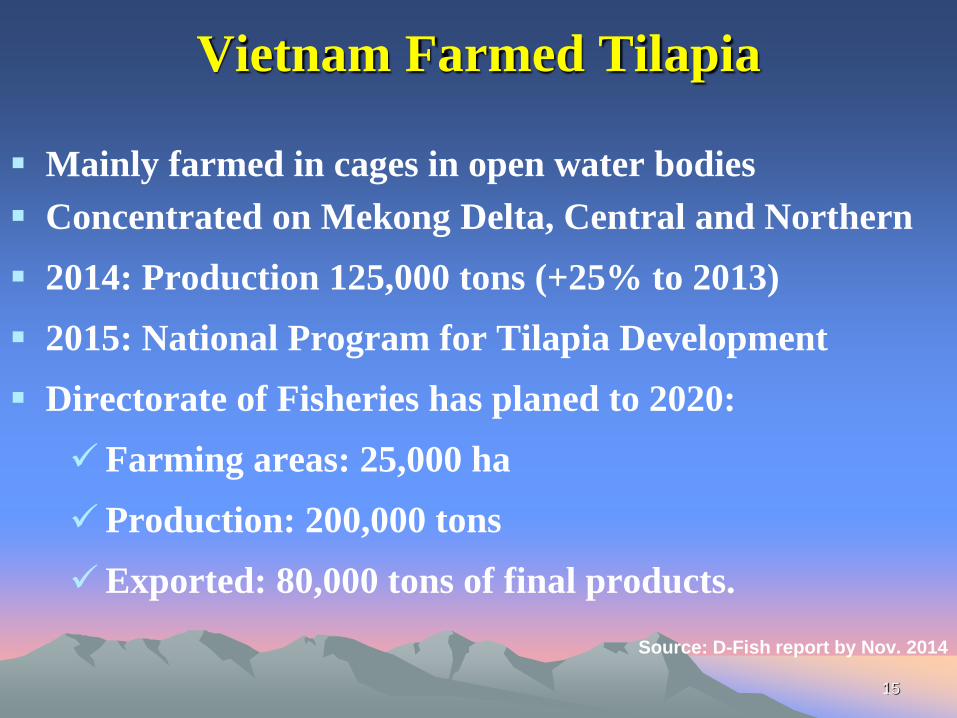
Vietnam Farmed Tilapia
Mainly farmed in cages in open water bodies
Concentrated on Mekong Delta, Central and Northern
2014: Production 125,000 tons (+25% to 2013)
2015: National Program for Tilapia Development
Directorate of Fisheries has planed to 2020:
Farming areas: 25,000 ha
Production: 200,000 tons
Exported: 80,000 tons of final products.
Source: D-Fish report by Nov. 2014

16
Brook-stock and Fingerlings
Production
• In 2014, total 236 tilapia seed production facilities
• Brood-stock: 44 facilities, annually 940,000 brook-stocks
• Resources of brook-stock: Mainly imported
• Fingerlings production: 455 millions (Northern
provinces have produced 173 millions)
• Mono-sex fingerlings quality is poor
• Not yet seed vaccination, quality and disease control

Tilapia Export Development, 2004-2014
17
Years Volume
(ton)
Export value
(USD)
Change
(%)
2004 974 1,946,196 -
2005 827 1,691,555 -13.1
2006 812 1,699,994 0.5
2007 412 1,092,550 -35.7
2008 480 1,258,179 15.2
2009 536 1,511,940 20.2
2010 848 2,563,928 69.6
2011 - 2,289,512 -10.7
2012 - 4,043,158 76.6
2013 - 9,794,643 142.3
2014 - 35,784,642 265.3

18
Vietnam’ Tilapia Export 2004-2014
0 -13.1
0.5 -35.7
15.2 20.2
69.6
-10.7
76.6
142.3
265.3
-100
-50
0
50
100
150
200
250
300
0
5
10
15
20
25
30
35
40
2004 2005 2006 2007 2008 2009 2010 2011 2012 2013 2014
USD million %
Value Change (%)
19
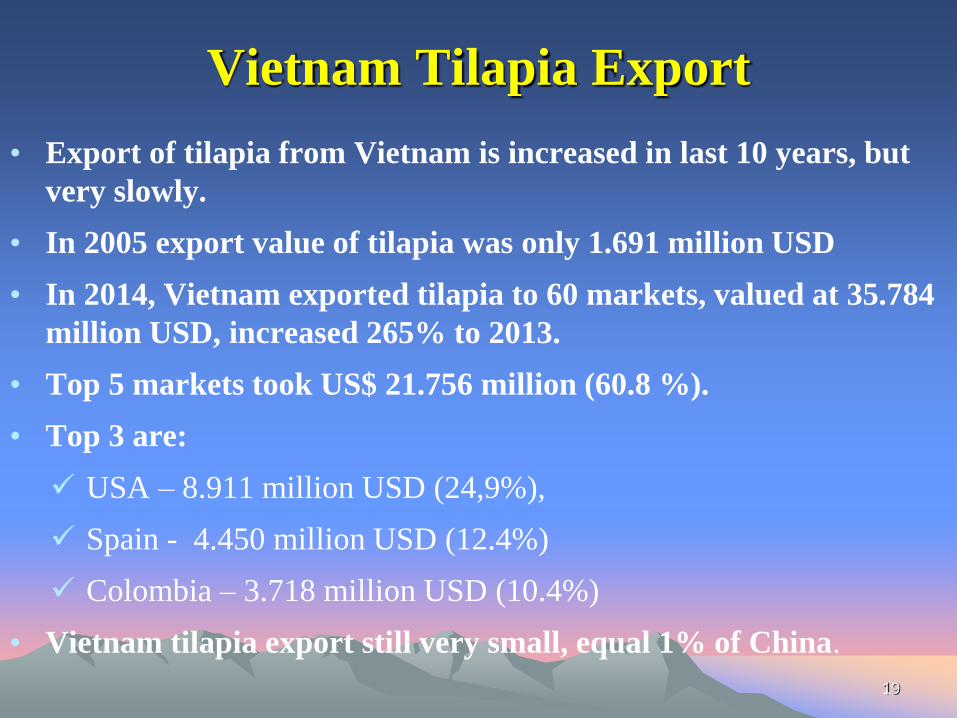
Vietnam Tilapia Export
• Export of tilapia from Vietnam is increased in last 10 years, but
very slowly.
• In 2005 export value of tilapia was only 1.691 million USD
• In 2014, Vietnam exported tilapia to 60 markets, valued at 35.784
million USD, increased 265% to 2013.
• Top 5 markets took US$ 21.756 million (60.8 %).
• Top 3 are:
USA – 8.911 million USD (24,9%),
Spain - 4.450 million USD (12.4%)
Colombia – 3.718 million USD (10.4%)
• Vietnam tilapia export still very small, equal 1% of China.
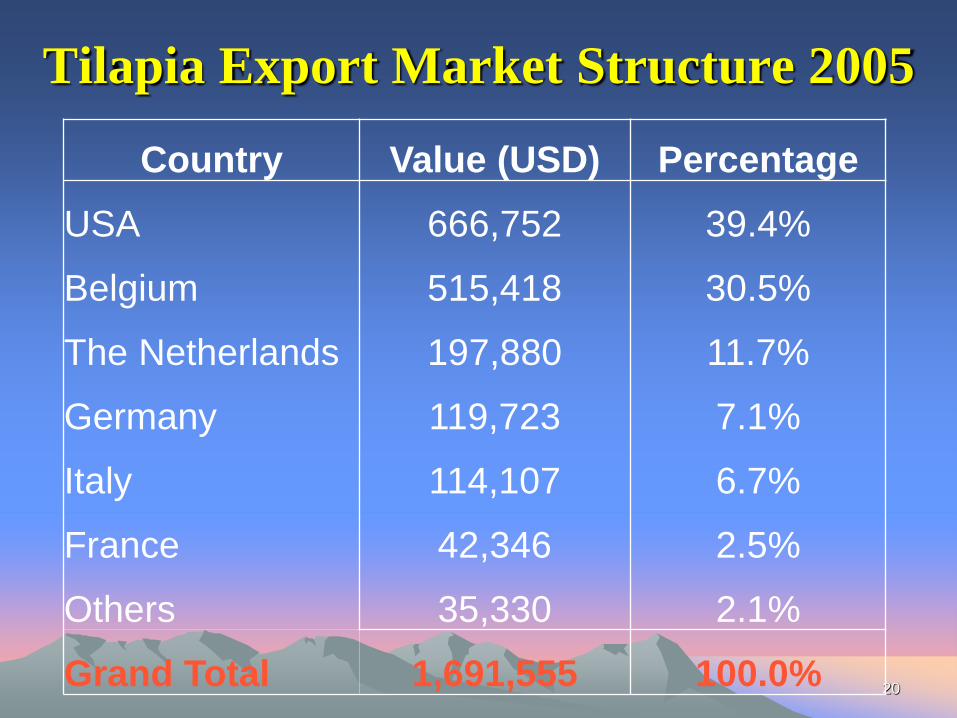
Tilapia Export Market Structure 2005
20
Country Value (USD) Percentage
USA 666,752 39.4%
Belgium 515,418 30.5%
The Netherlands 197,880 11.7%
Germany 119,723 7.1%
Italy 114,107 6.7%
France 42,346 2.5%
Others 35,330 2.1%
Grand Total 1,691,555 100.0%

21
Tilapia Export Market Structure 2005
USA 39.4%
Belgium 30.5%
Netherlands 11.7%
Germany 7.1%
Italy 6.7%
France 2.5%
Others 2.1%

22
Number of Tilapia Export Markets
11 8
15 12 13
17
22 23
36
52
66
0
10
20
30
40
50
60
70
2004 2005 2006 2007 2008 2009 2010 2011 2012 2013 2014
Số TT NK cá rôphi qua các năm từ 2004 - 2014
Series2
11 8
15 12 13
17 22 23
36
52
66
0
10
20
30
40
50
60
70
2004 2005 2006 2007 2008 2009 2010 2011 2012 2013 2014
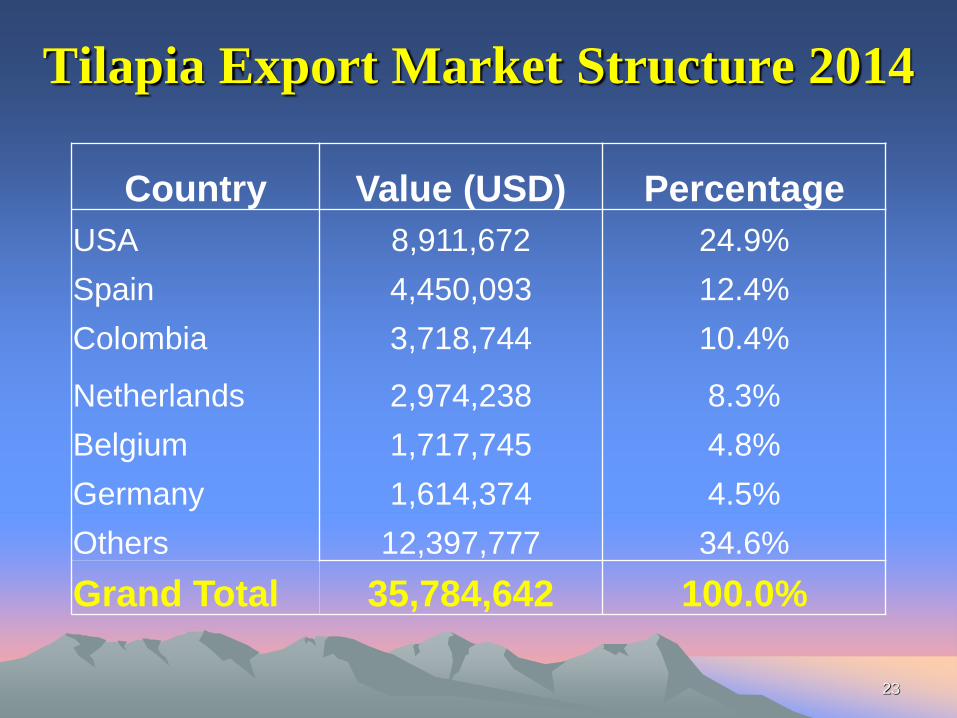
Tilapia Export Market Structure 2014
23
Country Value (USD) Percentage
USA 8,911,672 24.9%
Spain 4,450,093 12.4%
Colombia 3,718,744 10.4%
Netherlands 2,974,238 8.3%
Belgium 1,717,745 4.8%
Germany 1,614,374 4.5%
Others 12,397,777 34.6%
Grand Total 35,784,642 100.0%

24
Tilapia Export Market Structure 2014
USA 24.9%
Spain 12.4%
Colombia 10.4% Netherlands
8.3%
Belgium 4.8%
Germany 4.5%
Others 34.6%

25
• Strong & dynamic farming and processing capacities
• Rich experiences in pangasius industry, easier
shifted to tilapia
• Large and still clean water environment
• International feed industry in country
• Young and skillful labor forces
• Existing large partners in different markets
• Improved aquaculture management policy.
Vietnam Tilapia Advantages

Vietnam Tilapia Challenges
Un-controlled environment of open water bodies
Shifting farm cage to the modern earth pond model
Controlling production in an ecological region
Quality of brook-stock and mono-sex fingerlings
Lacking vaccines to prevent diseases
Increased feed price and main input raw materials
Lacking a well designed and managed program
Lacking guaranteed better price between certified
and non-certified products
Social responsibility to surrounding communities
26
27
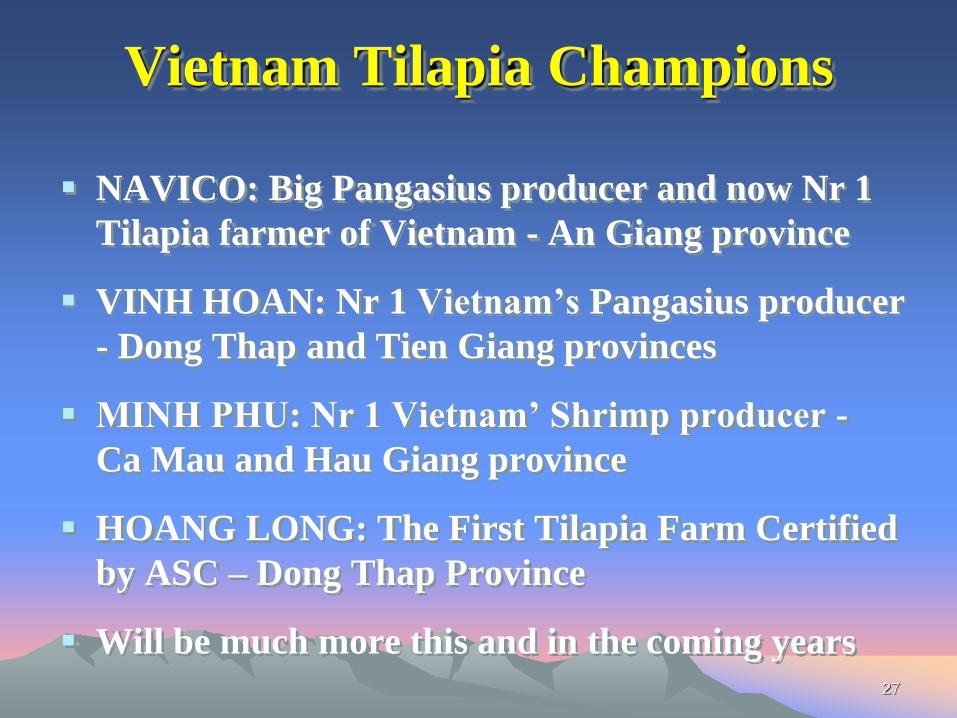
NAVICO: Big Pangasius producer and now Nr 1
Tilapia farmer of Vietnam - An Giang province
VINH HOAN: Nr 1 Vietnam’s Pangasius producer
- Dong Thap and Tien Giang provinces
MINH PHU: Nr 1 Vietnam’ Shrimp producer -
Ca Mau and Hau Giang province
HOANG LONG: The First Tilapia Farm Certified
by ASC – Dong Thap Province
Will be much more this and in the coming years
Vietnam Tilapia Champions
28
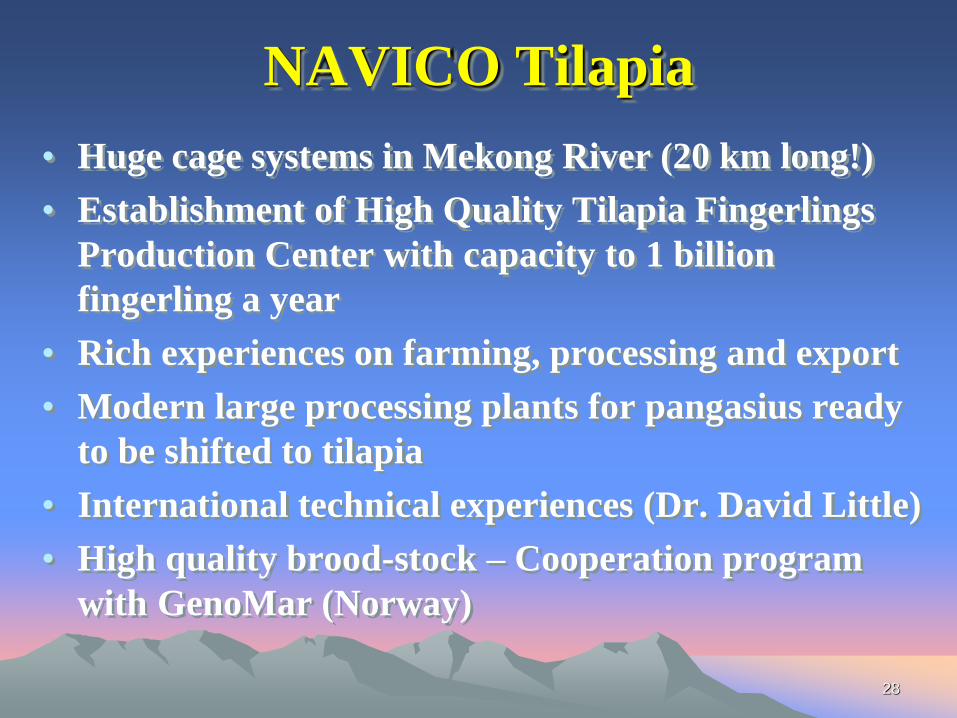
• Huge cage systems in Mekong River (20 km long!)
• Establishment of High Quality Tilapia Fingerlings
Production Center with capacity to 1 billion
fingerling a year
• Rich experiences on farming, processing and export
• Modern large processing plants for pangasius ready
to be shifted to tilapia
• International technical experiences (Dr. David Little)
• High quality brood-stock – Cooperation program
with GenoMar (Norway)
NAVICO Tilapia
29
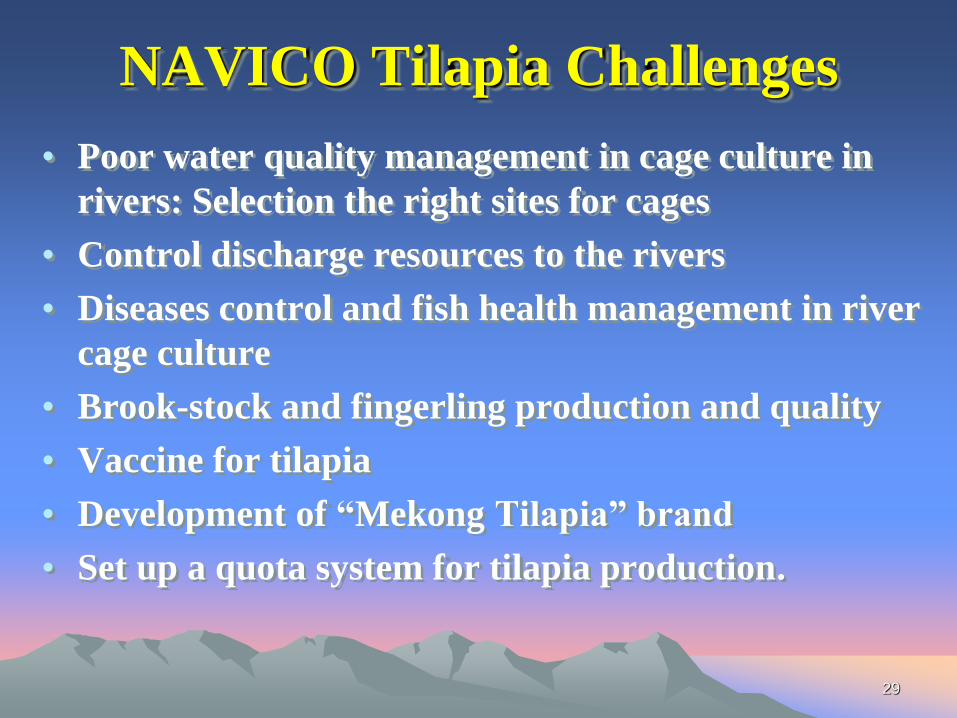
• Poor water quality management in cage culture in
rivers: Selection the right sites for cages
• Control discharge resources to the rivers
• Diseases control and fish health management in river
cage culture
• Brook-stock and fingerling production and quality
• Vaccine for tilapia
• Development of “Mekong Tilapia” brand
• Set up a quota system for tilapia production.
NAVICO Tilapia Challenges

30
Thank You and Let’s Working Together!
Vietnam Association of Seafood Exporters & Producers (VASEP)
Headquarter: # 218 Lot A. 6th Str. An Phu - An Khanh. Dist. 2. Ho Chi Minh City
Gov. Relations Office: 10 Nguyen Cong Hoan str.. Ba Dinh dist.. Ha Noi. Vietnam
Tel: +84 437 715 055 • Fax: +84 437 715 084 • Email: [email protected]
Website: www.vasep.com.vn; www.pangasius-vietnam.com; www.vietfish.org