Embed Size (px)
Citation preview

University of Liege, Belgium
Faculty of Applied Sciences GIGA-Cardiovascular Sciences
Thermodynamics of Irreversible Processes
Tight Glycaemic Control
Model-based methods to answer critical questions about this controversial therapy
By Sophie Penning Biomedical Engineer
Supervised by Thomas Desaive
A thesis submitted in fulfilment of the requirements for the degree of Doctor of Philosophy in Engineering Sciences
July 2014

II
The present dissertation has been evaluated by the jury members:
Dr. T. Desaive, supervisor, University of Liege, Liege, Belgium
Pr. R. Sepulchre, co-supervisor, University of Liege, Liege, Belgium
Pr. J.G. Chase, University of Canterbury, Christchurch, New Zealand
Pr. P.C. Dauby, University of Liege, Liege, Belgium
Pr. B. Lambermont, University Hospital of Liege, Liege, Belgium
Pr. J.-C. Preiser, Erasme Hospital, Brussels, Belgium
Pr. D. Ernst, University of Liege, Liege Belgium
Cover picture: © 2013 Microsoft Corporation
The research described in the present dissertation was financially supported by the National Funds
for Scientific Research (Belgium) and the Fonds Léon Fredericq (Belgium).
Copyright © 2014 Sophie Penning
III
Abstract
Critically ill patients often present high and variable glycaemic levels, and low insulin sensitivity,
all associated with worsened patient outcome. Glycaemic control aims to reduce and stabilise
glycaemic levels minimising hypoglycaemic risk. Model-based protocols can provide a safe,
effective way to manage inter- and intra- patient variability and allow customised and patient-
specific glycaemic control approach. Developing safe and effective model-based protocols that fit
within practical clinical workflow is thus today’s great challenge. This thesis develops answers to
three key questions related to glycaemic control implementation in intensive care units.
What do intensive care clinicians want in glycaemic control?
This research shows that there is a real need for computerised protocols and emerging interest for
model-based protocols with prediction capability. Whatever the protocol type, glycaemic control
protocols should be designed to meet intensive care staff expectations. The four main protocol
elements expected are safety, efficiency, ease-of-use and adaptive control. All these elements with
published clinical studies related to a glycaemic control protocol help to enhance trust in glycaemic
control. The opportunity to realise pilot clinical trials in their own intensive care unit also enhances
clinician trust.
What is the best glycaemic target to achieve during glycaemic control?
This research provides insight on two primary issues that impede glycaemic control implementation
in intensive care units. First, the “cumulative time in band” metric is defined to assess glycaemic
control performance in real time. The single metric encapsulates the need to achieve control of both
glycaemic level and variability, as well as linking the level of achievement to patient outcome over
each day of stay. Second, this research shows that increased cumulative time in an intermediate
IV
glycaemic band (4.0-7.0 mmol/L) is associated with higher odds of living if hypoglycaemia is
avoided. This finding suggests that effective glycaemic control positively influences patient
outcome, regardless of how this control is achieved.
How to achieve safe and effective glycaemic control?
This thesis focuses on the implementation of the STAR framework in intensive care units at the
Centre Hospitalier Universitaire in Liege, Belgium. STAR is a model-based glycaemic control
framework accounting for evolving physiological patient condition. STAR enables a glycaemic
control that fits clinical practice and meets clinician requirements, as it can be customised for
clinically specified glycaemic targets, control approaches, and clinical resources. Virtual trials are
used to develop and optimise the STAR framework and then clinical trials are performed to assess
STAR performance in real, clinical conditions.
The first implementation of the STAR framework is associated with safe, effective glycaemic
control, but with increased clinical workload. This first pilot trial also shows a high level of insulin
sensitivity variability in this Belgian group of primarily cardiovascular patients compared to
medical intensive care patients. Based on these issues, the STAR framework is improved to enhance
its performance and usability in a real, clinical environment.
The second implementation of the STAR framework successfully reduces clinical workload, while
maintaining control quality and safety. However, this second pilot trial highlights a “lack of trust”
in the protocol recommendations and showed that nurses were reluctant to insulin rate changes.
The main objective of the third STAR implementation is thus to improve nurse compliance to
protocol recommendations, while maintaining glycaemic control efficiency and safety. An analysis
is then performed to understand why nursing staff do not follow GC protocol recommendations in
the medical ICU where the next pilot trial will be performed. Results show that nurses are not
compliant with a protocol that does not account for patient variability. This finding suggests that
STAR that accounts for this variability could enhance glycaemic control performance. Virtual
results show that this enhanced STAR framework should provide safe, effective glycaemic control,
at acceptable workload.
Finally, this thesis presents the interest of implementing glycaemic control in association with
hyper-insulinemia euglycaemia therapy to safely optimise insulin and glucose dosing. More data
and subsequent studies are required to more accurately determine whether the STAR approach has
to be adapted for patients receiving high insulin doses, and to deeply study insulin clearance
processes during the hyper-insulinemia euglycaemia therapy.

V
Résumé
Les patients hospitalisés dans les unités de soins intensifs présentent souvent des niveaux de
glycémie élevés et variables, ainsi qu’une faible sensibilité à l’insuline, qui sont associés à une issue
clinique plus défavorable. Le contrôle glycémique vise à réduire et stabiliser les niveaux
glycémiques, tout en minimisant le risque d’hypoglycémie. Les protocoles de contrôle basés sur
des modèles offrent un moyen sûr et efficace de gérer la variabilité inter- et intra- patient et
permettent un contrôle glycémique adaptable et spécifique à chaque patient. Le développement de
ce type de protocoles est actuellement un défi important. Cette thèse apporte des réponses à trois
grandes questions relatives à l’application du contrôle glycémique en milieu hospitalier.
Que souhaitent les médecins des soins intensifs ?
Cette thèse met en évidence le besoin de protocoles informatisés et l’intérêt grandissant pour les
protocoles basés sur des modèles et utilisant des prédictions. Tout protocole de contrôle glycémique
devrait être conçu afin de rencontrer les attentes du personnel clinique. Les quatre éléments
souhaités sont la sécurité, l’efficacité, la facilité d’utilisation et l’adaptabilité. Tous ces éléments,
ainsi que la publication d’études cliniques relatives à l’application d’un protocole, augmentent la
confiance des médecins dans un protocole de contrôle glycémique. Cette confiance est également
accrue par la possibilité de réaliser un essai clinique pour tester le protocole en milieu hospitalier.
Quelle est le niveau glycémique optimal à atteindre durant le contrôle glycémique ?
Tout d’abord, une nouvelle mesure est définie pour évaluer la performance du contrôle glycémique
en temps réel : le temps cumulé dans une bande glycémique donnée. Cette mesure permet, à elle
seule, d’évaluer les niveaux glycémiques et leur variabilité, ainsi que l’issue clinique des patients.
Ensuite, cette recherche montre qu’une augmentation du temps cumulé passé dans la bande

VI
glycémique 4.0-7.0 mmol/L est associée à de meilleures chances de survie si le risque
d’hypoglycémie est minimisé. Ce résultat suggère qu’un contrôle glycémique efficace est bénéfique
pour l’issue clinique des patients, indépendamment de la manière dont le contrôle est réalisé.
Comment arriver à un contrôle glycémique sûr et efficace ?
Cette thèse se concentre sur l’application de la méthode de contrôle glycémique STAR dans des
unités de soins intensifs du Centre Hospitalier Universitaire de Liège (Belgique). La méthode
STAR, basée sur des modèles et utilisant des prédictions, prend en compte l’évolution de la
condition clinique du patient. Cette méthode permet un contrôle glycémique en adéquation avec la
pratique clinique locale et qui rencontre les attentes des médecins. Le développement et
l’optimisation de la méthode STAR sont réalisés avec des essais virtuels. Ensuite, des essais
cliniques permettent d’évaluer la performance de cette méthode en situation réelle.
La première application de STAR est associée à un contrôle glycémique sûr et efficace mais à une
charge de travail importante. Ce premier essai clinique met également en évidence une variabilité
importante de la sensibilité à l’insuline des patients belges hospitalisés suite à une opération
cardiovasculaire. La méthode STAR est alors améliorée pour la rendre plus performante et plus
aisément applicable en milieu clinique.
La deuxième application de STAR réduit avec succès la charge de travail du personnel, tout en
maintenant la qualité et la sécurité du contrôle glycémique. Cependant, cet essai clinique montre un
manque de confiance du personnel infirmier par rapport aux recommandations du protocole.
L’objectif de la troisième application de STAR est donc d’augmenter la compliance du personnel
infirmier en garantissant un contrôle glycémique efficace et sûr. Une analyse de compliance est
alors réalisée dans l’unité de soins intensifs dans laquelle aura lieu le prochain essai clinique. Cette
analyse montre que les recommandations d’un protocole ne sont pas toujours suivies si ce dernier
ne permet pas de gérer efficacement la variabilité des patients. STAR, qui prend en compte cette
variabilité, pourrait donc permettre un contrôle plus efficace. Les essais virtuels confirment que
STAR permettrait un contrôle glycémique sûr et efficace, avec une charge de travail acceptable.
Enfin, cette thèse présente l’intérêt d’appliquer le contrôle glycémique en association avec la
thérapie du clamp euglycémique hyperinsulinique pour optimiser les dosages d’insuline et de
nutrition. Davantage de données et d’études sont nécessaires pour déterminer avec précision si la
méthode de contrôle STAR doit être adaptée pour les patients recevant des doses importantes
d’insuline, ainsi que pour étudier plus en profondeur les processus d’élimination de l’insuline durant
le clamp euglycémique hyperinsulinique.

VII
Acknowledgements
First, I would like to thank my supervisor, Thomas Desaive, for believing in my research project.
Throughout my thesis, he shared his scientific experience and introduced me to the scientific and
medical fields related to my research. His scientific collaboration with the Professor Geoff Chase
gave me the unique opportunity to work with a research group that is considered as expert in my
research topic, and to improve my knowledge.
I would also like to thank Geoff Chase for his scientific insight on my research, his constructive
criticism, his involvement in my research whatever the time of the day or the night, and his
welcoming of me to his department in New-Zealand.
Many thanks to Chris Pretty for his advice and the time he spent reviewing my drafts throughout
my thesis. He helped me in dealing with practical aspects of my stay abroad and was a great guide,
inside and outside the university environment. His welcoming and kindness made my stay in New
Zealand more enjoyable.
I also gratefully thank Pierre Dauby for giving me the opportunity of supervising his students and
for his continued enthusiasm.
I would like to thank Hugues Maréchal, Jean-Charles Preiser, Paul Massion and Bernard
Lambermont from the University Hospital of Liege and Erasme Hospital of Brussels for believing
in my project and giving me the unique opportunity of working in a real, clinical environment.
Many thanks to my colleagues at the University of Liege who all contributed to create a pleasant
working environment. In particular, I would like to thank Alexandra Lucas who gave me her support
at the beginning of my research and shared her daily happiness with me. I would like to thank
Sabine and Sarah, who became my friends during our working hours. I thank them for making my
office a friendship environment. I thank them for all their personal advice, for sharing their life with
me during all these months and for encouraging me throughout my research, especially when I was
abroad.

VIII
I would like to thank Clémentine François, Capucine Lardinois and Charlotte De Bien for their
outstanding support and their friendship all the way through my time at university.
Finally, I thank all my family for their encouragement and support and most importantly, I thank
Antoine Pironet for his understanding, and for making my experience abroad an amazing time and
an enriching experience.

IX
Table of contents
Abstract .......................................................................................................................................... III
Résumé ............................................................................................................................................ V
Acknowledgements ...................................................................................................................... VII
Table of contents ............................................................................................................................ IX
List of figures ............................................................................................................................... XV
List of tables ............................................................................................................................... XVII
List of abbreviations .................................................................................................................... XIX
Chapter 1. Introduction .............................................................................................................. 1
Chapter 2. Background............................................................................................................... 3
2.1. Physiology of the glucose-insulin system ........................................................................ 3
2.1.1. Metabolic processes ...................................................................................................... 4
2.1.2. Hyperglycaemia - Insulin action ................................................................................... 6
2.1.3. Hypoglycaemia - Glucagon (and epinephrine) action .................................................. 7
2.2. Stress-induced hyperglycaemia and insulin sensitivity in critically ill patients ............... 7
2.2.1. Critical illness ............................................................................................................... 8
2.2.2. Treatment .................................................................................................................... 12
2.2.3. Nutrition ..................................................................................................................... 12
2.3. Glycaemic control in intensive care units....................................................................... 12
2.4. Model-based glycaemic control protocols ...................................................................... 14
2.5. Modelling of the glucose-insulin system ........................................................................ 15

X
2.5.1. Model 1 ....................................................................................................................... 16
2.5.2. Model 2 ....................................................................................................................... 18
2.5.3. Model 3 ....................................................................................................................... 19
2.5.4. Insulin sensitivity ........................................................................................................ 20
2.5.5. Stochastic model of insulin sensitivity variability ...................................................... 21 2.6. STAR, a model-based glycaemic control approach ....................................................... 22
2.7. Virtual trials ................................................................................................................... 25
2.7.1. Identification of insulin sensitivity ............................................................................. 26
2.7.2. Simulation ................................................................................................................... 26
2.7.3. Data analysis ............................................................................................................... 27
2.8. Clinical trials .................................................................................................................. 29
2.9. Summary ........................................................................................................................ 30
Chapter 3. What do clinicians want in glycaemic control? ..................................................... 31
3.1. Introduction .................................................................................................................... 31
3.2. Method ........................................................................................................................... 32
3.3. Results ............................................................................................................................ 33
3.3.1. Characteristics of responding ICUs ............................................................................ 33
3.3.2. Glycaemic control in ICU ........................................................................................... 34
3.3.3. ICU clinician expectations and opinions about glycaemic control ............................. 35
3.3.4. Processes related to GC implementation in ICUs ....................................................... 36 3.4. Discussion ...................................................................................................................... 37
3.5. Summary ........................................................................................................................ 40
Chapter 4. What is the best glycaemic target to achieve during glycaemic control? .............. 43
4.1. State of the art ................................................................................................................ 44
4.2. Glycaemic target band: performance metric and level .................................................. 45
4.2.1. Introduction ................................................................................................................. 45
4.2.2. Method ........................................................................................................................ 45
4.2.3. Results ......................................................................................................................... 48
4.2.4. Discussion ................................................................................................................... 48
4.3. Impact of glycaemic target on organ failure .................................................................. 52

XI
4.3.1. Introduction ................................................................................................................ 52
4.3.2. Method ........................................................................................................................ 52
4.3.3. Results ........................................................................................................................ 56
4.3.4. Discussion................................................................................................................... 59
4.4. Summary ........................................................................................................................ 61
Chapter 5. How to achieve glycaemic control in intensive care unit settings? First pilot trial 63
5.1. Introduction .................................................................................................................... 63
5.2. Virtual trials .................................................................................................................... 64
5.2.1. Patient cohort .............................................................................................................. 64
5.2.2. STAR protocol framework ......................................................................................... 65
5.2.3. STAR-Liege 1 protocol .............................................................................................. 66
5.2.4. Results ........................................................................................................................ 68 5.3. Clinical trials .................................................................................................................. 69
5.3.1. Patients ....................................................................................................................... 70
5.3.2. GC performance ......................................................................................................... 71
5.3.3. Prediction performance .............................................................................................. 75
5.3.4. Nurse compliance ....................................................................................................... 75
5.3.5. Discussion................................................................................................................... 76 5.4. Summary ........................................................................................................................ 78
Chapter 6. How to resolve the issues of the glycaemic control clinical implementation?
Enhanced glycaemic control approach ........................................................................................... 81
6.1. Improvement of the stochastic model ............................................................................. 82
6.1.1. Introduction ................................................................................................................ 82
6.1.2. Method ........................................................................................................................ 82
6.1.3. Results ........................................................................................................................ 83
6.1.4. Discussion................................................................................................................... 84 6.2. Improvement of the STAR framework ........................................................................... 86
6.2.1. Reduction of measurement frequency ........................................................................ 86
6.2.2. Improvement of the targeting method ........................................................................ 86 6.3. Enhancement of insulin kinetic modelling ..................................................................... 87
6.4. New enhanced STAR protocol framework .................................................................... 87
6.5. Summary ........................................................................................................................ 89
Chapter 7. How to improve glycaemic control implementation in intensive care settings?
Second pilot trial ............................................................................................................................ 91
XII
7.1. Introduction .................................................................................................................... 91
7.2. Virtual trials ................................................................................................................... 92
7.2.1. Patient cohort .............................................................................................................. 92
7.2.2. STAR-Liege 2 protocol ............................................................................................... 92
7.2.3. Results ......................................................................................................................... 92
7.3. Clinical trials .................................................................................................................. 93
7.3.1. Patients ........................................................................................................................ 94
7.3.2. Change in SL2 protocol .............................................................................................. 95
7.3.3. GC performance .......................................................................................................... 95
7.3.4. Nurse compliance ........................................................................................................ 99
7.3.5. Discussion ................................................................................................................... 99
7.4. Summary ...................................................................................................................... 102
Chapter 8. Why do nursing staff not follow glycaemic control protocol recommendations? 103
8.1. Patient cohort: medical ICU cohort ............................................................................. 103
8.2. Clinical protocol ........................................................................................................... 104
8.3. Compliance analysis .................................................................................................... 106
8.3.1. Specific rule 1: patient variability ............................................................................. 106
8.3.2. Specific rule 2: stop in nutrition ................................................................................ 108
8.3.3. General rules ............................................................................................................. 108
8.4. Summary ...................................................................................................................... 114
Chapter 9. How to ensure good nursing compliance, and safe and effective glycaemic control?
Third pilot trial ............................................................................................................................. 115
9.1. Virtual trials ................................................................................................................. 116
9.1.1. Patient cohorts ........................................................................................................... 116
9.1.2. STAR protocol framework ........................................................................................ 116
9.1.3. STAR-Liege 3 protocol ............................................................................................. 118
9.1.4. Results ....................................................................................................................... 119 9.2. Clinical trials ................................................................................................................ 122
9.3. Summary ...................................................................................................................... 123
Chapter 10. Extreme case glycaemic control: Hyper-Insulinemia Euglycaemia Therapy ...... 125
10.1. HIET as treatment for cardiogenic shock..................................................................... 125

XIII
10.1.1. Consequences of cardiogenic shock ......................................................................... 125
10.1.2. Insulin beneficial effects ........................................................................................... 126
10.2. HIET clinical protocol .................................................................................................. 128
10.3. Implementation of GC with HIET ................................................................................ 129
10.4. HIET patient cohort ...................................................................................................... 130
10.5. Assessment of model for HIET patients ....................................................................... 131
10.5.1. Method ...................................................................................................................... 131
10.5.2. Results ...................................................................................................................... 131
10.5.3. Discussion................................................................................................................. 133 10.6. Summary ...................................................................................................................... 135
Chapter 11. Conclusion and future work ................................................................................. 137
Appendix 1. Questionnaire ........................................................................................................ 143
Part 1 ......................................................................................................................................... 143
Part 2 ......................................................................................................................................... 143
Part 3 ......................................................................................................................................... 143
Part 4 ......................................................................................................................................... 144
Part 5 ......................................................................................................................................... 144
References .................................................................................................................................... 147
Executive summary .......................................................................................................................... 2

XIV

XV
List of figures
Figure 2-1: Simplified representation of glucose metabolism. ......................................................... 5
Figure 2-2: Glycolysis and pyruvic acid uses. .................................................................................. 5
Figure 2-3: Insulin-mediated glucose uptake mechanism. ............................................................... 9
Figure 2-4: Self-sustainment of stress-induced hyperglycaemia during critical illness. ................ 11
Figure 2-5: Self-sustainment of stress-induced hyperglycaemia due to reduced insulin sensitivity.
........................................................................................................................................................ 11
Figure 2-6: Multi-compartment model of insulin and glucose kinetics and dynamics. ................. 17
Figure 2-7: Schematic illustration of the stochastic model of the insulin sensitivity variability. ... 22
Figure 2-8: STAR GC system approach. ........................................................................................ 23
Figure 2-9: Virtual trial process. .................................................................................................... 25
Figure 2-10: Process of insulin sensitivity identification. .............................................................. 26
Figure 2-11: Simulation process. .................................................................................................... 27
Figure 2-12: Clinical trial process. ................................................................................................. 29
Figure 3-1: Per-country repartition of survey respondents. ............................................................ 34
Figure 3-2: Selection criterion for GC systems. ............................................................................. 37
Figure 4-1: Number of remaining patients over days of ICU stay. ................................................ 46
Figure 4-2: OL for each glycaemic band and threshold value during ICU stay. ............................ 49
Figure 4-3: OR for each glycaemic band and threshold value during ICU stay. ............................ 50
Figure 4-4: Patient process selection details................................................................................... 54
Figure 4-5: Proportion of patients with SOFA score ≤ 5 over time in Groups A and B. ............... 57
Figure 4-6: Left: Conditional probability of SOFA score and cTIB; Right: Probability of cTIB ≥ 50
% for each patient group................................................................................................................. 58
Figure 4-7: Joint probabilities of SOFA score and cTIB. ............................................................... 58
Figure 4-8: OR over the first 14 days of ICU stay for cTIB ≥ 50 %. ............................................. 59
Figure 5-1: STAR protocol framework for its first implementation at the CHU of Liege. ............ 67

XVI
Figure 5-2: CDFs of BG levels (left panel), exogenous insulin rate (middle panel) and exogenous
glucose rate (right panel), defined for the whole cohort, for the SL1 virtual trial. ........................ 70
Figure 5-3: Median (dashed line), 25-75 % (dark blue area) and 5-95 % (light blue area) intervals
for per-patient BG CDFs defined on whole cohort, where the pink area is the target band. ......... 72
Figure 5-4: CDFs of BG levels (left panel), exogenous insulin rate (middle panel) and exogenous
glucose rate (right panel), defined for the whole cohort, for the SL1 clinical trial. ....................... 72
Figure 5-5: STAR trial progression for Patient 3 in terms of BG levels (top) and model-based insulin
sensitivity (bottom). ....................................................................................................................... 77
Figure 5-6: STAR trial progression for Patient 6 in terms of insulin rates with a constant nutritional
administration rate. ........................................................................................................................ 78
Figure 6-1: STAR protocol framework for its second implementation at CHU of Liege. ............ 89
Figure 7-1: CDFs of BG levels (left panel), exogenous insulin rate (middle panel) and exogenous
glucose rate (right panel), defined for the whole cohort, for the SL2 virtual trial. ........................ 94
Figure 7-2: CDFs for BG levels (left panel), exogenous insulin rates (middle panel) and exogenous
glucose rate (right panel), defined for the whole cohort, for the SL2 clinical trial. ....................... 97
Figure 7-3: CDF for BG levels for the 24-hour pre-trial, during trial and post-trial for SL2 clinical
trial. ................................................................................................................................................ 98
Figure 8-1: Quantification of deviations in insulin rate. .............................................................. 109
Figure 9-1: CDFs for BG levels (left panel), exogenous insulin rates (middle panel) and exogenous
glucose rate (right panel), defined for the whole cohort, for the SL3 virtual trial. ...................... 121
Figure 10-1: Effects of insulin. .................................................................................................... 126
Figure 10-2: Evolution of plasma insulin concentration during HIET, simulated and measured
assays. .......................................................................................................................................... 132
Figure 10-3: Evolution of plasma insulin concentration during HIET – Comparison with simulated
and measured values, and steady state values. ............................................................................. 134

XVII
List of tables
Table 2-1: Effects of counter-regulatory hormones and cytokines on the genesis of stress-induced
hyperglycaemia and the decrease in insulin sensitivity. ................................................................. 10
Table 2-2: Parameter values for Model 1. ...................................................................................... 17
Table 2-3: Parameter values for Model 2 and Model 3. ................................................................. 19
Table 3-1: Characteristics of responding ICUs and respondents.................................................... 34
Table 3-2: Characteristics of current GC practice. ......................................................................... 35
Table 3-3: Characteristics of current and desired protocol adjustment during GC. ....................... 36
Table 3-4: Characteristics of current and desired protocols for GC. .............................................. 36
Table 3-5: Analysis of processes related to GC implementation in ICUs. ..................................... 37
Table 4-1: SPRINT and Glucontrol cohort characteristics. ............................................................ 46
Table 4-2: Joint probabilities to link severity of organ failure and glycaemic outcome. ............... 54
Table 4-3: Characteristics of the 704 remaining patients. .............................................................. 55
Table 4-4: Characterisation of SOFA and BG data for all included patients. ................................ 56
Table 4-5: Number of patients over ICU stay in Group A and Group B, and assessment of Fisher
Exact test comparison of proportions with SOFA ≤ 5. ................................................................... 57
Table 5-1: Glucontrol virtual cohort characteristics. ...................................................................... 65
Table 5-2: Virtual trials results for the first implementation of STAR in a Belgian ICU. ............. 69
Table 5-3: Clinical details of included patients for the first implementation of STAR in Liege. .. 71
Table 5-4: Clinical trial results for the first implementation of STAR in Liege (whole cohort
statistics). ........................................................................................................................................ 73
Table 5-5: Clinical trial results for the first implementation of STAR in Liege (per-patient statistics).
........................................................................................................................................................ 74
Table 5-6: Prediction performance. ................................................................................................ 75
Table 6-1: New stochastic model definitions. ................................................................................ 83
Table 6-2: Prediction performance for new stochastic models. ..................................................... 84

XVIII
Table 6-3: Re-simulated clinical trial results for the improvement of the stochastic model (whole
cohort statistics). ............................................................................................................................ 85
Table 6-4: p-values to compare distribution of BG levels, insulin and nutrition rates between clinical
trial results and re-simulated clinical trial results using new SM 5. .............................................. 86
Table 7-1: Virtual trial results for the second implementation of STAR in Liege. ........................ 93
Table 7-2: Clinical details of included patients for the second implementation of STAR in Liege.
....................................................................................................................................................... 95
Table 7-3: Clinical trial results for the second implementation of STAR in Liege. ...................... 96
Table 7-4: Clinical trial results for the second implementation of STAR in Liege (per-patient
statistics). ....................................................................................................................................... 97
Table 7-5: Details where nurses overrode STAR recommendations during the second
implementation of STAR in Liege. .............................................................................................. 100
Table 8-1: Medical ICU cohort characteristics. ........................................................................... 104
Table 8-2: Clinical protocol used in the medical ICU at the University Hospital of Liege. ........ 105
Table 8-3: Compliance to the specific GC protocol rule related to patient variability management.
..................................................................................................................................................... 107
Table 8-4: Compliance to the specific GC protocol rule related to the management of stop in
nutrition. ....................................................................................................................................... 108
Table 8-5: Compliance to GC protocol general rules, for BG < 150 mg/dL. .............................. 110
Table 8-6: Compliance to GC protocol general rules, for BG ≥ 150 mg/dL. .............................. 111
Table 9-1: Virtual trial results for the third implementation of STAR in Liege. ......................... 120
Table 9-2: Whole cohort statistics for the third implementation of STAR in Liege, on the Glucontrol
cohort. .......................................................................................................................................... 122
Table 10-1: HIET patient cohort characteristics. ......................................................................... 130

XIX
List of abbreviations
AACE American association of clinical endocrinologists
ADA American diabetes association
APACHE Acute physiology and chronic health evaluation
ATP Adenosine triphosphate
BG Blood glucose
CCB Calcium channel blocker
CDF Cumulative density function
CHU Centre hospitalier universitaire
cTIB Cumulative time in band
CVS Cardiovascular surgery
FFA Free fatty acids
GC Glycaemic control
ICU Intensive care unit
IIT Intensive insulin therapy
IL-1 Interleukin-1
IOF Individual organ (component) failures
IQR Interquartile range
OFFD Organ failure free days
OL Odds of living
OR Odds ratio
SAPS Simplified acute physiology score
SL1 STAR-Liege 1
SL2 STAR-Liege 2
SL3 STAR-Liege 3
SOFA Sequential organ failure assessment
STAR Stochastic targeted
TNF-α Tumour necrosis factor-α

XX

1
Chapter 1. Introduction
Critically ill patients often present stress-induced hyperglycaemia and low insulin sensitivity, both
associated with worsened patient outcome. Glycaemic control (GC) aims to reduce and stabilise
blood glucose (BG) levels taking into account inter-patient variability, evolving physiological
patient condition (intra-patient variability) and minimising hypoglycaemic risk. GC has been shown
to improve patient outcome. But, in clinical practice, evolving patient condition, fear of
hypoglycaemia and increased nursing staff workload impede safe, effective GC implementation.
Safe and effective clinical protocols are thus required to provide beneficial GC.
Model-based protocols allow customised and patient-specific GC approach, and have been shown
to be able to provide tight GC for critically ill patients. Such protocols tend to provide a safe and
effective way to manage inter- and intra- patient variability. They can thus provide safe, effective
control to improve patient outcome and quality of care, while reducing cost. Developing safe and
effective model-based protocols that fit within practical clinical workflow is thus today’s great
challenge.
The successful development and adoption of GC system in intensive care unit (ICU) settings can
only be achieved if care is taken with regard to certain features. In particular, a GC system should:
1) meet ICU clinician expectations; 2) stabilise glycaemia in a glycaemic band associated with
improved patient outcome; and 3) provide a demonstrated safe and effective way to control patient
glycaemia.
The main objective of this thesis is thus to provide answers to three key questions associated with
the successful development and adoption of a GC approach:
What do ICU clinicians want in GC?
What is the best glycaemic target to achieve during GC?
How to achieve safe and effective GC?

2
Chapter 2 provides an overview of the glucose-insulin system, describes the particular situation of
critically ill patients and explains how GC can improve patient outcome. It also describes a validated
model of the glucose-insulin system and presents the model-based GC STAR approach used in this
thesis. This chapter also explains the virtual trial approach and the process of clinical trials.
Chapter 3 identifies ICU clinicians expectations related to GC in ICU settings. This chapter
provides key factors to help GC adoption by ICU staff and to ensure successful GC implementation.
Chapter 4 concerns the definition of an optimal glycaemic level to achieve during GC to improve
patient outcome. It also provides the definition of a metric to assess GC performance in real-time.
Chapter 5 to Chapter 9 present GC protocols whose in silico and in vivo implementation should
help to determine how an effective GC control should be performed and demonstrate the efficiency,
safety and performance of the STAR GC approach.
Chapter 10 presents a specific application of GC to manage intravenous insulin and glucose infusion
during hyper-insulinemia euglycaemia therapy (HIET).
The conclusions and future work are presented in Chapter 11.
3
Chapter 2. Background
This chapter first provides a physiological overview of the glucose-insulin regulatory system.
Second, it describes the particular situation of critically ill patients and explains how GC can
improve patient outcome. Its third focus is the mathematical modelling of the regulatory system of
glucose and insulin. In this research, three different clinically validated models have been used and
they are detailed in this chapter. The main parameter of all these models is insulin sensitivity. This
parameter varies significantly over time and is patient-specific. Its role and the method used to
account for this inter- and intra- patient variability are explained. The combination of a model of
the glucose-insulin regulatory system and a stochastic model of insulin sensitivity variability leads
to a new adaptive, safe and patient-specific GC system named STAR (Stochastic TARgeted). This
chapter also presents the overall model-based GC STAR approach used in this thesis. Finally,
virtual and clinical trial processes using this model-based approach are described.
2.1. Physiology of the glucose-insulin system
Glucose is an important source of energy for vital organs and is the primary fuel source used
throughout the body. In particular, the central nervous system only uses glucose as fuel. Glycaemia
is the concentration of glucose in the blood, i.e. the BG level, and is a physiological variable
resulting from the balance between exogenous input, endogenous production, and the use of glucose
for energy. To ensure relatively constant energy supply for the central nervous system, BG levels
are tightly regulated. The regulatory system is mainly based on the opposing action of two
pancreatic hormones released from cells in the islets of Langerhans in the pancreas: insulin, secreted
by beta cells and glucagon, secreted by alpha cells (Guyton and Hall, 2000; Tortora and Grabowski,
1994). Insulin and glucagon trigger metabolic processes to maintain normoglycaemia (normal BG
levels). More precisely, BG levels are reduced by insulin action and increased by glucagon action

4
(Guyton and Hall, 2000). Other hormones, such as glucocorticoids, epinephrine and growth
hormone, also influence glycaemia (Tortora and Grabowski, 1994).
In healthy patients, normal fasting BG levels are between 4.4 mmol/L and 6.1 mmol/L (Tortora and
Grabowski, 1994). High BG levels are termed as moderate (6.1-10.0 mmol/L) and severe (above
10.0 mmol/L) hyperglycaemia. In contrast, hypoglycaemia refers to low BG levels. Moderate
hypoglycaemia occurs when BG < 3.3 mmol/L and severe hypoglycaemia when BG < 2.2 mmol/L.
However, for critically ill patients, these definitions for normoglycaemia and hyperglycaemia are
still under debate (Mackenzie et al., 2005; Marik and Raghavan, 2004; Moghissi et al., 2009;
Wiener et al., 2008). An expert consensus (Moghissi et al., 2009) states that GC has to be started
when BG > 10.0 mmol/L. Marik and Raghavan (2004) suggest the initiation of an insulin infusion
in patients with a BG above 8.3 mmol/L.
2.1.1. Metabolic processes
The glycaemic regulatory system includes several metabolic processes that occur mainly in four
organs: the liver, the muscles, the adipose tissues and the kidneys (Figure 2-1). Glucose metabolic
processes can be categorised into glucose catabolic and anabolic processes.
Glucose catabolism refers to glucose degradation, and more widely to glucose use and storage.
Glucose catabolism is based on three main processes that are promoted by insulin action: glycolysis,
glycogenesis and lipogenesis.
1. Glycolysis is the transformation of glucose into adenosine triphosphate (ATP) and pyruvic
acid (Figure 2-2). This process occurs in all body cells and is the first step of cellular
respiration, which produces ATP to supply energy to cells. Without oxygen, pyruvic acid
is transformed into lactic acid that can stay in cells or can be transported to the liver via the
bloodstream, where it is retransformed into pyruvic acid. When oxygen is present in the
cell, pyruvic acid is used to produce large amounts of ATP, which corresponds to the
second step of cellular respiration.
2. Glycogenesis refers to the transformation of glucose into glycogen. This transformation
enables glucose storage as glycogen in hepatic (25 %) and muscular (75 %) cells.
3. Lipogenesis is the transformation of excess glucose into fats or lipids. When glycogen
storage sites are full, hepatic and adipose cells convert glucose into fatty acids. Fats can be
used with glycerol in the synthesis of triglycerides, which are then stored in adipose tissues.

5
Figure 2-1: Simplified representation of glucose metabolism.
Main processes shown are: (1) glycolysis; (2) glycogenesis; (3) lipogenesis; (4) glycogenolysis; (5) gluconeogenesis. Dashed arrows refer to inter-organ transport of substrates via bloodstream.
Figure 2-2: Glycolysis and pyruvic acid uses.
Blood glucose
Glucose Pyruvic acid Lactic acid (1)
(5) Amino acids
Glycerol
(5)
(5)
(1) Glucose Pyruvic acid Lactic acid
Glycerol Fat Triglycerides
(3)
Glucose Pyruvic acid Lactic acid
Glycogen
(2) (4) (1)
Amino acids
Bloodstream Adipose tissues
Kidneys
Muscles
Liver
Glucose Pyruvic acid Lactic acid
Glycogen
(2) (4)
Fat
(3)
(1)
(5)
Glycerol
Amino acids
(5)
(5)
Glucose 2 pyruvic acids
With oxygen
Without oxygen
ATP (Krebs cycle)
Lactic acid 2 NAD+ 2 NADH,H+
2 ADP 2 ATP

6
Glucose anabolism refers to endogenous glucose production via glycogenolysis or/and
gluconeogenesis using other substrates. These processes are mainly promoted by glucagon, but also
by counter-regulatory hormones and inflammatory mediators that also have anti-insulin effects.
4. Glycogenolysis refers to glucose synthesis from glycogen. This process uses glycogen
stored in the liver and muscles to supply energy. In the liver, the glucose produced is
released into the bloodstream and can be used by cells for glycolysis. In the muscle cells,
as the enzyme releasing glucose into the bloodstream is not in muscle cells, the glucose
produced is used directly by these cells in glycolysis and is transformed into pyruvic acid.
The pyruvic acid then either stays in the muscle cells and goes through the second cellular
respiration step, or it goes to the liver where it is converted into glucose during
gluconeogenesis. Muscular glycogen is thus an indirect source of BG.
5. During gluconeogenesis, BG can be produced from four different substrates: pyruvic acid,
lactic acid (converted into pyruvic acid), glycerol from lipolysis in adipose tissues, and
amino acids from proteolysis in muscles. Lipolysis and proteolysis are also promoted by
counter-regulatory hormones, increasing substrate supply for the gluconeogenesis. This
process occurs in the kidneys and liver, especially when stored glycogen resources are
exhausted.
These five processes promote BG balance, or homeostasis, as well as glucose use for energy.
Glucose anabolism, in particular, can lead to reduced muscle mass if glycogen stores are exhausted
or low. This derangement can occur frequently in critical illness due to the counter-regulatory action
of the stress response in these patients.
2.1.2. Hyperglycaemia - Insulin action
A rise in BG levels is detected by pancreatic beta cells that release insulin. This hormone acts in
the liver, adipose tissues and muscles, causing glucose to be transported from bloodstream into
cells, where insulin then stimulates glycolysis, glycogenesis and lipogenesis. Insulin action results
in increased glucose use and storage as glycogen or fats. Moreover, insulin inhibits glycogenolysis
in the liver and muscles, and hepatic gluconeogenesis, which thus suppresses endogenous glucose
production. Overall, insulin reduces BG levels. However, this action is modulated by insulin
sensitivity. Insulin sensitivity quantifies the whole body response to insulin. The lower the insulin
sensitivity, the lower the impact of insulin on glycaemia, all else equal. In the literature, the term
“insulin resistance” is often used, which implies that insulin action is reduced with increased insulin
resistance, equivalent to the reciprocal reduced insulin sensitivity.

7
2.1.3. Hypoglycaemia - Glucagon (and epinephrine) action
Hypoglycaemia is detected by pancreatic alpha cells that release glucagon, which has an anti-insulin
effect. Glucagon stimulates glycogenolysis in liver and muscles and hepatic gluconeogenesis
freeing glucose to raise BG levels, as the liver is the only organ able to release glucose into the
bloodstream. Glycogenolysis and gluconeogenesis allows glucose production from stored glycogen
and from pyruvic acid, lactic acid, amino acids and glycerol, respectively. This muscular and
hepatic cellular glucose production reduces the need for BG to produce energy and thus limits the
decrease of BG levels. Moreover, liver cells can also release endogenously produced glucose into
bloodstream, increasing BG levels, while muscular cells cannot. But, muscular glycogenolysis
products (pyruvic and lactic acids) and proteolysis products (amino acids) can be transported to the
liver to be used in gluconeogenesis. Thus, glycogen from muscle cells is an indirect source of BG.
When BG levels are low, epinephrine is also secreted. This hormone further promotes
glycogenolysis and gluconeogenesis, and thus raises BG levels. However, the action of epinephrine
can be neglected in comparison with glucagon action, as it is much less significant.
2.2. Stress-induced hyperglycaemia and insulin sensitivity in
critically ill patients
Critically ill patients often present stress-induced hyperglycaemia and low insulin sensitivity (Chase
et al., 2011b; Langouche et al., 2007; Lin et al., 2008; McCowen et al., 2001; Pretty et al., 2012).
Recent studies have shown that high BG levels and variability are each associated with an increased
risk of infectious complications, worsened patient outcomes and increased mortality (Bagshaw et
al., 2009; Egi et al., 2006; Krinsley, 2003; McCowen et al., 2001).
Stress-induced hyperglycaemia can be seen as a manifestation of stress response and be defined as
a transient hyperglycaemia resolving spontaneously after dissipation of acute illness (Dungan et al.,
2009; McCowen et al., 2001). The stress-induced hyperglycaemia is a result of reduced insulin
sensitivity and increased glucose appearance. Insulin sensitivity refers to the cell's insulin response
that characterises the cell’s ability for insulin-mediated glucose uptake. Reduced insulin sensitivity
is frequent in critically ill patients (Pretty et al., 2012) and is defined by impaired insulin-mediated
glucose uptake into insulin-sensitive tissues (tissues that require insulin to take up glucose, i.e. liver,
muscle and adipose tissues) (McCowen et al., 2001). Three main factors influence the development
and extent of the decrease in insulin sensitivity and the resulting hyperglycaemia in critically ill
patients: the stress associated with critical illness, the treatment and the nutrition (Dungan et al.,
2009; Pretty et al., 2011).
8
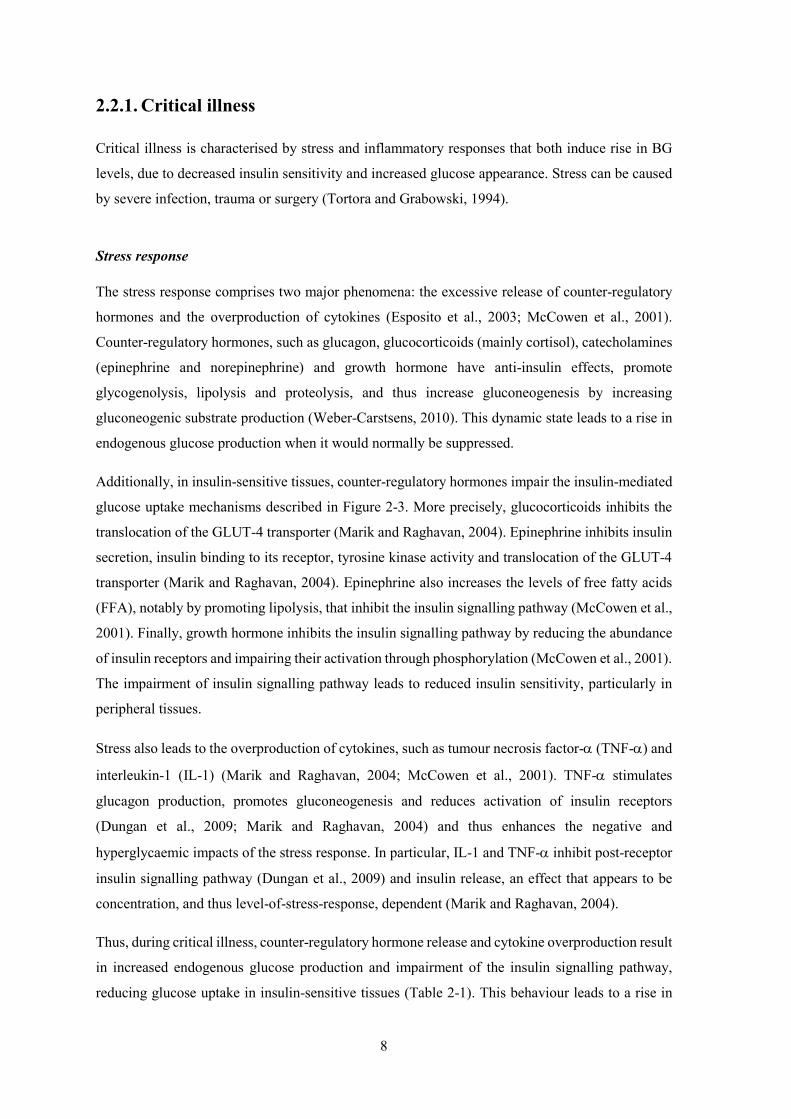
2.2.1. Critical illness
Critical illness is characterised by stress and inflammatory responses that both induce rise in BG
levels, due to decreased insulin sensitivity and increased glucose appearance. Stress can be caused
by severe infection, trauma or surgery (Tortora and Grabowski, 1994).
Stress response
The stress response comprises two major phenomena: the excessive release of counter-regulatory
hormones and the overproduction of cytokines (Esposito et al., 2003; McCowen et al., 2001).
Counter-regulatory hormones, such as glucagon, glucocorticoids (mainly cortisol), catecholamines
(epinephrine and norepinephrine) and growth hormone have anti-insulin effects, promote
glycogenolysis, lipolysis and proteolysis, and thus increase gluconeogenesis by increasing
gluconeogenic substrate production (Weber-Carstsens, 2010). This dynamic state leads to a rise in
endogenous glucose production when it would normally be suppressed.
Additionally, in insulin-sensitive tissues, counter-regulatory hormones impair the insulin-mediated
glucose uptake mechanisms described in Figure 2-3. More precisely, glucocorticoids inhibits the
translocation of the GLUT-4 transporter (Marik and Raghavan, 2004). Epinephrine inhibits insulin
secretion, insulin binding to its receptor, tyrosine kinase activity and translocation of the GLUT-4
transporter (Marik and Raghavan, 2004). Epinephrine also increases the levels of free fatty acids
(FFA), notably by promoting lipolysis, that inhibit the insulin signalling pathway (McCowen et al.,
2001). Finally, growth hormone inhibits the insulin signalling pathway by reducing the abundance
of insulin receptors and impairing their activation through phosphorylation (McCowen et al., 2001).
The impairment of insulin signalling pathway leads to reduced insulin sensitivity, particularly in
peripheral tissues.
Stress also leads to the overproduction of cytokines, such as tumour necrosis factor-α (TNF-α) and
interleukin-1 (IL-1) (Marik and Raghavan, 2004; McCowen et al., 2001). TNF-α stimulates
glucagon production, promotes gluconeogenesis and reduces activation of insulin receptors
(Dungan et al., 2009; Marik and Raghavan, 2004) and thus enhances the negative and
hyperglycaemic impacts of the stress response. In particular, IL-1 and TNF-α inhibit post-receptor
insulin signalling pathway (Dungan et al., 2009) and insulin release, an effect that appears to be
concentration, and thus level-of-stress-response, dependent (Marik and Raghavan, 2004).
Thus, during critical illness, counter-regulatory hormone release and cytokine overproduction result
in increased endogenous glucose production and impairment of the insulin signalling pathway,
reducing glucose uptake in insulin-sensitive tissues (Table 2-1). This behaviour leads to a rise in

9
BG levels (hyperglycaemia). However, an early increase in whole-body non-insulin-mediated
glucose uptake can also occur due to cytokine-mediated upregulation, defined as increased
synthesis, concentration or activity, of another glucose transporter, GLUT-1 (Dungan et al., 2009;
Marik and Raghavan, 2004). Therefore, much of the clearance of glucose during critical illness is
by tissues that do not depend on insulin (McCowen et al., 2001), but which also cannot match the
glucose produced or that given as nutritional support.
Insulin binds to its cell-surface receptor that becomes phosphorylated (P) and induces the activation of an intrinsic tyrosine kinase. This leads to phosphorylation of a cascade of insulin receptor substrates and this signalling pathway leads to the translocation of intracellular vesicles containing the GLUT-4 glucose transporter to the plasma membrane. In short, insulin stimulates its signalling pathway which leads to glucose uptake into the cell where it is metabolised (Marik and Raghavan, 2004; McCowen et al., 2001).
Figure 2-3: Insulin-mediated glucose uptake mechanism.
Inflammatory response
Hyperglycaemia has a pro-inflammatory effect that is normally restrained by the anti-inflammatory
effect of insulin secreted in response to that stimulus (Esposito et al., 2003). During critical illness,
stress-induced hyperglycaemia and reduced insulin sensitivity result in increased pro-inflammatory
mediators. The inflammatory response induces reduced immune-system ability, which in turn
further promotes stress, and results eventually in multisystem organ dysfunction, organ failure and
ultimately death (Marik and Raghavan, 2004). There is thus an unstable feedback loop comprising
stress, inflammation, and hyperglycaemia that can result in a spiralling cascade of negative effects.
Plasma membrane P P
Insulin receptor
Tyrosine kinase
P
GLUT-4 vesicle
Translocation
GLUT-4
Insulin receptor substrates

10
Table 2-1: Effects of counter-regulatory hormones and cytokines on the genesis of stress-induced hyperglycaemia and the decrease in insulin sensitivity.
Counter-regulatory hormones and cytokines
Effects on the genesis of stress-induced hyperglycaemia and the decrease in insulin sensitivity
Glucagon Increased glycogenolysis and gluconeogenesis
Glucocorticoids Increased lipolysis and thus gluconeogenesis via substrate supply Inhibition of GLUT-4 transporter translocation
Epinephrine Increased glycogenolysis and gluconeogenesis Inhibition of insulin secretion, insulin-receptor binding, tyrosine kinase activity and GLUT-4 transporter translocation Increased FFA levels, and thus inhibition of insulin signalling pathway
Norepinephrine Increased glycogenolysis, gluconeogenesis and lipolysis (and thus glycerol supply for gluconeogenesis)
Growth hormones Increased lipolysis and thus gluconeogenesis via substrate supply Inhibition of insulin signalling pathway Reduction of insulin receptor abundance and activation
TNF-α Increased glucagon production and gluconeogenesis Inhibition of post-receptor insulin signalling pathway and insulin release
IL-1 Inhibition of post-receptor insulin signalling pathway and insulin release
Self-sustainment of stress-induced hyperglycaemia
The major problem about stress-induced hyperglycaemia is its self-sustainment, where
hyperglycaemia leads to further hyperglycaemia (Dungan et al., 2009). First, high BG levels induce
increased cytokine release (Esposito et al., 2003). Then, stress is increased by hyperglycaemia.
Next, high BG levels increase proteolysis (McCowen et al., 2001), and thus increase gluconeogenic
substrates. Additionally, inflammation is sustained by the pro-inflammatory action of
hyperglycaemia that is increased by inflammation. Moreover, FFA levels that are increased with
stress response exacerbate inflammation (Esposito et al., 2003). Figure 2-4 summarises all the
positive feedback pathways.
In addition, the fact that hyperglycaemia is associated with reduced insulin sensitivity also induces
a self-sustaining dynamic within stress-induced hyperglycaemia (Figure 2-5). More precisely,
reduction of insulin action has two main effects: glucose production (anabolism) is increased while
glucose use and storage (catabolism) are decreased. As insulin fails to suppress glycogenolysis and
gluconeogenesis (Dungan et al., 2009; McCowen et al., 2001) and as energetic demand raises,
endogenous glucose production is increased, leading to increased BG levels. Then, as insulin-
mediated uptake is impaired, glucose storage and use are reduced, leading to reduced glucose
catabolic pathway. Hence, energy has to be produced by catabolic pathway from fats during β-
oxidation. However, this process leads to production of ketones and FFA, which are toxic when in
excess, and can lead to increased inflammation.

11
Figure 2-4: Self-sustainment of stress-induced hyperglycaemia during critical illness.
Blue arrows show all the positive feedback loops involved in the self-sustainment.
Figure 2-5: Self-sustainment of stress-induced hyperglycaemia due to reduced insulin sensitivity.
Blue arrows show all the positive feedback loops involved in the self-sustainment.
Critical illness Stress response Inflammatory response
Counter-regulatory hormone release ↗ Cytokine production ↗
EGP ↗ FFA ↗
Insulin-mediated glucose uptake ↘
BG ↗ Insulin sensitivity ↘
Stress-induced hyperglycaemia
Immune-system ability ↘
Organ dysfunction and failure ↗
BG ↗ Insulin sensitivity ↘
Anabolism ↗ Catabolism ↘
EGP ↗
Energy demand ↗
Glucose storage and use ↘
Ketones production ↗ FFA ↗
Energy supply via catabolic pathway
Inflammation ↗

12
Despite hyperinsulinemia, or high insulin levels in response to high BG levels, reduced insulin
sensitivity leads to ongoing, or unsuppressed glucose production in the face of hyperglycaemia.
This hyperglycaemia is mainly caused by increased and unsuppressed hepatic glucose production,
more than impaired tissue glucose extraction (McCowen et al., 2001).
2.2.2. Treatment
Stress-induced hyperglycaemia can be exacerbated by therapeutic interventions (Dungan et al.,
2009; McCowen et al., 2001). Many drugs administrated to critically ill patients have to be diluted
in glucose solutions (Paw and Park, 2006). Drug delivery is thus associated with exogenous glucose
input for critically ill patients, and can lead to increased BG levels. Moreover, therapeutic
interventions may often also include glucocorticoid therapy or catecholamine infusions. As shown
in Table 2-1, glucocorticoids and catecholamines (epinephrine, norepinephrine) are both associated
with increased endogenous glucose production and reduced insulin sensitivity. However, the 10-20
% variation in insulin sensitivity resulting from glucocorticoid administration has been shown to
produce no significant BG level variation (Pretty et al., 2011), largely because insulin sensitivity
levels are already relatively very low.
2.2.3. Nutrition
During their ICU stay, critically ill patients often receive parenteral (intravenous) or enteral (oral
via feeding tube) nutrition. Nutrition is an exogenous glucose supply and directly impacts BG
levels. Changes or interruptions in nutrition are frequent in intensive care and result in further
changes in BG levels, and thus impact on observed glycaemic variability. Rises in nutrition directly
lead to higher BG levels. Hence, excessive exogenous glucose administration (overfeeding)
worsens hyperglycaemia and outcomes (Krishnan et al., 2003). Moreover, overfeeding can also
increase infectious complications that are associated with increased inflammation (Dungan et al.,
2009; McCowen et al., 2001). As shown in Figure 2-4 and Figure 2-5, increased inflammation
enhances self-sustainment of stress-induced hyperglycaemia. Hence, nutrition is an exogenous and
iatrogenic source of hyperglycaemia and glycaemic variability.
2.3. Glycaemic control in intensive care units
Hyperglycaemia has deleterious effect on immune system function (McCowen et al., 2001;
Weekers et al., 2003) and can be considered as a risk factor for developing complications, such as

13
infection and organ failure, two main causes of death in ICUs. Moreover, high BG levels have been
associated with a worse prognosis for patients suffering stroke (McCowen et al., 2001). Critically
ill patients without known diabetes and with hyperglycaemia face worse outcome and higher
mortality than patients with pre-existing diabetes (Dungan et al., 2009). In addition, high variability
in BG levels is associated with mortality in critically ill patients, independently of mean BG levels
(Dungan et al., 2009; Egi et al., 2006).
Treatment of hyperglycaemia during critical illness is thus fundamental to improve survival.
Exogenous insulin delivered as infusion or bolus seems to be the typical choice to reduce BG levels
(Esposito et al., 2003; McCowen et al., 2001). Indeed, as endogenous glucose production is
increased and insulin sensitivity is reduced, increased endogenous pancreatic insulin release is not
sufficient to reduce BG levels and so supplementary exogenous insulin is necessary. As insulin has
anti-inflammatory effects, normalisation of glycaemia and inflammation will reduce or eliminate
the self-sustaining actions of hyperglycaemia and stress (Dungan et al., 2009). GC aims to reduce
and stabilise BG levels taking into account inter-patient variability, evolving physiological patient
conditions (intra-patient variability) and minimising hypoglycaemia (Suhaimi et al., 2010). GC is
also associated with reduced surgical wound infection for post cardiac-surgery patients (Saad et al.,
2008), kidney protection (Vanhorebeek et al., 2008) and reduced need for prolonged mechanical
ventilation (Berends et al., 2008).
For some cohorts of critically ill patients, GC has been shown to improve patient outcomes and
reduce infectious complications (Chase et al., 2008b; Krinsley, 2004; Marik and Raghavan, 2004;
McCowen et al., 2001; Van den Berghe et al., 2001). But, other studies failed to reproduce this
beneficial impact of GC (Brunkhorst et al., 2008; Finfer et al., 2009; Preiser et al., 2009). These
discouraging results can be partly explained by higher patient-type heterogeneity and lower GC
quality compared with the first studies (Chase et al., 2008b; Krinsley, 2004; Van den Berghe et al.,
2001). The remaining issue is that most protocols fail to account for inter- and intra- patient
variability (Chase et al., 2011b).
In addition to medical benefits of GC, GC implementation improves critical care quality and
reduces associated cost (Krinsley and Jones, 2006; Van den Berghe et al., 2006b). Moerer et al.
(2007) have shown an association between total per-patient cost in ICU, and the severity of illness
and the length of stay. GC is associated with reduced patient length of stay in ICU (Van den Berghe
et al., 2001), and thus also with reduced total per-patient cost (Krinsley and Jones, 2006; Van den
Berghe et al., 2006b). All these findings support the medical and financial interest in GC.
GC is associated with clinical protocols that specify insulin and/or nutrition rates to administer to
critically ill patients and BG measurement frequency during control (Chase et al., 2007; Chase et
al., 2006). This last point is important for correct clinical implementation of GC. Clinical protocols

14
ensure GC based on accurate and safe decisions. Dungan et al. (2009) suggested that GC has to be
individualised for different hospital patient populations whereas Chase et al. (2011b) noted it should
be per-patient, or patient-specific. Moreover, as clinical practice about treatment and nutrition is
ICU-dependent, clinical protocols should also be hospital-specific to fit in clinical workflow.
In clinical practice, several factors impede effective and safe GC implementation. The three main
factors are evolving critically ill patient condition, fear of hypoglycaemia and increased nursing
staff workload (Carayon and Gurses, 2005; Chase et al., 2008a; Chase et al., 2011b; Mackenzie et
al., 2005). Evolving patient condition implies metabolic changes leading to insulin sensitivity
variability, and thus requiring continuous insulin/nutrition rate adjustment during control (Chase et
al., 2011b; Pretty et al., 2012). Hypoglycaemia is the main risk associated with GC. As
hypoglycaemia in critically ill patients is associated with increased mortality (Bagshaw et al., 2009;
Egi et al., 2010; Krinsley and Keegan, 2010), GC implementation in ICU is associated with nurse
anxiety about hypoglycaemic risk (Mitchell et al., 2006). Moreover, GC implementation requires
more frequent BG measurements to account for inter- and intra- patient variability, which can lead
to increased nursing staff workload, resulting in nursing staff reluctance to GC implementation
(Carayon and Gurses, 2005; Chase et al., 2008a; Mackenzie et al., 2005; Van Herpe, 2008).
Consequently, GC implementation requires safe, effective clinical protocols. These protocols
should also be easy-to-use in real-time to facilitate nursing staff work.
2.4. Model-based glycaemic control protocols
GC is currently implemented in one form or another in many ICUs (Eslami et al., 2010). GC
protocols can be divided into three categories: flowchart-based protocols, formula-based protocols
or model-based protocols (Vogelzang et al., 2008).
Flowchart-based protocols use empirical rules to determine insulin dosing and measurement
frequency, based on clinical practice. Flowchart-based protocols are widely used as there are easy-
to-use and simple-to-understand. However, their efficiency is quite limited as rules do not depend
on patient cohort, length of ICU stay, severity of illness, and patient nutrition input and medication
(Lonergan et al., 2006b; Van Herpe, 2008). Most flowchart-based protocols are paper documents,
but computerised versions are emerging.
Formula-based protocols use empirical formulae to calculate insulin dosing. Measurement
frequency is often determined using flowchart-based rules. Employed formulae are often associated
with a lack of rigor, precision and, as with flowchart-based protocols, formula-based protocols do
not account for evolving patient condition. Protocols using complex formulae are often

15
computerised to ensure beneficial implementation and facilitate nursing staff work (Eslami et al.,
2010). Formula-based protocols allow insulin dosing at any time, which also explains their wider
use. Glucommander (Davidson et al., 2005; Davidson et al., 2008) and Glucostabilizer (Juneja et
al., 2007; Juneja et al., 2009) are the most well-known formula-based GC protocols.
Model-based protocols are the most sophisticated control approach. Modelling of glucose-insulin
system helps to accurately predict BG levels, and thus enables the determination of the best
insulin/nutrition dosing to achieve a desired BG level for coming periods (Chase et al., 2007; Chase
et al., 2006; Vogelzang et al., 2008). This approach allows customised and patient-specific GC, but
requires protocols to be computerised. Studies have shown that model-based protocols are able to
provide accurate GC for critically ill patients (Amrein et al., 2012; Evans et al., 2011; Fisk et al.,
2012b; Pachler et al., 2008; Penning et al., 2012a; Penning et al., 2012b; Pielmeier et al., 2010a;
Pielmeier et al., 2012; Van Herpe et al., 2013). However, only one (STAR) has both reduced
hypoglycaemia and been implemented in regular clinical practice (Evans et al., 2011; Fisk et al.,
2012b). STAR was based on an earlier computerised model-derived protocol (SPRINT) that was
the only one to successfully reduce mortality and hypoglycaemia (Chase et al., 2008b).
2.5. Modelling of the glucose-insulin system
In this thesis, the goal is the application of glucose-insulin system models for safe and effective
real-time GC at the bedside of critically ill patients. Such models must therefore account for the
three main following features. First, models have to accurately describe insulin and glucose kinetics
and dynamics. Second, they have to account for inter- and intra- patient variability. Third, model
parameters have to be easily identifiable in real-time in an ICU setting, at patient bedside using
readily available data.
Over the last few years, many models have been developed to capture patient response to glucose
and insulin inputs for GC in ICU (Chase et al., 2011b; Chase et al., 2006; Hovorka et al., 2002;
Pielmeier et al., 2010b; Van Herpe et al., 2006). In all these models, the main parameter that evolves
with evolving patient condition and is patient-specific (Lin et al., 2006) is the insulin sensitivity.
Safe and effective GC requires accurate real-time identification of insulin sensitivity at the patient
bedside (Chase et al., 2011b). Other parameters are often defined from the literature and based on
population values. It should be noted that models developed for GC are typically based on a
simplified glucose regulatory system and cannot directly account for environmental factors that
could impact on insulin sensitivity and glycaemia, such as stress (Uchida et al., 2012), exercise
(Borghouts and Keizer, 2000), temperature (Berglund et al., 2012) or sleep (Bosy-Westphal et al.,
2008; Donga et al., 2010). Hence, models related to GC make a compromise between physiological
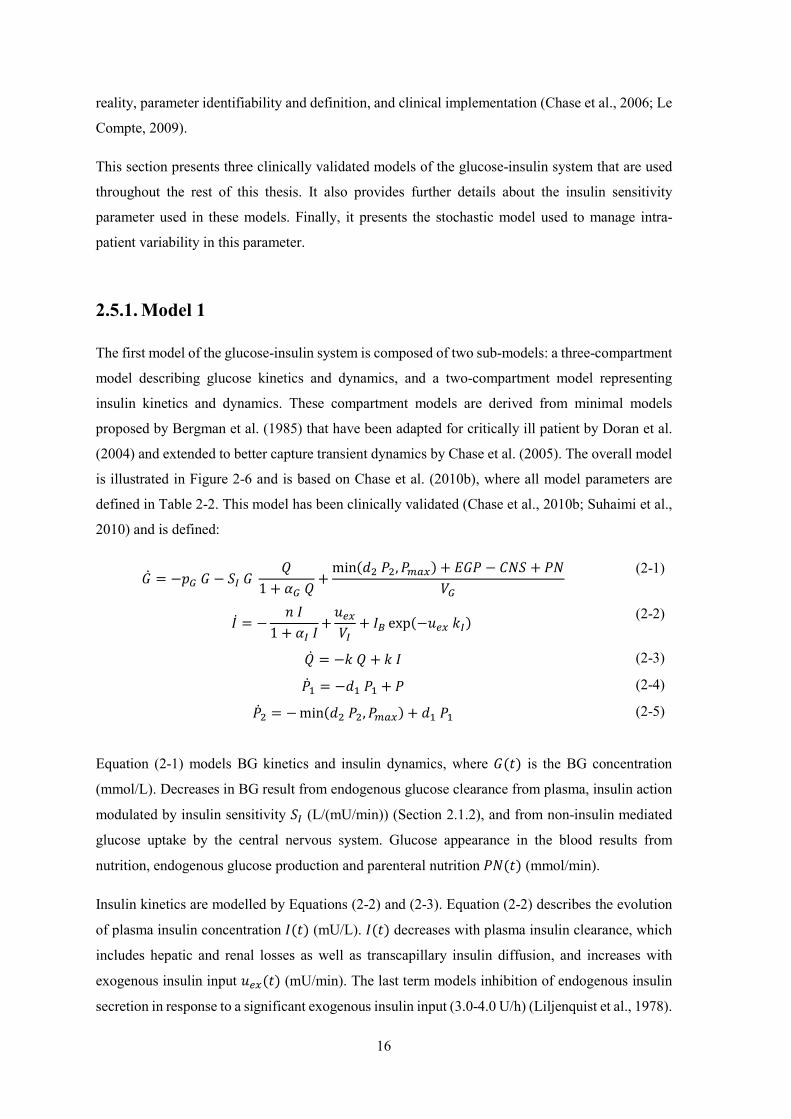
16
reality, parameter identifiability and definition, and clinical implementation (Chase et al., 2006; Le
Compte, 2009).
This section presents three clinically validated models of the glucose-insulin system that are used
throughout the rest of this thesis. It also provides further details about the insulin sensitivity
parameter used in these models. Finally, it presents the stochastic model used to manage intra-
patient variability in this parameter.
2.5.1. Model 1
The first model of the glucose-insulin system is composed of two sub-models: a three-compartment
model describing glucose kinetics and dynamics, and a two-compartment model representing
insulin kinetics and dynamics. These compartment models are derived from minimal models
proposed by Bergman et al. (1985) that have been adapted for critically ill patient by Doran et al.
(2004) and extended to better capture transient dynamics by Chase et al. (2005). The overall model
is illustrated in Figure 2-6 and is based on Chase et al. (2010b), where all model parameters are
defined in Table 2-2. This model has been clinically validated (Chase et al., 2010b; Suhaimi et al.,
2010) and is defined:
= − − 1 + + min , + − +
(2-1)
= − 1 + +
+ exp− (2-2)
= − + (2-3)
= − + (2-4)
= − min , + (2-5)
Equation (2-1) models BG kinetics and insulin dynamics, where is the BG concentration
(mmol/L). Decreases in BG result from endogenous glucose clearance from plasma, insulin action
modulated by insulin sensitivity (L/(mU/min)) (Section 2.1.2), and from non-insulin mediated
glucose uptake by the central nervous system. Glucose appearance in the blood results from
nutrition, endogenous glucose production and parenteral nutrition (mmol/min).
Insulin kinetics are modelled by Equations (2-2) and (2-3). Equation (2-2) describes the evolution
of plasma insulin concentration (mU/L). decreases with plasma insulin clearance, which
includes hepatic and renal losses as well as transcapillary insulin diffusion, and increases with
exogenous insulin input (mU/min). The last term models inhibition of endogenous insulin
secretion in response to a significant exogenous insulin input (3.0-4.0 U/h) (Liljenquist et al., 1978).

17
Figure 2-6: Multi-compartment model of insulin and glucose kinetics and dynamics.
Table 2-2: Parameter values for Model 1.
Parameter Value Unit Meaning
1/65 L/mU Michaelis-Menten constant for the saturation of insulin-dependent glucose clearance
1.7 10-3 L/mU Michaelis-Menten constant for the saturation of plasma insulin clearance
0.3 mmol/min Non-insulin mediated glucose uptake by the central nervous system
-ln(0.5)/20 min-1 Glucose transfer rate from stomach to gut
-ln(0.5)/100 min-1 Glucose transfer rate from gut to bloodstream
1.16 mmol/min Endogenous glucose production
3 mU/(L min) Endogenous pancreatic insulin secretion
-ln(0.5)/35 min-1 Effective life of insulin in the system
0.05 min/mU Factor accounting for the inhibition of endogenous insulin secretion in response to a significant exogenous insulin input
0.16 min-1 Constant first order decay rate for insulin from plasma
0.006 min-1 Endogenous glucose clearance rate
6.11 mmol/min Maximum disposal rate from gut
13.3 L BG distribution volume
3.15 L Plasma insulin distribution volume
U refers to 1 unit of insulin (1/22 mg).
Equation (2-3) represents the kinetics of insulin concentration in the interstitial space (mU/L).
Its transport is modelled as irreversible coming from plasma and disappearing in the system. This
equation reflects insulin accumulation dynamics and accounts for insulin action delays due notably
to insulin transfer from plasma to cells.
,
1 +
11 +

18
Equations (2-4) and (2-5) describe the kinetics of glucose concentration in the stomach,
(mmol), and the gut, (mmol), respectively. They rely on enteral nutrition input,
(mmol/min), and glucose transfer from the stomach to the gut and from the gut to the bloodstream.
2.5.2. Model 2
The second model of the glucose regulatory system is similar to the model described in Section
2.5.1, except for the insulin kinetics. This model is associated with extensive insulin kinetics
modelling. Equations (2-2) and (2-3) are changed to Equations (2-7) and (2-8), respectively.
Equations (2-1), (2-4) and (2-5) are rewritten as Equations (2-6), (2-9) and (2-10) for clarity.
Parameter values related to Model 2 are summarised in Table 2-3. Model 2 is thus defined:
= − − 1 + + min , + − +
(2-6)
= − − 1 + − − +
+ 1 −
(2-7)
= − − 1 + (2-8)
= − + (2-9)
= − min , + (2-10)
where endogenous insulin production is defined:
= max 16.67, 14 1 + 0.0147 − 41 (2-11)
In this second model, plasma insulin clearance is explained by three different clearance processes
(Figure 2-6). The first process is the kidney clearance that is proportional to plasma insulin
concentration. The second process is the liver clearance, which is a saturated process. And the third
process is the insulin diffusion between plasma and interstitial space.
Equation (2-7) also accounts for endogenous insulin production (mU/min), defined in Equation
(2-11), where only the fraction not extracted by first pass hepatic extraction contributes to plasma
insulin level increase. The endogenous insulin secretion is also not suppressed by exogenous insulin
delivery reflecting recent results in critically ill patients. Equation (2-8) models the receptor
mediated, saturated process of interstitial insulin degradation. This model has also been clinically
validated (Lin et al., 2011).

19
Table 2-3: Parameter values for Model 2 and Model 3.
Parameter Value Unit Meaning
1/65 L/mU Michaelis-Menten constant for the saturation of insulin-dependent glucose clearance
1.7 10-3 L/mU Michaelis-Menten constant for the saturation of plasma insulin clearance
0.3 mmol/min Non-insulin mediated glucose uptake by the central nervous system
-ln(0.5)/20 min-1 Glucose transfer rate from stomach to gut
-ln(0.5)/100 min-1 Glucose transfer rate from gut to bloodstream
1.16 mmol/min Endogenous glucose production
0.0075 min-1 Interstitial insulin degradation base rate
0.0075 min-1 Insulin diffusion rate between plasma and interstitial space
0.0542 min-1 Kidney clearance rate of plasma insulin
0.1578 min-1 Liver clearance base rate of plasma insulin
0.006 min-1 Endogenous glucose clearance rate
6.11 mmol/min Maximum disposal rate from gut
13.3 L BG distribution volume
4 L Plasma insulin distribution volume
0.67 / Fraction of first-pass liver extraction of insulin
2.5.3. Model 3
Recent research showed that endogenous insulin secretion in function of BG significantly differs
between non-diabetic and diabetic patients (Pretty, 2012). Type II diabetic patients present
impaired, lower insulin secretion in response to hyperglycaemia. The previous model of the
glucose-insulin system has thus been enhanced to account for a patient’s diabetic status. More
precisely, Model 3 is equivalent to Model 2 (Section 2.5.2), but with a more accurate modelling for
endogenous insulin production as function of BG and diabetes status. Equation (2-11) is replaced
by Equations (2-12) to (2-14), as a function of the patient’s diabetes status.
For non-diabetic patients:
= 16.7 mU/min if ≤ 4.5 mmol/L
14.9 − 49.9 mU/min if 4.47 < ≤ 21.25 mmol/L266.7 mU/min if > 21.25 mmol/L
(2-12)
where is the current patient BG level.
For patients with type I diabetes:
= 16.7 mU/min (2-13)

20
For patients with type II diabetes:
= 16.7 mU/min if ≤ 9.0 mmol/L
4.9 − 27.4 mU/min if 9.0 < ≤ 60.0 mmol/L266.7 mU/min if > 60.0 mmol/L
(2-14)
where is the current patient BG level.
In this new model, pre-hepatic insulin secretion in the critically ill is modelled using a constrained
linear function of BG, with a minimum of 1000 mU/h and a maximum of 16000 mU/h. For patients
with type I diabetes, insulin secretion is assumed to be minimal. This modelling of endogenous
glucose production better captures variability of insulin secretion. It accounts for significant
difference observed in endogenous glucose production between normal and type II diabetic
critically ill patients (Pretty, 2012).
2.5.4. Insulin sensitivity
The main parameter of all three models is insulin sensitivity, . This parameter captures a patient’s
whole body glycaemic response to insulin and nutrition inputs. In previously presented models,
insulin sensitivity refers to the relationship between glucose variation and insulin, over all metabolic
pathways.
As previously mentioned, glucose uptake in many cells is insulin-mediated (Figure 2-3, Section
2.2.1). Reduced insulin sensitivity could result from impaired binding between insulin and insulin
receptors, which reduces or impedes glucose uptake in insulin sensitive tissue, e.g. muscle or
adipose tissue. This reduction in insulin sensitivity reduces glucose clearance from blood and thus
BG levels increase. In this case, more insulin is required to reduce BG levels by a given amount.
Reduced insulin sensitivity is thus fundamentally associated with reduced insulin action and effect.
Equation (2-1) models this behaviour. It shows that for given BG and interstitial insulin
concentrations, reduced insulin sensitivity is associated with reduced BG clearance. Equally, for a
given glycaemia, more insulin is required to reduce BG levels when insulin sensitivity is reduced.
In the literature, insulin resistance is the term most often used and insulin action is reduced with
increased insulin resistance. Insulin resistance is thus the reciprocal of insulin sensitivity.
Critically ill patients often present reduced insulin sensitivity inducing hyperglycaemia, as detailed
in Section 2.2 and by Pretty et al. (2012). Insulin sensitivity changes with evolving patient condition
and is patient-specific (Lin et al., 2006). It also depends on environmental factors such as stress
(Uchida et al., 2012), exercise (Borghouts and Keizer, 2000), temperature (Berglund et al., 2012)
or sleep (Bosy-Westphal et al., 2008; Donga et al., 2010). Therefore, for GC, insulin sensitivity

21
cannot be assessed by using population value, but must be accurately identified in real-time at the
bedside for each patient.
2.5.5. Stochastic model of insulin sensitivity variability
Insulin sensitivity is a key parameter in GC. It changes between patients and over time within a
given patient (Lin et al., 2006). Modelling of insulin sensitivity variability leads to enhanced
knowledge of patient condition and can help forecast patient response to insulin and nutrition inputs.
Thus, such models offer the ability to improve GC efficiency and safety. In particular, many
protocols suffer from excessive hypoglycaemia due to insulin sensitivity variability because they
lack the ability to capture and manage this quantity (Chase et al., 2011b).
The main objective of a stochastic model of insulin sensitivity variability is to forecast a likely
distribution of patient insulin sensitivity based on current condition and current insulin sensitivity.
Such stochastic model is based on clinically observed insulin sensitivity variations in ICU
population data. These clinical data can come from a specific type of patients and can be selected
in function of the patient days of stay.
The stochastic model initially used in this research is based on all types of patients included in the
SPRINT GC study (Chase et al., 2008b) and all patient days of stay (Lin et al., 2006; Lin et al.,
2008). It used clinical data from 393 critically ill patients (Christchurch Hospital, New Zealand)
(Lin et al., 2008). Such a number of patients is critical to reliably capture stochastic variation of
insulin sensitivity.
Based on a current, identified insulin sensitivity value , the stochastic model returns the
probability density function for future insulin sensitivity values, where + 1 represents a
time step of 1-3 hours. This process is schematically illustrated in Figure 2-7 for a 1-hour interval.
It shows that the most likely next hour value for insulin sensitivity is the same as the current
identified value and thus that sudden changes in insulin sensitivity are not likely to happen. It should
be noted that at higher insulin sensitivity values the range skews more towards lower insulin
sensitivity values capturing the increased potential for sudden changes to lower insulin sensitivity.
Overall, this modelling approach captures intra-patient variability across this population to enable
better GC.
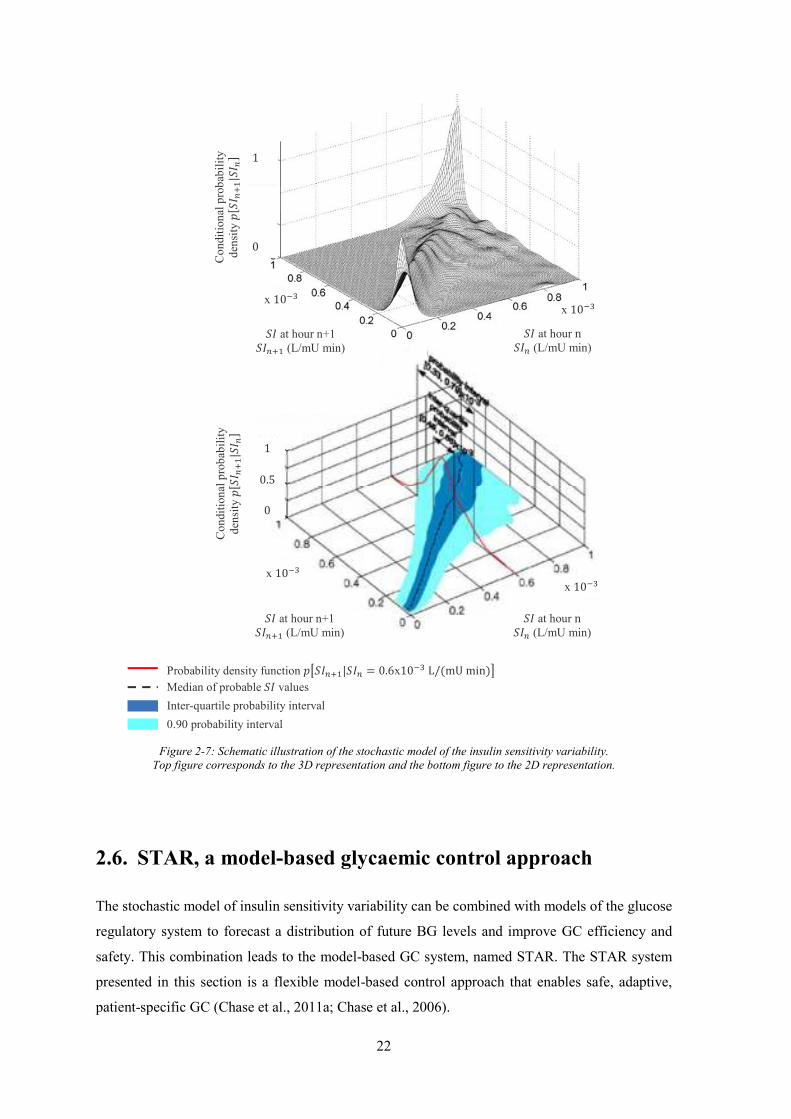
22
Figure 2-7: Schematic illustration of the stochastic model of the insulin sensitivity variability.
Top figure corresponds to the 3D representation and the bottom figure to the 2D representation.
2.6. STAR, a model-based glycaemic control approach
The stochastic model of insulin sensitivity variability can be combined with models of the glucose
regulatory system to forecast a distribution of future BG levels and improve GC efficiency and
safety. This combination leads to the model-based GC system, named STAR. The STAR system
presented in this section is a flexible model-based control approach that enables safe, adaptive,
patient-specific GC (Chase et al., 2011a; Chase et al., 2006).
Median of probable values Probability density function | = 0.6x10 L/mU min
Inter-quartile probability interval 0.90 probability interval
at hour n (L/mU min)
1
0
Cond
ition
al p
roba
bilit
y de
nsity
|
0
0.5
x 10 x 10
at hour n+1 (L/mU min)
at hour n (L/mU min)
at hour n+1 (L/mU min)
x 10
1
Cond
ition
al p
roba
bilit
y de
nsity
|
x 10

23
STAR directly accounts for evolving physiological patient condition and inter- and intra- patient
variability by identifying insulin sensitivity and its future potential variability at each intervention
to optimise control and maximise safety. Hence, STAR can accurately account for patient-specific
response to insulin and nutrition inputs, and thus more accurately dose insulin and/or nutrition to
ensure GC efficiency and safety (Fisk et al., 2012a; Suhaimi et al., 2010). Based on the stochastic
model of insulin sensitivity variability, STAR forecasts the likely range of BG levels associated
with a given insulin dose and/or nutrition input. STAR can thus determine the optimal insulin and/or
nutrition dosing to maximise the likelihood of BG levels in a glycaemic target band, while ensuring
a given risk of hypoglycaemia.
The STAR approach comprises the five main actions illustrated in Figure 2-8. First, previous and
current BG measurements, as well as current insulin and nutrition rates, are used to identify a
patient-specific current insulin sensitivity parameter value for the prior time interval (Hann et al.,
2005). This step accounts for inter-patient variability (Chase et al., 2007; Chase et al., 2010b;
Lonergan et al., 2006b). Second, the stochastic model of insulin sensitivity variability (Section
2.5.5) provides a distribution of possible future insulin sensitivity values. Third, the insulin and/or
nutrition rates required to achieve the BG target are computed. The method to determine these
insulin and/or nutrition rates depends on the control method used. Then, BG outcome predictions
are calculated for the 5th, 25th, 75th and 95th percentile insulin sensitivity values from the stochastic
model over the next time interval. These results show the possible BG spread due to intra-patient
variability typically observed in critical care patients (Chase et al., 2011b). Finally, the predicted
outcome BG range is checked to ensure the lowest possible BG (5th percentile) is not under a defined
hypoglycaemic threshold, ensuring a guaranteed maximum risk of 5 % for BG lower than this
threshold. This approach ensures safety from moderate (< 3.3 mmol/L) or severe (< 2.2 mmol/L)
hypoglycaemia. If necessary, the insulin rate is reduced or the nutrition rate is increased to meet
this criterion. Cross-validation and virtual trials demonstrated the stochastic model ability to capture
patient dynamics and to enhance GC efficiency (Chase et al., 2010b; Lin et al., 2008).
Figure 2-8: STAR GC system approach.
Clinical data Insulin sensitivity identification
Forecast of insulin sensitivity variability
Insulin and/or nutrition rate adjustment
Forecast of BG level spread
BG levels Nutrition rate and time Insulin rate and time
Model adjustment to current patient condition Taking into account inter-patient variability
Stochastic model of insulin sensitivity variability
Assessment of optimal insulin and/or nutrition rates to achieve the glycaemic target
Based on insulin sensitivity spread Taking into account intra-patient variability
(5) Hypoglycaemic risk assessment
(1) (2) (3) (4)

24
Because STAR is a model-based approach it can be customised for clinically specified glycaemic
targets, control approaches, insulin only, or insulin and nutrition interventions, and clinical
resources (e.g. measurement frequency or type). Limitations of insulin/nutrition inputs can also be
adapted to match local clinical standards. For clinical application in the ICU, the six following
characteristics of the STAR system can be customised.
1. Glycaemic target: it can be a specific value or a range. The recommended glycaemic target
to achieve will be discussed in Chapter 4.
2. Nutrition regimes: nutrition can be parenteral and/or enteral and be adjusted by STAR, left
constant or set by the nursing staff and attending clinicians.
3. Insulin administration: insulin can be administrated by infusion and/or bolus.
4. Limitation of insulin and nutrition rates: a maximum insulin/nutrition rate can be defined
to avoid large BG drops. Typically, insulin rates are limited to 6.0-8.0 U/h to minimise
saturation (Natali et al., 2000; Prigeon et al., 1996).
5. Measurement frequency: the time between two measurements can vary between 1-4 hours,
depending on patient state. Hourly measurements should be avoided to allow insulin action
to take effect when using insulin infusions, and to limit nursing staff workload. In contrast,
note that longer intervals can lead to greater glycaemic variability and hypoglycaemia
(Chase et al., 2007; Lonergan et al., 2006b). Thus, the frequency of measurement can be
optimised between these competing effects.
6. Hypoglycaemic threshold: as STAR can capture the patient-specific response to insulin and
nutrition inputs, and thus forecast BG outcome, clinicians can set a hypoglycaemic
threshold such as a maximum of 5 % of future BG are under this threshold. This
quantifiable risk of hypoglycaemia ensures a level of safety, as hypoglycaemia is the major
risk associated with GC (Bagshaw et al., 2009; Egi et al., 2010; Krinsley and Keegan,
2010).
The STAR GC approach can be customised and is patient-specific. Hence, STAR meets
recommendations about GC (Chase et al., 2011b; Dungan et al., 2009). Moreover, STAR
customisation enables hospital-specific GC within a framework approach that can be fit into the
local clinical workflow.

25
2.7. Virtual trials
Virtual trials are a safe, rapid, and efficient method to analyse, develop, and optimise or validate
GC protocols (Chase et al., 2010b). Virtual trials can also be used to assess a patient’s response to
insulin and nutrition inputs when used in real-time GC. Virtual trials can be performed to compare
different GC methods and protocols and thus to help clinicians in their choice of the most efficient
GC approach.
The virtual trial process is illustrated in Figure 2-9. Based on clinical data from critically ill patients,
a validated glucose-insulin system model is used to generate patient-specific insulin sensitivity
profiles. These profiles can then be used to simulate the patient’s responses to insulin and nutrition
inputs, specified by given GC protocols (Chase et al., 2010b). BG outcome analysis allows the in
silico assessment of protocol efficiency and safety, as well as the opportunity to identify possible
protocol improvements. Enhanced protocols can then be assessed using the same process.
Clinical pilot trials are then required to assess protocol efficiency and safety in clinical conditions.
However, virtual trial approach enables a rapid means of optimisation with no risk to the patient.
The overall approach was cross-validated on independent data by Chase et al. (2010b).
Figure 2-9: Virtual trial process.
Clinical data (BG levels, nutrition and insulin rates/time)
Insulin sensitivity profiles (virtual patients)
Responses to insulin and/or nutrition inputs
Protocol assessment Identification of possible improvements
(1) Identification of insulin sensitivity Use integral-based parameter identification
(2) Simulation Run different GC protocols on cohort of virtual patients
(3) Data analysis Compare BG responses between protocols/patients (4) Protocol optimisation

26
2.7.1. Identification of insulin sensitivity
Fitting refers to insulin sensitivity profile creation from patient clinical data and using a validated
model of the glucose-insulin regulatory system (Hann et al., 2005). The process is illustrated in
Figure 2-10. First, patient clinical data, BG measurements and insulin and nutrition rates/time, are
loaded and model parameters are set up based on values in Table 2-2 when using Model 1 and Table
2-3 when using Models 2 and 3. Windows of 60 minutes (fitting window) are used to identify a
constant value for insulin sensitivity over this window using an integral-based method (Hann et al.,
2005). This method used to identify insulin sensitivity profiles present four advantages: (1) use of
complete patient data in one time; (2) real-time computation for use in GC; (3) computational
efficiency and speed versus other methods ; and (4) resilience to noise through using integration
rather than differentiation (Hann et al., 2005).
Figure 2-10: Process of insulin sensitivity identification.
2.7.2. Simulation
Simulation is the second major part of virtual trials and the basic process is shown in Figure 2-11.
This process uses patient-specific insulin sensitivity profiles to simulate patient-specific responses
to insulin and nutrition inputs specified by a given GC protocol (Chase et al., 2010b; Lonergan et
al., 2006b). During simulation, the insulin sensitivity profile is assumed to be independent from
insulin and nutrition inputs, and thus from the GC protocol used. This hypothesis is crucial for
simulation relevance and has been previously validated for these models by Chase et al. (2010b).
During simulation, clinical BG data are thus replaced by virtual, simulated BG levels. Exogenous
insulin and nutrition rates depend on the GC protocol being tested. Protocols can adjust insulin, or
insulin and nutrition. In the first case, clinical insulin rates are replaced by those advised by the
simulated GC protocol and the clinical nutrition rates are retained, assuming that nutrition is left to
Load patient clinical data Set up parameters and initial
conditions
Set up 60 minute fitting window
All patient data fitted?
Yes
No
Save insulin sensitivity profile
Fit insulin sensitivity parameter
Solve model equations Generate a model BG curve
Loop through each window of data and fit insulin sensitivity for this 60-minute periods for each
hour and all patients

27
the nursing staff or attending clinicians. In the second situation, both clinical insulin and nutrition
rates are replaced by those recommended by the GC protocol used for the virtual trial.
In Figure 2-11, the patient insulin sensitivity profile is first loaded, and the model parameters are
set up based on values in Table 2-2 when using Model 1 and Table 2-3 when using Models 2 and
3. Initial conditions are defined for all model variables (, , , and ). The three following
steps are then iteratively followed:
1. BG evolution is generated over the time period between last and current protocol
intervention, by solving the model equations using the insulin sensitivity profile.
2. The latest BG value obtained in Step 1 is assumed to be the current BG level and is defined
as the current BG measurement. Measurement noise, nurse errors or timing errors may also
be added.
3. This BG value, and current insulin and nutrition rates are used by the GC protocol to
determine the new insulin and/or nutrition rates using a model-based approach or other GC
method. Protocols also determine the time until the next intervention. Updated insulin and
nutrition rates are then used to determine patient’s response over this time period (Step1).
The simulation process ends when all the insulin sensitivity profile has been used.
Figure 2-11: Simulation process.
2.7.3. Data analysis
Simulated patient response, such as BG outcomes, allows in silico assessment of GC protocol
efficiency and safety, and to identify possible protocol improvements that can be used to optimise
the GC protocol. Protocol assessment requires appropriate indicators and metrics. Currently, no
Load patient fitted insulin sensitivity profile Set up parameters and initial conditions
Generate a model BG curve,
Trial complete?
Yes
No
Save patient data
Virtual BG measurement
Use protocol to determine new insulin and/or nutrition rates
Loop through the entire length of patient fitted
insulin sensitivity profile
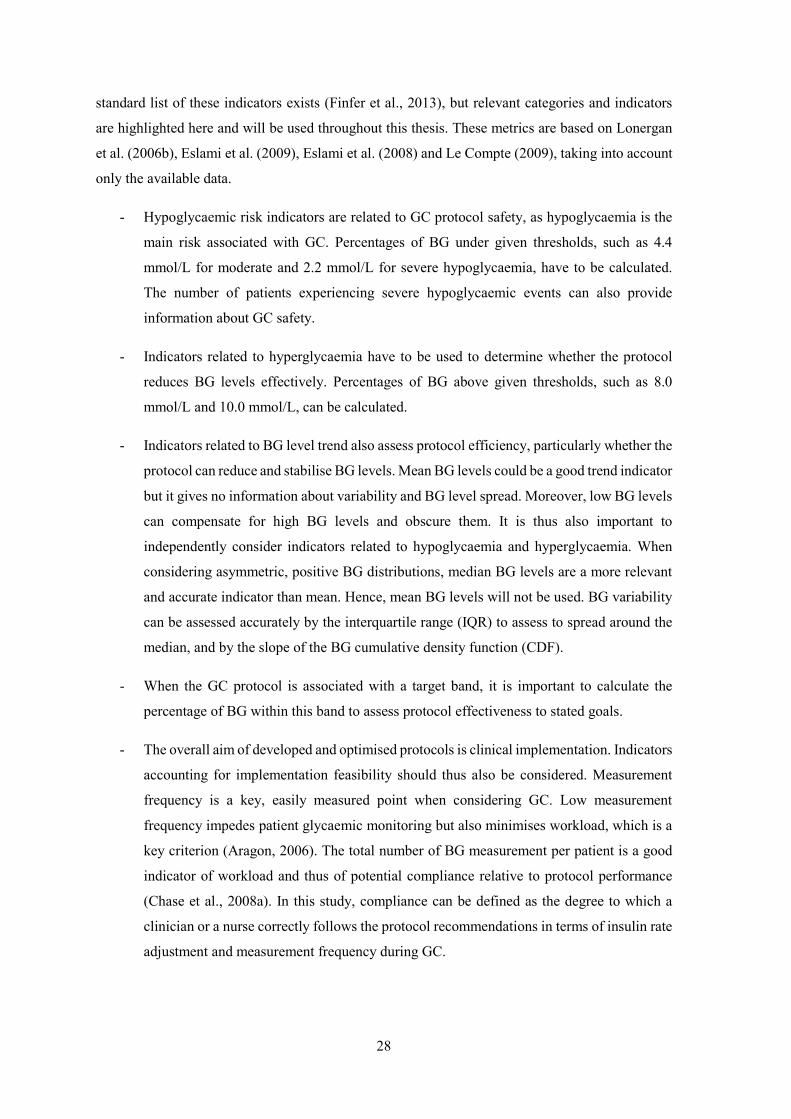
28
standard list of these indicators exists (Finfer et al., 2013), but relevant categories and indicators
are highlighted here and will be used throughout this thesis. These metrics are based on Lonergan
et al. (2006b), Eslami et al. (2009), Eslami et al. (2008) and Le Compte (2009), taking into account
only the available data.
- Hypoglycaemic risk indicators are related to GC protocol safety, as hypoglycaemia is the
main risk associated with GC. Percentages of BG under given thresholds, such as 4.4
mmol/L for moderate and 2.2 mmol/L for severe hypoglycaemia, have to be calculated.
The number of patients experiencing severe hypoglycaemic events can also provide
information about GC safety.
- Indicators related to hyperglycaemia have to be used to determine whether the protocol
reduces BG levels effectively. Percentages of BG above given thresholds, such as 8.0
mmol/L and 10.0 mmol/L, can be calculated.
- Indicators related to BG level trend also assess protocol efficiency, particularly whether the
protocol can reduce and stabilise BG levels. Mean BG levels could be a good trend indicator
but it gives no information about variability and BG level spread. Moreover, low BG levels
can compensate for high BG levels and obscure them. It is thus also important to
independently consider indicators related to hypoglycaemia and hyperglycaemia. When
considering asymmetric, positive BG distributions, median BG levels are a more relevant
and accurate indicator than mean. Hence, mean BG levels will not be used. BG variability
can be assessed accurately by the interquartile range (IQR) to assess to spread around the
median, and by the slope of the BG cumulative density function (CDF).
- When the GC protocol is associated with a target band, it is important to calculate the
percentage of BG within this band to assess protocol effectiveness to stated goals.
- The overall aim of developed and optimised protocols is clinical implementation. Indicators
accounting for implementation feasibility should thus also be considered. Measurement
frequency is a key, easily measured point when considering GC. Low measurement
frequency impedes patient glycaemic monitoring but also minimises workload, which is a
key criterion (Aragon, 2006). The total number of BG measurement per patient is a good
indicator of workload and thus of potential compliance relative to protocol performance
(Chase et al., 2008a). In this study, compliance can be defined as the degree to which a
clinician or a nurse correctly follows the protocol recommendations in terms of insulin rate
adjustment and measurement frequency during GC.

29
For comparison between results, p-values are calculated using the Mann-Whitney U-test. Analysis
is performed using glycaemic data resampled hourly from modelled or interpolated data to provide
a consistent measurement frequency for fair comparison between different protocols.
2.8. Clinical trials
When GC protocols have been shown to be efficient and safe in silico, clinical trials are required to
assess in vivo the protocol performance in real, clinical conditions. Clinical results can then be used
to further optimise the protocol if needed.
At each GC protocol intervention, a BG measurement is taken by the nurse with a bedside
glucometer or arterial blood-gas analyser. The BG value is then recorded in a computer.
Insulin/nutrition rate adjustment and the time interval until the next measurement are determined
by STAR or other GC protocol. Afterwards, the nurse adapts the insulin/nutrition rates on the
infusion pumps as necessary. This process is illustrated in Figure 2-12. Any change in nutrition
inputs, e.g. exogenous glucose infusion, meal, glucose input with drug administration, etc., has to
be recorded in the computer. Thus, for example, if a patient vomits, the nurse should take it into
account by setting all nutrition rates to 0 for that interval.
It should be noted that special care was taken about the ease-of-use of the STAR interface. The
interface has been developed in collaboration with ICU nursing staff (Ward et al., 2012). Human
factors could lead to entry of incomplete data, data entry and transcription errors and lack of
compliance. The interface was thus designed to minimise clinical effort and workload, maximise
compliance, and minimise use errors.
Figure 2-12: Clinical trial process.
BG measurement
Adjustment of nutrition/insulin rates
STAR intervention
Software

30
2.9. Summary
GC is a treatment choice to manage hyperglycaemia during critical illness that can improve
survival. GC is implemented using clinical protocols that specify insulin and/or nutrition rates based
on frequent BG concentration measurement. Safe and effective clinical protocols can provide
beneficial GC. However, they have proven hard to implement successfully, with several GC
protocol trials failing to show benefit.
Model-based protocols enable customised and patient-specific GC, and can provide a safe and
effective means to manage inter- and intra- patient variability that typical sliding scale protocols
cannot. These protocols are based on physiological models of the glucose-insulin regulatory system
to capture patient-specific dynamics and response to insulin and nutrition inputs. As a result, they
can enable patient-specific and adaptive GC in real-time from measurement to measurement.
This chapter first provided a physiological overview of the glucose-insulin regulatory system,
described the specific condition of critically ill patients and explained how GC can improve patient
outcome. This chapter then focused on the mathematical modelling of the glucose-insulin system.
These models have to accurately describe insulin and glucose kinetics and account for inter- and
intra- patient variability. The main parameter of all models used for GC is insulin sensitivity.
Insulin sensitivity is patient-specific and can vary in time as patient condition evolves, and thus has
to be easily identifiable in real-time at patient bedside from readily available measurements. As
insulin sensitivity varies significantly over time with evolving patient condition, insulin sensitivity
variability has to be taken into account to ensure safe and effective GC. The combination of a model
of the glucose-insulin regulatory system and a stochastic model of insulin sensitivity variability
leads to a new adaptive, safe and patient-specific GC framework named STAR.
Finally, virtual and clinical trial processes are described. Virtual trials are a safe, rapid and efficient
method to analyse, develop, and optimise or validate GC protocols. They can be performed to
compare different GC methods and protocols and thus to help clinicians in their choice of the most
efficient GC approach for their clinical practice culture and workflow. Virtual trials also enable a
safe GC development path, where once GC protocols have been shown to be efficient and safe in
silico, clinical pilot trials can quickly assess in vivo the protocol performance in real clinical
conditions. These clinical results can then be used to further optimise the protocol if needed.
Developing safe and effective model-based protocols that fit within practical clinical workflow is
thus the next challenge. GC protocols have to be designed to meet ICU clinician and nursing staff
expectations. The main objective in understanding the clinical culture and workflow is to ensure
GC system design is readily adopted in ICU daily practice.

31
Chapter 3. What do clinicians want
in glycaemic control?
GC has been shown to improve outcome of critically ill patients. Safe and effective protocols for
GC in the ICU setting are in development, but ICU clinician and nursing staff expectations related
to GC have to be considered to ensure adoption and efficacy in the local clinical environment. A
protocol that does not mesh well with local clinical practice and workload will likely increase risk,
rather than decreasing it (Chase et al., 2008a).
This chapter aims to assess the interest of medical staff for GC systems, identify the related clinician
specified key success factors for these systems, and to get more information about the personnel
involved in GC system selection, GC protocol characterisation and definition. The overall objective
is to gather information that would facilitate the safe, effective adoption of GC in ICU daily practice.
3.1. Introduction
As mentioned, GC aims to improve critically ill patient outcome. Its implementation in an ICU
setting requires clinical protocols that specify insulin and/or nutrition rates and BG measurement
frequency during control (Chase et al., 2007; Chase et al., 2006). Clinical protocols ensure that any
GC implemented is based on accurate and safe decisions. An increasing number of GC protocols
have been developed over the last few years, indicating continuing interest in GC. However, many
of these GC protocols failed to become standard practice in their ICU. Several failed because they
increased workload or failed to fit clinical workflow. Understanding ICU staff needs and
expectations related to GC would help to facilitate the diffusion and adoption of GC systems in ICU
daily practice.

32
Several national surveys have been carried out about GC. In a national survey in the Netherlands,
Schultz et al. (2010) focused on the characteristics of a GC protocol (BG target, insulin
administration, control guidelines) and on opinions regarding GC and specifically about intensive
insulin therapy (IIT). Mackenzie et al. (2005) investigated GC in ICU in the United Kingdom. Their
research also mainly focused on which BG targets to achieve during control. Other non-European
surveys were also carried out to determine hyperglycaemia and hypoglycaemia thresholds
(McMullin et al., 2004) and to identify associations between insulin inputs, glycaemic levels and
patient outcome (Mitchell et al., 2006).
All these surveys were conducted nationally. However, clinical practice culture and approach can
vary greatly. It thus seems important to have a more overall European overview. Moreover, other
aspects associated with GC should be considered. Hence, during this research, a European overview
of GC aspects was considered. In particular, the interest of European medical staff for GC protocols
was assessed, especially for computerised protocols, which are appearing now. Equally, key success
factors associated with GC protocols were evaluated to help protocol design meet clinician
expectations and concerns. Finally, personnel involved in GC system selection, GC protocol
characterisation and definition was identified to ensure the survey was addressed to proper
population and illuminate population who should be consulted when considering GC in ICU.
3.2. Method
A survey was addressed to ICU medical and nursing staff working in European hospitals. Data were
collected using a questionnaire, as it is the most appropriate and relevant data collection method to
meet the survey purpose. Questionnaires can be fast, answered at any time, and allows easy and
consistent data-gathering.
The questionnaire was sent by e-mail to 949 ICU clinicians in the European Society of Intensive
Care Medicine (ESICM) faculty list, the authors of papers related to intensive care in Europe, the
members of different European intensive care societies (Greece, Italy and Portugal), and ICU
clinicians whose e-mail address was available on their hospital website. Limitations of this contact
method include incorrect, wrong or expired e-mail addresses, and the inability to contact clinicians
whose e-mail address is not publicly available. Hence, a very large survey cohort was created to
overcome these limitations and the loss of responses expected due to low return rates from busy
individuals.
The questionnaire was written in English, the most internationally used language. This choice
implies that only English-speaking people can answer the questionnaire. However, the contact

33
method and cohort ensures that many of those contacted will understand enough English to answer
the survey. The questionnaire has been encoded in Google Drive (Google, Inc., Mountain View,
California) as it is easy-to-use, free and fast to design the questionnaire. Moreover, answers are
automatically recorded in an Excel file to facilitate analysis. The online questionnaire link was sent
by e-mail with an introductive cover letter.
The questionnaire was divided in five parts, based on the advice of Vermandele (2009).
- Part 1 (for all): survey purpose explanation.
- Part 2 (for all): general and simple questions to characterise responding ICU. This part
helps to encourage people to fill the questionnaire (Vermandele, 2009) and drive people to
the appropriate next part (3 or 4).
- Part 3 (for clinicians who don’t use usually GC in their ICU): identify why they don’t use
GC.
- Part 4 (for clinicians who use usually GC in their ICU): identify and characterise GC
method used by clinicians.
- Part 5 (for all): identify expectations and concerns about GC in ICU, identify the personnel
involved in GC system selection, GC protocol characterisation and definition and allow
people to comment the survey or to give any further concern about the topic.
The questionnaire was designed to be easy-to-fill and quickly-answered. It uses open-questions
associated with short answers or multiple choice questions. The questionnaire was tested by three
colleagues working on GC to ensure basic errors were avoided, although their answers were not
kept for analysis. The final version of the questionnaire is available in Appendix 1.
3.3. Results
Of 971 sent e-mails, 43 were associated with erroneous e-mail addresses that returned a notice. A
total of 52 of the remaining 928 persons completed the questionnaire. The return rate is thus 5.6 %.
3.3.1. Characteristics of responding ICUs
The respondents comprise 52 persons from 18 European countries and 39 cities (Figure 3-1).
Characteristics of the responding ICUs and population are summarised in Table 3-1.

34
Figure 3-1: Per-country repartition of survey respondents.
Table 3-1: Characteristics of responding ICUs and respondents.
Type of hospitals, N (%)
Tertiary or university hospitals 44 (84.6 %)
Non tertiary or university hospitals 8 (15.4 %)
Number of ICU beds, median [IQR] (*) 19.0 [8.5 – 31.5]
Respondent job in ICU, N (%)
Clinicians 20 (38.5 %)
Consultants 11 (21.2 %)
ICU head 15 (28.8 %)
Nursing staff 2 (3.8 %)
Professors 4 (7.7 %)
(*) one missing response
3.3.2. Glycaemic control in ICU
About 80 % (N = 42) of respondents formally use GC in their ICU. GC is mainly flowchart-based
(76.2 %), adjusts only insulin (69.0 %), and insulin is mainly administrated as infusions with few
boluses (Table 3-2). Only 7.1 % (3/42) of GC protocols are computerised, but 66.7 % (26/39) of
respondents would prefer a computerised GC protocol. Absence of GC in the ICU is mainly
explained by fear of hypoglycaemia (6/10, 60.0 %). Lack of trust and no functional monitoring also
hampers clinical implementation of GC.
0 2 4 6 8 10 12
United Kingdomthe Netherlands
SwitzerlandSweden
SpainPortugalNorway
LuxembourgItaly
IrelandGreece
GermanyFrance
FinlandDenmark
Czech RepublicBelgium
Austria

35
Table 3-2: Characteristics of current GC practice.
Type of protocols, N/Total (%)
Flowchart-based 32/42 (76.2 %)
Formula-based 5/42 (11.9 %)
Model-based 2/42 (4.8 %)
Model-based and predictions 1/42 (2.4 %)
Other 2/42 (4.8 %)
Protocol adjustment, N/Total (%)
Insulin only 29/42 (69.0 %)
Insulin and nutrition 13/42 (31.0 %)
Insulin administration mode, N/Total (%)
Boluses 2/42 (4.8 %)
Infusions 24/42 (57.1 %)
Mainly infusions with few boluses 14/42 (33.3 %)
Subcutaneously 0/42 (0.0 %)
All of previous modes 2/42 (4.8 %)
Other 0/42 (0.0 %)
3.3.3. ICU clinician expectations and opinions about glycaemic control
The main desired protocol characteristics are ease of use, friendly interface, and ability to be
customised to local clinical practice. Some respondents (29/52, of whom 24/29 control glycaemia
and 5/29 do not) mentioned the following other important characteristics: safety with limitation of
hypoglycaemia (11/29, 37.9 %), flexibility (3/29, 10.3 %), connection to data management system
(3/29, 10.3 %), and robustness (3/29, 10.3 %). In addition, performance, reliability, alarm systems
and low cost are other noted characteristics that could help facilitate GC implementation in the ICU,
where each of these last characteristics was cited twice.
Concerning the GC method, half the persons whose protocol only adjusts insulin would like to
adjust both insulin and nutrition during GC (Table 3-3). Results show that all respondents who do
not control glycaemia (10/52) would control glycaemia with a protocol adjusting both insulin and
nutrition. ICU staff also want control protocol flexibility about insulin administration mode, with a
preference for infusions with few boluses (results not shown).
The type of protocol is an important feature when considering GC. Results in Table 3-4 show that
respondents would mainly use either a flowchart-based protocol or a model-based protocol with
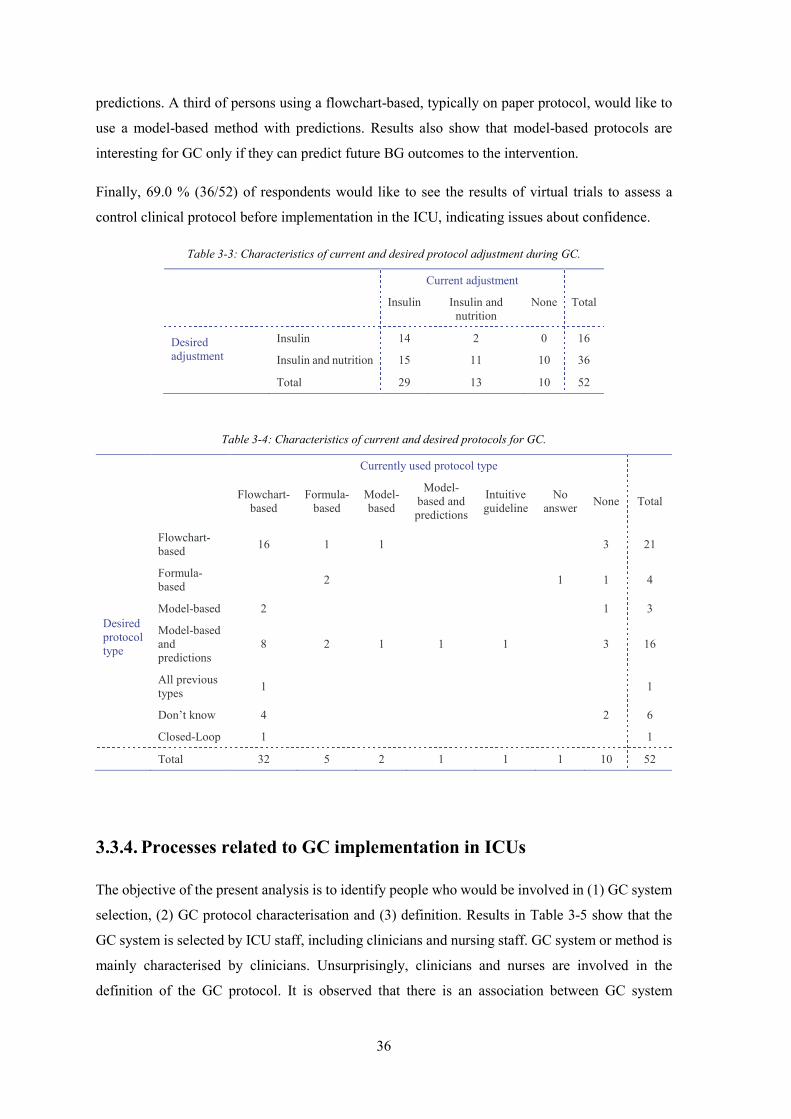
36
predictions. A third of persons using a flowchart-based, typically on paper protocol, would like to
use a model-based method with predictions. Results also show that model-based protocols are
interesting for GC only if they can predict future BG outcomes to the intervention.
Finally, 69.0 % (36/52) of respondents would like to see the results of virtual trials to assess a
control clinical protocol before implementation in the ICU, indicating issues about confidence.
Table 3-3: Characteristics of current and desired protocol adjustment during GC.
Current adjustment
Insulin Insulin and nutrition
None Total
Desired adjustment
Insulin 14 2 0 16
Insulin and nutrition 15 11 10 36
Total 29 13 10 52
Table 3-4: Characteristics of current and desired protocols for GC.
Currently used protocol type
Flowchart-
based Formula-
based Model-based
Model-based and predictions
Intuitive guideline
No answer None Total
Desired protocol type
Flowchart-based 16 1 1 3 21
Formula-based 2 1 1 4
Model-based 2 1 3
Model-based and predictions
8 2 1 1 1 3 16
All previous types 1 1
Don’t know 4 2 6
Closed-Loop 1 1
Total 32 5 2 1 1 1 10 52
3.3.4. Processes related to GC implementation in ICUs
The objective of the present analysis is to identify people who would be involved in (1) GC system
selection, (2) GC protocol characterisation and (3) definition. Results in Table 3-5 show that the
GC system is selected by ICU staff, including clinicians and nursing staff. GC system or method is
mainly characterised by clinicians. Unsurprisingly, clinicians and nurses are involved in the
definition of the GC protocol. It is observed that there is an association between GC system
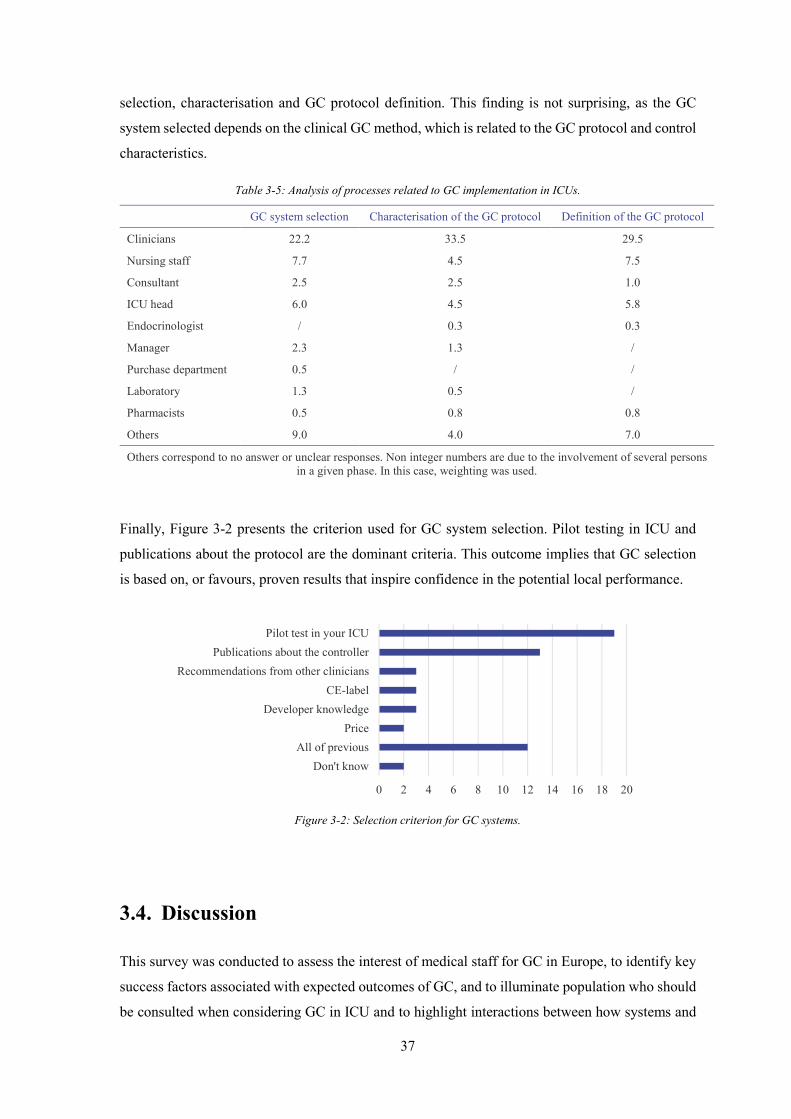
37
selection, characterisation and GC protocol definition. This finding is not surprising, as the GC
system selected depends on the clinical GC method, which is related to the GC protocol and control
characteristics.
Table 3-5: Analysis of processes related to GC implementation in ICUs.
GC system selection Characterisation of the GC protocol Definition of the GC protocol
Clinicians 22.2 33.5 29.5
Nursing staff 7.7 4.5 7.5
Consultant 2.5 2.5 1.0
ICU head 6.0 4.5 5.8
Endocrinologist / 0.3 0.3
Manager 2.3 1.3 /
Purchase department 0.5 / /
Laboratory 1.3 0.5 /
Pharmacists 0.5 0.8 0.8
Others 9.0 4.0 7.0
Others correspond to no answer or unclear responses. Non integer numbers are due to the involvement of several persons in a given phase. In this case, weighting was used.
Finally, Figure 3-2 presents the criterion used for GC system selection. Pilot testing in ICU and
publications about the protocol are the dominant criteria. This outcome implies that GC selection
is based on, or favours, proven results that inspire confidence in the potential local performance.
Figure 3-2: Selection criterion for GC systems.
3.4. Discussion
This survey was conducted to assess the interest of medical staff for GC in Europe, to identify key
success factors associated with expected outcomes of GC, and to illuminate population who should
be consulted when considering GC in ICU and to highlight interactions between how systems and
0 2 4 6 8 10 12 14 16 18 20
Don't knowAll of previous
PriceDeveloper knowledge
CE-labelRecommendations from other clinicians
Publications about the controllerPilot test in your ICU

38
goals are defined and the end-users. Respondents of our survey were mainly ICU clinicians,
consultants or managers, and they predominantly represented university and tertiary hospitals (84.6
%). It was observed that 80.8 % (42/52) of responding ICUs use some form of GC. Schultz et al.
(2010) observed that 97.7 % (86/88) of responding ICUs in the Netherlands implemented GC, while
41.4 % (12/29) of ICUs in Australia and New Zealand and only 25.0 % of English ICUs adopt some
form of IIT to more tightly control patient glycaemia (Mackenzie et al., 2005; Mitchell et al., 2006).
Unsurprisingly, fear of hypoglycaemia is the main impediment for GC implementation in ICUs as
it is the main associated risk (Bagshaw et al., 2009; Egi et al., 2010; Krinsley and Keegan, 2010).
This finding corroborates previous results. This survey shows that 6/10 (60.0 %) of ICUs do not
adopt GC because of fear of hypoglycaemia, compared to 9/17 (52.9 %) in the survey performed
by Mitchell et al. (2006). However, this study has also shown that lack of trust in GC also hampers
GC implementation. These two answers are related, but may also indicate specific versus general
fears. Attention should thus be paid to reassure medical ICU staff about protocol benefit,
performance and safety, as reflected in the dominant results of Figure 3-2.
The type of protocol is an important feature when considering GC. This survey suggests that current
protocols are mainly flowchart-based and (often) paper-based. Results show that 32/42 (76.2 %) of
protocols are flowchart-based and 5/42 (11.9 %) are formula-based. These results are similar to
previous results mentioned by Schultz et al. (2010), in which 49/88 (66.0 %)1 were flowchart-based
protocols and 12/88 (13.6 %) were formula-based protocols. However, respondents would like to
use either flowchart-based or model-based protocol with predictions. Moreover, a third of persons
currently using a flowchart-based protocol would switch to a computerised, model-based protocol
with predictions.
Interestingly, model-based protocols would not be implemented for GC if they cannot predict future
BG outcomes, which may increase trust and allay fears. It should be noted that model-based
protocol are complex and are thus computerised (Eslami et al., 2010). Currently, only 7.1 % of GC
protocols in use by survey respondents are computerised. However, there is a real interest or need
for computerisation of GC as 66.7 % of respondents would prefer their paper-based GC protocol
was computerised. Computerisation also enables better glycaemic monitoring of patients as the data
is thus readily stored (Eslami et al., 2009).
Considering the clinical implementation of GC in the ICU, current protocols primarily adjust only
insulin. However, there is a strong interest for protocols that are able to adjust insulin and nutrition,
as well as accounting for different insulin administration modes (bolus, infusion). Future GC
1 Numerical results are not consistent as 49/88 corresponds to 55.7 %, and not 66.0 %. But, these values are as published (Schultz et al., 2010).
39
protocols should thus be designed to allow flexible control in terms of insulin and nutrition inputs,
as well as to better match variable clinical preferences.
Whatever the GC protocol, previous clinical implementation of GC has often been associated with
efficiency, but also with increased hypoglycaemia (Eslami et al., 2010). However, minimising
hypoglycaemic events is a critical challenge to ensure safety. Respondents thus desired specific
rules in the protocol to deal with nutrition interruption or to manage hypoglycaemic risk and thus
enhance safety.
The main key success factors inherently associated with GC system are the GC protocol
customisation, safety and easy-of-use. Currently, GC protocols can often be customised in at least
some of: BG target, control frequency, patient diabetic status (type I, type II or no diabetes), insulin
administration mode with a maximum insulin and nutrition input. Present results show that patient
weight, medication (steroids, catecholamine, etc.), illness and glycaemic variability should also be
taken into account by protocols to meet ICU staff expectations. As clinical practice about treatment
and nutrition vary widely and are ICU-dependent, customisation of GC protocols to fit clinical
practice and workflow is crucial. Moreover, GC has to be individualised for different hospital
patient populations (Dungan et al., 2009) and also be adapted to specific patient condition (Chase
et al., 2011b).
Protocols should also be easy to use and have a friendly interface. These results corroborate
previous findings (Preiser and Devos, 2007) and reflect the interaction of human factors,
compliance and uptake (Chase et al., 2008a). Developing GC protocols and systems in collaboration
with ICU nursing and clinical staff helps to ensure easy and simple GC implementation (Preiser
and Devos, 2007; Ward et al., 2012). Moreover, satisfaction surveys should be performed once a
GC protocol has been clinically implemented to highlight future possible improvements that ensure
simple and easy future use by ICU staff.
GC protocols must also be clearly explained to ICU staff to facilitate adoption and to ensure proper
clinical implementation, which implies education of ICU staff (Hovorka et al., 2007; Lonergan et
al., 2006a; Preiser and Devos, 2007). Connection between a GC protocol and the patient data
management system is also a real expectation of ICU staff. In addition, performance, reliability,
alarm systems and low cost are other expected characteristics that were noted.
Results show that ICU staff, including the ICU head, clinicians and nursing staff, are involved in
GC system selection, characterisation and GC protocol definition. This finding confirms that ICU
clinicians are the population the survey had to be addressed to as they define the needs for GC
approach.

40
As a result, price does not seem to be a selection criteria for GC protocol here. However, price was
not a suggested answer and thus respondents may not have mentioned it because they did not think
about it when answering the questionnaire. It should also be noted that operating costs associated
with GC are relatively low. Costs associated with increased measurement frequency are
counterbalanced by, and even lower than, cost saving due to enhance patient outcome, and reduced
patient length of ICU stay (Krinsley and Jones, 2006; Van den Berghe et al., 2006b).
Interestingly, 69.0 % of respondents felt that virtual trials (Chase et al., 2010b; Lonergan et al.,
2006b) could be a good way to assess a control clinical protocol before its clinical implementation.
Afterwards, pilot clinical trials should be performed to allow clinicians to assess GC protocol
efficiency and safety in their ICU setting (Evans et al., 2012; Lonergan et al., 2006a). This
combination thus provides a safe pathway to develop proof of safety and efficacy.
Limitations associated with this survey should also be mentioned. First, respondents voluntarily
participated in this survey and answers could be non-representative as ICUs that did not respond to
the survey could potentially be less likely to be convinced of the benefits of GC. There may also be
some errors associated with the questionnaire and its design. Closed questions can be associated
with non-exhaustive response choice, with proposed answers influencing the final response, where
the respondent may not have an opinion (Vermandele, 2009). These limitations could introduce
bias into the responses. Finally, some stated responses are not always a reflection of reality, but the
de-identified format should reduce this phenomenon.
It must also be noted that this research presents a qualitative analysis that aims to understand
opinions and expectations. Qualitative analyses are always associated with a saturation
phenomenon: after a given number of respondents, there is no supplemental information (Bachelet,
2012). This behaviour has been observed in this survey, suggesting that the response number
obtained could be enough to capture all ICU staff opinions and expectations about GC.
3.5. Summary
The overall objective of this chapter was to identify ICU staff expectations related to GC to facilitate
the adoption of GC in ICU daily practice. Results showed that there is a real need for computerised
protocols and emerging interest for model-based protocols with predictions. Whatever the protocol
type, GC protocol should be designed to meet ICU staff expectations.
In this chapter, inherent GC protocol characteristics desired by ICU staff, as well as key success
factors related to GC, have been identified. Four main GC protocol elements that are expected by
ICU staff are:

41
1. Safety: minimising hypoglycaemic risk is a major challenge to ensure safe GC. GC protocol
should recommend specific intervention to deal with nutrition interruption or to manage
hypoglycaemic risk and thus enhance safety.
2. Efficiency: GC protocols have to provide efficient BG regulation, e.g. safely reduce and
stabilise BG levels.
3. Ease-of-use: protocols should be easy to use, have a friendly interface and be clearly
explained to ICU staff to facilitate their adoption and to ensure their right clinical
implementation.
4. Adaptive control: protocol design should allow the GC to be hospital-specific, population-
specific and patient-specific and to fit clinical practice and workflow. Future GC protocols
should thus be designed to allow flexible control in terms of BG targets, control frequency,
patient diabetic status, evolving patient condition and insulin and nutrition inputs.
All these elements, but also published clinical studies related to a GC protocol, help to enhance ICU
staff trust in GC. The opportunity to realise pilot clinical trials in their own ICU also enhances
clinician trust as they can verify that their main expectations are met.
Overall, this chapter has presented the results of a European survey that is both deeper in
questioning and geographically broader in scope than prior surveys. As a result, some unique
features, particularly regarding model-based methods and other expectations were uncovered.
These outcomes should thus be reflected in subsequent GC development and implementation in this
research.

42

43
Chapter 4. What is the best glycaemic
target to achieve during glycaemic
control?
Outcome of critically ill patients can be improved by implementing GC in the ICU. GC protocols
have to be designed to meet ICU clinician and nursing staff expectations, as well as to overcome
the main human factor problems associated with GC implementation. More specifically, GC
protocols have to ensure safety by limiting hypoglycaemic risk, to be effective using an optimal
target band, and allow assessment of GC quality in real time.
This chapter provides insight on these issues, and addresses the primary current issue in the field,
the lack of a clear definition or proof of a good or optimal glycaemic band target. In particular,
while the link between BG levels and outcome has been made, there is no clear knowledge of a best
target level, band or time spent in band to ensure improved outcome. In addition, there are no
consensus metrics or evaluation methods, aside from full outcome trials, to make this assessment.
This chapter first focuses on assessing and identifying the relationship between glycaemic target
band and patient outcome. To accomplish this task, a performance metric is needed that can be
assessed in real time to assess on-going GC performance, and be related to outcome. It can then be
related to improved patient outcome or lack thereof. More specifically, this chapter evaluates the
impact of the achievement of a defined glycaemic target band on the severity of organ failure and
mortality. The goal is to demonstrate that well-regulated BG levels are beneficial to patient
outcome, regardless of the GC protocol or approach used to achieve these levels. Hence, this
analysis develops a novel metric for assessing GC performance and uses it to assess the relationship
between glycaemic band or level, and patient outcome.

44
4.1. State of the art
Extreme high and low BG levels and exposure, and glycaemic variability have all been associated
with worsened patient outcome (Ali et al., 2008; Bagshaw et al., 2009; Egi et al., 2006; Egi et al.,
2010; Krinsley, 2003, 2008; Krinsley and Keegan, 2010; Laird et al., 2004). In critically ill patients,
hyperglycaemia has been defined as BG higher than 10.0 mmol/L (McMullin et al., 2004; Moghissi
et al., 2009), and mild hypoglycaemia has been defined as BG lower than 4.5 mmol/L (Bagshaw et
al., 2009; Egi et al., 2010) or 3.9 mmol/L (McMullin et al., 2004; Moghissi et al., 2009). Severe
hypoglycaemia refers to BG lower than 2.5 mmol/L (Bagshaw et al., 2009; Egi et al., 2010) or 2.2
mmol/L (Moghissi et al., 2009). These levels thus assume that maintaining BG levels between 4.5-
10.0 mmol/L should be beneficial for patient outcome. However, it is well known that BG levels of
8.0 mmol/L carry a 54.1 % increase in hospital mortality than those of 6.0 mmol/L despite both
values being in this band (Krinsley, 2003).
Thus, the optimal BG target to achieve during GC for critically ill patients is currently
undetermined. The first study about GC showed that GC had beneficial effect on mortality and
morbidity with a target band of 4.4-6.1 mmol/L, compared with a 10.0-11.1 mmol/L target band
(Van den Berghe et al., 2001). This 4.4-6.1 mmol/L band was considered a reference for a long
time. In a survey including 71 ICUs where GC was implemented, the median upper bound of the
GC target band was 7.0 mmol/L and the median lower limit was 4.1 mmol/L (Mackenzie et al.,
2005). This survey also showed that 25.3 % of respondent ICUs used that 4.4-6.1 mmol/L reference
target. In 2005, in North American adult ICUs, this reference target band was preferred by 82.5 %
of ICU clinicians (Hirshberg et al., 2008).
Subsequently, several studies reported increased hypoglycaemia associated with intensive GC to
this tight band, and the glycaemic target to achieve during GC was progressively increased. A
national survey performed in 86 ICUs implementing GC in the Netherlands showed that the lower
band bound was unchanged (4.4 mmol/L), but a rise in upper bound was observed: 48.8 % of ICUs
used the 6.1 mmol/L, 32.6 % used 7.0 mmol/L and 15.1 % used 8.0 mmol/L, while 3.5 % of ICUs
used a specific target of 6.5 mmol/L instead of a target band (Schultz et al., 2010). This trend was
also observed in expert recommendations where a target of 4.4-8.3 mmol/L was considered “not
unreasonable for an ICU to choose initially” (Krinsley and Preiser, 2008).
Progressively, a rise in the lower bound of the GC target range was also observed. A meta-analysis
including exclusively GC trials with insulin-only infusions showed that GC reduced risk of
septicaemia for surgical ICU patients when a 6.1-8.3 mmol/L target was used (Wiener et al., 2008).
In 2009, the American Association of Clinical Endocrinologists and the American Diabetes
Association (AACE/ADA) then recommended maintaining BG levels between 7.8-10.0 mmol/L,

45
and declared that targeting lower levels could be more beneficial (Moghissi et al., 2009). As a result,
recommendations related to optimal BG target to achieve during GC became less strict. Expert
consensus strongly suggested a target of less than 10.0 mmol/L (Ichai and Preiser, 2010). A BG
target of 8.1 mmol/L and below was suggested by Al-Tarifi et al. (2011). Hence, despite knowledge
of the increased risk of BG around 8.0 mmol/L, it became a recommended level due to fear of
hypoglycaemia.
In addition, high variability in BG levels has been associated with increased mortality for critically
ill patients (Ali et al., 2008; Egi et al., 2006; Krinsley, 2008). Bagshaw et al. (2009) observed that
significant variability on the first days of ICU stay significantly increased risk of death, even if no
hypoglycaemia. This association implies the need to also account for the width of the desired
glycaemic range when considering an optimal GC target band, as well as considering a desired time
within that range to restrict variability.
4.2. Glycaemic target band: performance metric and level
4.2.1. Introduction
This section focuses on assessing and identifying the relationship between glycaemic target band
and patient outcome. It consists of a retrospective analysis of glycaemic outcome, GC performance
and hospital mortality. This task first requires the definition of a performance metric that can be
evaluated in real time to assess on-going GC performance, particularly the control of variability
that all other statistical methods (e.g. IQR, standard deviation) consider only when all data is
available. It must also be able to discriminate improved patient outcome to aid the definition of an
optimal glycaemic target band. The overall objective is the definition of a glycaemic target band
that ensures safe and effective GC.
4.2.2. Method
Patient Data
Glycaemic data included in this retrospective analysis comes from 1701 patients from two,
independent studies, SPRINT (Chase et al., 2010a; Chase et al., 2008b) and the prospective,
randomised, multi-centre Glucontrol trial (Preiser et al., 2009):

46
1. Prospective SPRINT and retrospective pre-SPRINT cohorts, admitted to Christchurch
Hospital ICUs between January 2003 and May 2007 in a before-after study (N = 784).
2. Glucontrol patients, admitted to ICUs from November 2004 to May 2006 (N = 917).
These two datasets represent very different ICU cohorts with conflicting results in GC trials.
SPRINT reduced organ failure, mortality and hypoglycaemia compared to the retrospective cohort
(Chase et al., 2010a; Chase et al., 2008b). In contrast, the Glucontrol trial showed no benefit from
GC to a low target compared to a higher target and, as is often the case, reported increased
hypoglycaemia for the low target cohort (Preiser et al., 2009). Patient characteristics are
summarised in Table 4-1 and the number of patients remaining in the ICU each day is shown in
Figure 4-1.
Table 4-1: SPRINT and Glucontrol cohort characteristics.
SPRINT cohort Glucontrol cohort Whole cohort
Number of patients 784 917 1701
Percentage of males 61.2 62.9 62.1
Age (year) 65.0 [52.0 - 74.0] 65.2 [51.5 - 74.1] 65.0 [51.6 - 74.0]
APACHE* II score 18.0 [15.0 - 24.0] 15.0 [11.0 - 21.0] 17.0 [13.0 - 23.0]
BG levels (mmol/L) 6.2 [5.3 - 7.4] 6.9 [5.8 - 8.4] 6.6 [5.6 - 8.1]
Per-patient median BG levels (mmol/L) 6.3 [5.6 - 7.5] 6.9 [6.1 - 8.2] 6.6 [5.8 - 7.9]
% BG within 4.0-7.0 mmol/L 66.8 50.0 56.6
Number of patients with BG < 2.2 mmol/L 36 54 90
Data shown as median [IQR] where appropriate. *APACHE refers to Acute Physiology And Chronic Health Evaluation.
Figure 4-1: Number of remaining patients over days of ICU stay.
1 2 3 4 5 6 7 8 9 10 11 12 13 140
200
400
600
800
1000
1200
1400
1600
1800
Day of ICU stay
Num
ber o
f rem
aini
ng p
atie
nts
Whole cohortSPRINT cohortGlucontrol cohort

47
Analysis
Glycaemic outcome and performance were measured using cumulative Time In Band (cTIB),
calculated for each patient for each day of ICU stay. cTIB is defined as the percentage of BG levels
within a specific glycaemic band from the start to the present day. In other terms, it is the time spent
within a pre-defined glycaemic band as a proportion of the total time up to and including the day
under consideration. This metric was used to discriminate the risk of organ failure (Chase et al.,
2010a).
To enable comparison, cTIB must be calculated from glycaemic data with a consistent measurement
frequency. Clinical measurements from this retrospective data were not necessarily hourly, thus
interpolated data were used in the calculation of cTIB when required. Across the entire patient
cohort, the average duration between measurements was 2.5 hours. The analyses were performed
for the first 14 days of glycaemic monitoring, which typically commenced shortly after admission
to the ICU. After 14 days, less than 15 % of patients remained in the ICU, as shown in Figure 4-1.
In this study, cTIB was calculated for the 4.0-7.0 mmol/L, 5.0-8.0 mmol/L and 4.0-8.0 mmol/L
glycaemic bands. These bands represent two different intermediate glycaemic levels with similar
tolerated variability (4.0-7.0 mmol/L and 5.0-8.0 mmol/L), and a wider band allowing more
variability (4.0-8.0 mmol/L). These specific ranges were considered as they could reasonably be
used as target bands (Section 4.1).
Further, each patient day can be classified based on whether their cTIB value exceeds a pre-defined
threshold, , permitting a simple analysis of cohort behaviour. Thus, for a given threshold, , cTIB
accounts simultaneously for both BG levels and variability, where variability within the band is
tolerated and more time (higher ) spent within a band of defined width means less overall
variability. Threshold values of = 50 %, 60 %, 70 % and 80 % were considered, where a higher
threshold value indicates less tolerance of dysglycaemia (abnormal BG levels) in level and
variability, and higher required level of GC performance.
These thresholds and bands can then be used to determine whether cTIB is a good indicator of the
beneficial impact of GC on ICU mortality by its ability to discriminate improved outcome. The
band defines the tolerated levels and the threshold a level of variability or exposure allowed.
Importantly, it can be evaluated at any point in a patient stay unlike any other statistical variability
measure currently used.
For each day during the first 14 days of ICU stay, patients were classified by cTIB, threshold and
outcome hospital mortality, yielding a 2x2 contingency matrix for each day.
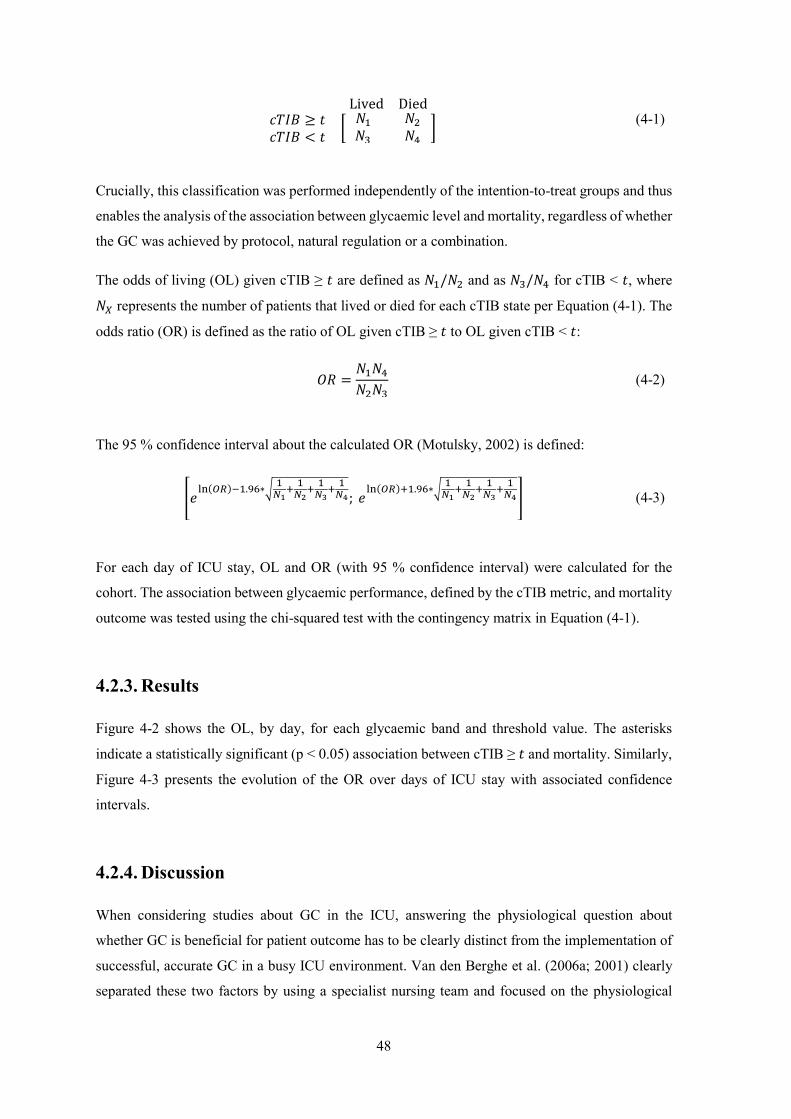
48
Lived Died ≥ <
(4-1)
Crucially, this classification was performed independently of the intention-to-treat groups and thus
enables the analysis of the association between glycaemic level and mortality, regardless of whether
the GC was achieved by protocol, natural regulation or a combination.
The odds of living (OL) given cTIB ≥ are defined as / and as / for cTIB < , where
represents the number of patients that lived or died for each cTIB state per Equation (4-1). The
odds ratio (OR) is defined as the ratio of OL given cTIB ≥ to OL given cTIB < :
=
(4-2)
The 95 % confidence interval about the calculated OR (Motulsky, 2002) is defined:
.∗
; .∗
(4-3)
For each day of ICU stay, OL and OR (with 95 % confidence interval) were calculated for the
cohort. The association between glycaemic performance, defined by the cTIB metric, and mortality
outcome was tested using the chi-squared test with the contingency matrix in Equation (4-1).
4.2.3. Results
Figure 4-2 shows the OL, by day, for each glycaemic band and threshold value. The asterisks
indicate a statistically significant (p < 0.05) association between cTIB ≥ and mortality. Similarly,
Figure 4-3 presents the evolution of the OR over days of ICU stay with associated confidence
intervals.
4.2.4. Discussion
When considering studies about GC in the ICU, answering the physiological question about
whether GC is beneficial for patient outcome has to be clearly distinct from the implementation of
successful, accurate GC in a busy ICU environment. Van den Berghe et al. (2006a; 2001) clearly
separated these two factors by using a specialist nursing team and focused on the physiological

49
question, demonstrating the benefit of GC on patient outcome. A number of studies added weight
to this finding by pinning down the pathophysiological mechanisms and pathways behind glucose
toxicity (Brownlee, 2001; Langouche et al., 2005; Siegelaar et al., 2010; Van den Berghe, 2004;
Weekers et al., 2003). This study is unique in that it analyses the combined results from two studies,
in normal clinical settings, based on glycaemic level and variability, rather than the treatment group
or how glycaemia was achieved. It thus effectively separates physiology from implementation.
Figure 4-2: OL for each glycaemic band and threshold value during ICU stay.
The * at the top shows a statistically significant association between cTIB ≥ t and mortality.
It is immediately clear from Figure 4-2 that the OL given cTIB ≥ is higher than the OL given cTIB
< for all values of , and for every day and all three glycaemic bands studied. Furthermore, Figure
4-3 shows that the OR clearly increased over ICU stay particularly for = 70 % and 80 %. In each
case, the OR tends to increase over ICU stay until Day 11. Higher cTIB thresholds, , result in
larger increases in OR over time and are particularly significant for the 4.0-7.0 mmol/L glycaemic
band. These results clearly demonstrate a strong association between accurate GC and mortality,
regardless of how the glycaemic regulation came about.
Regulated glycaemia was considered equally good whether it was due to a GC protocol, endogenous
regulation, or a combination. In particular, more time spent within the 4.0-7.0 mmol/L glycaemic
band is associated with higher odds of survival compared to the higher and wider bands. Thus, these
2 4 6 8 10 12 14 2 4 6 8 10 12 14 2 4 6 8 10 12 1402468
1002468
1002468
1002468
10
Day of ICU stay
Odd
s of l
ivin
g
Odds of living given cTIB ≥ tOdds of living given cTIB < tOdds of living - All patients
4.0 - 7.0 mmol/L 5.0 - 8.0 mmol/L 4.0 - 8.0 mmol/L
t = 50 %
t = 60 %
t = 70 %
t = 80 %

50
results begin to show clear differences in outcome due to glycaemic level (band), exposure (band
and ) and variability (). These differences qualitatively match those of retrospective studies over
full ICU stays (Ali et al., 2008; Egi et al., 2006; Falciglia et al., 2009; Krinsley, 2003, 2008; Laird
et al., 2004).
Figure 4-3: OR for each glycaemic band and threshold value during ICU stay.
Baseline is in black and 90% confidence interval is indicated in blue for each data.
Comparison of cTIB within 4.0-7.0 mmol/L and 5.0-8.0 mmol/L enables discrimination of patient
outcome by glycaemic levels for the same variability. Figure 4-3 shows OR is similar when at least
50 % of BG levels are within each specified band. When higher threshold values are considered, a
larger increase in OR is observed with the lower band, especially for the most restrictive
performance criterion ( = 80 %). This finding indicates that the increase in OR over ICU stay is
higher when cTIB is calculated in a lower glycaemic band. These results match previously reported
associations of high glycaemic levels and mortality (Falciglia et al., 2009; Krinsley, 2003; Laird et
al., 2004). These findings also show the evolution of these effects.
Patient outcome related to glycaemic variability is discriminated comparing cTIB within 4.0-7.0
mmol/L and 4.0-8.0 mmol/L. These bands share a lower bound of 4.0 mmol/L but have different
upper bounds allowing different variability. Higher increase in OR is observed with the tighter
band. The higher the threshold values, the more limited the glycaemic variability within a given
2 4 6 8 10 12 14 2 4 6 8 10 12 14 2 4 6 8 10 12 1402468
1002468
1002468
1002468
10
Odd
s rat
io
Day of ICU stay
4.0 - 7.0 mmol/L 5.0 - 8.0 mmol/L 4.0 - 8.0 mmol/Lt = 50 %
t = 60 %
t = 70 %
t = 80 %

51
band, the better the increase in OR over ICU stay for the 4.0-7.0 mmol/L band. This result indicates
that the tighter glycaemic band is associated with better OR, and thus improves patient outcome.
This finding also matches reported associations of glycaemic variability and mortality (Ali et al.,
2008; Egi et al., 2006; Krinsley, 2008).
An important aspect of this study is the use of the cTIB metric. This metric effectively captures
both the BG levels and variability, as well as relative exposure to dysglycaemia. The cTIB metric
is shown to be strongly associated with patient outcome, particularly after 3 days of ICU stay, as
indicated by the lower limits of the 95 % confidence intervals in Figure 4-3. Chase et al. (2010a)
and Van den Berghe et al. (2006a; 2001) also reported reduced mortality after 3 or more days of
GC. Therefore, cTIB provides a simple, yet useful metric for clinicians and investigators to evaluate
the evolution of GC in real-time.
Clinically, in consideration of the pathophysiological basis of increasing cellular dysfunction with
dysglycaemia, this cTIB metric captures glycaemic variability and glycaemic level in combination
with the length of exposure to these effects. This result was also observed for cTIB and organ failure
in Chase et al. (2010a). This metric can readily be targeted by control protocols and evaluated
regularly (daily or more frequently) in real-time at the patient’s bedside, where other statistical
measures, such as mean, median or standard deviation, require the full BG trajectory.
The choices of glycaemic ranges investigated in this study are not arbitrary. These choices are based
on previous recommendations and suggestions (Section 4.1). The ranges investigated in this study
are intermediate and achievable, provided the metabolic variability leading to hypo- and hyper-
glycaemia can be safely managed (Chase et al., 2011b).
The limitations of this study should be acknowledged. First, BG measurement frequency varied
between patients and centres. To use the cTIB metric, the data needed to have a constant and
consistent frequency. Thus, BG measurements are interpolated to provide one value per hour. As
the cTIB metric is a cumulative method for quantifying glycaemic behaviour over time,
interpolation is justified, as it captures the average trend of the BG between the measurements.
Second, this study is performed on retrospective data, thus it shows the association between well-
regulated glycaemia and outcome mortality but cannot prove causation. However, others
(Brownlee, 2001; Langouche et al., 2005; Siegelaar et al., 2010; Van den Berghe, 2004; Weekers
et al., 2003) have determined pathophysiological pathways between hyperglycaemia, glycaemic
variability and negative outcomes. So, although well-regulated glycaemia may be a symptom of
more healthy patients, rather than a cause, numerous pathophysiological and clinical studies suggest
that the association seen in this study results from an underlying causative pathway.

52
4.3. Impact of glycaemic target on organ failure
4.3.1. Introduction
Rate, severity and lack of resolution of organ failure are strongly associated with increased
morbidity and mortality in critically ill patients (Sakr et al., 2008). Organ failure is typically
assessed daily by the sequential organ failure assessment (SOFA) score (Vincent, 2006; Vincent et
al., 1998; Vincent et al., 1996). Van den Berghe et al. (2001) suggested that GC could reduce organ
failure, and cumulative time in an intermediate glycaemic band (4.0-7.0 mmol/L) was associated
with reduced rate and severity of organ failure (Chase et al., 2008b). However, GC and related
glycaemic targets are contentious (Fahy et al., 2009; Mesotten and Van den Berghe, 2009). While
decreased mortality was found in some studies (Chase et al., 2008b; Krinsley, 2004; Van den
Berghe et al., 2001), others did not (Brunkhorst et al., 2008; Finfer and Delaney, 2008; Preiser et
al., 2009), and many more saw no difference (Griesdale et al., 2009; Marik and Preiser, 2010;
Treggiari et al., 2008). Therefore, moderate targets are currently recommended (Krinsley and
Preiser, 2008; Moghissi et al., 2009), despite evidence that intermediate target ranges could
favourably influence organ failure rate and severity.
This section evaluates the impact of the achievement of a defined glycaemic target band on the
severity of organ failure and mortality. The goal is to demonstrate that well-regulated BG levels are
beneficial to patient outcome, regardless of the GC protocol or approach used to achieve them. This
retrospective analysis assesses the interaction of organ failure and GC in the Glucontrol trial cohort
(Preiser et al., 2009). This trial compared separate glycaemic target bands, one of which is entirely
within the 4.0-7.0 mmol/L band used by Chase et al. (2010a), while the other did not overlap. This
randomised trial data provides a further opportunity to examine the interaction of glycaemic level
and organ failure, and how initial results (Chase et al., 2010a) generalise over an independent
cohort.
4.3.2. Method
Patient cohort
Glucontrol was a prospective, randomised, multi-centre controlled glucose control trial
implemented in 19 centres (21 ICUs) from November 2004 to May 2006 (Preiser et al., 2009). The
1078 patients were randomised to Group A (glycaemic target: 4.4–6.1 mmol/L) or Group B
(glycaemic target: 7.8–10.0 mmol/L). Insulin infusion dosing was defined using sliding scales, with

53
BG measured hourly when not in the target range. For limited variation (≤ 50 %) of BG levels, 2-
hourly and 4-hourly measurement were allowed. Details are in (Preiser et al., 2009).
Organ failure
The organ failure was assessed using daily SOFA score (Ferreira et al., 2001; Vincent et al., 1996),
calculated summing five of the six individual scores ranging from 0 to 4, where lower scores are
associated with better patient condition. The sixth one, Glasgow Coma score, is excluded due to its
reported lack of robustness and unreliability (Chase et al., 2010a). Thus, total SOFA score ranges
from 0 to 20. All SOFA scores were re-calculated from original clinical data to avoid bias. A total
SOFA ≤ 5 is used as a threshold to discriminate patients considered relatively well and more likely
to recover.
Glycaemic outcome
Glycaemic outcome and quality of control are measured by cTIB for the first 14 days of ICU stay.
It was calculated per day and per patient and is defined as the percentage of time the patient’s BG
levels have been cumulatively in the 4.0-7.0 mmol/L band up to and including the considered day.
This band includes the entire Group A target range (4.4-6.1 mmol/L) and none of the Group B target
range (7.8-10.0 mmol/L). All other glycaemic results are presented for clarity, including per-patient
median cTIB values to assess differences in control achieved versus the intended glycaemic
outcome between Groups A and B. Moderate (BG < 4.0 mmol/L) and severe (BG < 2.2 mmol/L)
hypoglycaemic events are also reported.
Patient data
SOFA data measurement varied between centres, and patients were only included where sufficient
SOFA data was available (Figure 4-4). All data from centres with more than 40 % missing data was
excluded. Per-centre exclusion allows the remaining patients to be still representative of ICU
population and properly randomised. Additionally, patients for whom interpolation of missing data
from surrounding data cannot be performed were also removed, as detailed in Figure 4-4. Overall,
374 of 1078 patients were excluded and the remaining 704 patient characteristics are summarised
in Table 4-3 by patient group. Both groups were similar for age, sex, diagnostic category and
APACHE II score. Ethical consent was obtained from ethics committee of each participating
hospital and included patients signed consent allowing the audit, analysis and publication of these
data.
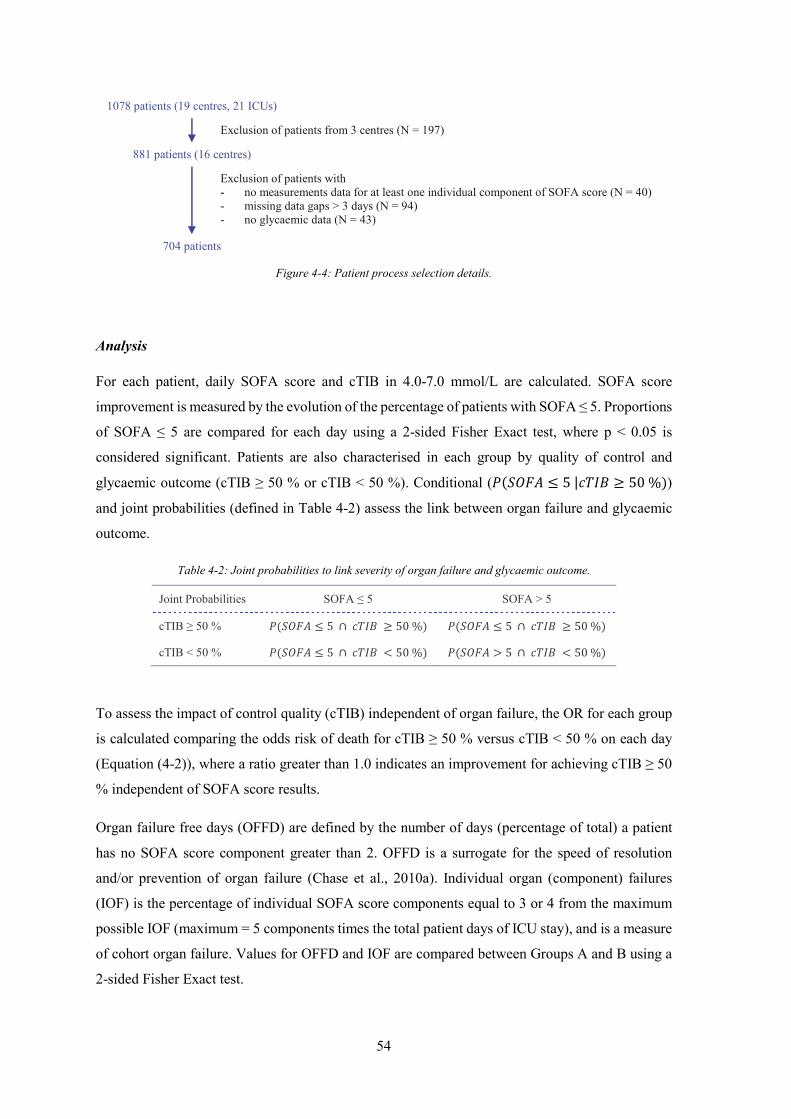
54
Figure 4-4: Patient process selection details.
Analysis
For each patient, daily SOFA score and cTIB in 4.0-7.0 mmol/L are calculated. SOFA score
improvement is measured by the evolution of the percentage of patients with SOFA ≤ 5. Proportions
of SOFA ≤ 5 are compared for each day using a 2-sided Fisher Exact test, where p < 0.05 is
considered significant. Patients are also characterised in each group by quality of control and
glycaemic outcome (cTIB ≥ 50 % or cTIB < 50 %). Conditional ( ≤ 5 | ≥ 50 %)
and joint probabilities (defined in Table 4-2) assess the link between organ failure and glycaemic
outcome.
Table 4-2: Joint probabilities to link severity of organ failure and glycaemic outcome.
Joint Probabilities SOFA ≤ 5 SOFA > 5
cTIB ≥ 50 % ≤ 5 ∩ ≥ 50 % ≤ 5 ∩ ≥ 50 %
cTIB < 50 % ≤ 5 ∩ < 50 % > 5 ∩ < 50 %
To assess the impact of control quality (cTIB) independent of organ failure, the OR for each group
is calculated comparing the odds risk of death for cTIB ≥ 50 % versus cTIB < 50 % on each day
(Equation (4-2)), where a ratio greater than 1.0 indicates an improvement for achieving cTIB ≥ 50
% independent of SOFA score results.
Organ failure free days (OFFD) are defined by the number of days (percentage of total) a patient
has no SOFA score component greater than 2. OFFD is a surrogate for the speed of resolution
and/or prevention of organ failure (Chase et al., 2010a). Individual organ (component) failures
(IOF) is the percentage of individual SOFA score components equal to 3 or 4 from the maximum
possible IOF (maximum = 5 components times the total patient days of ICU stay), and is a measure
of cohort organ failure. Values for OFFD and IOF are compared between Groups A and B using a
2-sided Fisher Exact test.
1078 patients (19 centres, 21 ICUs)
881 patients (16 centres)
704 patients
Exclusion of patients from 3 centres (N = 197)
Exclusion of patients with - no measurements data for at least one individual component of SOFA score (N = 40) - missing data gaps > 3 days (N = 94) - no glycaemic data (N = 43)

55
Table 4-3: Characteristics of the 704 remaining patients.
Patient information Group A Group B p-value
Number of patients 350 354
Age (years) 65.2 [52.0 - 74.4] 65.8 [53.0 - 74.0] 0.90(*)
% of missing age data 0.3 0.6
Percentage of males 64.3 61.3
% of missing sex data 0.0 38.7
Type of patients
% of medical 36.0 35.6 0.89
% of scheduled surgery 34.6 37.6 0.42
% of emergency surgery 22.0 20.6 0.64
% of trauma 7.1 6.2 0.61
% of missing type data 0.3 0.0
Categories of patients
% of cardiac 37.1 41.5 0.23
% of respiratory 18.0 15.5 0.38
% of gastroenterological 17.4 13.3 0.13
% of neurological 14.9 11.9 0.24
% of vascular 1.4 2.5 0.29
% of renal 1.7 3.1 0.23
% of orthopaedic 0.3 0.6 0.57
% of haematological 0.3 0.8 0.32
% of trauma 6.9 6.2 0.73
% of other 1.4 4.0 0.04
% of missing category data 0.57 0.56
APACHE II score 15.0 [11.0 - 21.0] 15.0 [11.0 - 20.0] 0.52(*)
% of missing APACHE II score data 5.7 5.1
Percentage of diabetics 17.7 23.2
% of missing diabetes data 0.0 0.0
ICU mortality 15.1 13.8
% of missing mortality data 5.4 4.8
The p-values are calculated using chi-squared test, except for age and APACHE II score for which Mann-Whitney test is used (*).

56
4.3.3. Results
Table 4-4 shows that initial and maximum SOFA score, and initial BG, are equivalent over groups
(p ≥ 0.4). Patients from Group A have lower BG levels than patients from Group B (p < 0.05), more
hypoglycaemia, and greater per-patient median cTIB and are thus as expected. These outcomes also
match Chase et al. (2010a) except for hypoglycaemia, which was lower in their intensive GC
(SPRINT) cohort.
Table 4-4: Characterisation of SOFA and BG data for all included patients.
Group A
BG target : 4.4-6.1 mmol/L Group B
BG target : 7.8-10.0 mmol/L p-value
SOFA data
Initial SOFA 5.0 [3.0 - 7.0] 5.0 [3.0 - 7.0] 0.65
Maximum SOFA 6.0 [4.0 - 8.0] 6.0 [4.0 - 8.0] 0.40
Per-patient median SOFA 4.0 [3.0 - 6.0] 4.0 [3.0 - 6.0] 0.93
OFFD 1431 (55.6 %) 1411 (54.4 %) 0.38
IOF 1491 (11.6 %) 1525 (11.8 %) 0.67
BG data
Initial BG (mmol/L) 7.3 [5.9 - 9.5] 7.2 [5.7 - 9.8] 0.48
BG levels (mmol/L) 6.3 [5.3 - 7.8] 8.1 [6.7 - 9.7] 0.00
Per-patient median BG levels (mmol/L) 6.3 [5.8 - 6.9] 8.0 [7.0 - 8.8] 0.00
Total number severe hypoglycaemia (BG < 2.2 mmol/L)
54 15 0.00
Total number moderate hypoglycaemia (BG < 4.0 mmol/L)
1094 187 0.00
% BG in protocol specified BG target band 40 [30 – 50] 30 [20 – 50] 0.01
Per-patient median cTIB 0.6 [0.4 – 0.8] 0.2 [0.1 – 0.5] 0.00
Results presented as median [IQR] where appropriate.
Figure 4-5 shows that SOFA improves slightly for both patient groups over the first 10 days and
Table 4-5 shows patient numbers per day in each group. The difference in SOFA ≤ 5 between
Groups A and B is not significant for any day and underpowered (Power < 0.75) for Days 13-14.
OFFD are slightly higher and IOF slightly lower for Group A, but not significant (p > 0.35) in Table
4-4.
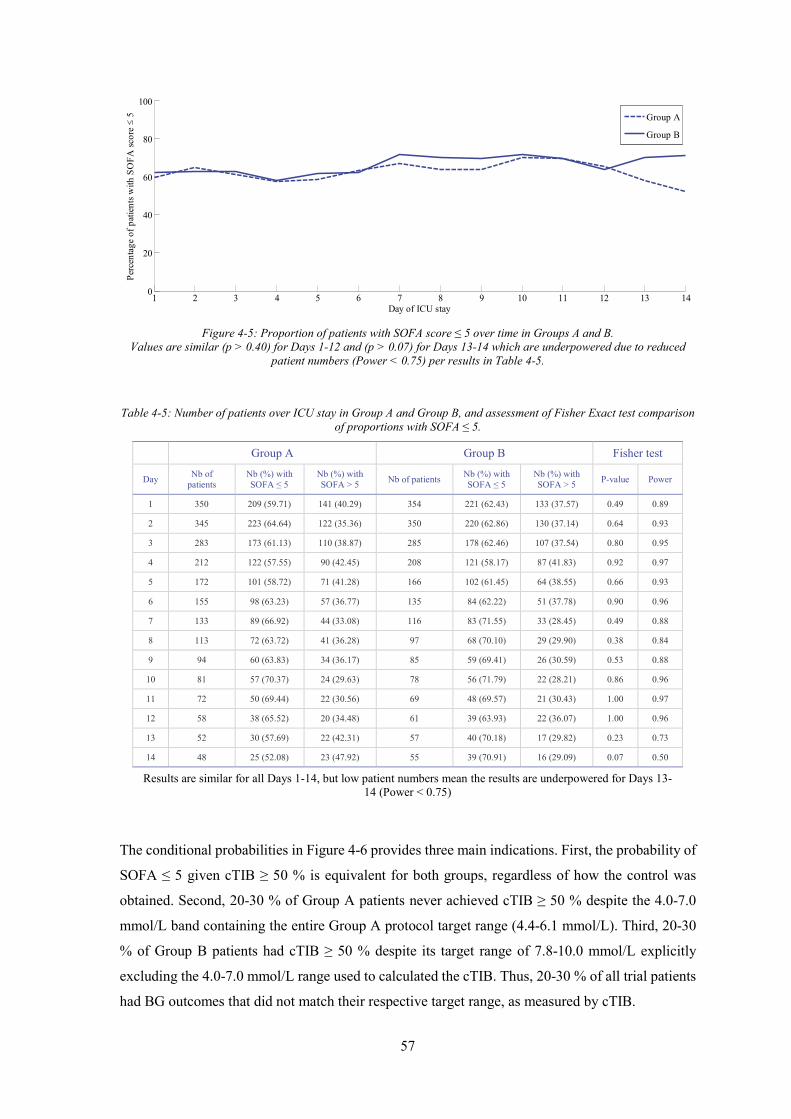
57
Figure 4-5: Proportion of patients with SOFA score ≤ 5 over time in Groups A and B.
Values are similar (p > 0.40) for Days 1-12 and (p > 0.07) for Days 13-14 which are underpowered due to reduced patient numbers (Power < 0.75) per results in Table 4-5.
Table 4-5: Number of patients over ICU stay in Group A and Group B, and assessment of Fisher Exact test comparison of proportions with SOFA ≤ 5.
Group A Group B Fisher test
Day Nb of patients
Nb (%) with SOFA ≤ 5
Nb (%) with SOFA > 5 Nb of patients Nb (%) with
SOFA ≤ 5 Nb (%) with SOFA > 5 P-value Power
1 350 209 (59.71) 141 (40.29) 354 221 (62.43) 133 (37.57) 0.49 0.89
2 345 223 (64.64) 122 (35.36) 350 220 (62.86) 130 (37.14) 0.64 0.93
3 283 173 (61.13) 110 (38.87) 285 178 (62.46) 107 (37.54) 0.80 0.95
4 212 122 (57.55) 90 (42.45) 208 121 (58.17) 87 (41.83) 0.92 0.97
5 172 101 (58.72) 71 (41.28) 166 102 (61.45) 64 (38.55) 0.66 0.93
6 155 98 (63.23) 57 (36.77) 135 84 (62.22) 51 (37.78) 0.90 0.96
7 133 89 (66.92) 44 (33.08) 116 83 (71.55) 33 (28.45) 0.49 0.88
8 113 72 (63.72) 41 (36.28) 97 68 (70.10) 29 (29.90) 0.38 0.84
9 94 60 (63.83) 34 (36.17) 85 59 (69.41) 26 (30.59) 0.53 0.88
10 81 57 (70.37) 24 (29.63) 78 56 (71.79) 22 (28.21) 0.86 0.96
11 72 50 (69.44) 22 (30.56) 69 48 (69.57) 21 (30.43) 1.00 0.97
12 58 38 (65.52) 20 (34.48) 61 39 (63.93) 22 (36.07) 1.00 0.96
13 52 30 (57.69) 22 (42.31) 57 40 (70.18) 17 (29.82) 0.23 0.73
14 48 25 (52.08) 23 (47.92) 55 39 (70.91) 16 (29.09) 0.07 0.50
Results are similar for all Days 1-14, but low patient numbers mean the results are underpowered for Days 13-14 (Power < 0.75)
The conditional probabilities in Figure 4-6 provides three main indications. First, the probability of
SOFA ≤ 5 given cTIB ≥ 50 % is equivalent for both groups, regardless of how the control was
obtained. Second, 20-30 % of Group A patients never achieved cTIB ≥ 50 % despite the 4.0-7.0
mmol/L band containing the entire Group A protocol target range (4.4-6.1 mmol/L). Third, 20-30
% of Group B patients had cTIB ≥ 50 % despite its target range of 7.8-10.0 mmol/L explicitly
excluding the 4.0-7.0 mmol/L range used to calculated the cTIB. Thus, 20-30 % of all trial patients
had BG outcomes that did not match their respective target range, as measured by cTIB.
1 2 3 4 5 6 7 8 9 10 11 12 13 140
20
40
60
80
100
Day of ICU stay
Perc
enta
ge o
f pat
ients
with
SO
FA sc
ore
≤ 5
Group A
Group B

58
Figure 4-6: Left: Conditional probability of SOFA score and cTIB; Right: Probability of cTIB ≥ 50 % for each patient
group.
Comparing the joint probabilities of Figure 4-7, it is shown that when cTIB ≥ 50 %, the probability
of also having SOFA ≤ 5 is two times higher than also having SOFA < 5, for both patient groups,
all the days. Similarly, when cTIB < 50 %, the probability of also having SOFA ≥ 5 is 1.5 times
higher than also having SOFA < 5 for patients from Group B, but is equal for patients from Group
A. This latter result indicates that there was greater risk of organ failure for Group A patients who
could not achieve cTIB ≥ 50 % for the 4.0-7.0 mmol/L range.
Figure 4-7: Joint probabilities of SOFA score and cTIB.
2 4 6 8 10 12 140
0.1
0.2
0.3
0.4
0.5
0.6
0.7
0.8
0.9
1
Day of ICU stay
P(S
OFA
≤ 5
| cT
IB ≥
50
%)
Group AGroup B
2 4 6 8 10 12 140
0.1
0.2
0.3
0.4
0.5
0.6
0.7
0.8
0.9
1
Day of ICU stay
P(cT
IB ≥
50
%)
Group AGroup B
1 2 3 4 5 6 7 8 9 10 11 12 13 140
0.2
0.4
0.6
0.8
1
Day of ICU stay
P(SO
FA ≤
5 a
nd c
TIB
≥ 5
0 %
)
Group AGroup B
1 2 3 4 5 6 7 8 9 10 11 12 13 140
0.2
0.4
0.6
0.8
1
P(SO
FA >
5 a
nd c
TIB
≥ 50
%)
Day of ICU stay
Group AGroup B
1 2 3 4 5 6 7 8 9 10 11 12 13 140
0.2
0.4
0.6
0.8
1
Day of ICU stay
P(SO
FA ≤
5 a
nd c
TIB
< 5
0 %
)
Group AGroup B
1 2 3 4 5 6 7 8 9 10 11 12 13 140
0.2
0.4
0.6
0.8
1
Day of ICU stay
P(SO
FA >
5 a
nd c
TIB
< 5
0 %
)
Group AGroup B

59
Figure 4-8 shows the OR (of survival) for Groups A and B for achieving cTIB ≥ 50 %. Achieving
cTIB ≥ 50 % resulted in improved outcome for both patient groups that increased each day, but
greater benefit and improvement was seen for Group A. Interestingly, this result occurs despite the
much higher incidence of moderate and severe hypoglycaemia for Group A (Table 4-4), which is
counter to some recent results (Bagshaw et al., 2009; Egi et al., 2010; Krinsley and Keegan, 2010;
Mackenzie et al., 2011). Overall, Figure 4-8 shows OR > 1.0 and improving for those achieving
cTIB ≥ 50 % regardless of protocol used.
Figure 4-8: OR over the first 14 days of ICU stay for cTIB ≥ 50 %.
4.3.4. Discussion
The results show no clinically significant difference in the evolution of organ failure severity or
rate between Groups A and B patients from Glucontrol. SOFA ≤ 5 is not significant for any of Days
1-14, although low patient numbers under-power the comparison on Days 13-14 (Table 4-5). These
results are supported by the OFFD and IOF results. Glycaemic outcome was examined
independently for its impact on mortality. Patients in Groups A and B who achieved cTIB ≥ 50 %
had improved odds of survival on all days after Day 3 (all days for Group A patients). This last
finding indicates that cTIB enables the discrimination of patient outcome based on glycaemic data,
as supported in Section 4.2.
Importantly, Chase et al. (2010a) had effectively no crossover from the tightly controlled SPRINT
cohort to the conventionally controlled cohort. Thus, differences in organ failure between cohorts
could be associated with the outcome of its treatment, as all SPRINT patients (~100 %) achieved
cTIB ≥ 50 % by Day 2-3. However, in this analysis, conditional and joint probability results indicate
significant failure to achieve the desired target bands for 20-30 % of all patients in Groups A and
0 1 2 3 4 5 6 7 8 9 10 11 12 13 14 150
1
2
3
4
5
6
7
8
Day of ICU stay
Odd
s rat
io
Group AGroup B
All95% CI (All)
60
B. In particular, Group A patients had 40 % [IQR: 30 % - 50 %] of BG in its 4.4-6.1 mmol/L target
band, and Group B had only 30 % [IQR: 20 % - 50 %] within its 7.8-10.0 mmol/L target band.
Critically, at this time, no specific patient group has shown specific benefit from GC. Thus, with
respect to organ failure, it is necessary to at least separate the intensive group from the control group
to be certain that all those who might benefit receive that care. The study of Chase et al. (2010a)
was able to show this separation between patient groups, where no clear difference was found here.
Hence, a first important outcome of comparing these two studies is to note that GC likely has the
most benefit on 15-20 % of patients as seen in Chase et al. (2010a), but not any specific or
identifiable group. This outcome thus requires all patients receive safe, effective GC to ensure
benefit for this minority, which matches many clinically accepted observations in many areas of
ICU medicine.
As a metric, cTIB has previously demonstrated its ability to capture GC performance in terms of
glycaemic levels, glycaemic variability and outcome. It is important to note that it is independent
of the insulin therapy or protocol used to achieve it and, equally, that both level and variability are
also associated with outcome (Krinsley, 2003, 2008). In this study, cTIB band (4.0-7.0 mmol/L)
includes the entire Group A protocol target and excludes the Group B target, clearly discriminating
the two protocols as intended in the original study, and also allowing direct comparison to Chase et
al. (2010a). The choice of target used for cTIB calculation (4.0-7.0 mmol/L) was based on results
observed in the previous section, and its 100 % inclusion of the Group A glycaemic target.
OFFD and IOF results provide further insight. Initial and maximum SOFA scores in this study are
lower than those of the medical ICU study of Chase et al. (2010a). Similarly, OFFD of 55.6 % and
54.4 % for Groups A and B was much higher than the 36-41 % of Chase et al. (2010a), and IOF of
11.6-11.8 % here was much lower than the 16 %-19 % in Chase et al. (2010a). Thus, Glucontrol A
and B patients had much less organ failure, especially initially. However, Glucontrol patients did
not present a large, absolute change in organ failure levels. The percentage of patients with SOFA
≤ 5 slightly improved (from 60 % to 70 %) over the first 10 days (Figure 4-5), while a 15 %-30 %
improvement was observed in Chase et al. (2010a) for similar initial values. Thus, cohort
differences and less successful GC across all patients may both have played a role in the outcome
of this study.
Failure to significantly separate glycaemic outcomes on a per-patient basis is the major limitation
of this analysis. However, this failure is a result in its own right, showing the difficulty in
interpreting results without achieving consistent control across most or all patients in (at least) the
intensive group. It is worth noting, in this context, that the Glucontrol study stopped early due to
unintended protocol violations (Preiser et al., 2009).

61
A final limitation and effect is the relatively rapid drop off of patients related to earlier ICU
discharge or death, leaving relatively very low numbers of only 58 and 61 patients in Groups A and
B, respectively, on Day 12. Similarly, cardiovascular surgery (CVS) patients represent a high
percentage of patients during the first days of ICU stays (37.1 % in Group A and 41.5 % in Group
B, Table 4-3). Hence, the relatively lower mortality of such patients may have affected the results,
where patients in Chase et al. (2010a) were from a medical ICU and only ~20 % of patients were
CVS surgical patients. Thus, the results may also differ based on cohort composition, where more
effect may occur for different patient groups.
4.4. Summary
This chapter provided insight on primary issues that impede GC implementation in ICU settings. A
primary issue in the field is lack of a clear definition or proof of a good or optimal target glycaemic
band. Second to this issue, there is a lack of a metric that can be used to assess GC performance.
This chapter first focused on assessing and identifying the relationship between glycaemic target
band and patient outcome. To achieve this task, a metric was defined to assess glycaemic levels,
variability and patient outcome in real-time. The cTIB metric can be readily calculated in real-time
and used to assess GC in progress, as well as providing a useful, simple target for GC studies. The
single metric encapsulates the need to achieve control of both level and variability to minimise
cellular dysfunction, as well as linking the level of achievement to patient outcome over each day
of stay.
Increased cumulative time in an intermediate glycaemic band was associated with higher OL. These
results suggest that effective GC positively influences patient outcome, regardless of how the GC
is achieved. There were significant differences in the glycaemic bands studied with a 4.0-7.0
mmol/L band showing improved results over a similar width band between 5.0-8.0 mmol/L,
indicating that BG < 7.0 mmol/L is associated with a measurable increase in the OL, if
hypoglycaemia is avoided.
The second part of this chapter evaluated the impact of the achievement of a defined glycaemic
target band on the severity of organ failure and mortality. The goal was to demonstrate that well-
regulated BG levels are beneficial to patient outcome, regardless of the GC protocol or approach
used to achieve them. Two main conclusions were drawn from this unique analysis of a randomised
GC trial.
First, there was no difference in the rate or severity of organ failure between the lower intensive
(Group A) and higher conventional (Group B) groups. However, significant patient crossover

62
between groups with very low per-patient percentage of BG in both groups target band ensures that
glycaemia was not effectively separated for the two groups, making interpretation of results
difficult, both in general and for organ failure in specific. Second, examining mortality independent
of organ failure showed achieving cTIB in the 4.0-7.0 mmol/L band over 50 %, regardless of the
form of GC, was associated with improved survival OR on all days, and especially during the first
three days of ICU stay. The joint probability analysis supported these results.
Thus, the overall results showed that cTIB appears to be an effective, and novel, glycaemic target
for control, as well as clearly indicating that cumulative control quality and level may be critical to
outcome, rather than median or average level. These conclusions remain to be prospectively tested.
However, the analysis highlighted key outcomes with respect to the achievement of an intermediate
BG levels and its assessment using SOFA score, as well as providing further insight into the
glycaemic level and variability, and quality of control, needed to improve outcomes.

63
Chapter 5. How to achieve glycaemic
control in intensive care unit
settings? First pilot trial
GC has shown benefits in ICU patients, but it has been difficult to achieve consistently due to inter-
and intra- patient variability that requires more adaptive, patient-specific solutions. STAR is a
flexible model-based GC framework accounting for evolving physiological patient condition by
identifying insulin sensitivity at each intervention and using a stochastic model of its future
potential values to optimise control and maximise safety. STAR enables effective, safe GC that fits
clinical practice, as it can be customised for clinically specified glycaemic targets, control
approaches, and clinical resources.
This chapter presents the first clinical implementations of the STAR framework in a Belgian ICU.
This first implementation requires the development of a customised GC approach to fit clinical
practice and meet clinician requirements. Virtual trials are used to develop and optimise an early
version of STAR and then a pilot clinical trial is performed to assess performance in real clinical
conditions.
5.1. Introduction
In early 2010, GC was implemented in general ICUs at the Centre Hospitalier Universitaire (CHU)
in Liege, Belgium. It was implemented using the flowchart-based protocol from the Glucontrol
study (Preiser et al., 2009). This chapter describes the development and optimisation of the STAR
framework to fit CHU clinical practice and meet clinician requirements, and compares customised
and optimised STAR protocol to the existing Glucontrol protocol to determine an optimal control
approach for use in a cardiac surgery ICU at the CHU of Liege.

64
This comparative study is performed using virtual trials on retrospective clinical data. Results are
then clinically validated in terms of efficiency and safety during a pilot clinical trial in. This trial is
also an opportunity to assess the ability to adapt the model-based STAR framework from its
development environment at Christchurch Hospital in New Zealand to a completely separate
institute in Liege, Belgium.
5.2. Virtual trials
Virtual trials are a safe, rapid, and efficient method to develop and optimise a new STAR protocol
and to compare it with the Glucontrol protocol currently used at the CHU. Virtual trials are
performed to help ICU clinicians in their choice of the most efficient GC approach to use. These
processes have been previously described in Section 2.7 and illustrated in Figure 2-9, and are
described and validated in detail in Chase et al. (2010b).
5.2.1. Patient cohort
The first step of a virtual trial is to use clinical data to generate the insulin sensitivity profiles that
represent the virtual patients (Section 2.7.1). As clinical nutritional practices are typically hospital-
specific, and patient conditions can vary as a function of countries or regions (Suhaimi et al., 2010),
this retrospective analysis uses data from Belgian patients included in the Glucontrol study at the
CHU of Liege between March 2004 and April 2005. Clinical data from 196 patients were used.
Patient characteristics are summarised in Table 5-1, from Groups A and B of the Glucontrol study.
This data consists of BG levels and measurement timing, exogenous insulin input rates and timing,
and exogenous enteral and parenteral nutrition input rates and timing. In the Glucontrol study,
patients were randomised to groups associated with different target BG levels: Group A (target:
4.4-6.1 mmol/L) and Group B (target: 7.8-10.0 mmol/L) (Preiser et al., 2009). These patients are
similar in age, APACHE II score and initial BG levels (p > 0.10), and not surprisingly, Group B is
associated with significantly higher BG levels (p < 0.01) as it was the group associated with the
higher BG target in the Glucontrol trial and thus Group B patients received significantly lower
insulin inputs (p < 0.01). Virtual patients are created via the process described in Figure 2-10, using
Model 1 (Section 2.5.1) to capture patient-specific response to insulin and nutrition inputs.

65
Table 5-1: Glucontrol virtual cohort characteristics.
Group A Group B All p-values
Number of patients 128 68 196
Percentage of males 66.4 55.9 62.8
Age (years) 71.0 [59.0 - 80.0] 69.5 [54.5 - 77.0] 70.5 [58.0 - 79.0] 0.10
APACHE II score 17.0 [14.0 - 22.0] 17.0 [14.0 - 21.0] 17.0 [14.0 - 22.0] 0.85
Total hours 14732 12635 27367
Number of BG measurements 3951 2728 6679
BG levels (mmol/L) 6.2 [5.4 - 7.2] 8.1 [7.0 - 9.2] 7.0 [5.9 - 8.4] 0.00
Initial BG (mmol/L) 6.5 [5.6 - 8.0] 6.6 [5.6 - 9.3] 6.5 [5.6 - 8.6] 0.47
% BG ≥ 10.0 mmol/L 3.98 11.89 7.63
% BG within 7.8-10.0 mmol/L 12.59 44.04 27.09
% BG within 6.1-7.8 mmol/L 37.19 34.17 35.80
% BG within 4.4-6.1 mmol/L 40.66 9.11 26.12
% BG within 2.2-4.4 mmol/L 5.44 0.76 3.28
% BG < 2.2 mmol/L 0.13 0.02 0.08
Number of patients with BG < 2.2 mmol/L 9 1 10
Exogenous insulin rate (U/h) 1.5 [0.5 - 2.5] 0.0 [0.0 - 1.5] 1.0 [0.0 - 2.0] 0.00
Exogenous glucose rate (g/h) 6.8 [0.8 - 10.0] 7.5 [1.0 - 11.3] 7.4 [1.0 - 10.5] 0.00
Data presented as median [IQR] where appropriate. p-values are used to compare Group A and Group B data.
5.2.2. STAR protocol framework
The step-by-step description of the overall STAR GC approach is illustrated in Figure 5-1 and the
insulin rate is calculated as follows:
1. Previous and current BG measurements and clinical data (nutrition and insulin rates) are
used to identify a patient-specific insulin sensitivity parameter value for the prior time
interval (Hann et al., 2005). This step accounts for inter-patient variability (Chase et al.,
2011b; Chase et al., 2007; Chase et al., 2010b).
2. For a given patient, insulin sensitivity is quite variable over time. The stochastic model
(Section 2.5.5) provides a distribution of possible insulin sensitivity parameter values for
the next time interval and accounts for intra-patient variability over time (Lin et al., 2006;
Lin et al., 2008). This New Zealand patient-based stochastic model was assumed to be
broadly applicable to Belgian patients as hour-to-hour insulin sensitivity variability in
retrospective comparison was similar between these cohorts (Suhaimi et al., 2010).

66
3. The target BG value for the next time interval is defined from the current BG levels, ,
with a maximum 15 % reduction compared with the current BG level:
= max0.85 ∗ , (5-1)
Where the glycaemic target value ( ) is clinically specified.
4. The insulin rate required to achieve this BG target is computed with a bisection method
using the Model 1 described in Section 2.5.1, with the median (50th percentile) expected
insulin sensitivity value over the next time interval, obtained from the stochastic model
distribution in Step 2 (Lin et al., 2006; Lin et al., 2008). The median forecasted insulin
sensitivity value is typically the same as the current value, and thus, sudden, large changes
in insulin sensitivity are unlikely.
5. Once a suitable insulin intervention is found, the BG outcome predictions are calculated
for the 5th, 25th, 75th and 95th percentile insulin sensitivity values from the stochastic model
in Step 2 over the forthcoming time interval. These results show the possible BG
distribution due to intra-patient variability typically observed in critical care patients.
6. The predicted outcome BG range in Step 5 is checked to ensure the lowest possible BG (5th
percentile) is not below a pre-defined hypoglycaemic threshold (typically 4.0 mmol/L),
ensuring a maximum cohort-wide risk of 5 % for BG < 4.0 mmol/L, for safety from
moderate (< 3.3 mmol/L) or severe (< 2.2 mmol/L) hypoglycaemia. This hypoglycaemic
threshold is clinically specified.
7. If the lowest BG is < 4.0 mmol/L, the insulin rate is reduced to ensure the maximum risk
of BG < 4.0 mmol/L remains 5 %, which effectively raises the target BG level defined in
Step 3, so that the 5th percentile outcome is equal to 4.0 mmol/L. If this step is necessary,
it effectively raises the BG target in recognition that the original target cannot be safely
obtained due to the insulin resistance of the patient making the stochastic (5th–95th
percentile) band too wide.
5.2.3. STAR-Liege 1 protocol
Because STAR is a model-based approach it can be customised for clinically specified glycaemic
targets, control approaches, insulin only or insulin and nutrition, and clinical resources, as reflected
in measurement frequency or type. Limitations of insulin/nutrition inputs can also be adapted to
match local clinical standards.

67
Figure 5-1: STAR protocol framework for its first implementation at the CHU of Liege.
The STAR-Liege 1 (SL1) protocol was customised to a glycaemic target of 6.9 mmol/L (125
mg/dL) and control interventions (insulin-only via infusions) to match clinical standards at the CHU
of Liege. If necessary, it raises nutrition rates to avoid hypoglycaemia when no exogenous insulin
is being given. The time interval between BG measurements is also determined by the protocol,
with intervals of 1 and 2 hours for this pilot study. The step-by-step description of this protocol is
illustrated in Figure 5-1. The STAR framework was adapted to local practices in glycaemic target
(Step 3, Equation (5-1)), interventions (Step 4) and limits (Step 6).
A maximum insulin rate of 6.0 U/h is prescribed for safety and to avoid insulin saturation effects
(Black et al., 1982; Rizza et al., 1981). Similarly, the insulin rate rise per intervention is limited to
+ 1.0 U/h if the previous insulin rate is < 1.0 U/h and to + 2.0 U/h otherwise to avoid over responding
to sudden changes or larger sensor errors. To reduce nursing staff workload associated with making
small and frequent changes in insulin rates and thus improve clinical implementation, insulin rates
BG
SI
BG
SI
BG
SI
BG
SI
Initial situation Step 1 Step 2 Step 3
BG
SI
Step 4
BG
SI
Step 5
BG
SI
Step 6
XXXX
BG
SI
Step 7
VVVV Too low
Too high Good
Median value Interquartile range: 25th-75th percentile band 90% confidence interval: 5th-95th percentile band
Median value Interquartile range: 25th-75th percentile band
Insulin sensitivity SI Blood glucose BG
Insulin rate is…
90% confidence interval: 5th-95th percentile band

68
were limited to specific values of 0.0, 0.5, 1.0, 1.3, 1.5, 1.8, 2.0, 2.5, 3.0, 3.5, 4.0, 4.5, 5.0, 5.5, 6.0
U/h.
A desired 6.25 g/h default enteral nutrition rate is requested, based on Krishnan et al. (2003), but
nutrition administration is left to the attending clinician. There is typically no parenteral nutrition,
unless clinically specified otherwise. To prevent unintended hypoglycaemia, enteral and parenteral
nutrition rates can be increased by 10 % when BG ≤ 6.0 mmol/L and no insulin has been given or
recommended. In this case, the nutrition rates are increased only until the next BG measurement,
but can be maintained if required.
The protocol specifies hourly BG measurement, but measurement frequency is decreased by going
to a 2-hour interval when the patient is glycaemically stable. Stability is defined here as occurring
when the current and last three BG measurements are within 5.0-7.8 mmol/L. These relatively short
1-2 hour intervals are used to avoid drift during longer intervals (Lonergan et al., 2006b). They also
match those used in all or part of other protocols (Chase et al., 2008b; Plank et al., 2006; Preiser et
al., 2009), as well as ensuring safety in this proof-of-concept pilot trial.
5.2.4. Results
Table 5-2 shows a comparison of virtual trials between Glucontrol B (existing protocol) and the
SL1 protocol, as customised to fit local clinical practice. Existing protocol performance shows that
11.80 % of BG levels are above 10.0 mmol/L (hyperglycaemic BG levels), 50.20 % of BG are
within the target glycaemic band (7.8-10.0 mmol/L) and 38.00 % of the BG are below 7.8 mmol/L,
with 0.37 % of BG under 4.0 mmol/L.
The SL1 protocol is associated with tighter BG level distribution around the target. Results show
71.63 % of BG are within 6.1-7.8 mmol/L, a 1.7 mmol/L-wide band around the SL1 specific target
that can be considered as a target band. Percentage of BG within the related target band is
significantly higher for the SL1 protocol, despite it is associated with a tighter target band (width
of 1.7 mmol/L, compared with 2.2 mmol/L for Glucontrol B). Moreover, SL1 enables tighter
control as the IQR is reduced from 2.0 mmol/L (Glucontrol B) to 0.9 mmol/L (SL1). STAR also
presents significantly reduced hyperglycaemic BG levels (BG ≥ 10.0 mmol/L) and similar
hypoglycaemic BG levels, with only 0.53 % of BG < 4.0 mmol/L. As expected given the insulin
rate calculation used by STAR (Section 0), less than 5 % of BG are below 4.0 mmol/L. These values
are also reflected in the CDFs shown in Figure 5-2.
The better glycaemic outcomes for SL1 are associated with more dynamically changing exogenous
insulin inputs and higher insulin rates. Not surprisingly, SL1 is associated with increased

69
measurement frequency as time interval varies from 1 hour to 2 hours. Although it is difficult to
fairly compare protocols associated with different targets and different measurement rates, the
results show that SL1 provides safe, effective GC.
Table 5-2: Virtual trials results for the first implementation of STAR in a Belgian ICU.
Glucontrol B SL1
Protocol characteristics
Glycaemic target 7.8-10.0 mmol/L 6.9 mmol/L
Nutrition regimes Left to the attending clinical staff Left to the attending clinical staff Increase of 10 % in enteral nutrition when necessary
Insulin administration Infusions Infusions
Limitation of insulin rates 8.0 U/h 6.0 U/h
Measurement frequency (time interval) 1-4 hour 1-2 hour
Hypoglycaemic threshold / 4.0 mmol/L
Simulation general results : whole cohort statistics
Number of patients 196 196
Total hours 26898 27093
Number of BG measurements 9240 18381
BG levels (mmol/L) 8.2 [7.2 - 9.2] 7.1 [6.6 - 7.5]
% BG ≥ 10.0 mmol/L 11.80 2.63
% BG within 8.0-10.0 mmol/L 44.97 10.44
% BG within 4.4-8.0 mmol/L 42.55 85.93
% BG < 4.4 mmol/L 0.69 0.99
% BG < 4.0 mmol/L 0.37 0.53
% BG < 2.2 mmol/L 0.01 0.02
Number of patients with BG < 2.2 mmol/L 3 4
Exogenous insulin rate (U/h) 0.0 [0.0 - 1.0] 1.0 [0.0 - 2.0]
Exogenous glucose rate (g/h) 7.5 [1.0 - 10.5] 7.5 [1.0 - 10.5]
% BG within 7.8-10.0 mmol/L (Glucontrol target band) 50.20 13.92
% BG within 6.1-7.8 mmol/L (SL1 target band) 29.57 71.63
5.3. Clinical trials
The SL1 protocol was shown to be efficient and safe in silico, but clinical trials are required to
assess its performance in a real, clinical environment. During this first pilot trial, three main areas
of control design and performance are explored. This first trial evaluates GC performance in post-
surgical patients by modulating insulin infusions only. This cohort is a departure from previous uses
of STAR in a heterogeneous medical ICU cohort, using primarily bolus delivery of exogenous
insulin, while also explicitly modulating nutritional inputs for GC. Second, this trial is an
opportunity to assess the real-time model prediction performance in a clinical trial in an ICU with

70
different clinical practices and patient populations from its development environment at
Christchurch Hospital in New Zealand. Third, post-analysis enables the assessment of nurse
compliance to a new GC approach.
Figure 5-2: CDFs of BG levels (left panel), exogenous insulin rate (middle panel) and exogenous glucose rate (right
panel), defined for the whole cohort, for the SL1 virtual trial.
5.3.1. Patients
The SL1 protocol was tested in July 2010. Nine patients from ICUs of the CHU were tested for 24
hours each. More precisely, seven of the trialled patients were cardiovascular or cardiac surgery, of
whom three patients (Patients 2, 3, and 6) were during their first 24 hours post-surgery. Patients
were recruited when they had a single BG > 8.0 mmol/L. Ethical consent was granted by the Ethics
Committee of the Medical Faculty of the University of Liege (Liege, Belgium) for the performance
of this trial and the audit, analysis and publication of this data. Table 5-3 shows the patient details.
For each patient, the trial started with a BG measurement made by nursing staff. BG measurements
were made using Accu-Chek Inform (Roche Diagnostics, Mannheim, Germany) glucometers. The
protocol then calculated a new insulin infusion rate, which was administrated by the nurse. The
time interval until the next BG measurement was also specified. This clinical procedure was
previously shown in Figure 2-12 (Section 2.8).
0 5 10 15 200
0.1
0.2
0.3
0.4
0.5
0.6
0.7
0.8
0.9
1
BG (mmol/L)
Cum
ulat
ive
frequ
ency
0 5 100
0.1
0.2
0.3
0.4
0.5
0.6
0.7
0.8
0.9
1
Exogenous insulin rate (U/h)
Cum
ulat
ive
frequ
ency
0 5 10 15 200
0.1
0.2
0.3
0.4
0.5
0.6
0.7
0.8
0.9
1
Exogenous glucose rate (g/h)
Cum
ulat
ive
frequ
ency
Glucontrol B target bandSL1 target bandSTAR-Liege 1Glucontrol B

71
5.3.2. GC performance
Clinical results are summarised by whole cohort and per-patient statistics in Table 5-4. There were
205 BG measurements taken during 215 hours of control. Hence, primarily 1-hour measurements
were specified by the SL1 protocol. This result can also be seen in the individual patient results in
Table 5-5. Overall, these results indicate that patients were particularly glycaemically variable. This
outcome is likely due, in part, to the fact that they were recent admissions to the ICU and thus much
more variable in their insulin sensitivity than the all cohort, all days stochastic model (Lin et al.,
2006; Lin et al., 2008) as later shown by Pretty et al. (2012).
Table 5-3: Clinical details of included patients for the first implementation of STAR in Liege.
Patient 1 Patient 2 Patient 3 Patient 4 Patient 5 Patient 6 Patient 7 Patient 8 Patient 9
General information
Date of birth 30/01/1931 8/03/1932 12/06/1941 13/04/1931 11/07/1928 19/12/1938 13/05/1949 14/03/1936 7/12/1965
Gender M F M M F F M M M
Primary diagnosis Hypercapnia, Coma
Aortic valve replacement
Triple coronary
artery bypass surgery
Cerebral aneurysm
Gastro-Intestinal surgery
Post-Aortic valve
replacement
Myocardial infraction +
Cardiac arrest + ECMO
Mitral valve replacement
Post-Aortic valve
replacement
Diabetic No No Yes (type II) No insulin-dependent
No Yes (type II) Insulin-
dependent
Yes (type II) No insulin-dependent
Yes (type II) No insulin-dependent
No No
Post-surgical days in ICU at the beginning of the trial
5 1 1 4 14 0 16 3 7
GC details
Initial BG (mmol/L) 11.1 8.8 8.2 9.2 8.3 8.4 9.3 10.2 8.9
Number of times nurses over-rode insulin recommendations
2 2 1 0 0 0 0 4 0
Meals / / Pudding / / Pudding / / /
Cohort and per-patient median BG values in Table 5-4 and Table 5-5 were higher than the BG target
of 6.9 mmol/L, except for Patient 2. BG levels were relatively distributed, as evidenced by the IQR
of 1.7 mmol/L in Table 5-4 for the cohort, and the 25-75 % range across patients in Figure 5-3. The
slope of the per-patient BG CDF median was steeper at low BG, as BG levels were skewed toward
higher values because of the short pilot trial length, where 8-17 % of total trial time was spent
reducing initial BG levels to 7.8 mmol/L (Table 5-4).
Table 5-4 shows that 50 % of BG measurements were between 6.1 and 7.8 mmol/L and the control
is tight in this band, as illustrated by the steep slope of BG CDF for the whole cohort in Figure 5-4
and similar per-patient CDFs in Figure 5-3. A total of 85 % of measurements were within 6.1-10.0
mmol/L range, which is largely due to the short length of trial and effective GC in lowering BG.

72
Thus, the pilot trial length was not sufficient to achieve consistently high percentages of BG levels
in a tight band around the target compared to the much longer in silico virtual trials. In addition,
patient variability played a role in the further time spent with BG > 7.8 mmol/L.
Figure 5-3: Median (dashed line), 25-75 % (dark blue area) and 5-95 % (light blue area) intervals for per-patient BG
CDFs defined on whole cohort, where the pink area is the target band.
Figure 5-4: CDFs of BG levels (left panel), exogenous insulin rate (middle panel) and exogenous glucose rate (right
panel), defined for the whole cohort, for the SL1 clinical trial.
0 5 10 15 200
0.1
0.2
0.3
0.4
0.5
0.6
0.7
0.8
0.9
1
BG (mmol/L)
Cum
ulat
ive
frequ
ency
0 5 100
0.1
0.2
0.3
0.4
0.5
0.6
0.7
0.8
0.9
1
Exogenous insulin rate (U/h)
Cum
ulat
ive
frequ
ency
0 5 10 15 200
0.1
0.2
0.3
0.4
0.5
0.6
0.7
0.8
0.9
1
Exogenous glucose rate (g/h)
Cum
ulat
ive
frequ
ency
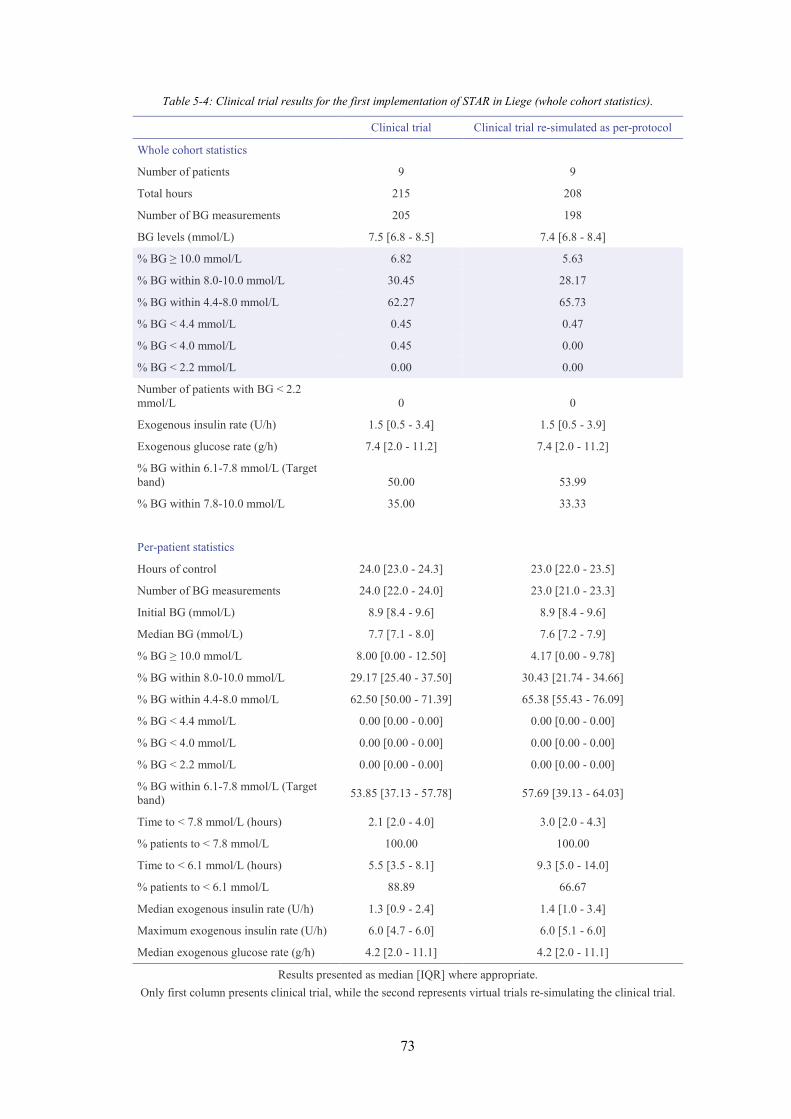
73
Table 5-4: Clinical trial results for the first implementation of STAR in Liege (whole cohort statistics).
Clinical trial Clinical trial re-simulated as per-protocol
Whole cohort statistics
Number of patients 9 9
Total hours 215 208
Number of BG measurements 205 198
BG levels (mmol/L) 7.5 [6.8 - 8.5] 7.4 [6.8 - 8.4]
% BG ≥ 10.0 mmol/L 6.82 5.63
% BG within 8.0-10.0 mmol/L 30.45 28.17
% BG within 4.4-8.0 mmol/L 62.27 65.73
% BG < 4.4 mmol/L 0.45 0.47
% BG < 4.0 mmol/L 0.45 0.00
% BG < 2.2 mmol/L 0.00 0.00
Number of patients with BG < 2.2 mmol/L 0 0
Exogenous insulin rate (U/h) 1.5 [0.5 - 3.4] 1.5 [0.5 - 3.9]
Exogenous glucose rate (g/h) 7.4 [2.0 - 11.2] 7.4 [2.0 - 11.2]
% BG within 6.1-7.8 mmol/L (Target band) 50.00 53.99
% BG within 7.8-10.0 mmol/L 35.00 33.33
Per-patient statistics
Hours of control 24.0 [23.0 - 24.3] 23.0 [22.0 - 23.5]
Number of BG measurements 24.0 [22.0 - 24.0] 23.0 [21.0 - 23.3]
Initial BG (mmol/L) 8.9 [8.4 - 9.6] 8.9 [8.4 - 9.6]
Median BG (mmol/L) 7.7 [7.1 - 8.0] 7.6 [7.2 - 7.9]
% BG ≥ 10.0 mmol/L 8.00 [0.00 - 12.50] 4.17 [0.00 - 9.78]
% BG within 8.0-10.0 mmol/L 29.17 [25.40 - 37.50] 30.43 [21.74 - 34.66]
% BG within 4.4-8.0 mmol/L 62.50 [50.00 - 71.39] 65.38 [55.43 - 76.09]
% BG < 4.4 mmol/L 0.00 [0.00 - 0.00] 0.00 [0.00 - 0.00]
% BG < 4.0 mmol/L 0.00 [0.00 - 0.00] 0.00 [0.00 - 0.00]
% BG < 2.2 mmol/L 0.00 [0.00 - 0.00] 0.00 [0.00 - 0.00]
% BG within 6.1-7.8 mmol/L (Target band) 53.85 [37.13 - 57.78] 57.69 [39.13 - 64.03]
Time to < 7.8 mmol/L (hours) 2.1 [2.0 - 4.0] 3.0 [2.0 - 4.3]
% patients to < 7.8 mmol/L 100.00 100.00
Time to < 6.1 mmol/L (hours) 5.5 [3.5 - 8.1] 9.3 [5.0 - 14.0]
% patients to < 6.1 mmol/L 88.89 66.67
Median exogenous insulin rate (U/h) 1.3 [0.9 - 2.4] 1.4 [1.0 - 3.4]
Maximum exogenous insulin rate (U/h) 6.0 [4.7 - 6.0] 6.0 [5.1 - 6.0]
Median exogenous glucose rate (g/h) 4.2 [2.0 - 11.1] 4.2 [2.0 - 11.1]
Results presented as median [IQR] where appropriate. Only first column presents clinical trial, while the second represents virtual trials re-simulating the clinical trial.

74
Table 5-5: Clinical trial results for the first implementation of STAR in Liege (per-patient statistics). Pa
tient
Tota
l hou
rs
Num
ber o
f BG
mea
sure
men
ts
Initi
al B
G (m
mol
/L)
Min
imum
BG
(mm
ol/L
)
BG le
vels
(mm
ol/L
)
% B
G ≥
10
mm
ol/L
% B
G w
ithin
8.0
-10.
0 m
mol
/L
% B
G w
ithin
4.4
-8.0
mm
ol/L
% B
G w
ithin
6.1
-7.8
mm
ol/L
(Tar
get b
and)
% B
G <
4.4
mm
ol/L
% B
G <
4.0
mm
ol/L
% B
G <
2.2
mm
ol/L
Tim
e to
< 7
.8 m
mol
/L (h
ours
)
Tim
e to
< 6
.1 m
mol
/L (h
ours
)
Exog
enou
s ins
ulin
rate
(U/h
)
Max
imum
exo
geno
us in
sulin
rate
(U/h
)
Exog
enou
s glu
cose
rate
(g/h
)
1 24 22 11.1 3.5 7.1 [6.8 - 8.6]
12.50
20.83
62.50
50.00 4.17 4.17 0.00 2.0 3.0 1.3 [0.7 -
2.0] 6.0 11.0 [11.0 - 11.0]
2 23 19 8.8 4.6 6.6 [5.9 - 7.3] 0.00 8.70 91.3
0 56.5
2 0.00 0.00 0.00 2.1 2.1 0.2 [0.0 - 1.0] 3.8 2.0 [2.0 - 2.0]
3 23 22 8.2 5.8 7.1 [6.8 - 8.1] 0.00 29.1
7 70.83
66.67 0.00 0.00 0.00 2.0 5.0 0.8 [0.0 -
1.6] 4.0 2.0 [2.0 - 2.0]
4 23 24 9.2 5.4 8.0 [6.9 - 9.3]
16.67
33.33
50.00
33.33 0.00 0.00 0.00 1.0 9.1 2.0 [0.8 -
4.0] 6.0 10.5 [9.5 - 10.5]
5 26 24 8.3 6.1 7.7 [7.4 - 8.3] 3.85 26.9
2 69.23
53.85 0.00 0.00 0.00 4.0 / 1.0 [0.0 -
2.0] 5.0 3.7 [1.4 - 7.4]
6 24 24 8.4 6.1 8.2 [7.4 - 8.8] 8.00 52.0
0 40.00
36.00 0.00 0.00 0.00 4.0 4.0 1.0 [0.0 -
4.0] 5.8 2.0 [2.0 - 2.0]
7 23 24 9.3 6.0 7.7 [7.1 - 9.1] 8.33 37.5
0 54.17
54.17 0.00 0.00 0.00 2.2 7.2 3.8 [2.8 -
5.7] 6.0 11.2 [11.2 - 11.2]
8 24 22 10.2 5.8 8.0 [7.3 - 8.9]
12.50
37.50
50.00
37.50 0.00 0.00 0.00 7.5 10.5 1.8 [0.1 -
5.8] 6.0 4.2 [4.2 - 14.9]
9 25 24 8.9 6.0 7.2 [6.7 - 8.4] 0.00 26.9
2 73.08
61.54 0.00 0.00 0.00 2.0 6.0 3.5 [1.9 -
4.8] 6.0 17.6 [12.0 - 17.6]
Results presented as median [IQR] where appropriate.
Importantly, for safety, Table 5-4 and Table 5-5 show that there were no severe hypoglycaemic
episodes (BG < 2.2 mmol/L). The minimum value reached was 3.5 mmol/L (Patient 1). Hence, the
STAR approach reduced BG levels safely without hypoglycaemia. This is a result of STAR
ensuring a maximum risk of 5 % for BG < 4.0 mmol/L and these initial results show 1 out of 205
measurements was below 4.0 mmol/L. Finally, nurses only overrode 9 of the 205 interventions
recommended, usually to give a slightly lower insulin dose, indicating good overall compliance.
The CDFs in Figure 5-4 show that no insulin was given in 20 % of controller interventions, and that
insulin rates varied over the full range allowed. Only 25 % of insulin rates were higher than 3.5
U/h, but more than half of the patients received the maximum allowable insulin rate of 6.0 U/h at
least once during the 24-hour trial (Patients 1, 4, 7, 8 and 9, Table 5-5). These results indicate the
significant intra- and inter- patient variability in insulin sensitivity, which was initially unexpected
from the cohort-based stochastic model of Lin et al. (2006) that uses all patient days of stay. This
result may have been due to three patients being in an acute post-surgical (first day) phase (Table
5-3), which was later shown to be a far more variable and resistant period (Pretty et al., 2012).
However, these results also indicate the adaptability of the model-based TGC protocol in
responding to these changes.

75
Figure 5-4 and Table 5-5 indicate patients were fed very differently, due to specific clinical orders
given. Patient 8 in particular received highly variable nutrition rates during the trial for (unspecified)
clinical reasons, which would have been a further factor in the variable insulin rates observed as the
model-based controller responded to these changes. Hence, the protocol also adapted to these
changes in a safe and generally effective fashion.
5.3.3. Prediction performance
Control performance is a direct result of the model’s prediction ability. Table 5-6 shows that the
mean prediction error is 0.8 mmol/L (10.5 %). To reduce this error, the system model has to be
improved by revisiting the fundamental model structure or the population parameters. However,
BG forecasts within stochastically defined prediction ranges (5-95 % and 25-75 %) are generally
lower than expected (71.6 % and 26.1 %, instead of 90 % and 50 %, respectively). This result shows
that this group of patients had significantly increased variability in insulin sensitivity compared to
the stochastic model used to guide control (Lin et al., 2008), which was also similar to a prior
analysis over 200 CHU patients over all days of stay (Suhaimi et al., 2010). Therefore, to make
improvements about forecasting, the original stochastic model needs to be tailored to this particular
cohort, and in particular, based on more recent data (Pretty et al., 2012), to specific days of stay.
Table 5-6: Prediction performance.
Patient 1 Patient 2 Patient 3 Patient 4 Patient 5 Patient 6 Patient 7 Patient 8 Patient 9 Mean
Median prediction error (mmol/L) 0.8 0.7 0.7 1.0 0.9 1.0 0.6 0.7 0.6 0.8
25th percentile error (mmol/L) 0.4 0.3 0.2 0.5 0.3 0.6 0.4 0.3 0.2 0.4
75th percentile error (mmol/L) 2.2 1.4 1.9 1.6 2.3 1.7 1.0 1.3 0.9 1.6
Median prediction error (%) 12.5 11.7 10.5 12.7 11.5 12.9 6.8 8.5 7.9 10.5
25th percentile error (%) 5.0 4.8 3.4 7.0 4.2 6.7 5.3 3.5 3.3 4.8
75th percentile error (%) 27.9 21.9 23.5 17.4 29.1 18.3 14.2 17.4 12.5 20.2
Total Forecasts 20 16 20 23 22 22 22 21 25 21.2
Predictions within 90 % confidence interval (%) 65 44 65 74 64 68 91 86 88 71.6
Predictions within IQR (%) 35 19 20 22 23 14 23 29 52 26.1
5.3.4. Nurse compliance
Nurse compliance was assessed by comparing clinical data and virtual trial re-simulations of the
clinical trial. Differences in glycaemic outcomes resulted from different nursing interventions, in
terms of administrated insulin rates and measurements frequency (Table 5-4), and from the ability

76
of the simulation environment to replicate the clinical trial (Chase et al., 2010b). Hence, basic
compliance can be assessed and quantified.
During the pilot trial, slightly less insulin (p = 0.13) than specified by the protocol was administered
to patients. In some cases, the nurses chose to override the recommendations (9 of 205, 4.39 %),
which may explain the slightly higher BG levels for the clinical data (p = 0.78). The difference in
trial length and number of BG measurements in the simulated trial can be attributed to differing
measurement intervals allowed in the re-simulations by STAR. However, with respect to glycaemic
outcome, these differences are not clinically significant. Overall, these results indicate an overall
good nurse compliance to STAR.
5.3.5. Discussion
This proof-of-concept trial was the first attempt to use the STAR approach outside the neonatal ICU
(Le Compte et al., 2009) and initial STAR trials in Christchurch ICUs (Evans et al., 2012). The
most important result is that no severe hypoglycaemia (BG < 2.2 mmol/L) occurred during those
24-hour clinical pilot trials. The minimum BG recorded was 3.5 mmol/L for Patient 1, with the next
lowest at 4.6 mmol/L for Patient 2, better than the permitted 5 % of BG < 4.0 mmol/L designed into
STAR. Hence, there was no apparent risk of hypoglycaemia, despite the unexpected high metabolic
variability in insulin sensitivity observed.
The level of control was consistent across different, highly variable patients, as seen in Figure 5-3.
However, % BG within the 6.1-7.8 mmol/L (50.00 %) was low compared to the percentage
observed in virtual trials (71.63 %, Table 5-2). This reduction in control level was due primarily to
patient variability, high initial BG levels, and the short 24-hour total trial length not allowing stable
BG periods to accumulate as in the virtual trials. The fact that relatively long times in the desired
glycaemic bands (6.1-7.8 mmol/L in particular) were achieved supports the overall efficacy of this
approach.
During the pilot trial, several patients displayed large variability in insulin sensitivity, as illustrated
by Patient 3 in Figure 5-5. This variability exceeded the predictions of the cohort-based stochastic
model and made accurate model-based forecasting, prediction and GC more difficult. As a result,
forecasts within prediction ranges were lower than expected (Table 5-6). The causes may be due to
exceptional or extraordinary patients. Equally, as noted, the early days of stay were later found to
be more insulin resistant and variable (Pretty et al., 2012), and this behaviour may also be a
significant factor in these observations.

77
The main goal of this pilot trial was to assess performance, safety and implementation issues. In
particular, several features were adapted for clinical implementation and to reduce nursing effort,
which was higher than desired. Three-hour measurement periods would be desirable to further
reduce nursing staff effort. However, as patients were not glycaemically stable in this pilot trial,
such an improvement may have been detrimental to control here. Longer trials over more patients
would see improvements if variability declined over time or if patients were less variable than the
small subset in this pilot trial.
Figure 5-5: STAR trial progression for Patient 3 in terms of BG levels (top) and model-based insulin sensitivity
(bottom).
When insulin infusions are used with hourly measurement, a measurable fraction of the
administered insulin has no time to act before the end of the hour, and insulin “cycling” may occur.
Insulin “cycling” is defined here as periodic insulin rate evolution characterised by a progressive
increase followed by a sudden decrease. This behaviour is illustrated by Patient 6 in Figure 5-6.
These cycles occur in part due to clinically imposed limits in increasing insulin infusion rates (for
safety) in response to increasing BG. However, because a given infusion rate’s full effect is not
seen before the end of one hour the controller using a model for hour-to-hour control may
underestimate its effect and thus increase the infusion rate further.
The effect of insulin not being fully used after 1 hour is exacerbated at the relatively low (or zero)
insulin infusion rates seen in this study. The presence of higher rates of insulin infusion may allow
the model to make a more accurate estimation of patient state by reducing the contribution of
modelled endogenous insulin production, for which the model assumes a population constant
(Chase et al., 2010b) as it and plasma insulin are not currently measurable in real-time. Hence,
0 5 10 15 20 250
2
4
6
8
10
12
BG
(mm
ol/L
)
5-95 % BG forecast25-75 % BG forecastMedian BG forecastBG measurements
0 5 10 15 20 250
2
4 x 10⁻⁴
Time (h)
SI (L
/(mU
.min
))
Insulin sensitivity

78
longer time intervals might be better when using infusions of insulin compared to bolus
administration in SPRINT (Lonergan et al., 2006b), and STAR (Evans et al., 2011), which are
effectively fully used by the end of each hour.
Figure 5-6: STAR trial progression for Patient 6 in terms of insulin rates with a constant nutritional administration
rate.
Protocol implementation in the clinical environment was not perfect. Some situations were not
managed automatically by the controller, such as when the patient vomited or was given meals.
Such events were managed on a case-by-case basis by stopping the dextrose input to the controller,
or assuming an equivalent dextrose infusion, for vomiting and meals, respectively. These events
are important for GC because BG levels are directly linked to carbohydrate administration and
appearance. The resulting estimations made on how much carbohydrate might appear, and at what
time, may also have affected the quality of control obtained. These issues affected Patients 3, 5, 6
and 8 on one occasion each. Future work will involve revising the control scheme to take better
account of such possible scenarios to improve the clinical implementation and make it more
autonomous.
5.4. Summary
This chapter presented the first clinical implementations of the STAR framework in a Belgian ICU.
This chapter first described the development and optimisation of the STAR framework to fit the
CHU clinical practice and meet clinician requirements. It then compared customised and optimised
STAR protocol, SL1, to the existing Glucontrol protocol to determine an optimal GC approach to
use at the CHU of Liege. This comparative study was performed using virtual trials on retrospective
clinical data from 196 Belgian patients included in the Glucontrol study. Virtual trials results
showed that STAR enabled tighter BG distribution around a glycaemic target, with reduced
hyperglycaemia (BG ≥ 10.0 mmol/L) while not increasing the risk of hypoglycaemia (BG < 4.0
mmol/L). SL1 protocol was shown to be efficient and safe in silico.
5 10 15 20 250
2
4
6
8
Insu
lin (U
/h)
Time (h)

79
Second, this chapter presented the clinical implementation of SL1 during a pilot trial. This pilot
trial assessed the GC performance in terms of efficiency and safety of SL1 in real, clinical
environment. Clinical results showed that the GC protocol was effective and safe, resulting in no
severe hypoglycaemic event (BG < 2.2 mmol/L) for the nine patients included in the pilot trial.
Among the 205 BG measurements, only one was below 4.0 mmol/L (3.5 mmol/L). Controlled BG
levels were tightly distributed. However, the pilot trial length of 24-hours was not designed to show
long-term steady state control. Thus, despite every patient reaching the target of 6.9 mmol/L,
median BG values were slightly higher than this glycaemic target.
This clinical trial was also an opportunity to assess the ability to adapt the model-based STAR
framework from its development environment at Christchurch Hospital in New Zealand to a
completely separate institute in Liege, Belgium. An important result was the observation that some
patients were significantly more variable in their insulin sensitivity than expected from the initial
stochastic cohort model using all patient days of stay, an outcome later shown in related work.
Improved stochastic models are needed to prospectively test these outcomes in further ongoing
clinical pilot trials in this and other units.
Post-analysis showed an overall good nurse compliance to STAR but implementation issues were
also highlighted during this pilot trial. In particular, several features were adapted for clinical
implementation and to reduce nursing effort, which was higher than desired. First, three-hour
measurement periods would be desirable to further reduce nursing staff effort. Longer intervals can
be implemented using improved stochastic models and accepting a lower level of control than
targeted in this study. Moreover, longer time intervals might be better when using infusions of
insulin. Then, during the clinical trial, meal administration or patient vomiting were managed on a
case-by-case basis by assuming an equivalent dextrose infusion or stopping the dextrose input to
the controller, respectively. Future work will involve revising the control scheme to take better
account of such possible scenarios to improve the clinical implementation and make it more
autonomous.
The overall results show tight, very safe control for post-cardiac surgery patients who exhibit
significantly enhanced variability. Thus, the fundamental STAR concept has been shown to be safe
and effective when adapted, within its control framework, for an insulin-only approach in this
Belgian ICU. Specific issues to be modified to enhance performance and usability were identified
in this short, proof-of-concept trial, and will be implemented in a next generation pilot trial.

80

81
Chapter 6. How to resolve the issues
of the glycaemic control clinical
implementation? Enhanced
glycaemic control approach
The STAR GC approach was customised in Chapter 5 in glycaemic target and control intervention
to match clinical practice at the CHU of Liege, Belgium. Results showed that STAR enabled safe,
effective GC for an insulin-only approach in Belgian ICU settings. This first pilot trial also showed
that some patients were significantly more variable in their insulin sensitivity than expected from
the initial stochastic cohort model. Post-analysis showed overall good nursing compliance to STAR,
but highlighted several implementation issues. In particular, three-hour measurement periods would
be desirable to further reduce nursing staff effort and might be more effective when using insulin
infusions.
This chapter presents the specific issues to be modified to enhance performance and usability of the
STAR GC approach in a real, clinical environment. First, this chapter explores the suitability of the
initial stochastic model to this Belgian group of patients. In particular, are the stochastic models
generated from a heterogeneous ICU population over all patient days applicable, or are more
specialised stochastic models by day or specific cohort required? Second, the STAR framework is
enhanced to further reduce nurse workload while improving GC approach, by improving the
modelling of the insulin kinetics. The objective of this chapter is to provide a new enhanced STAR
framework to address these issues.

82
6.1. Improvement of the stochastic model
6.1.1. Introduction
As explained in Section 2.5.5, the goal of a stochastic model is to describe the variability of the
insulin sensitivity. More precisely, it describes the hourly changes in insulin sensitivity to improve
assessment of the patient’s insulin response. A stochastic model is based on clinically observed
insulin sensitivity variations in ICU population data. These clinical data can come from a specific
type of patient and can be selected as a function of the day of stay.
The stochastic model used in the first clinical trial was based on all types of patients included in the
SPRINT (Chase et al., 2008b) GC study and all patient days of stay (Lin et al., 2006; Lin et al.,
2008). However, the pilot trial SL1 showed that post-operative cardiac surgery patients were
significantly more variable in their insulin sensitivity than expected during the first post-operative
hours. This observed behaviour matched later reports (Pretty et al., 2012). Hence, new stochastic
models using data from cardiac-surgery patients were generated to better account for this variability
in insulin sensitivity and for post-trial assessment of its impact on the clinical results.
6.1.2. Method
Six new stochastic models using data from cardiac-surgery patients were defined, as shown in Table
6-1. Each new stochastic model was based on different clinical data sets characterised by three
features:
1. The study group: clinical data can come from patients included in the SPRINT study or in
the Glucontrol study (or both);
2. The type of patients: clinical data can come from all patients included in the previous
selected study(ies), or from a specific type of patients (CVS or not CVS patients);
3. The days of stay: clinical data can come from all days or specific day(s) of patient ICU
stay.
Stochastic models used data from specific days and cohorts to better cope with the enhanced
variability observed clinically in the specific pilot trial cardiac-surgery patients. Patient data from
the SPRINT and Glucontrol databases were used to create these new stochastic models. SPRINT
patients were treated at Christchurch hospital in New Zealand between August 2005 and May 2007
(Chase et al., 2008b) and Glucontrol was a multi-centre study with patient clinical data from 21

83
participating European ICUs from November 2004 to May 2006 (Preiser et al., 2009). However,
only Glucontrol data from the CHU of Liege site was used here.
These stochastic models were assessed using the clinical data from the first clinical trial of STAR
in Liege, SL1 (Section 0). Forecasting performance was assessed by the number of clinical results
falling in an IQR (50 % confidence interval band) and 90 % confidence interval band. The different
stochastic models were assessed in virtual trial re-simulations of the clinical trial to determine the
potential impact on interventions given and glycaemic outcomes.
Table 6-1: New stochastic model definitions.
Stochastic model Study group Type of patients Patient days of stay N
Original SM SPRINT All patients All days of stay 49008
SM 1 SPRINT CVS patients Day 1 1361
SM 2 SPRINT CVS patients Day 2 701
SM 3 SPRINT Non-CVS patients Day 1 6442
SM 4 Glucontrol All patients Day 1 991
SM 5 (SM 1 + SM 4) SPRINT Glucontrol
CVS patients All patients
Day 1 Day1
2352
SM 6 (SM 1 + SM 2) SPRINT CVS patients Days 1 and 2 2062
N refers to the number of hours used to create the stochastic model.
6.1.3. Results
This section analyses the changes due to the incorporation of different stochastic models
representing cardiac-surgery post-operative patients (Table 6-1). Virtual trials were performed
using the six new stochastic models to better assess the increased variability in insulin sensitivity
observed during the first Belgian pilot trial of STAR (Section 0).
The original stochastic model, based on all SPRINT patients over their entire ICU stay and used
during clinical pilot trial, had only 71.6 % of forecasts within 5-95 % and 26.1 % within 25-75 %
(Table 5-6). Among the proposed models in Table 6-1, stochastic model SM 5 yielded 85.1 % and
43.8 %, respectively. These values are acceptable (Lin et al., 2008) given the relatively low number
(N = 205) of predictions. Therefore, this new stochastic model generated solely from CVS SPRINT
and all Glucontrol patient data on only day 1 of their stay, better accounts for the variability in
insulin sensitivity observed in this trial with similar patients. SM 1, 2, 4 and 6 are similar in results,
and, notably use only the first 1-2 days of stay for CVS or cardiac care patients, similar to the cohort
in this ICU. Comparison of the model control performance for these new stochastic models is shown
in Table 6-2.

84
Table 6-2: Prediction performance for new stochastic models.
Original SM SM 1 SM 2 SM 3 SM 4 SM 5 SM 6
Median prediction error (mmol/L) 0.8 0.9 0.8 0.8 0.7 0.8 0.8
25th percentile error (mmol/L) 0.4 0.4 0.4 0.3 0.4 0.4 0.4
75th percentile error (mmol/L) 1.6 1.7 1.5 1.6 1.6 1.6 1.6
Median prediction error (%) 10.5 11.6 10.5 10.4 10.2 11.2 11.1
25th percentile error (%) 4.8 5.8 4.8 4.5 4.6 5.0 4.9
75th percentile error (%) 20.2 20.7 20.1 20.3 20.9 20.6 20.3
Predictions within 90 % confidence interval (%) 71.6 84.3 78.0 79.3 82.5 85.1 83.1
Predictions within IQR (%) 26.1 46.5 41.2 40.0 44.2 43.8 41.3
The potential impact of control performance of using a more specialised stochastic model was
investigated in virtual trial re-simulations of the clinical trial. Table 6-3 presents whole cohort and
per-patient statistics of the clinical trial (first column), the re-simulated clinical trial using the
original stochastic model (second column) and using the new SM 5 (third column). Differences
between first and third columns, and between second and third columns assess possible outcomes
from using a stochastic model more specific to the patient group included in the first pilot trial.
Table 6-3 shows no real difference in measurement frequency using the new SM 5. In addition,
patients received more insulin (~ 30 %) in the re-simulated trials, especially with SM 5. This result
explains the lower BG levels associated with SM 5. Nutrition rates were kept at the clinically
specified levels. Table 6-4 shows the p-values comparing the distribution of BG levels, insulin and
nutrition rates. The first column indicates that using a more relevant stochastic model (SM 5) would
have yielded a different set of insulin interventions, as seen in Table 6-3, with lesser impact on BG
likely due to trial length. The p–value of 0.91 related to comparison of nutrition rates between
clinical trial and re-simulation trial results from small increases in nutrition in re-simulations. The
SL1 protocol recommends an increase in nutrition rates at lower BG values (BG ≤ 6.0 mmol/L)
with no insulin being given. But, during the clinical trial, this rule was not always followed.
6.1.4. Discussion
New stochastic models using clinical data specific to CVS patients and for specific days post-
surgery were much more effective in capturing this variability. The improved forecasting in Table
6-2 for models using only 1-2 days of stay indicates that the greater variability seen here may be
reflective of patients early in their stay being more variable. Earlier analyses (Suhaimi et al., 2010)
showed similar variability for a similar cohort over all days, but did not examine specific patients

85
or days of stay. Equally, these nine patients may simply have been more variable. However, the
overall results matched those of later studies on different, larger cohorts (Pretty et al., 2012).
Table 6-3: Re-simulated clinical trial results for the improvement of the stochastic model (whole cohort statistics).
Clinical trial Clinical trial re-simulated as per-protocol with initial SM
Clinical trial re-simulated as per-protocol with new SM 5
Whole cohort statistics
Number of patients 9 9 9
Total hours 215 208 208
Number of BG measurements 205 198 198
BG levels (mmol/L) 7.5 [6.8 - 8.5] 7.4 [6.8 - 8.4] 7.2 [6.6 - 8.3]
% BG ≥ 10.0 mmol/L 6.82 5.63 6.10
% BG within 8.0-10.0 mmol/L 30.45 28.17 23.94
% BG within 4.4-8.0 mmol/L 62.27 65.73 68.54
% BG < 4.4 mmol/L 0.45 0.47 1.41
% BG < 4.0 mmol/L 0.45 0.00 0.00
% BG < 2.2 mmol/L 0.00 0.00 0.00
Number of patients with BG < 2.2 mmol/L 0 0 0
Exogenous insulin rate (U/h) 1.5 [0.5 - 3.4] 1.5 [0.5 - 3.9] 2.0 [0.8 - 4.7]
Exogenous glucose rate (g/h) 7.4 [2.0 - 11.2] 7.4 [2.0 - 11.2] 7.4 [2.0 - 11.2]
% BG within 6.1-7.8 mmol/L 50.00 53.99 54.46
% BG within 7.8-10.0 mmol/L 35.00 33.33 28.64
Per-patient statistics
Hours of control 24.0 [23.0 - 24.3] 23.0 [22.0 - 23.5] 23.0 [22.0 - 23.5]
Number of BG measurements 24.0 [22.0 - 24.0] 23.0 [21.0 - 23.3] 23.0 [21.0 - 23.3]
Initial BG (mmol/L) 8.9 [8.4 - 9.6] 8.9 [8.4 - 9.6] 8.9 [8.4 - 9.6]
Median BG (mmol/L) 7.7 [7.1 - 8.0] 7.6 [7.2 - 7.9] 7.3 [6.9 - 7.7]
% BG ≥ 10.0 mmol/L 8.00 [0.00 - 12.50] 4.17 [0.00 - 9.78] 4.17 [0.00 - 13.04]
% BG within 8.0-10.0 mmol/L 29.17 [25.40 - 37.50] 30.43 [21.74 - 34.66] 23.08 [16.30 - 27.26]
% BG within 4.4-8.0 mmol/L 62.50 [50.00 - 71.39] 65.38 [55.43 - 76.09] 69.57 [64.13 - 74.67]
% BG < 4.4 mmol/L 0.00 [0.00 - 0.00] 0.00 [0.00 - 0.00] 0.00 [0.00 - 0.00]
% BG < 4.0 mmol/L 0.00 [0.00 - 0.00] 0.00 [0.00 - 0.00] 0.00 [0.00 - 0.00]
% BG < 2.2 mmol/L 0.00 [0.00 - 0.00] 0.00 [0.00 - 0.00] 0.00 [0.00 - 0.00]
%BG within 6.1-7.8 mmol/L 53.85 [37.13 - 57.78] 57.69 [39.13 - 64.03] 52.17 [42.39 - 65.22]
Time to < 7.8 mmol/L (hours) 2.1 [2.0 - 4.0] 3.0 [2.0 - 4.3] 3.0 [2.0 - 4.3]
% patients to < 7.8 mmol/L 100.00 100.00 100.00
Time to < 6.1 mmol/L (hours) 5.5 [3.5 - 8.1] 9.3 [5.0 - 14.0] 7.2 [5.3 - 12.9]
% patients to < 6.1 mmol/L 88.89 66.67 77.78
Median exogenous insulin rate (U/h) 1.3 [0.9 - 2.4] 1.4 [1.0 - 3.4] 1.7 [1.0 - 4.3]
Maximum exogenous insulin rate (U/h) 6.0 [4.7 - 6.0] 6.0 [5.1 - 6.0] 6.0 [5.8 - 6.0]
Median exogenous glucose rate (g/h) 4.2 [2.0 - 11.1] 4.2 [2.0 - 11.1] 4.2 [2.0 - 11.1]
Results presented as median [IQR] where appropriate. Only first column presents clinical trial, while two others are virtual trials re-simulating the clinical trial.
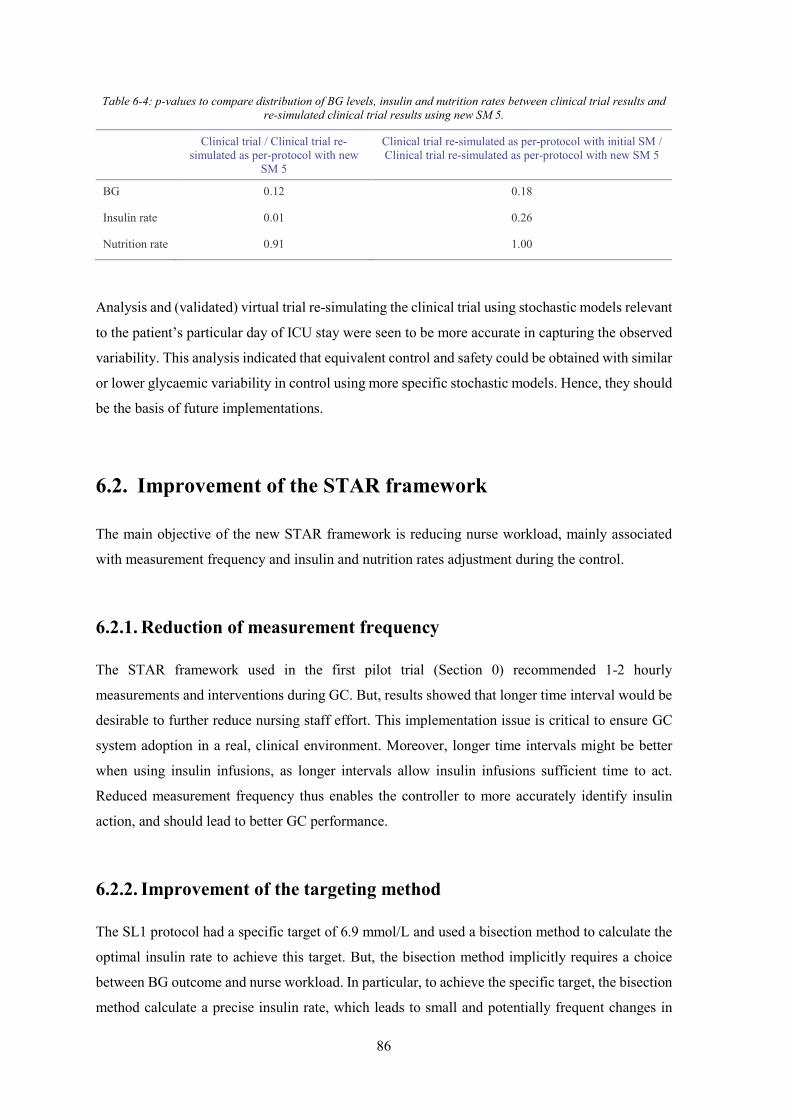
86
Table 6-4: p-values to compare distribution of BG levels, insulin and nutrition rates between clinical trial results and re-simulated clinical trial results using new SM 5.
Clinical trial / Clinical trial re-simulated as per-protocol with new
SM 5
Clinical trial re-simulated as per-protocol with initial SM / Clinical trial re-simulated as per-protocol with new SM 5
BG 0.12 0.18
Insulin rate 0.01 0.26
Nutrition rate 0.91 1.00
Analysis and (validated) virtual trial re-simulating the clinical trial using stochastic models relevant
to the patient’s particular day of ICU stay were seen to be more accurate in capturing the observed
variability. This analysis indicated that equivalent control and safety could be obtained with similar
or lower glycaemic variability in control using more specific stochastic models. Hence, they should
be the basis of future implementations.
6.2. Improvement of the STAR framework
The main objective of the new STAR framework is reducing nurse workload, mainly associated
with measurement frequency and insulin and nutrition rates adjustment during the control.
6.2.1. Reduction of measurement frequency
The STAR framework used in the first pilot trial (Section 0) recommended 1-2 hourly
measurements and interventions during GC. But, results showed that longer time interval would be
desirable to further reduce nursing staff effort. This implementation issue is critical to ensure GC
system adoption in a real, clinical environment. Moreover, longer time intervals might be better
when using insulin infusions, as longer intervals allow insulin infusions sufficient time to act.
Reduced measurement frequency thus enables the controller to more accurately identify insulin
action, and should lead to better GC performance.
6.2.2. Improvement of the targeting method
The SL1 protocol had a specific target of 6.9 mmol/L and used a bisection method to calculate the
optimal insulin rate to achieve this target. But, the bisection method implicitly requires a choice
between BG outcome and nurse workload. In particular, to achieve the specific target, the bisection
method calculate a precise insulin rate, which leads to small and potentially frequent changes in

87
insulin rates. Then, to reduce nursing staff workload associated with these small and frequent
changes and thus improve clinical implementation, insulin rates were limited to specific values.
This limitation is associated with deviation of the BG outcome from the specific glycaemic target.
More importantly, the clinically specified glycaemic target was changed to a target band. In
addition, the GC goal was changed to maximise the overlap of the potential overall glycaemic
outcome range with this clinically specified band, a target-to-range approach. The 5 % limit of BG
less than a hypoglycaemic threshold was kept.
6.3. Enhancement of insulin kinetic modelling
As STAR is a model-based GC protocol, improvement of the modelling of the glucose-insulin
system is directly associated with an improvement of the GC approach. The SL1 protocol is based
on Model 1, described in Section 2.5.1. However, this model does not accurately describe insulin
kinetics as it does not explicitly model insulin clearance and transport from plasma to the interstitial
space (Lin et al., 2011). Model 2 presents an extensive insulin kinetics modelling and thus better
captures BG variation in response to insulin (Section 2.5.2).
6.4. New enhanced STAR protocol framework
Previous improvements are combined to generate an enhanced STAR protocol framework. The
step-by-step description of the overall new STAR GC approach is partly illustrated in Figure 6-1,
and the insulin rate and the time interval are calculated as follows:
1. Previous and current BG measurements and clinical data (nutrition and insulin rates) are
used to identify a patient-specific current insulin sensitivity parameter value for the prior
time interval (Hann et al., 2005). This step accounts for inter-patient variability (Chase et
al., 2007; Chase et al., 2010b; Lonergan et al., 2006b).
2. Possible insulin rates and time intervals are assessed. Insulin rates are limited to specific
values between 0.0 U/h and 6.0 U/h, with an increment of 0.5 U/h, except between 0.0 U/h
and 1.0 U/h. Possible insulin rates are thus 0.0, 1.0, 1.5, 2.0, 2.5, 3.0, 3.5…6.0 U/h. The
increment is defined to reduce nurse workload associated with making small and frequent
changes in insulin rates. The maximum insulin rate of 6.0 U/h is defined for safety and to
avoid insulin saturation effects (Rizza et al., 1981, Black et al., 1982). Note that this

88
maximum insulin rate can be clinically specified. Possible time intervals are limited to 2
and 3 hours.
However, in two specific cases, no insulin is required. First, when the current BG value is
more than 1 mmol/L below the 5th percentile expected BG value from the last protocol
intervention; second, when the current BG level is lower than a hypoglycaemic threshold
value. This hypoglycaemic threshold is clinically specified.
3. For each possible time interval (2 and 3 hours), the glycaemic outcomes of all possible
insulin interventions, defined in Step 2, are assessed. The insulin rate resulting in the
forecast 5th percentile BG value closest to the lower bound of the target range, but above a
hypoglycaemic threshold value, is selected among the possible insulin rates defined in Step
2. More precisely, for each possible time interval, the assessment of each possible insulin
intervention includes 3 phases:
a. The stochastic model (SM 5, Section 6.1) provides a distribution of possible SI
parameter values for the next time interval (2 or 3 hours), based on the current
insulin sensitivity value identified in Step 1. This phase accounts for the intra-
patient variability typically observed in critically ill patients (Lin et al., 2006; Lin
et al., 2008).
b. Based on the insulin sensitivity distribution and for each of the possible insulin
rates defined in Step 2, the 5th and the 50th (median) percentile BG outcome
predictions are calculated using Model 2 and the 95th and 50th (median),
respectively, percentile expected insulin sensitivity values obtained from Phase a.
This phase calculates the glycaemic variability due to intra-patient variability and
the 5th percentile BG value illustrates the possible BG spread towards
hypoglycaemia due to intra-patient variability.
c. For each time interval (2 and 3 hours), the goal is to find the insulin rates that put
the 5th percentile BG value closest to the lower bound of the target range, but above
the hypoglycaemic threshold, to maximise overlap of the outcome BG range with
the desired target range and to ensure safety, respectively.
In addition, a median BG value lower than a hyperglycaemic threshold value is
required for 3-hourly measurements. Otherwise, only a 2-hour interval is offered.
This step leads to one selected insulin rate per possible time interval. Note that there is
always at least one recommendation for the 2-hour interval and a maximum of two
recommendations when 2- and 3- hourly measurements are allowed.

89
4. Among selected insulin rates from Step 3, the insulin rate associated with the longest
possible time interval is selected to minimise nurse workload. The time interval is thus set
to that longest possible time interval.
This enhanced STAR protocol framework is characterised by two glycaemic bands (Figure 6-1):
the target band (in grey) and the range of glycaemic outcomes (in pink) due to insulin sensitivity
variability (Step 3.b). The protocol aims to maximise the overlap between these bands, such that
the 5th percentile BG is above the hypoglycaemic threshold. It is thus a target-to-range approach.
Figure 6-1: STAR protocol framework for its second implementation at CHU of Liege.
6.5. Summary
This chapter presented the specific issues to be modified to enhance performance and usability of
the STAR GC approach in a real, clinical environment. First, this chapter explored the suitability
of the initial stochastic model to this Belgian group of patients. The first pilot trial showed that
some patients were significantly more variable in their insulin sensitivity than expected from the
BG
SI
BG
SI
BG
SI
BG
SI
Initial situation Step 1 Step 3, Phase a Step 3, Phase b
BG
SI
Step 3, Phase c
XXXX
BG
SI
Step 3, Phase c
VVVV
Median value Interquartile range: 25th-75th percentile band 90% confidence interval: 5th-95th percentile band
Median value Interquartile range: 25th-75th percentile band 90% confidence interval: 5th-95th percentile band
Insulin sensitivity SI
Blood glucose BG
Hypoglycaemic threshold Target band

90
initial stochastic cohort model. New stochastic models were created to better account for this
variability. The application of a stochastic model using only the initial 1-2 days of stay would have
resulted in different, more continuous insulin interventions and better forecasting. Ongoing next-
generation pilot trials are thus expected to account for this variability directly and should thus
reduce the measurement rate seen here as a result.
The second part of this chapter consisted in the development of a new enhanced STAR framework
to further reduce nurse workload, while improving GC approach, by improving the modelling of
the insulin kinetics. In particular, only 2- and 3- hourly insulin interventions were offered. The goal
was changed to maximise the overlap of the potential glycaemic outcome range with a clinically
specified band, a target-to-range approach. The implementation of this new STAR framework in
Liege is now required to assess GC performance and safety in real, clinical environment.

91
Chapter 7. How to improve glycaemic
control implementation in
intensive care settings? Second
pilot trial
The first implementation of the STAR framework in a Belgian ICU was associated with safe,
effective GC. This SL1 pilot trial also showed increased insulin sensitivity variability in this Belgian
group of patients compared to what was expected, and highlighted several issues related to clinical
implementation of STAR. Based on these issues, the STAR framework was improved to enhance
its performance and usability in a real, clinical environment. This chapter presents the second
clinical implementation of the STAR framework in the same Belgian ICU.
7.1. Introduction
This chapter assesses the performance and safety of the enhanced STAR framework of Chapter 6.
The stochastic model used here directly accounted for increased variability of insulin sensitivity by
using clinical data specific to CVS patients and for the first days of stay. The target-to-range
approach is designed to improve control, safety and reduce nursing workload.

92
7.2. Virtual trials
Virtual trials are used to analyse and assess the performance and safety of an improved STAR
protocol in silico. The virtual trial process has been previously described in Section 2.7 and
illustrated in Figure 2-9. It is also described and validated in detail in Chase et al. (2010b).
7.2.1. Patient cohort
The first step of a virtual trial is to use clinical data to generate the insulin sensitivity profiles that
represent the virtual patients (Section 2.7.1). The virtual patient cohort was previously described in
Section 5.2.1 and is the same here. It includes clinical data from 196 Belgian patients included in
Glucontrol study at the CHU of Liege between March 2004 and April 2005. The patient
characteristics and demographics were summarised in Table 5-1.
7.2.2. STAR-Liege 2 protocol
Four major changes were made for the STAR-Liege 2 (SL2) protocol, compared with the SL1
protocol. First, the clinically specified glycaemic target of 6.9 mmol/L was changed to a target band
(5.6-7.8 mmol/L). Second, measurement frequency was reduced, and only 2-hourly and 3-hourly
interventions were used to reduce workload. Third, the SL2 protocol did not specify any nutrition
whatsoever and did not recommend increased nutrition rates at low BG concentrations making the
controller more simple and transparent. Finally, an improved glucose-insulin system model was
also used (Model 2). The enhanced STAR framework has been described in detail in Section 6.4.
The maximum insulin rate was clinically set to 6.0 U/h, with a maximum increase of 2.0 U/h from
the previous insulin rate. The hypoglycaemic threshold was set to 5.0 mmol/L. The hyperglycaemic
threshold used for 3-hourly measurement was set to 7.8 mmol/L. These values characterise the
overall framework values that define this STAR implementation.
7.2.3. Results
Table 7-1 presents the results of the virtual trials for the SL1 and SL2 protocols. SL2 presents
equivalent BG outcomes (p = 0.00), as illustrated in Figure 7-1, with similar insulin rates (p = 0.00)
but with a significantly reduced measurement frequency. The new protocol is associated with a less
tight GC. This issue is explained by the reduction in the number of BG measurements and the use
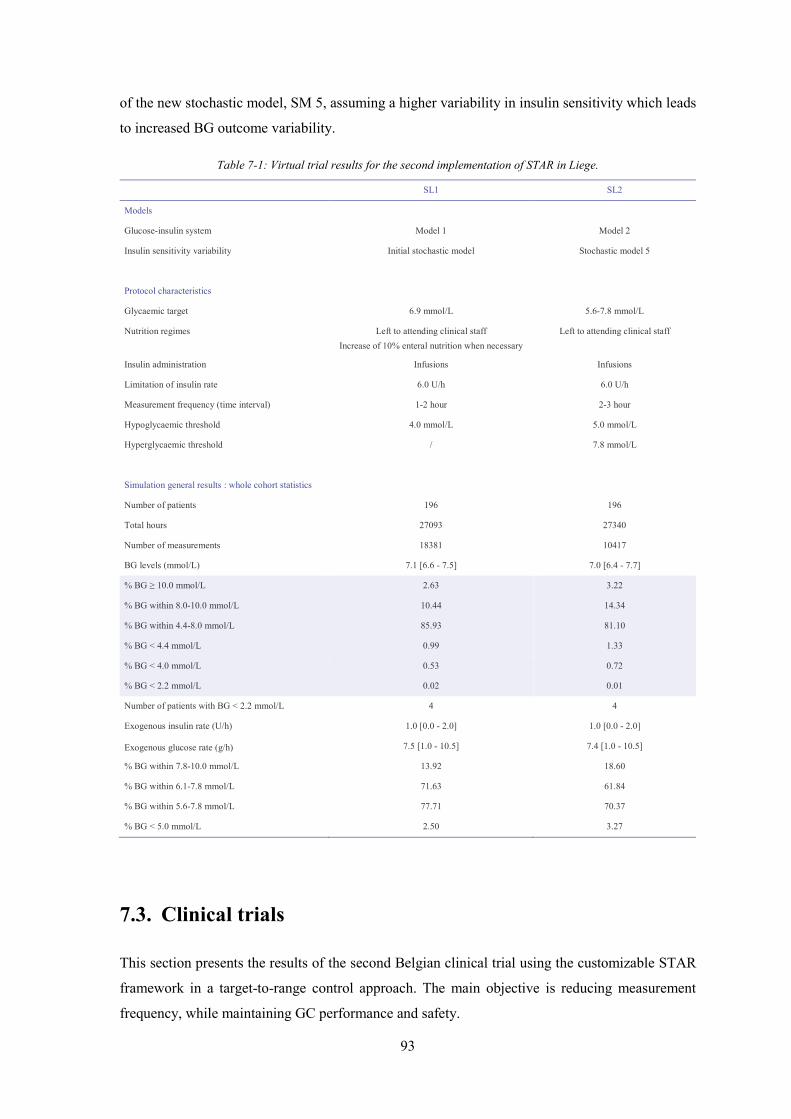
93
of the new stochastic model, SM 5, assuming a higher variability in insulin sensitivity which leads
to increased BG outcome variability.
Table 7-1: Virtual trial results for the second implementation of STAR in Liege.
SL1 SL2
Models
Glucose-insulin system Model 1 Model 2
Insulin sensitivity variability Initial stochastic model Stochastic model 5
Protocol characteristics
Glycaemic target 6.9 mmol/L 5.6-7.8 mmol/L
Nutrition regimes Left to attending clinical staff Increase of 10% enteral nutrition when necessary
Left to attending clinical staff
Insulin administration Infusions Infusions
Limitation of insulin rate 6.0 U/h 6.0 U/h
Measurement frequency (time interval) 1-2 hour 2-3 hour
Hypoglycaemic threshold 4.0 mmol/L 5.0 mmol/L
Hyperglycaemic threshold / 7.8 mmol/L
Simulation general results : whole cohort statistics
Number of patients 196 196
Total hours 27093 27340
Number of measurements 18381 10417
BG levels (mmol/L) 7.1 [6.6 - 7.5] 7.0 [6.4 - 7.7]
% BG ≥ 10.0 mmol/L 2.63 3.22
% BG within 8.0-10.0 mmol/L 10.44 14.34
% BG within 4.4-8.0 mmol/L 85.93 81.10
% BG < 4.4 mmol/L 0.99 1.33
% BG < 4.0 mmol/L 0.53 0.72
% BG < 2.2 mmol/L 0.02 0.01
Number of patients with BG < 2.2 mmol/L 4 4
Exogenous insulin rate (U/h) 1.0 [0.0 - 2.0] 1.0 [0.0 - 2.0]
Exogenous glucose rate (g/h) 7.5 [1.0 - 10.5] 7.4 [1.0 - 10.5]
% BG within 7.8-10.0 mmol/L 13.92 18.60
% BG within 6.1-7.8 mmol/L 71.63 61.84
% BG within 5.6-7.8 mmol/L 77.71 70.37
% BG < 5.0 mmol/L 2.50 3.27
7.3. Clinical trials
This section presents the results of the second Belgian clinical trial using the customizable STAR
framework in a target-to-range control approach. The main objective is reducing measurement
frequency, while maintaining GC performance and safety.

94
Figure 7-1: CDFs of BG levels (left panel), exogenous insulin rate (middle panel) and exogenous glucose rate (right
panel), defined for the whole cohort, for the SL2 virtual trial.
7.3.1. Patients
The SL2 protocol was tested in November and December 2010 at the CHU in Liege, Belgium. Each
pilot trial was 24-hour long. The clinical trial included nine patients from the surgical ICU of which
three patients (Patients 2, 5 and 9) were in the first 48 hours post-surgery. Initially, patients were
recruited if they had two consecutive BG levels > 8.0 mmol/L. In practice, clinicians also included
highly glycaemically variable patients (Patients 1, 2 and 5). The clinician stopped Patient 2 after 7
hours due to the diagnosis of pancreatic disease. Table 7-2 shows the patient details and per-patient
control information. The Ethics Committee of the Medical Faculty of the University of Liege
(Liege, Belgium) granted approval for this trial and the audit, analysis and publication of this data.
For each patient, the trial started with a BG measurement made by nursing staff. BG measurements
were made using Accu-Chek Inform (Roche Diagnostics, Mannheim, Germany) glucometers or a
blood gas analyzer (RAPIDPoint 500 Systems, Siemens, Munich, Germany), depending on
availability. The protocol then calculated a new insulin infusion rate, which was then given by the
nurse. The time interval until the next BG measurement was also specified. This overall clinical
procedure was previously shown in Figure 2-12 (Section 2.8).
0 5 100
0.1
0.2
0.3
0.4
0.5
0.6
0.7
0.8
0.9
1
BG (mmol/L)
Cum
ulat
ive
frequ
ency
0 2 4 60
0.1
0.2
0.3
0.4
0.5
0.6
0.7
0.8
0.9
1
Exogenous insulin rate (U/h)
Cum
ulat
ive
frequ
ency
0 5 10 15 200
0.1
0.2
0.3
0.4
0.5
0.6
0.7
0.8
0.9
1
Exogenous glucose rate (g/h)
Cum
ulat
ive
frequ
ency
SL2 target bandSL1 targetSTAR-Liege 2STAR-Liege 1

95
Table 7-2: Clinical details of included patients for the second implementation of STAR in Liege.
Patient 1 Patient 2 Patient 3 Patient 4 Patient 5 Patient 6 Patient 7 Patient 8 Patient 9
General information
Date of birth 22/11/1938 9/09/1938 8/12/1959 11/07/1922 11/12/1938 9/09/1938 5/12/1944 19/05/1951 7/01/1939
Gender F F M M M F M F F
Primary diagnosis Gastro Cardio Trauma Neurological Respiratory Cardio Cardio Cardio Cardio
Diabetic No No No No Unknown No Yes Yes Yes
Post-surgical days in ICU at the beginning of the trial
20 0 4 3 2 8 22 4 2
GC details
Initial BG (mmol/L) 6.6 8.8 9.1 9.3 12.4 6.9 7.7 7.1 8.6
Number of times nurses over-rode insulin recommendations over the total number of protocol interventions
/ 1/4 3/9 7/12 1/11 / 2/11 7/11 2/11
7.3.2. Change in SL2 protocol
During clinical trial, Step 4 (Section 6.4) was changed for GC of Patients 4 to 9 to allow nurses
greater freedom. When 3-hourly measurements were available, three options were offered:
a. 2-hourly measurement, and insulin rate forecasted to maximise the overlap between the BG
forecast values and the target band after 2 hours;
b. 3-hourly measurement and insulin rate forecasted to maximise the overlap between the BG
forecast values and the target band after 3 hours (Patients 1-3 received only this option);
c. 3-hourly measurement and insulin rate using the lesser of the 2- or 3- hourly insulin rates.
By default, the controller would have chosen option (b), if available. The change to Step 4 enabled
greater nursing flexibility and choice that better reflects STAR framework usage that was then being
independently implemented elsewhere (Evans et al., 2011). It also made the system more user-
friendly, which should positively impact on compliance.
7.3.3. GC performance
Clinical results are summarised in Table 7-3 and Table 7-4, and in Figure 7-2 and Figure 7-3. A
total of 91 measurements were taken over 194 hours, averaging one measurement every 2.1 hours
(~11/day). BG levels were relatively tightly distributed, as evidenced by the IQR of 1.6 mmol/L in
Table 7-3 for the cohort and by the IQR for per-patient median values across patients in Table 7-4.
The % BG within the 5.6-7.8 mmol/L target band was 59.61 % indicating that the control was tight
in this band, as illustrated by the steep slope of BG CDF for the whole cohort in Figure 7-2.

96
Table 7-3: Clinical trial results for the second implementation of STAR in Liege.
SL2 clinical data SL1 clinical data p-values
Pre 24 hour Pilot trial (+) Post 24 hour Pilot trial (+) SL1 vs. SL2
Whole cohort statistics
Number of patients 9 9 9 9
Total hours / 194 / 215
Number of BG measurements 46 91 44 205
BG levels (mmol/L) 8.6 [6.9 - 9.5] 7.4 [6.6 - 8.2] 7.6 [6.4 - 8.9] 7.5 [6.8 - 8.5] 0.27
% BG ≥ 10.0 mmol/L 19.57 5.91 9.09 6.82
% BG within 8.0-10.0 mmol/L 43.48 23.15 31.82 30.45
% BG within 4.4-8.0 mmol/L 26.09 70.44 54.55 62.27
% BG < 4.4 mmol/L 10.87 0.49 4.55 0.45
% BG < 4.0 mmol/L 8.70 0.49 11.36 0.45
% BG < 2.2 mmol/L 0.00 0.00 0.00 0.00
Number of patients with BG < 2.2 mmol/L 0 0 0 0
Exogenous insulin rate (U/h) / 2.0 [1.0 - 2.5] / 1.5 [0.5 - 3.4] 0.92
Exogenous glucose rate (g/h) / 0.0 [0.0 - 5.4] / 7.4 [2.0 - 11.2] 0.00
% BG within 7.8-10.0 mmol/L 47.83 28.57 36.36 35.00
% BG within 6.1-7.8 mmol/L 13.04 53.69 36.36 50.00
% BG within 5.6-7.8 mmol/L 13.04 59.61 43.18 55.00
% BG < 5.0 mmol/L 19.57 1.48 11.36 0.91
Per-patient statistics
Hours of control 23.0 [23.0 - 24.0] 24.0 [23.0 - 24.3]
Number of BG measurements 11.0 [10.5 - 11.0] 24.0 [22.0 - 24.0]
Initial BG (mmol/L) 8.6 [7.0 - 9.2] 8.9 [8.4 - 9.6]
Median BG (mmol/L) 7.5 [6.8 - 7.8] 7.7 [7.1 - 8.0]
% BG ≥ 10.0 mmol/L 0.00 [0.00 - 15.37] 8.00 [0.00 - 12.50]
% BG within 8.0-10.0 mmol/L 28.00 [13.04 - 37.50] 29.17 [25.40 - 37.50]
% BG within 4.4-8.0 mmol/L 70.83 [53.13 - 80.21] 62.50 [50.00 - 71.39]
% BG < 4.4 mmol/L 0.00 [0.00 - 0.00] 0.00 [0.00 - 0.00]
% BG < 4.0 mmol/L 0.00 [0.00 - 0.00] 0.00 [0.00 - 0.00]
% BG < 2.2 mmol/L 0.00 [0.00 - 0.00] 0.00 [0.00 - 0.00]
% BG within 6.1-7.8 mmol/L 60.00 [36.25 - 62.88] 53.85 [37.13 - 57.78]
% BG within 5.6-7.8 mmol/L 60.00 [43.75 - 66.88] 54.17 [41.25 - 69.31]
% BG < 5.0 mmol/L 0.00 [0.00 - 4.04] 0.00 [0.00 - 1.04]
Time to < 7.8 mmol/L (hours) 1.8 [0.0 - 2.6] 2.1 [2.0 - 4.0]
% patients to < 7.8 mmol/L 100.00 100.00
Median exogenous insulin rate (U/h) 1.4 [0.2 - 2.6] 1.3 [0.9 - 2.4]
Maximum exogenous insulin rate (U/h) 3.0 [2.9 - 4.0] 1.3 [0.9 - 2.4]
Median exogenous glucose rate (g/h) 0.0 [0.0 - 4.7] 6.0 [4.7 - 6.0]
The 24-hour pre-trial and post-trial glycaemic data not hourly sampled are summarised for SL2 clinical trial. Results presented as median [IQR] where appropriate.

97
Table 7-4: Clinical trial results for the second implementation of STAR in Liege (per-patient statistics).
Patie
nt
Tota
l hou
rs
Num
ber o
f BG
mea
sure
men
ts
Initi
al B
G (m
mol
/L)
Min
imum
BG
(mm
ol/L
)
BG le
vels
(mm
ol/L
)
% B
G ≥
10
mm
ol/L
% B
G w
ithin
8.0
-10.
0 m
mol
/L
% B
G w
ithin
4.4
-8.0
mm
ol/L
% B
G w
ithin
5.6
-7.8
mm
ol/L
% B
G <
5.0
mm
ol/L
% B
G <
4.4
mm
ol/L
% B
G <
4.0
mm
ol/L
% B
G <
2.2
mm
ol/L
Tim
e to
< 7
.8 m
mol
/L (h
ours
)
Tim
e to
< 6
.1 m
mol
/L (h
ours
)
Exog
enou
s ins
ulin
rate
(U/h
)
Max
imum
exo
geno
us in
sulin
rate
(U/h
)
Exog
enou
s nut
ritio
n ra
te (g
/h)
1 23 11 6.6 4.4 6.8 [6.4 - 7.3] 0.00 4.17 95.8
3 79.1
7 4.17 0.00 0.00 0.00 0.0 9.0 0.0 [0.0 - 1.0] 2.0 0.0 [0.0 -
0.0]
2 7 4 8.8 7.0 8.6 [7.8 - 9.6]
25.00
37.50
37.50
25.00 0.00 0.00 0.00 0.00 2.0 / 0.3 [0.0 -
2.1] 4.0 4.5 [0.3 - 4.5]
3 23 9 9.1 6.8 7.6 [7.3 - 8.0] 0.00 29.1
7 70.8
3 62.5
0 0.00 0.00 0.00 0.00 2.0 / 2.0 [2.0 - 2.5] 3.0 0.0 [0.0 -
0.0]
4 24 12 9.3 6.1 7.7 [7.4 - 8.2] 0.00 28.0
0 72.0
0 60.0
0 0.00 0.00 0.00 0.00 4.3 6.3 2.7 [2.5 - 3.5] 3.5 0.0 [0.0 -
0.0]
5 23 11 12.4 6.1 8.0 [7.2 - 9.0]
12.50
37.50
50.00
45.83 0.00 0.00 0.00 0.00 4.3 / 4.0 [2.5 -
4.5] 6.0 5.6 [5.6 - 8.5]
6 24 11 6.9 4.6 6.6 [5.9 - 7.0] 0.00 4.00 96.0
0 64.0
0 4.00 0.00 0.00 0.00 0.0 7.0 0.0 [0.0 - 1.0] 3.0 0.0 [0.0 -
0.0]
7 23 11 7.7 3.9 7.5 [6.7 - 7.9] 0.00 20.8
3 75.0
0 62.5
0 4.17 4.17 4.17 0.00 0.0 21.0 2.5 [1.7 - 3.0] 4.0 5.4 [5.4 -
5.4]
8 23 11 7.1 5.4 7.5 [5.8 - 9.3] 4.17 41.6
7 54.1
7 25.0
0 0.00 0.00 0.00 0.00 0.0 2.0 1.0 [0.5 - 1.5] 2.5 0.0 [0.0 -
0.0]
9 24 11 8.6 5.7 6.8 [6.3 - 9.4]
24.00
16.00
60.00
40.00 0.00 0.00 0.00 0.00 1.8 3.8 1.4 [1.0 -
1.9] 3.0 2.0 [2.0 - 2.0]
Results presented as median [IQR] where appropriate.
Figure 7-2: CDFs for BG levels (left panel), exogenous insulin rates (middle panel) and exogenous glucose rate (right
panel), defined for the whole cohort, for the SL2 clinical trial.
0 5 100
0.1
0.2
0.3
0.4
0.5
0.6
0.7
0.8
0.9
1
BG (mmol/L)
Cum
ulat
ive
frequ
ency
0 2 4 60
0.1
0.2
0.3
0.4
0.5
0.6
0.7
0.8
0.9
1
Exogenous insulin rate (U/h)
Cum
ulat
ive
frequ
ency
0 5 10 15 200
0.1
0.2
0.3
0.4
0.5
0.6
0.7
0.8
0.9
1
Exogenous glucose rate (g/h)
Cum
ulat
ive
frequ
ency
SL2 Clinical trialSL1 Clinical trial

98
Figure 7-3: CDF for BG levels for the 24-hour pre-trial, during trial and post-trial for SL2 clinical trial.
A total of 34.48% of the BG measurements were ≥ 7.8 mmol/L primarily due to high initial BG
values and short 24-hour trials. Only 5.91 % of BG were < 5.6 mmol/L. There were no severe
hypoglycaemic events (BG < 2.2 mmol/L) and the minimum recorded BG was 3.9 mmol/L (Patient
7). Hence, while STAR forecasted a maximum risk of 5 % for BG < 5.0 mmol/L by design, clinical
results show only 1.48 %.
For context, BG results are compared to the prior and subsequent 24 hours of hospital control to
assess performance and safety versus typical hospital control. These 24-hour pre-trial and 24-hour
post-trial BG results came from the same nine patients so that each patient acts as their own control.
Table 7-3 shows that SL2 provided better GC compared to the pre-trial period, with 59.61 % of BG
in the clinically desired band (5.6-7.8 mmol/L), instead of 13.04 %. This improved control was
associated with reduced high BG levels (from 19.57 % to 5.91 % of BG ≥ 10.0 mmol/L) and
significantly reduced low BG levels (from 19.57 % to 1.48 % of BG < 5.0 mmol/L). SL2 gathered
BG levels in a range, as illustrated by the steeper slopes of the BG CDF in Figure 7-3. The 24 hours
following STAR were similar, but more variable, as shown in Figure 7-3. Overall, STAR
successfully reduced BG levels and variability compared to hospital control, while decreasing low
BG levels and thus increasing safety.
Figure 7-2 shows that no insulin was given in 18 % of control interventions, and that insulin rates
varied over the full range allowed. Only 5 % of insulin rates were higher than 4.0 U/h, and only
Patient 5 received the maximum allowable insulin rate of 6.0 U/h during the 24-hour trial (Table
7-4). Overall, insulin rates were similar compared to SL1 (Table 7-3 and Figure 7-2).
0 2 4 6 8 10 120
0.1
0.2
0.3
0.4
0.5
0.6
0.7
0.8
0.9
1
BG (mmol/L)
Cum
ulat
ive
frequ
ency
SL2 target bandPre 24 hoursPost 24 hoursSL2 clinical trial

99
As mentioned, nutrition input was left to the attending clinician. Approximately 40 % of exogenous
glucose rates were equal to zero, as five patients received no exogenous glucose inputs (Patients 1,
3, 4, 6 and 8, Table 7-4). Clinical results in Table 7-4 show that the other patients were each fed
very differently.
SL2 clinical results are also compared to SL1 clinical results to determine if the goals of reduced
workload with no compromise on performance or safety were achieved. Table 7-3 and Figure 7-2
show that SL2 achieved somewhat tighter, equally safe control compared to SL1. BG levels were
similarly distributed (p > 0.05), while the number of measurements was reduced by 55.6 % (p <
0.05). SL2 had slightly lower insulin rates due to the significantly lower exogenous glucose
administration rates (p < 0.01).
7.3.4. Nurse compliance
Table 7-5 shows details about interventions when nursing interventions differed from protocol
recommendations for insulin rates and/or measurement frequency. Surprisingly, when a 3-hourly
option was available, nurses did not always choose this option (2-hourly intervention chosen 11 of
16 cases, 68.75 %). This result matches recent results of STAR elsewhere (Fisk et al., 2012b).
Nurses overrode 23 (25.27 %) of the 91 interventions recommended by the protocol: 8 (34.78 %)
increased insulin rates and 15 (65.22 %) decreased insulin rates.
Hence, nurses sometimes choose 2-hourly interventions (31.25 % of time) when a 3-hourly option
was available. Results also highlight that nurses tended to administrate less insulin than
recommended by STAR. At the opposite, nurses are reluctant to stop insulin infusions as a minimal
insulin rate was kept when STAR recommended no insulin.
7.3.5. Discussion
The SL2 protocol was primarily designed to reduce nursing workload, while maintaining safety and
control. Four main changes were made. First, while SL1 was characterised by a specific glycaemic
target of 6.9 mmol/L, SL2 used a target-to-range approach (target band: 5.6-7.8 mmol/L). Second,
measurement frequency was reduced, as only 2-hourly and 3-hourly interventions were used,
instead of the 1- and 2- hourly interventions during the first trial. Third, the SL2 protocol had fewer
rules. For example, it did not adjust nutrition rates, which made the protocol more simple and
transparent, and its application faster. Finally, the controller used an improved model of the glucose-
insulin system (Lin et al., 2011) and a cohort-specific stochastic model to account for a more
variable cardiovascular cohort (Pretty et al., 2012).

100
Table 7-5: Details where nurses overrode STAR recommendations during the second implementation of STAR in Liege.
Protocol recommendations Nurses interventions
Patient 2 Intervention 1 3.5 U/h for 2h 1.5 U/h for 1h
Patient 3 Intervention 1 6.0 U/h for 3h 3.0 U/h for 2h -
Intervention 2 3.5 U/h for 3h 2.5 U/h for 3h *
Intervention 3 3.5 U/h for 3h 3.0 U/h for 3h *
Patient 4 Intervention 1 4.5 U/h for 2h 3.5 U/h for 2h
Intervention 2 5.5 U/h for 3h 3.5 U/h for 2h -
Intervention 3 4.0 U/h for 2h 3.5 U/h for 2h
Intervention 4 1 U/h for 3h or no insulin for 2h 2.0 U/h for 2h -
Intervention 5 4.5 U/h for 2h or 4.0 U/h for 3h 3.0 U/h for 2h -
Intervention 6 2.0 U/h for 2h or 3h or .03 U/h for 3h 2.5 U/h for 2h -
Intervention 7 4.0 U/h for 2h 3.5 U/h for 2h
Patient 5 Intervention 1 5.5 U/h for 2h 4.5 U/h for 2h
Patient 7 Intervention 1 1.0 U/h for 2h or 3h or 1.5 U/h for 3h 1.5 U/h for 2h -
Intervention 2 No insulin for 2h or 3h 1.0 U/h for 2h -
Patient 8 Intervention 1 1.5 U/h for 2h or 3h 1.0 U/h for 2h -
Intervention 2 2.0 U/h for 2h 1.0 U/h for 2h
Intervention 3 2.0 U/h for 3h or 3.0 U/h for 2h 1.5 U/h for 2h -
Intervention 4 No insulin for 2h or 3h 0.5 U/H for 2h -
Intervention 5 No insulin for 3h 0.5 U/H for 3h *
Intervention 6 3.5 U/h for 2h or 3h 2.5 U/h for 2h -
Intervention 7 1.5 U/h for 3h 2.0 U/h for 3h *
Patient 9 Intervention 1 No insulin for 3h 1.0 U/h for 3h *
Intervention 2 No insulin for 2h 0.5 U/h for 2h
Nurses overrode 23 of 91 interventions. (-): Interventions where nurses chose 2-hourly intervention when 3-hourly intervention is available; (*) interventions where nurses chose 3-hourly intervention when 3-hourly intervention is available.
Nurse workload was significantly reduced with the SL2 protocol (2.1 hours between measurements
vs. 1.1 hour for SL1, p < 0.01). Table 7-5 shows that nurses sometimes choose 2-hourly
interventions (31.25 % of time) when a 3-hourly option was available. This result indicates that
measurement frequency could have been further reduced if nurses chose 3-hourly interventions
when available. Hence, nursing workload could have been further reduced.
Nurses overrode insulin rates more often during the SL2 clinical trial than during the SL1 clinical
trial. This difference can be explained by some “lack of trust” in the recommendations, especially
as the time interval was longer. Nurses were hesitant to administer more than 3.0 U/h, and were
quite reluctant to insulin rate changes (Table 7-5). However, 34.78 % of override changes increased

101
insulin over recommendations. Table 7-3 and Figure 7-3 show that hospital control was less
effective and more variable than STAR, so this non-compliance may not have improved control.
SL2 explicitly defined a maximum hypoglycaemic risk of 5 % of BG < 5.0 mmol/L. In contrast,
SL1 used a maximum 5 % risk of BG < 4.0 mmol/dL (Table 7-1). During the SL1 trial, there were
0.91 % of BG < 5.0 mmol/L. During the SL2 trial, there were 1.48 %. This percentage (and number)
of BG < 5.0 mmol/L are acceptable as it is less than the desired maximum of 5 %. Despite less
frequent measurement and intervention, safety was still ensured, and was well within design levels.
The relatively short length of each trial does not allow long-term statistics on control. However, a
median 1.8 hours to BG < 7.8 mmol/L indicates total trial length was sufficient to test safety and
efficacy compared to SL1. The results justify longer trials for 48 hours or more.
A main difference between the SL1 and SL2 results was the reduced intervention rate, which can
increase BG variability in patients whose condition changes rapidly. However, the longer intervals
allowed the effect of changes in insulin infusion rate to be more clearly observed and identified,
compared to bolus administration in other uses (Evans et al., 2011), which act more quickly and
can thus be more rapidly identified. However, these results indicate no increase in variability or risk
as a result.
Some situations are still not automatically managed by STAR. In particular, small meals may be
given (Patients 8 and 9). Glucose inputs related to these meals are difficult to estimate. The
estimated additional exogenous glucose content was included in control calculations via the
interface. However, incomplete consumption and estimated exogenous glucose content adds
uncertainty, although STAR appeared to manage this issue as well as, or better, than normal hospital
control. Future efforts should attempt to include this aspect more explicitly.
Finally, this clinical trial includes only nine subjects. Longer trials over more patients would
provide greater certainty and statistical significance to the results. However, it is clear that the goals
of reducing workload without compromising safety or performance were met. Equally, it is clear
that STAR was better than the normal hospital protocol. The STAR protocol gathered BG levels
around the desired glycaemic band, reduced high BG levels and variability, and improved safety by
significantly reducing low BG levels. STAR also appeared to have a positive impact on 24-hour
post-trial glycaemic results. Hence, STAR stabilised patient condition and helped further patient
management in this study.

102
7.4. Summary
The main objective for these second SL2 clinical trials was to reduce clinical workload, while
maintaining control quality and safety, using a target-to-range approach. Virtual trials showed that
the SL2 protocol was associated with similar BG outcomes to SL1, but with significantly reduced
measurement frequency.
Clinical trials showed that clinical workload was reduced by over a factor of 2, while safety was
maintained with less frequent measurement and intervention compared to prior clinical trial. The
results presented thus showed that safe, effective GC can be achieved for a highly variable cohort
with significantly reduced workload using a model-based method, where several clinical studies on
similar cardiovascular cohorts have had excessive hypoglycaemia.
Moreover, STAR was shown to be safer and tighter than the existing hospital control in a unit with
an effective, well established GC protocol. Finally, this SL2 pilot trial highlighted a “lack of trust”
in the protocol recommendations, especially as the time interval was longer, and showed that the
nurses were reluctant to insulin rate changes. Non-compliance to protocol recommendation results
in clinician-specific GC. Further compliance analysis would help to understand why nursing staff
do not follow GC protocol recommendations, and ensure future better GC implementation in
clinical settings.

103
Chapter 8. Why do nursing staff not
follow glycaemic control protocol
recommendations?
The second implementation of the STAR framework (SL2) in the same Belgian ICU as the first
pilot trial (SL1) successfully reduced clinical workload, while maintaining control quality and
safety, using a target-to-range approach. However, this SL2 pilot trial highlighted a “lack of trust”
in the protocol recommendations.
The main objective of this chapter is to understand why nursing staff do not follow GC protocol
recommendations in the medical ICU where the next pilot trial will be performed. In particular, this
chapter aims to assess nurse compliance to the current GC protocol recommendations and to
highlight situations where deviations in insulin rate adjustment are most likely.
8.1. Patient cohort: medical ICU cohort
This compliance analysis used retrospective clinical data from 20 non-diabetic patients whose
glycaemia was controlled during their stay in the medical ICU at the CHU of Liege (Belgium). All
patients were admitted in 2011. The selection criteria for patients were: (1) GC for at least 60 hours;
(2) insulin administration at the beginning of GC; (3) clinical data completeness; and (4) at least 10
BG measurements during control, every 6 hours (on average) or more frequent, to allow good
virtual patients to be created (Chase et al., 2010b). Diabetic patients were excluded as they received
subcutaneous insulin as part of GC protocol in this ICU and clinicians decided to analyse an insulin-
infusion approach. Patient characteristics are summarised in Table 8-1.
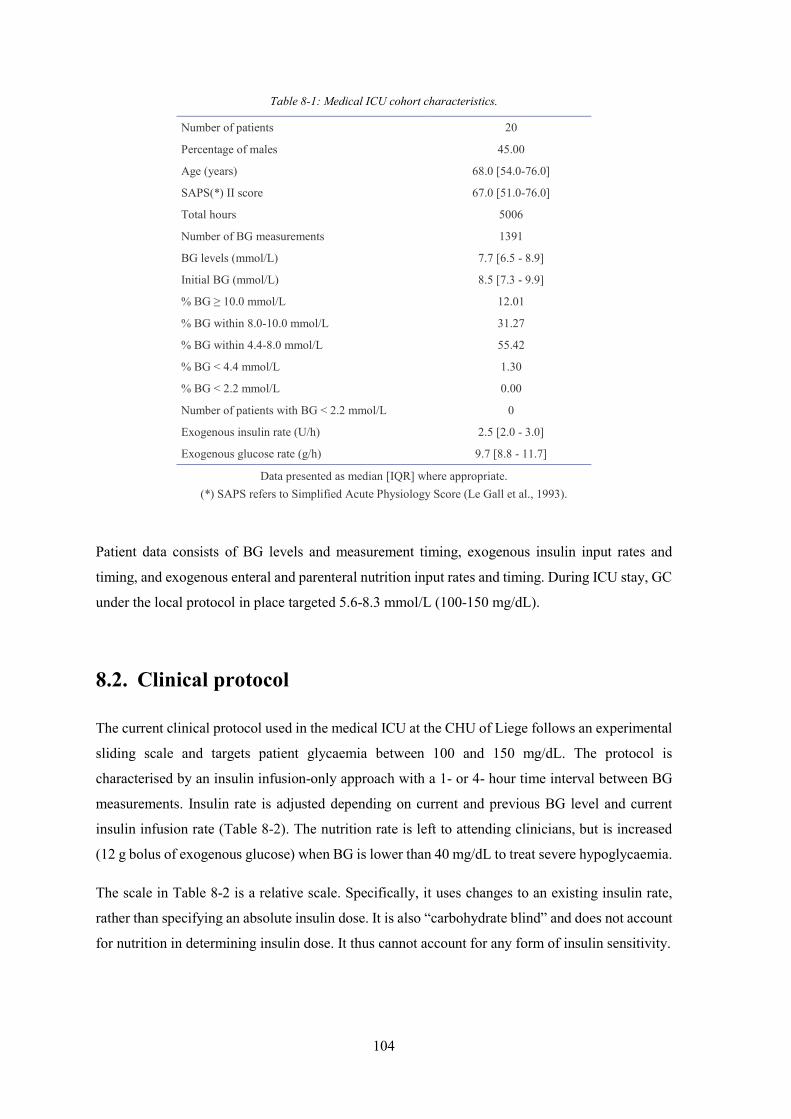
104
Table 8-1: Medical ICU cohort characteristics.
Number of patients 20
Percentage of males 45.00
Age (years) 68.0 [54.0-76.0]
SAPS(*) II score 67.0 [51.0-76.0]
Total hours 5006
Number of BG measurements 1391
BG levels (mmol/L) 7.7 [6.5 - 8.9]
Initial BG (mmol/L) 8.5 [7.3 - 9.9]
% BG ≥ 10.0 mmol/L 12.01
% BG within 8.0-10.0 mmol/L 31.27
% BG within 4.4-8.0 mmol/L 55.42
% BG < 4.4 mmol/L 1.30
% BG < 2.2 mmol/L 0.00
Number of patients with BG < 2.2 mmol/L 0
Exogenous insulin rate (U/h) 2.5 [2.0 - 3.0]
Exogenous glucose rate (g/h) 9.7 [8.8 - 11.7]
Data presented as median [IQR] where appropriate. (*) SAPS refers to Simplified Acute Physiology Score (Le Gall et al., 1993).
Patient data consists of BG levels and measurement timing, exogenous insulin input rates and
timing, and exogenous enteral and parenteral nutrition input rates and timing. During ICU stay, GC
under the local protocol in place targeted 5.6-8.3 mmol/L (100-150 mg/dL).
8.2. Clinical protocol
The current clinical protocol used in the medical ICU at the CHU of Liege follows an experimental
sliding scale and targets patient glycaemia between 100 and 150 mg/dL. The protocol is
characterised by an insulin infusion-only approach with a 1- or 4- hour time interval between BG
measurements. Insulin rate is adjusted depending on current and previous BG level and current
insulin infusion rate (Table 8-2). The nutrition rate is left to attending clinicians, but is increased
(12 g bolus of exogenous glucose) when BG is lower than 40 mg/dL to treat severe hypoglycaemia.
The scale in Table 8-2 is a relative scale. Specifically, it uses changes to an existing insulin rate,
rather than specifying an absolute insulin dose. It is also “carbohydrate blind” and does not account
for nutrition in determining insulin dose. It thus cannot account for any form of insulin sensitivity.

105
Table 8-2: Clinical protocol used in the medical ICU at the University Hospital of Liege.
Current BG level Condition based on current insulin rate and previous BG level
Adjustment
180 < BG u ≤ 2.0 2.0 < u ≤ 10.0 10.0 < u ≤ 20.0 20.0 < u
+ 0.5 U/h + 1.0 U/h + 2.0 U/h + 4.0 U/h ∆t = 1h
100 < BG ≤ 180 100 < ≤ 180 not in ]100 ; 180]
+ 0.0 U/h ∆t = 4h + 0.0 U/h ∆t = 1h
80 < BG ≤ 100 + 0.0 U/h ∆t = 1h
60 < BG ≤ 80 or − / ∆t > 50
u ≤ 2.0 2.0 < u ≤ 10.0 10.0 < u ≤ 20.0 20.0 < u
- 0.5 U/h - 1.0 U/h - 2.0 U/h - 4.0 U/h ∆t = 1h
40 < BG ≤ 60 0.0 U/h ∆t = 1h
BG ≤ 40 When BG > 80
0.0 U/h + 12g exogenous glucose (bolus) ∆t = 1h u = /2 (u before BG ≤ 40) stop exogenous glucose
BG refers to current BG level (mg/dL), to previous BG level (mg/dL), u refers to current insulin rate (U/h), and ∆t to the time interval until next BG measurement (h).
An additional rule accounts for patient variability. When BG is within 100-180 mg/dL with no
insulin rate change during 24 hours and that BG decreases below 100 mg/dL, the insulin rate is
reduced by 20 % and time interval is set to 1 hour. A last specific rule was added to deal with
nutrition stops. When nutrition is stopped, no insulin is required. And, when nutrition is started
again, the insulin rate should be set to the same insulin rate administrated when nutrition was
previously stopped.
A final potentially critical issue is that insulin rates in Table 8-2 are never lowered until BG is less
than 80 mg/dL, which may increase hypoglycaemic risk (Chase et al., 2011b). The protocol has
also no patient-specificity. Inter-patient variability must thus be managed by the nurses outside of
the specific protocol recommendations.

106
8.3. Compliance analysis
In this study, compliance can be defined as the degree to which a clinician or a nurse correctly
follows the protocol recommendations in terms of insulin rate adjustment and measurement
frequency during GC. Non-compliance thus refers to administration of insulin rates different from
the insulin rate recommended by the protocol and to a time interval between BG measurements
different from the measurement frequency prescribed by the protocol.
Non-compliance results in clinician-specific GC, as the protocol implementation is customised by
clinicians to personal or patient needs. Equally, small differences and thus small non-compliance
by this definition would have minimal impact, so it is critical to assess the magnitude of these values
relative to clinically important metrics, such as BG level or day of stay and variability. However,
non-compliance can have negative or positive effects. The latter case arises from protocols that
cannot manage the variability observed by clinical staff and thus highlights a lack of effectiveness
of the protocol to manage the patient and/or their variability with what are considered realistic dose
or timing recommendations.
Here, the compliance analysis consists of assessing nurse compliance to insulin rate adjustment
recommended by the clinical protocol used in the medical ICU where the next Belgian STAR pilot
trial will be performed. This analysis is divided into three parts. The first and second parts concern
the compliance to recommendations related to specific GC rules. The last part is related to
compliance to general protocol recommendations in Table 8-2. In this section, BG levels are
expressed in mg/dL (and not in mmol/L) for consistency with the clinical protocol.
8.3.1. Specific rule 1: patient variability
The variability rule reduces insulin rate by 20 % when BG is within 100-180 mg/dL with no insulin
rate change during 24 hours and that BG decreases below 100 mg/dL. This specific case occurs 21
times, for 13 patients, over 164 days of ICU stay. Details are provided in Table 8-3. Clinical
interventions can be classified into three situations:
1. Nurses did not reduce insulin rate (N = 10, 47.62 %). This situation occurs only for BG ≥
90 mg/dL. They act as if BG was within 80-100 mg/dL and do not pay attention to the
specific rule about patient variability.
2. Nurses reduced insulin rate by 20 % (N = 6, 28.57 %), and insulin rate was rounded to .5
U/h. This situation corresponds to the proper implementation of the clinical rule.
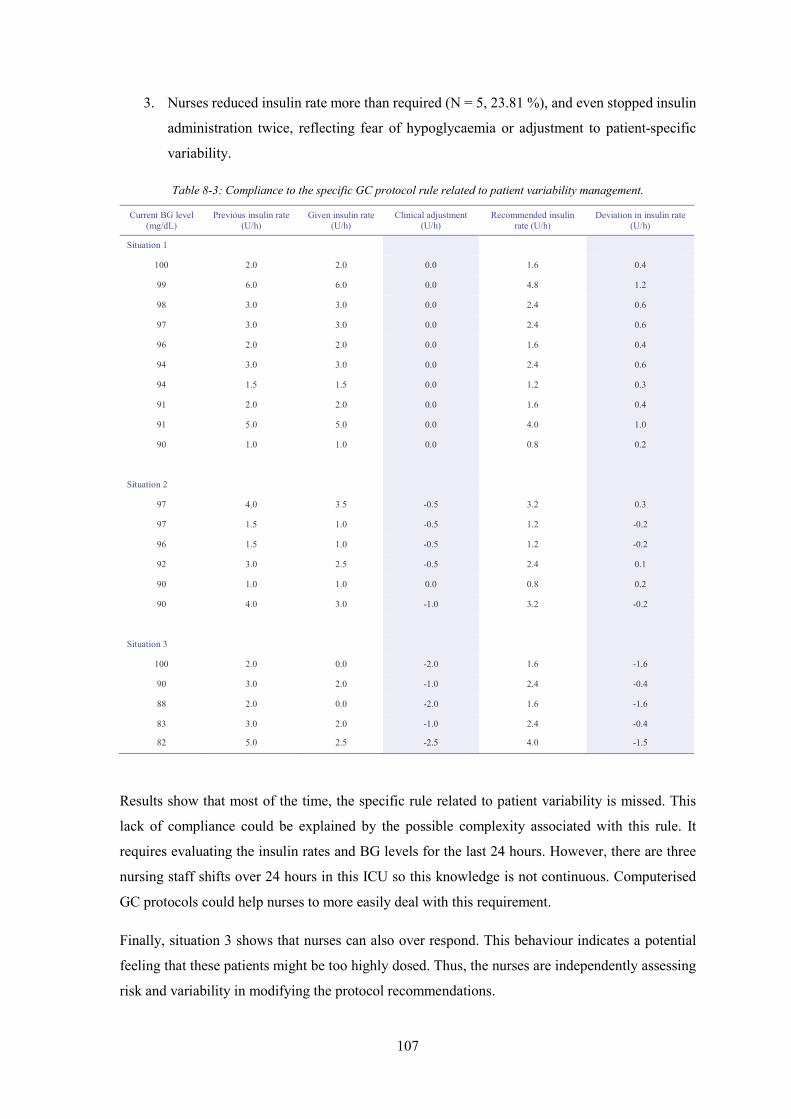
107
3. Nurses reduced insulin rate more than required (N = 5, 23.81 %), and even stopped insulin
administration twice, reflecting fear of hypoglycaemia or adjustment to patient-specific
variability.
Table 8-3: Compliance to the specific GC protocol rule related to patient variability management.
Current BG level (mg/dL)
Previous insulin rate (U/h)
Given insulin rate (U/h)
Clinical adjustment (U/h)
Recommended insulin rate (U/h)
Deviation in insulin rate (U/h)
Situation 1
100 2.0 2.0 0.0 1.6 0.4
99 6.0 6.0 0.0 4.8 1.2
98 3.0 3.0 0.0 2.4 0.6
97 3.0 3.0 0.0 2.4 0.6
96 2.0 2.0 0.0 1.6 0.4
94 3.0 3.0 0.0 2.4 0.6
94 1.5 1.5 0.0 1.2 0.3
91 2.0 2.0 0.0 1.6 0.4
91 5.0 5.0 0.0 4.0 1.0
90 1.0 1.0 0.0 0.8 0.2
Situation 2
97 4.0 3.5 -0.5 3.2 0.3
97 1.5 1.0 -0.5 1.2 -0.2
96 1.5 1.0 -0.5 1.2 -0.2
92 3.0 2.5 -0.5 2.4 0.1
90 1.0 1.0 0.0 0.8 0.2
90 4.0 3.0 -1.0 3.2 -0.2
Situation 3
100 2.0 0.0 -2.0 1.6 -1.6
90 3.0 2.0 -1.0 2.4 -0.4
88 2.0 0.0 -2.0 1.6 -1.6
83 3.0 2.0 -1.0 2.4 -0.4
82 5.0 2.5 -2.5 4.0 -1.5
Results show that most of the time, the specific rule related to patient variability is missed. This
lack of compliance could be explained by the possible complexity associated with this rule. It
requires evaluating the insulin rates and BG levels for the last 24 hours. However, there are three
nursing staff shifts over 24 hours in this ICU so this knowledge is not continuous. Computerised
GC protocols could help nurses to more easily deal with this requirement.
Finally, situation 3 shows that nurses can also over respond. This behaviour indicates a potential
feeling that these patients might be too highly dosed. Thus, the nurses are independently assessing
risk and variability in modifying the protocol recommendations.

108
8.3.2. Specific rule 2: stop in nutrition
Clinical protocol states that insulin is not required when nutrition (enteral and parenteral) is stopped.
Additionally, when nutrition starts again, the insulin rate should be set to the same insulin rate
administrated when nutrition was previously stopped. Total nutrition was stopped four times, for
three patients. However, the insulin infusion was stopped only once (25 % compliance).
Table 8-4: Compliance to the specific GC protocol rule related to the management of stop in nutrition.
Situation Response Conclusion
Stop in nutrition
P+PN=0 Stop insulin Follow the protocol
P+PN=0 Reduce insulin rate by 2.0 U/h (from 5.0 to 3.0 U/h) Missed nutrition stop
P+PN=0 Stop insulin but 2 interventions later When nutrition starts again, insulin is started but 2 interventions later
Missed nutrition stop
P+PN=0 Insulin unchanged Missed nutrition stop
Stop in insulin
Stop P and PN ≠ 0 Stop insulin Consider P as the total nutrition
Stop P and PN ≠ 0 Stop insulin Consider P as the total nutrition
Stop P and PN ≠ 0 Stop insulin Consider P as the total nutrition
Stop PN and P ≠ 0 Increase insulin rate by 2.0 U/h, as BG = 317 mg/dL Don’t consider PN as the total nutrition
P refers to enteral nutrition and PN to parenteral nutrition.
More surprisingly, insulin administration was stopped when enteral nutrition was stopped, but when
there was still an ongoing parenteral glucose infusion. This result indicates that sometimes enteral
nutrition may be considered as the total nutrition, despite the potentially significant glucose load
delivered by the parenteral nutrition. When parenteral nutrition is stopped, while maintaining
enteral nutrition, insulin is adjusted according the protocol rules, indicating that parenteral nutrition
was not considered as the total nutrition. Improper implementation of the protocol in case of stop
in enteral and/or parenteral nutrition resulted in 15 deviations in insulin rate adjustments as
summarised in Table 8-4.
8.3.3. General rules
Compliance to general protocol recommendations is analysed by comparing the insulin rates given
and the insulin rates recommended by the clinical protocol in Section 8.2. For each patient and for

109
each BG measurement2, clinical data provides current BG level (mg/dL) and previous and given
insulin rate (U/h). The insulin rate adjustment is calculated as the difference between the given and
the previous insulin rate. Based on this clinical data and the rules in Table 8-2, the recommended
insulin rate adjustment and thus recommended insulin rate are determined. Deviation in insulin rate
is defined as the difference between the insulin rate given and the recommended insulin rate. Higher
insulin rates than recommended by the protocol results in a positive deviation.
A total of 263 deviations were highlighted over 1371 BG measurements (19.18 %). A total of 173
(65.78 %) had negative deviations and 90 (34.22 %) positive deviations. Figure 8-1 shows that most
of deviations are between – 1.0 U/h and + 1.0 U/h (N = 223, 84.79 %). In this range, cases for which
the given insulin rate is above the recommended one have a lower occurrence. These results show
that deviation in insulin rate in this medical ICU are limited primarily to ± 1.0 U/h and nurses tend
to give less insulin than recommended. A further analysis was performed to understand and identify
reasons of deviations in insulin rate.
Figure 8-1: Quantification of deviations in insulin rate.
Deviations in insulin rate were analysed given the previous and current BG levels, and the current
insulin rate, as insulin rate adjustment recommended by the clinical protocol depends on this clinical
data (Table 8-2). Deviations were sorted based on the current BG level into 6 categories: (1) BG <
80 mg/dL, (2) BG within 80-100 mg/dL, (3) BG within 100-150 mg/dL, (4) BG within 150-180
mg/dL, (5) BG within 180-200 mg/dL, and (6) BG ≥ 200 mg/dL. For each category, deviations
were then sorted according to the current insulin rate: u < 2.0 U/h, 2.0 U/h ≤ u < 6.0 U/h, and u ≥
6.0 U/h. Sorted deviations in insulin rates (difference between given and recommended insulin
rates) as a function of relative BG variation are illustrated in Table 8-5 and Table 8-6, where greater
2 For each patient, the first BG measurement was excluded as there was no access to the previous insulin rate.
0102030405060708090
100
< - 2.0U/h
-2.0 U/h -1.5 U/h -1.0 U/h -0.5 U/h + 0.5 U/h + 1.0 U/h + 1.5 U/h + 2.0 U/h > + 2.0U/h
Num
ber o
f dev
iatio
ns
Deviation in insulin rate adjustment (given-recommended)

110
glycaemic variation of ± 1 indicates a doubling (+ 1) or halving (- 1) of BG level over the interval,
which is a high level of variability.
Table 8-5: Compliance to GC protocol general rules, for BG < 150 mg/dL.
BG < 80 mg/dL
Number of deviations analysed when BG is decreasing 15
Insulin rate is decreased more than recommended → Prevent hypoglycaemic risk 7
Unchanged insulin rate while decrease in insulin rate is recommended
→ Increase hypoglycaemic risk 8
Number of deviations not discussed 3
Total number of deviations 18
BG within 80-100 mg/dL
Number of deviations analysed when BG is decreasing 12
Decrease insulin rate while no change is recommended → Prevent hypoglycaemic risk 12
Number of deviations analysed when BG is increasing 3
Decrease insulin rate while no change is recommended → Not necessary 3
Number of deviations not discussed 2
Total number of deviations 17
BG within 100-150 mg/dL
Number of deviations analysed when BG is decreasing 37
Increase insulin rate while no change is recommended → Increase hypoglycaemic
risk, but mitigated risk 3
Decrease insulin rate while no change is recommended →
Help keeping glycaemic levels within 100-150 mg/dL
34
Number of deviations analysed when BG is increasing 10
Increase insulin rate while no change is recommended →
Help keeping glycaemic levels within 100-150 mg/dL
7
Decrease insulin rate while no change is recommended → Increase hyperglycaemic
risk, but mitigated risk 3
Number of deviations not discussed 3
Total number of deviations 50
-2 -1 0 1 2-5
0
5
(Gnow - Gprev) / Gnow
Dev
iatio
n in
u (U
/h)
-2 -1 0 1 2-5
0
5
(Gnow - Gprev) / Gnow
Dev
iatio
n in
u (U
/h)
-2 -1 0 1 2-5
0
5
(Gnow - Gprev) / Gnow
Dev
iatio
n in
u (U
/h)
uprev < 2.0 U/h
uprev in 2.0-6.0 U/h
uprev ≥ 6.0 U/h
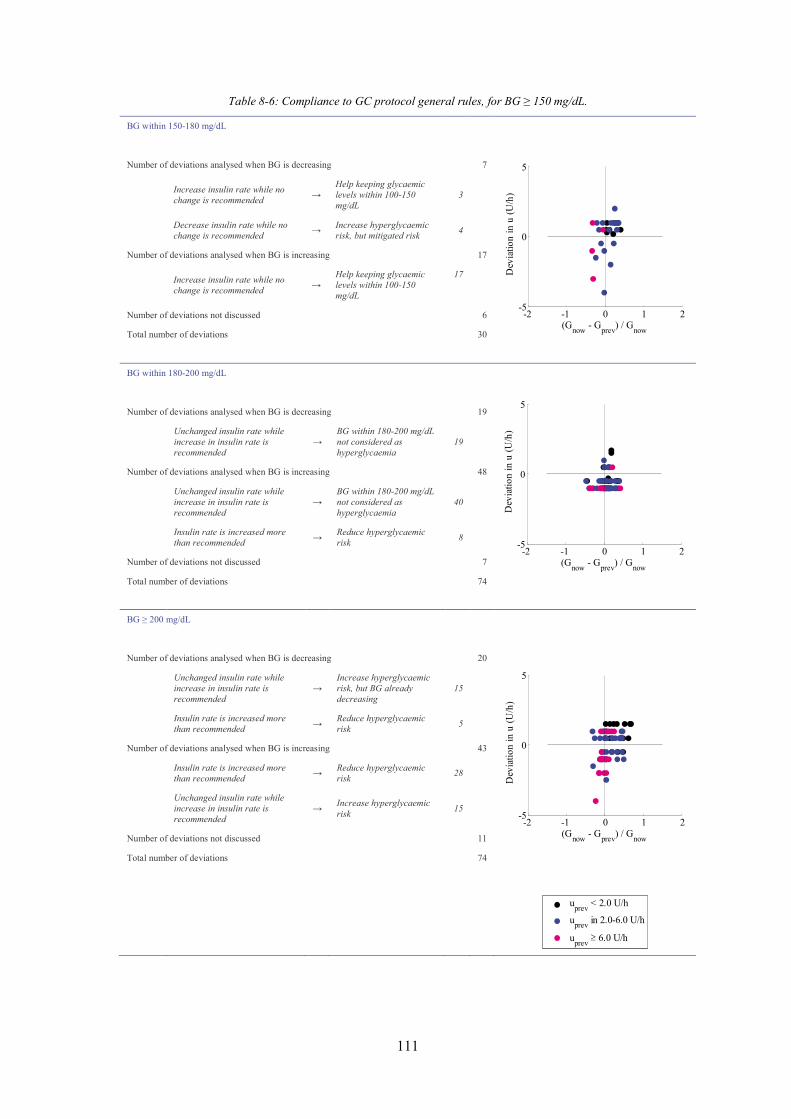
111
Table 8-6: Compliance to GC protocol general rules, for BG ≥ 150 mg/dL.
BG within 150-180 mg/dL
Number of deviations analysed when BG is decreasing 7
Increase insulin rate while no change is recommended →
Help keeping glycaemic levels within 100-150 mg/dL
3
Decrease insulin rate while no change is recommended → Increase hyperglycaemic
risk, but mitigated risk 4
Number of deviations analysed when BG is increasing 17
Increase insulin rate while no change is recommended →
Help keeping glycaemic levels within 100-150 mg/dL
17
Number of deviations not discussed 6
Total number of deviations 30
BG within 180-200 mg/dL
Number of deviations analysed when BG is decreasing 19
Unchanged insulin rate while increase in insulin rate is recommended
→ BG within 180-200 mg/dL not considered as hyperglycaemia
19
Number of deviations analysed when BG is increasing 48
Unchanged insulin rate while increase in insulin rate is recommended
→ BG within 180-200 mg/dL not considered as hyperglycaemia
40
Insulin rate is increased more than recommended → Reduce hyperglycaemic
risk 8
Number of deviations not discussed 7
Total number of deviations 74
BG ≥ 200 mg/dL
Number of deviations analysed when BG is decreasing 20
Unchanged insulin rate while increase in insulin rate is recommended
→ Increase hyperglycaemic risk, but BG already decreasing
15
Insulin rate is increased more than recommended → Reduce hyperglycaemic
risk 5
Number of deviations analysed when BG is increasing 43
Insulin rate is increased more than recommended → Reduce hyperglycaemic
risk 28
Unchanged insulin rate while increase in insulin rate is recommended
→ Increase hyperglycaemic risk 15
Number of deviations not discussed 11
Total number of deviations 74
-2 -1 0 1 2-5
0
5
(Gnow - Gprev) / Gnow
Dev
iatio
n in
u (U
/h)
-2 -1 0 1 2-5
0
5
(Gnow - Gprev) / Gnow
Dev
iatio
n in
u (U
/h)
-2 -1 0 1 2-5
0
5
(Gnow - Gprev) / Gnow
Dev
iatio
n in
u (U
/h)
uprev < 2.0 U/h
uprev in 2.0-6.0 U/h
uprev ≥ 6.0 U/h

112
Table 8-5 and Table 8-6 highlight situations where deviations in insulin rate could be associated
with current BG level and BG variation3.
- BG < 80 mg/dL and BG decreasing: Two situations occurred. First, the insulin rate was
reduced more than recommended (N = 7, 2.66 % of the total number of deviations). Second,
the insulin rate was unchanged, while the protocol recommended to decrease the insulin
rate (N = 8, 3.04 %). This second situation could lead to further BG reduction and thus
increase hypoglycaemic risk.
- BG in 80-100 mg/dL and BG decreasing: Insulin rate was decreased, while the protocol
recommended no change (N = 12, 4.56 %). These interventions aimed to stop BG reduction
and prevented patients from further reduction in BG and hypoglycaemic risk. They show
nurses managing patient-specific variability independently to reduce risk and increase
safety.
- BG in 80-100 mg/dL and BG increasing: Insulin rate was decreased, while the protocol
recommended no change (N = 3, 1.14 %). However, as the BG was increasing, these
deviations were not necessary, but didn’t result in hyperglycaemic risk as current BG was
under the target.
- BG in 100-150 mg/dL and BG decreasing: Insulin rate was decreased, while the protocol
recommended no change (N = 34, 12.93 %). This situation prevented patients from further
BG decrease and aimed to keep glycaemic levels in the target range. When the current
insulin rate was low (< 2.0 U/h), 3 (1.14 %) interventions were increasing insulin rate, while
the protocol recommended no change. These interventions could lead to further BG
reduction and increase hypoglycaemic risk. However, BG levels were 140 mg/dL, 133
mg/dL and 122 mg/dL, which is much higher than the hypoglycaemic threshold of 80
mg/dL and mitigates this risk to an extent.
- BG in 100-150 mg/dL and BG increasing: The protocol recommended no change in insulin
rate. However, the insulin rate was decreased (N = 3, 1.14 %) or increased (N = 7, 2.66 %).
Decreases in insulin rate could lead to large BG increases in this situation and lead to
hyperglycaemia (BG > 180 mg/dL). However, BG levels were 139 mg/dL, 132 mg/dL and
123 mg/dL, and thus not too close to the hyperglycaemic threshold of 180 mg/dL. Increases
in insulin rate could prevent further increases in BG and should help stabilising BG levels.
- BG in 150-180 mg/dL and BG decreasing: The protocol recommended no change in insulin
rate, but it was increased (N = 3, 1.52 %) or decreased (N = 4, 1.14 %). Increases in insulin
3 When less than 3 deviations were associated with a given current BG level and a BG variation (> 0 or < 0), these deviations were not discussed as they were considered as not representative of the nurse behavior (N = 32, 12.17 % of the total number of deviations).
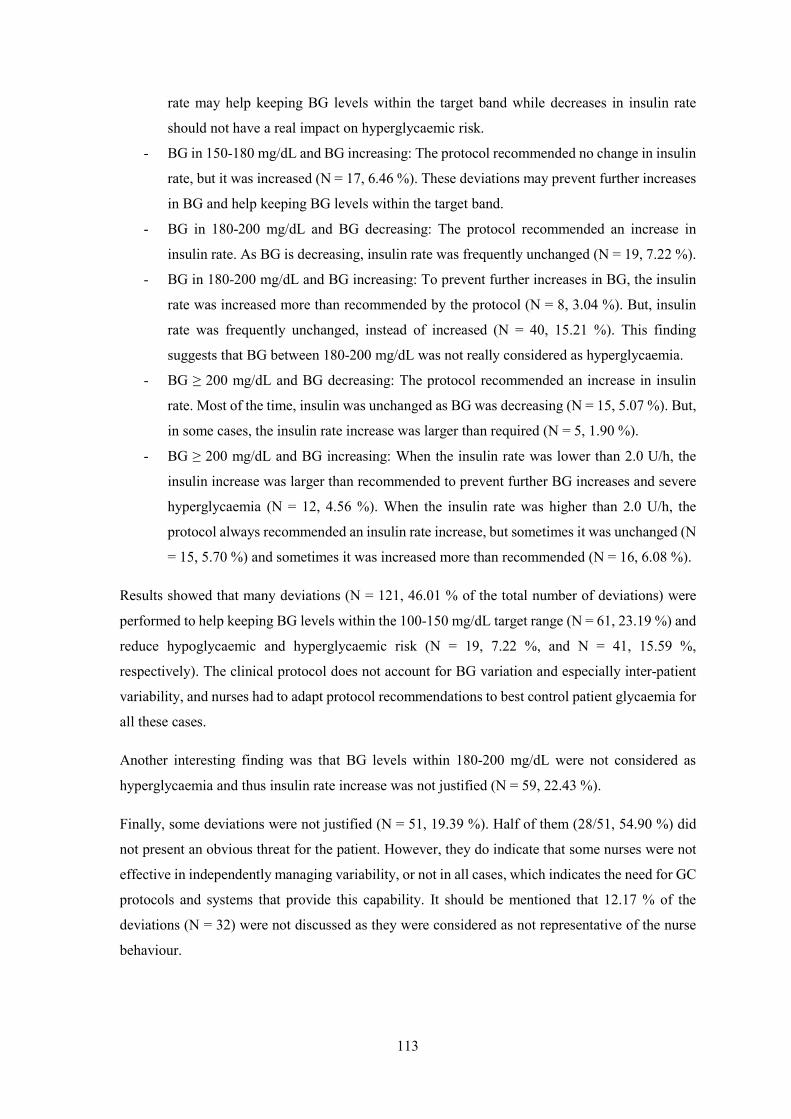
113
rate may help keeping BG levels within the target band while decreases in insulin rate
should not have a real impact on hyperglycaemic risk.
- BG in 150-180 mg/dL and BG increasing: The protocol recommended no change in insulin
rate, but it was increased (N = 17, 6.46 %). These deviations may prevent further increases
in BG and help keeping BG levels within the target band.
- BG in 180-200 mg/dL and BG decreasing: The protocol recommended an increase in
insulin rate. As BG is decreasing, insulin rate was frequently unchanged (N = 19, 7.22 %).
- BG in 180-200 mg/dL and BG increasing: To prevent further increases in BG, the insulin
rate was increased more than recommended by the protocol (N = 8, 3.04 %). But, insulin
rate was frequently unchanged, instead of increased (N = 40, 15.21 %). This finding
suggests that BG between 180-200 mg/dL was not really considered as hyperglycaemia.
- BG ≥ 200 mg/dL and BG decreasing: The protocol recommended an increase in insulin
rate. Most of the time, insulin was unchanged as BG was decreasing (N = 15, 5.07 %). But,
in some cases, the insulin rate increase was larger than required (N = 5, 1.90 %).
- BG ≥ 200 mg/dL and BG increasing: When the insulin rate was lower than 2.0 U/h, the
insulin increase was larger than recommended to prevent further BG increases and severe
hyperglycaemia (N = 12, 4.56 %). When the insulin rate was higher than 2.0 U/h, the
protocol always recommended an insulin rate increase, but sometimes it was unchanged (N
= 15, 5.70 %) and sometimes it was increased more than recommended (N = 16, 6.08 %).
Results showed that many deviations (N = 121, 46.01 % of the total number of deviations) were
performed to help keeping BG levels within the 100-150 mg/dL target range (N = 61, 23.19 %) and
reduce hypoglycaemic and hyperglycaemic risk (N = 19, 7.22 %, and N = 41, 15.59 %,
respectively). The clinical protocol does not account for BG variation and especially inter-patient
variability, and nurses had to adapt protocol recommendations to best control patient glycaemia for
all these cases.
Another interesting finding was that BG levels within 180-200 mg/dL were not considered as
hyperglycaemia and thus insulin rate increase was not justified (N = 59, 22.43 %).
Finally, some deviations were not justified (N = 51, 19.39 %). Half of them (28/51, 54.90 %) did
not present an obvious threat for the patient. However, they do indicate that some nurses were not
effective in independently managing variability, or not in all cases, which indicates the need for GC
protocols and systems that provide this capability. It should be mentioned that 12.17 % of the
deviations (N = 32) were not discussed as they were considered as not representative of the nurse
behaviour.

114
8.4. Summary
The main objective of this chapter was to understand why nursing staff do not or cannot follow GC
protocol recommendations in terms of insulin rate adjustment in the medical ICU where the next
Belgian STAR pilot trial will be performed. This chapter first showed how nurses independently
assess and manage patient glycaemic variability by these adjustments. In addition, it also showed
that some insulin rate adjustments, particularly those resulting from a stop in nutrition, were not
always properly implemented.
Specific results showed that many deviations were performed to help keeping BG levels within the
100-150 mg/dL target range and to reduce hypoglycaemic and hyperglycaemic risk. As the clinical
protocol does not account for BG variation and especially inter- and intra- patient variability, nurses
had to adapt protocol recommendations to best control patient glycaemia for all these cases.
However, not all adjustments were safe, indicating that not all nurses manage this variability
effectively because they have no direct measurement of patient metabolic condition.
A final interesting finding was that BG levels within 180-200 mg/dL were not considered as
hyperglycaemia and thus insulin rate increase was not justified. Overall, these outcomes showed
the need for GC protocols and systems that directly identify and manage patient variability.
Overall, this chapter highlighted a lack of effectiveness of the clinical protocol to manage the patient
and/or their variability with what are considered realistic dose or timing recommendations. Relying
on the experience of nurses is broadly effective, but also introduces variability in care and outcome.
Computerised GC protocols could help nurses to more easily account for patient variability and
also to more easily adjust insulin rate in the case of a stop in nutrition.

115
Chapter 9. How to ensure good
nursing compliance, and safe and
effective glycaemic control? Third
pilot trial
The first implementation of the STAR framework in a Belgian ICU (SL1) was associated with safe,
effective GC (Chapter 5). This SL1 pilot trial also showed a high level of insulin sensitivity
variability in this Belgian group of primarily cardiovascular ICU patients compared to medical ICU
patients. It also highlighted several issues related to the clinical implementation of STAR. Based
on these issues, the STAR framework was improved to enhance its performance and usability in a
real, clinical environment (Chapter 6).
The second implementation of the STAR framework in the same Belgian ICU (SL2) successfully
reduced clinical workload, while maintaining control quality and safety, using a target-to-range
approach (Chapter 7). However, this SL2 pilot trial highlighted a “lack of trust” in the protocol
recommendations and showed that nurses were reluctant to insulin rate changes. It also highlighted
that 48-hour trials would be desirable to better understand how it would perform for full patient
stay.
This chapter presents the third clinical implementation of the STAR framework in a different,
medical ICU at the CHU in Liege, Belgium. The main objective of this new STAR implementation
is to improve nurse compliance to protocol recommendations, while maintaining GC efficiency and
safety. Virtual trials are used to optimise an enhanced STAR framework to fit clinical practice, meet
clinician requirements, and maximise nurse compliance to STAR recommendations.

116
9.1. Virtual trials
This section presents the new STAR framework customised for the clinical practice needs of a
Belgian medical ICU. Virtual trials are used to analyse and assess the performance and safety of
the enhanced STAR framework in silico prior to clinical implementation. The virtual trial process
has been previously described in Section 2.7 and illustrated in Figure 2-9. It is also described and
validated in detail in Chase et al. (2010b).
9.1.1. Patient cohorts
The first step of a virtual trial is to use clinical data to generate the insulin sensitivity profiles that
represent the virtual patients (Section 2.7.1). Here, two different cohorts of virtual patients were
used: the medial ICU cohort and the Glucontrol cohort. These should provide good cohorts, as well
as illustrating any significant differences between their metabolic response and condition, as the
ICUs and patient mix are different.
Medical ICU cohort
The medical ICU cohort was previously described in Section 8.1 and virtual patients are created via
the process described in Figure 2-10, using Model 3 (Section 0) to capture patient-specific response
to insulin and nutrition inputs. This cohort includes clinical data from 20 non-diabetic patients
whose glycaemia was controlled during their stay in the Belgian medical ICU where the third STAR
framework will be implemented.
Glucontrol cohort
The Glucontrol virtual patient cohort was previously described in Section 5.2 and is the same here.
It includes clinical data from 196 Belgian patients included in Glucontrol study at the CHU of Liege
between March 2004 and April 2005. The patient characteristics and demographics were
summarised in Table 5-1.
9.1.2. STAR protocol framework
The protocol recommendation is calculated as follows:
1. Previous and current BG measurements and clinical data (nutrition and insulin rates) are
used to identify a patient-specific current insulin sensitivity parameter value for the prior

117
time interval (Hann et al., 2005). This step accounts for inter-patient variability (Chase et
al., 2007; Chase et al., 2010b; Lonergan et al., 2006b).
2. Possible insulin rates and time intervals are assessed. Insulin rates are limited to specific
values between 0.0 U/h and 6.0 U/h, with an increment of 0.5 U/h, except between 0.0 U/h
and 1.0 U/h. Possible insulin rates are thus 0.0, 1.0, 1.5, 2.0, 2.5, 3.0, 3.5…6.0 U/h. The
increment is defined to reduce nurse workload associated with making small and frequent
changes in insulin rates. The maximum insulin rate of 6.0 U/h is defined for safety and to
avoid insulin saturation effects (Rizza et al., 1981, Black et al., 1982). Note that this
maximum insulin rate can be clinically specified.
Possible time intervals are limited to 1, 2 and 3 hours. However, in three specific cases,
only hourly intervention is recommended. First, when the current BG value is more than 1
mmol/L below the 5th percentile expected BG value from the last protocol intervention.
Second, when the current BG level is lower than a hypoglycaemic threshold value. This
hypoglycaemic threshold is clinically specified. Third, when the current BG level is higher
than a hyperglycaemic threshold value. This hyperglycaemic threshold is also clinically
specified.
3. For each possible time interval (1, 2 and 3 hours, or 1 hour), the glycaemic outcomes of all
possible insulin interventions, defined in Step 2, are assessed. The insulin rate resulting in
the forecast 5th percentile BG value closest to the lower bound of the target range, but above
a hypoglycaemic threshold value, is selected among the possible insulin rates defined in
Step 2. More precisely, for each possible time interval, the assessment of each possible
insulin intervention includes 3 phases:
a. The stochastic model provides a distribution of possible SI parameter values for
the next time interval (1, 2 or 3 hours), based on the current insulin sensitivity value
identified in Step 1. This phase accounts for the intra-patient variability typically
observed in critically ill patients (Lin et al., 2006; Lin et al., 2008).
b. Based on the insulin sensitivity distribution and for each of the possible insulin
rates defined in Step 2, the 5th percentile BG outcome prediction is calculated using
Model 3 and the 95th percentile expected insulin sensitivity value obtained from
Phase a. This phase calculates the glycaemic variability due to intra-patient
variability and the 5th percentile BG value illustrates the possible BG spread
towards hypoglycaemia due to intra-patient variability.

118
c. For each time interval (1, 2 and 3 hours), the goal is to find the insulin rates that
put the 5th percentile BG value closest to the lower bound of the target range, but
above the hypoglycaemic threshold, to maximise overlap of the outcome BG range
with the desired target range and to ensure safety, respectively.
This step leads to one selected insulin rate per possible time interval. Note that there is
always at least one recommendation for the 1-hour interval and a maximum of three
recommendations when 1-, 2- and 3- hourly measurements are allowed.
4. Among selected insulin rates from Step 3, the insulin rate associated with the longest
possible time interval is selected to minimise nurse workload. The time interval is thus set
to that longest possible time interval.
In case of hypoglycaemia (BG ≤ 2.2 mmol/L), the protocol recommends no insulin and the time
interval until next BG measurement is set to 1 hour. A bolus of exogenous glucose (12 g) is also
administrated to the patient. The step-by-step description of this insulin-only STAR GC approach
is illustrated in Figure 6-1.
As for the previous STAR framework, this third STAR protocol framework is characterised by two
glycaemic bands (Figure 6-1): the target band and the range of glycaemic outcomes due to insulin
sensitivity variability (Step 3.b). The protocol aims to maximise the overlap between these bands,
such that the 5th percentile BG is on or above a clinically specified hypoglycaemic threshold. It is a
target-to-range approach.
9.1.3. STAR-Liege 3 protocol
Four major changes were made for the STAR-Liege 3 (SL3) protocol, compared with the SL2
protocol. First, hourly intervention is once again allowed. This change may result in an increased
number of BG measurements but has not in other implementations (Fisk et al., 2012b). While the
second STAR version aimed to reduce nursing staff workload, hourly intervention is required when
BG reductions are larger than expected, when current BG is lower than a clinically specified
hypoglycaemic threshold or higher than a clinically specified hyperglycaemic threshold. This
clinical decision can be justified by the fact that it has been the first implementation of a model-
based computerised GC system in this medical ICU.
Second, 3-hourly measurements are allowed whatever the median BG outcome prediction. In the
previous STAR framework, this rule limited 3-hourly intervention and this change would
counterbalance the more frequent use of 1-hourly measurement. Third, this new STAR framework
was implemented in a medical ICU, where patient insulin sensitivity was not as variable as observed

119
in the surgical ICU (Section 0). The stochastic model SM 5 is no longer required and the initial
stochastic model is used (Section 2.5.5). Finally, the target band was clinically defined as 5.6-8.3
mmol/L (100-150 mg/dL).
The maximum insulin rate was clinically set to 6.0 U/h, with a maximum increase of 2.0 U/h from
the previous insulin rate. The hypoglycaemic threshold was set to 4.4 mmol/L. The hyperglycaemic
threshold used for hourly measurement was set to 10.0 mmol/L. These values characterise the
overall framework values that define this STAR implementation.
Good nurse compliance to STAR recommendations is one main objective of this third
implementation. The compliance analysis performed in Section 8.3 showed two main issues that
can be easily overcome with this STAR implementation.
- Accounting for patient variability: the clinical protocol include a specific rule to account
for patient variability but only in a specific case4. However, the implementation of this
specific rule seems to be difficult in an ICU setting. Moreover, in all other situations, nurses
had to adapt protocol recommendations to best control patient glycaemia and variability.
Most of the deviations were performed to help keeping BG levels within the 100-150 mg/dL
target range and minimise hypoglycaemic and hyperglycaemic risk. This issue that impedes
GC should be resolved by STAR as it accounts for inter- and intra- patient variability
directly.
- Management of parenteral and enteral nutrition stops: the clinical protocol includes a
specific rule for nutrition stop. However, this rule was not always properly implemented.
As STAR directly accounts for nutrition and changes in nutrition and insulin dosing, the
insulin rate adjustments in the case of a stop in nutrition would be easily calculated.
9.1.4. Results
Virtual trials on medical ICU patient cohort
Table 9-1 shows a comparison of virtual trials between the current clinical protocol defined in
Section 8.2 and the SL3 protocol, as customised to fit local clinical practice. Existing protocol
performance shows that 7.76 % of BG levels are above 10.0 mmol/L (hyperglycaemic BG levels),
17.04 % of BG are within 8.3-10.0 mmol/L, 58.98 % of BG are within the target glycaemic band
(5.6-8.3 mmol/L) and 16.22 % of the BG are below 5.6 mmol/L, with 3.10 % of BG < 4.4 mmol/L.
4 BG within 100-180 mg/dL with no insulin rate change during 24 hours and BG decreases below 100 mg/dL.
120
The SL3 protocol is associated with tighter BG level distribution around the target. Results show
81.82 % of BG are within 5.6-8.3 mmol/L. Moreover, SL3 enables tighter control as the IQR is
reduced from 2.2 mmol/L (clinical protocol) to 1.0 mmol/L (SL3). STAR presents similar
hyperglycaemic BG levels (BG ≥ 10.0 mmol/L), but significantly lower BG levels (1.59 % of BG
< 5.6 mmol/L), with only 0.10 % of BG < 4.4 mmol/L, which is 31 times lower than the current
protocol. As expected, given the insulin rate calculation used by STAR (Section 9.1.2), less than 5
% of BG are below 4.4 mmol/L. These values are reflected in the CDFs shown in Figure 9-1.
Table 9-1: Virtual trial results for the third implementation of STAR in Liege.
Clinical protocol SL3
Models
Glucose-insulin system Model 2 Model 2
Insulin sensitivity variability Initial stochastic model Initial stochastic model
Protocol characteristics
Glycaemic target 5.6-8.3 mmol/L 5.6-8.3 mmol/L
Nutrition regimes Left to attending clinical staff Left to attending clinical staff
Insulin administration Infusions Infusions
Limitation of insulin rate 50.0 U/h 6.0 U/h
Measurement frequency (time interval) 1-4 hour 1-3 hour
Hypoglycaemic threshold 4.4 mmol/L 4.4 mmol/L
Hyperglycaemic threshold 10.0 mmol/L 10.0 mmol/L
Simulation general results : whole cohort statistics
Number of patients 20 20
Total hours 5009 5014
Number of measurements 2125 1912
BG levels (mmol/L) 7.0 [6.1 - 8.3] 7.0 [6.7 - 7.7]
% BG ≥ 10.0 mmol/L 7.76 6.12
% BG within 8.0-10.0 mmol/L 22.05 14.36
% BG within 4.4-8.0 mmol/L 67.09 79.42
% BG < 4.4 mmol/L 3.10 0.10
% BG < 4.0 mmol/L 1.23 0.04
% BG < 2.2 mmol/L 0.00 0.00
Number of patients with BG < 2.2 mmol/L 0 0
Exogenous insulin rate (U/h) 3.0 [2.0 - 6.5] 3.5 [2.0 - 6.0]
Exogenous glucose rate (g/h) 9.7 [8.8 - 11.7] 9.7 [8.8 - 11.6]
% BG within 8.3-10.0 mmol/L 17.04 10.47
% BG within 5.6-8.3 mmol/L 58.98 81.82
% BG within 4.4-5.6 mmol/L 13.12 1.49
The better glycaemic outcomes for SL3 are associated with similar insulin rates, but with a
maximum of 6.0 U/h. SL3 is associated with reduced measurement frequency (~10 %) despite time

121
intervals vary from 1 to 3 hours, while the current clinical protocol also recommends 4-hourly
measurement. Note that clinical data (not shown) shows that in practice, hourly measurements are
not frequently applied during GC and the number of actual clinical measurements is lower. Overall,
these results show that SL3 provides safe, effective GC, at acceptable workload.
Figure 9-1: CDFs for BG levels (left panel), exogenous insulin rates (middle panel) and exogenous glucose rate (right
panel), defined for the whole cohort, for the SL3 virtual trial.
Virtual trials on Glucontrol patient cohort
Table 9-2 presents virtual trials results of clinical protocol, SL2 and SL3 on the Glucontrol patient
cohort. As for the virtual trial on medical ICU patients, the SL3 protocol is associated with tighter
BG level distribution around the target. Results show that 81.39 % of BG are within 5.6-8.3
mmol/L. Moreover, SL3 enables tighter control as the IQR is reduced from 2.2 mmol/L (clinical
protocol) to 1.0 mmol/L (SL3).
SL3 also presents lower hyperglycaemic BG levels (BG ≥ 10.0 mmol/L) and less BG levels < 5.6
mmol/L. As expected, given the insulin rate calculation used by STAR (Section 8.2.2), less than 5
% of BG are below 4.4 mmol/L. However, the percent of severe hypoglycaemia (BG < 2.2 mmol/L)
and the number of patients with at least one severe hypoglycaemia is higher. But, only 0.04 % of
BG levels are below the hypoglycaemic threshold. These small changes are also possibly due to the
virtual patient cohort used (Suhaimi et al., 2010).
SL3 is associated with slightly higher insulin rates and with increased measurement frequency as
time interval varies from 1 to 3 hours, while the current clinical protocol also recommends 4-hourly
measurement. Equally, 1-hourly measurements are not recommended by SL2. Overall, these results
0 5 10 15 200
0.1
0.2
0.3
0.4
0.5
0.6
0.7
0.8
0.9
1
BG (mmol/L)
Cum
ulat
ive
frequ
ency
0 5 100
0.1
0.2
0.3
0.4
0.5
0.6
0.7
0.8
0.9
1
Exogenous insulin rate (U/h)
Cum
ulat
ive
frequ
ency
0 5 10 15 200
0.1
0.2
0.3
0.4
0.5
0.6
0.7
0.8
0.9
1
Exogenous glucose rate (g/h)
Cum
ulat
ive
frequ
ency
Target bandClinical protocolSTAR-Liege 3
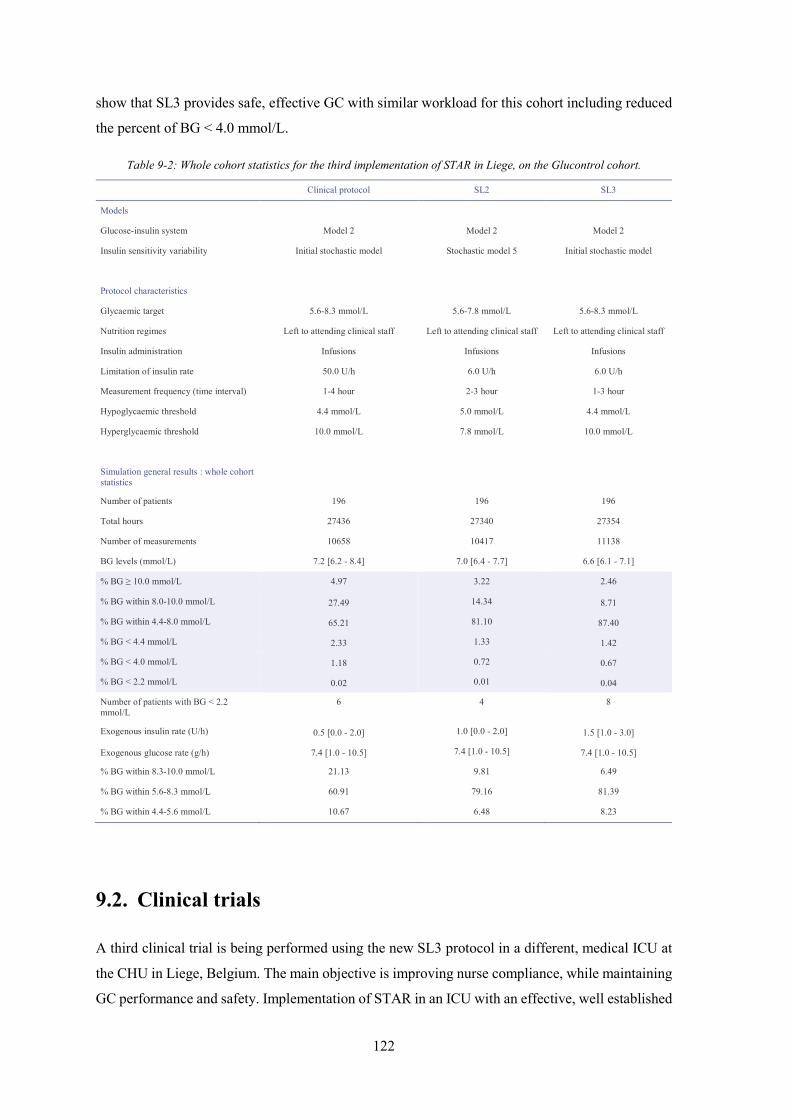
122
show that SL3 provides safe, effective GC with similar workload for this cohort including reduced
the percent of BG < 4.0 mmol/L.
Table 9-2: Whole cohort statistics for the third implementation of STAR in Liege, on the Glucontrol cohort.
Clinical protocol SL2 SL3
Models
Glucose-insulin system Model 2 Model 2 Model 2
Insulin sensitivity variability Initial stochastic model Stochastic model 5 Initial stochastic model
Protocol characteristics
Glycaemic target 5.6-8.3 mmol/L 5.6-7.8 mmol/L 5.6-8.3 mmol/L
Nutrition regimes Left to attending clinical staff Left to attending clinical staff Left to attending clinical staff
Insulin administration Infusions Infusions Infusions
Limitation of insulin rate 50.0 U/h 6.0 U/h 6.0 U/h
Measurement frequency (time interval) 1-4 hour 2-3 hour 1-3 hour
Hypoglycaemic threshold 4.4 mmol/L 5.0 mmol/L 4.4 mmol/L
Hyperglycaemic threshold 10.0 mmol/L 7.8 mmol/L 10.0 mmol/L
Simulation general results : whole cohort statistics
Number of patients 196 196 196
Total hours 27436 27340 27354
Number of measurements 10658 10417 11138
BG levels (mmol/L) 7.2 [6.2 - 8.4] 7.0 [6.4 - 7.7] 6.6 [6.1 - 7.1]
% BG ≥ 10.0 mmol/L 4.97 3.22 2.46
% BG within 8.0-10.0 mmol/L 27.49 14.34 8.71
% BG within 4.4-8.0 mmol/L 65.21 81.10 87.40
% BG < 4.4 mmol/L 2.33 1.33 1.42
% BG < 4.0 mmol/L 1.18 0.72 0.67
% BG < 2.2 mmol/L 0.02 0.01 0.04
Number of patients with BG < 2.2 mmol/L
6 4 8
Exogenous insulin rate (U/h) 0.5 [0.0 - 2.0] 1.0 [0.0 - 2.0] 1.5 [1.0 - 3.0]
Exogenous glucose rate (g/h) 7.4 [1.0 - 10.5] 7.4 [1.0 - 10.5] 7.4 [1.0 - 10.5]
% BG within 8.3-10.0 mmol/L 21.13 9.81 6.49
% BG within 5.6-8.3 mmol/L 60.91 79.16 81.39
% BG within 4.4-5.6 mmol/L 10.67 6.48 8.23
9.2. Clinical trials
A third clinical trial is being performed using the new SL3 protocol in a different, medical ICU at
the CHU in Liege, Belgium. The main objective is improving nurse compliance, while maintaining
GC performance and safety. Implementation of STAR in an ICU with an effective, well established

123
GC protocol should help improve nurse confidence with GC protocol and thus further ensure better
nursing compliance.
9.3. Summary
The main objective for this third STAR clinical implementation was to improve nurse compliance
to protocol recommendations, while maintaining control quality and safety, using a target-to-range
approach. Virtual trials showed that the SL3 protocol was associated with tighter BG level
distribution around the target band, with more than 80 % of BG within this target band. SL3 was
also associated with safe GC as only 0.10 % of BG < 4.4 mmol/L for the medical ICU cohort and
1.42 % for the Glucontrol cohort.
Virtual trials also showed that SL3 reduced clinical workload compared with the current clinical
protocol, despite time intervals varying from 1 to 3 hours, while the current clinical protocol also
recommends 4-hourly measurement. Note that in practice, hourly measurements were not
frequently applied during GC and the number of actual clinical measurements is lower.
Overall, virtual trial results show that SL3 provides safe, effective GC, at acceptable workload.
Clinical trials are currently performed to assess SL3 performance in a real ICU setting, and assess
nurse compliance to a new computerised GC system.

124

125
Chapter 10. Extreme case glycaemic
control: Hyper-Insulinemia
Euglycaemia Therapy
As previously mentioned (Section 2.1.2), insulin impacts on energetic metabolism and has anti-
inflammatory effects to reduce glucotoxicity. However, insulin also presents additional beneficial
effects on cardiac function when insulin resistance is overcome with very high insulin doses
(Massion and Preiser, 2010; Ouwens and Diamant, 2007). Hyper-Insulinemia Euglycaemia
Therapy (HIET) combines these insulin effects to treat patients with postoperative cardiogenic
shock. This chapter presents an analysis of implementing GC in association with HIET to safely
optimise insulin and glucose dosing in this therapy.
10.1. HIET as treatment for cardiogenic shock
Cardiogenic shock can be defined as an insufficient tissue perfusion and cellular oxygenation
resulting from primary cardiac pump failure (Cheatham et al., 2008; Heinz, 2006). This failure is
mainly caused by an acute myocardial infraction. It can also result from reduced contractility,
ventricular outflow obstruction, ventricular filling anomalies, acute valvular failure, cardiac
dysrhythmias and ventriculoseptal defects (Cheatham et al., 2008; Heinz, 2006). Toxicity, e.g. β-
blockers or anticalcics, could also lead to cardiogenic shock (Massion and Preiser, 2010).
10.1.1. Consequences of cardiogenic shock
Cardiogenic shock is a critical illness (Heinz, 2006) and it thus associated with a systemic
inflammation and multi-organ failure (Section 2.2.1). Moreover, decreased tissue perfusion

126
resulting from cardiogenic shock leads to anaerobic metabolism and to tissue hypoxia (oxygen
starvation), which can eventually induce eventual vital organ dysfunction (Cheatham et al., 2008).
Indeed, myocytes always need energy (ATP) to sustain contractile function of the heart (Ouwens
and Diamant, 2007). Under normal aerobic conditions, myocytes derive ATP from oxidation of
fatty acids. However, under anaerobic conditions in a shock state, glycolysis is the only source of
ATP production (Figure 2-2, Section 2.1.1), and thus glucose becomes the main energy source
(Boyer et al., 2002; Ouwens and Diamant, 2007; Patel et al., 2007).
Finally, cardiogenic shock is associated with hyperglycaemia and with severe hyperlactatemia (high
plasma lactate concentration), which is mainly related to an increased endogenous lactate
production, but which can also result from changes in glucose metabolism (Chiolero et al., 2000).
More precisely, catecholamine administration induces increased lactate and glucose endogenous
production, which leads to hyperlactatemia and hyperglycaemia, respectively. It appears likely that
in patients with cardiogenic shock hyperglycaemia can improve tissue glucose uptake. Due to tissue
oxygen starvation associated with cardiogenic shock, glucose is mainly degraded to lactate by the
glycolytic pathway. Hence, hyperglycaemia induces lactate release and increases hyperlactatemia
in patients with postoperative cardiogenic shock. Overall, this clinical scenario appears as an
extreme case of hyperglycaemia in critical illness, with many fundamental clinical symptoms and
dynamics.
10.1.2. Insulin beneficial effects
Insulin use in this scenario aims to force the myocardium to use glucose as fuel and to prevent
hyperglycaemia-toxicity effects. In addition, beneficial cardiac and inotropic effects appear at high
doses of insulin (Massion and Preiser, 2010). Insulin effects on myocytes during HIET are
summarised in Figure 10-1 and are further explained in the following.
Figure 10-1: Effects of insulin.
Cardiogenic shock
Hyper-Insulinemia Euglycaemia Therapy (HIET)
Insulin Anti-oxidative effects
Anti-inflammatory effects Effects on energy metabolism
Effects on calcium metabolism Vasodilator effects
Anti-apoptotic effects
Cardiac pump failure
Insufficient tissue perfusion
Anaerobic metabolism
ATP synthesis via glycolysis
Glucose as energy source
Glucose 2 pyruvic acids 2 NAD+ 2 NADH,H+
2 ADP 2 ATP

127
Anti-oxidative and anti-inflammatory effects of insulin in a cardiogenic shock
As previously explained, stress-induced hyperglycaemia has pro-oxidative effects, increasing
insulin resistance and apoptosis phenomenon, and pro-inflammatory effects. As in insulin therapy,
anti-oxidative and anti-inflammatory effects of insulin aim to avoid cardiovascular
hyperglycaemia-toxicity (Massion and Preiser, 2010). Hence, just as in critical illness, insulin can
be used to combat oxidative stress-induced hyperglycaemia.
Effects on energy metabolism
Insulin stimulates BG uptake and glycolysis that allows anaerobic ATP production in myocardium
and allows preserving pump activity under anaerobic conditions (Massion and Preiser, 2010).
Insulin also promotes the stimulation of glycogen synthesis (Ouwens and Diamant, 2007) and thus
increases myocardial glycogen energetic stock that can be used under anaerobic conditions
(Massion and Preiser, 2010). Equal to other critical illness, it thus attempts to create more glucose
catabolic metabolism.
Effects on calcium metabolism
Insulin increases intracellular calcium concentration (Massion and Preiser, 2010; Ouwens and
Diamant, 2007). Hence, insulin promotes cardiac contractility and has positive inotropic effects.
These impacts are the main focus on the excessive use of insulin in HIET for cardiac failure.
Vasodilator effects
Insulin induces vasodilation (Ouwens and Diamant, 2007) derived from anti-adrenergic effects and
microcirculatory effects (capillary recruitment) (Massion and Preiser, 2010). First, insulin can
reduce positive inotropic effects induced by excess catecholamines during ischemia-reperfusion
(Massion and Preiser, 2010). In particular, insulin inhibits calcium uptake mediated by β-adrenergic
receptors (Massion and Preiser, 2010). Second, insulin increases micro-vascular perfusion by
inducing vasodilation at the arterioles and pre-capillary sphincters in muscular, cutaneous and
myocardial tissue, and by increasing the myogenic component of vasomotricity
(vasoconstriction/vasodilation). Insulin also stabilises the endothelium and limits capillary fluid
leak in cases of hyper-permeability (Massion and Preiser, 2010), improving the chances to limit
organ failure and maintain organ perfusion.
128
Anti-apoptotic effects
Insulin prevents cardiomyocytes from apoptosis and preserves mitochondrial integrity (Massion
and Preiser, 2010).
Insulin’s positive inotropic effects result from metabolic change (glucose oxidation instead of FFA
with a better metabolic efficiency saving oxygen), systemic vasodilatation and calcium-dependent
effects (effect of insulin on intracellular calcium) (Massion and Preiser, 2010; Ouwens and
Diamant, 2007). Positive inotropic, anti-apoptotic and vasodilator effects (anti-adrenergic and
microcirculatory effects) of insulin appear to exist only when insulin resistance is overcome with
very high insulin doses (Massion and Preiser, 2010).
10.2. HIET clinical protocol
As cardiogenic shock results from severe cardiac failure, patients with postoperative cardiogenic
shock present low cardiac index (Chiolero et al., 2000). In diabetic patients after cardiac surgery,
Szabo et al. showed that high-dose Glucose-Insulin-Potassium can promote carbohydrate uptake
and increase hemodynamic responses, such as cardiac index and stroke volume index (Szabo et al.,
2001). High doses of insulin have also been shown to be an effective treatment for patients with
calcium channel blocker (CCB) overdose when conventional therapy (calcium, catecholamines and
glucagon) fails to improve hemodynamic parameters (Boyer et al., 2002). Patel et al. (2007) also
showed that HIET can improve hemodynamic measurements for patients with CCB toxicity. High
dosing of insulin also showed significant inotropic action in reducing the need for inotropes and
reinstating cardiac function in cases of severe cardiac failure (Boyer et al., 2002; Massion and
Preiser, 2010).
Given the potential beneficial effects of insulin at high doses, HIET appears to be an effective
possible treatment for patients with cardiogenic shock. Clinical application of HIET is currently
empirical and left to attending clinicians, as no standard dosing protocol exists (Patel et al., 2007).
Insulin doses have been recommended between 0.5-0.6 U/kg per hour, and even 1.0 U/kg per hour,
which, for an 80 kg individual, is 45 times the normal daily dose of insulin (Boyer et al., 2002;
Massion and Preiser, 2010). These insulin doses are very high and have to be managed with
exogenous glucose infusions to avoid severe hypoglycaemia.
Difficulty in controlling high insulin doses results from highly variable patient metabolism and
insulin sensitivity. Two main issues can appear during HIET. First, insulin doses could be limited
for patients with high insulin sensitivity because exogenous glucose inputs should not be higher
than 400 g per day to avoid hyperglycaemia toxicity. Second, low insulin-sensitivity patients need
129
a lower exogenous glucose dose, but, when patients get better, insulin sensitivity increases and
hypoglycaemic risk becomes important. HIET has also been shown to be associated with
hypoglycaemia and hypokalaemia (reduced potassium levels in blood plasma) (Boyer et al., 2002;
Patel et al., 2007), and treatment to deal with these negative effects are also not standardised (Patel
et al., 2007). Finally, exogenous glucose administration dosing to maintain intermediate glycaemic
levels also remains difficult.
10.3. Implementation of GC with HIET
The main problem can be defined as one of dosing insulin at very high levels for beneficial cardiac
outcome, while controlling glycaemia with limited peak infusions of exogenous glucose.
Model-based protocols could thus be used to predict patient-specific metabolic response and safely
optimise HIET interventions of insulin and exogenous glucose administration. Such model-based
controllers have shown significant success in controlling glycaemia in highly insulin resistant
critically ill patients (Evans et al., 2011; Penning et al., 2011; Plank et al., 2006). Importantly,
several of these controllers use both insulin and nutrition to control glycaemia, where nutritional
control elements are critical for HIET (Chase et al., 2008b; Evans et al., 2011; Penning et al., 2011).
The first step is to determine whether the validated glucose-insulin system model, Model 3 (Section
0), has to be adapted for the very high insulin doses used in HIET. Specifically, do such large doses
have different apparent kinetics? The characterisation of patient-specific renal clearance is also an
essential feature for an accurate physiological understanding of insulin kinetics at this insulin dosing
level.
Finally, insulin sensitivity varies significantly in the critically ill patients, with high inter- patient
and intra- patient variability (Lin et al., 2006; Lin et al., 2008). In addition, the time course of insulin
sensitivity at these dosing levels and for these patients has never been reported previously. Hence,
the analysis of HIET patients will also aid the understanding of the underlying physiological and
metabolic mechanisms.
In developing these answers, this research examines unique clinical data developed from eight
initial patients included in a HIET protocol. The data includes full insulin and BG data to enable a
first model-based analysis of HIET patient metabolic behaviour.

130
10.4. HIET patient cohort
The current analysis is based on clinical data from eight patients included in a HIET protocol from
January 2011 in the ICU at the CHU in Liege, Belgium. Ethical approval was obtained to use this
retrospective and prospective data from the Ethics Committee of the Medical Faculty of the
University of Liege (Belgium). The general characteristics of the patients who received HIET are
summarised in Table 10-1.
Clinical data measurements are BG levels, exogenous insulin infusions, plasma insulin
concentrations and exogenous glucose inputs (enteral and parenteral nutrition including
medication). BG measurements were made using Accu-Check Inform (Roche Diagnostics,
Mannheim, Germany) glucometers. Plasma insulin concentrations were measured using the
hexokinase method (Modular P, Roche Diagnostics, Mannheim, Germany).
Table 10-1: HIET patient cohort characteristics.
HIET 1 HIET 2 HIET 3 HIET 4 HIET 5 HIET 6 HIET 7 HIET 8
Age (years) 48 78 62 69 68 53 82 71
Gender F M F M M F F M
Weight (kg) 72 81 56 76 68 49.5 62 80
Diabetic status Not diabetic Not diabetic Not diabetic Not diabetic Not diabetic Not diabetic Type II Not diabetic
Total hours 47 48 52 53 77 36 68 42
Number of BG measurements 36 12 26 35 52 36 63 29
Initial BG (mmol/L) 8.4 8.2 9.7 9.6 8.7 8.9 4.3 9.2
BG levels (mmol/L): 6.6 [5.5 - 7.8] 8.6 [8.2 - 9.8] 7.2 [6.4 - 8.3] 7.2 [6.3 - 8.4] 9.8 [6.1 -
12.8] 7.5 [5.2 - 9.2] 6.9 [5.4 - 8.9] 9.9 [7.2 - 14.0]
% BG ≥ 10.0 mmol/L 11.11 25.00 11.54 2.86 44.23 16.67 4.76 48.28
% BG within 8.0-10.0 mmol/L
11.11 58.33 15.38 22.86 25.00 27.78 31.75 13.79
% BG within 4.4-8.0 mmol/L 69.44 16.67 73.08 74.29 23.08 50.00 55.56 37.93
% BG < 4.4 mmol/L 8.33 0.00 0.00 0.00 7.69 5.56 7.94 0.00
% BG < 2.2 mmol/L 0.00 0.00 0.00 0.00 0.00 0.00 0.00 0.00
Initial insulin bolus (U) 25 25 30 38 34 25 31 40
Exogenous insulin rate (U/h)
45.2 [35.0 - 70.0]
82.0 [82.0 - 82.0]
30.0 [30.0 - 59.0]
76.0 [76.0 - 76.0]
270.0 [123.5 - 310.4]
25.0 [0.0 - 50.0]
270.0 [127.5 - 280.0]
120.0 [120.0 - 120.0]
Exogenous glucose rate (g/h)
25.0 [25.0 - 25.0]
18.5 [17.0 - 19.0]
26.0 [20.7 - 26.0]
15.0 [13.5 - 18.0]
17.0 [17.0 - 22.3]
17.4 [15.0 - 22.1]
18.6 [15.5 - 19.6]
16.0 [15.0 - 16.6]

131
10.5. Assessment of model for HIET patients
The first step of this preliminary study is to determine whether the validated glucose-insulin system
model described in Section 0 (Model 3) has to be adapted for the very high insulin doses used in
HIET.
10.5.1. Method
Insulin kinetics modelling was evaluated by comparing measured and model-based simulated
plasma insulin concentrations. Piecewise linear interpolation of clinical BG measurements was used
to define endogenous insulin production () as function of BG levels and diabetes status using
Equations (2-12) to (2-14). Endogenous insulin production and exogenous insulin inputs are used
to solve Equations (2.7) and (2.8) and obtain the evolution of plasma insulin concentration .
10.5.2. Results
Preliminary results are presented per-patient, based on Figure 10-2. These results may be
summarised:
- Patient 1 presents a good match between simulated and measured plasma insulin
concentrations, but the number of plasma insulin measurement is limited (3 measurements).
- For Patient 2, plasma insulin concentration measurements are relatively low, especially
given the exogenous insulin input of 82.0 U/h. Only 4 plasma insulin measurements were
made during the therapy.
- Patient 3 results show that measured plasma insulin concentrations are higher than
simulated values, especially at t = 8h. Patient 3 is also associated with a limited number of
measurements (5 measurements).
- For Patient 4, measured plasma insulin concentration is higher than simulated values at t =
4h. Afterwards, Patient 4 presents measured plasma insulin concentrations lower than
simulated values.
- Patient 5 presents a good match between simulated and measured plasma insulin
concentrations during the first 10 hours. Afterwards, measured plasma insulin
concentrations are lower than simulated values. The trend of the last three measurements is
similar to the simulated evolution of the plasma insulin concentration, but offset in time.
- For Patient 6, all measured plasma insulin concentrations are higher than the simulated
ones. But, the evolution over the therapy is similar.
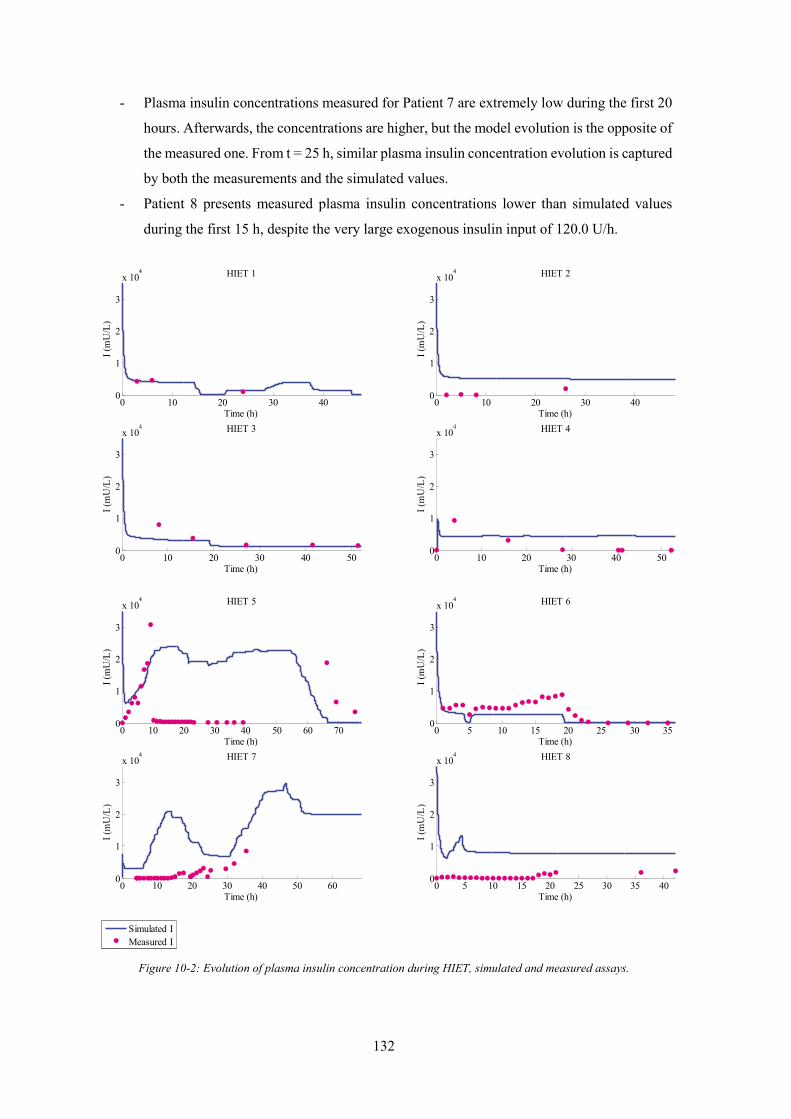
132
- Plasma insulin concentrations measured for Patient 7 are extremely low during the first 20
hours. Afterwards, the concentrations are higher, but the model evolution is the opposite of
the measured one. From t = 25 h, similar plasma insulin concentration evolution is captured
by both the measurements and the simulated values.
- Patient 8 presents measured plasma insulin concentrations lower than simulated values
during the first 15 h, despite the very large exogenous insulin input of 120.0 U/h.
Figure 10-2: Evolution of plasma insulin concentration during HIET, simulated and measured assays.
0 10 20 30 400
1
2
3
x 104 HIET 1
I (m
U/L
)
Time (h)
0 10 20 30 400
1
2
3
x 104 HIET 2
I (m
U/L
)Time (h)
0 10 20 30 40 500
1
2
3
x 104 HIET 3
I (m
U/L
)
Time (h)
0 10 20 30 40 500
1
2
3
x 104 HIET 4
I (m
U/L
)
Time (h)
0 10 20 30 40 50 60 700
1
2
3
x 104 HIET 5
I (m
U/L
)
Time (h)
0 5 10 15 20 25 30 350
1
2
3
x 104 HIET 6
I (m
U/L
)
Time (h)
0 10 20 30 40 50 600
1
2
3
x 104 HIET 7
I (m
U/L
)
Time (h)
0 5 10 15 20 25 30 35 400
1
2
3
x 104 HIET 8
I (m
U/L
)
Time (h)
Simulated IMeasured I

133
10.5.3. Discussion
A preliminary analysis was performed to determine whether a validated model of the glucose-
insulin system was able to capture HIET patient metabolic behaviour. More precisely, insulin
kinetics modelling was evaluated by comparing measured and model-based simulated plasma
insulin concentrations. Patients 1 to 4 present limited number of plasma insulin concentration
measurements (N = 3, N = 4, N = 5 and N = 7, respectively) that impedes exact comparison between
simulated and measured values. More blood samples were analysed for the next patients. Hourly
measurements were performed during the first 24 hours of the HIET. Then, 3-hour or 6-hour
measurements were made for Patients 5 to 8.
Preliminary results (Figure 10-2) showed that HIET patient metabolic behaviour is relatively
variable. Response to high insulin dosing differs for the eight patients included in this analysis. As
HIET was used as a “last chance” therapy for these patients, patient condition was critical and it
may partly explain the observed difference in HIET patient behaviour.
Results also highlighted many cases where plasma insulin concentration measurements are
extremely and unexpectedly low for the massive insulin doses given. To assess the consistency of
these data, simulated plasma insulin concentration at steady state was evaluated for each
exogenous insulin rate, based on Equations (2-7) and (2-8), and compared to clinical measurements
of plasma insulin concentrations. This steady state value provides, given such well validated models
(Lotz et al., 2010), a guideline value around which insulin assays might be expected given the very
large, steady dose given.
At steady state, plasma and interstitial insulin concentration are assumed to be constant. Moreover,
saturation of insulin-dependent glucose clearance and plasma insulin clearance ( and ,
respectively) can be neglected. Given = , insulin concentration in the interstitial space at
steady state is given by Equation (10-1), derived from Equation (2-8). is assessed using
Equation (10-2), derived from Equations (2-7) and (10-1). Results are presented in Figure 10-3.
= 0.5 (10-1)
= + 1 − + + 0.5 (10-2)
Patients 2, 4, 5, 7 and 8 present measured values lower than steady state simulated values, despite
large exogenous insulin inputs over 80.0 U/h. These situations would first indicate possible issues
related to blood sample conservation or plasma insulin measurement. A less likely explanation

134
would be a massive insulin uptake or clearance, but such metabolic behaviour has never been
observed previously.
Figure 10-3: Evolution of plasma insulin concentration during HIET – Comparison with simulated and measured
values, and steady state values.
In contrast, situations where the plasma insulin concentration is higher than simulated values were
observed for Patients 3, 4, 6 and 7. These situations would result from an over-estimation of the
0 10 20 30 400
1
2
3
x 104 HIET 1
I (m
U/L
)
Time (h)
0 10 20 30 400
1
2
3
x 104 HIET 2
I (m
U/L
)
Time (h)
0 10 20 30 40 500
1
2
3
x 104 HIET 3
I (m
U/L
)
Time (h)
0 10 20 30 40 500
1
2
3
x 104 HIET 4
I (m
U/L
)
Time (h)
0 10 20 30 40 50 60 700
1
2
3
x 104 HIET 5
I (m
U/L
)
Time (h)
0 5 10 15 20 25 30 350
1
2
3
x 104 HIET 6
I (m
U/L
)
Time (h)
0 10 20 30 40 50 600
1
2
3
x 104 HIET 7
I (m
U/L
)
Time (h)
0 5 10 15 20 25 30 35 400
1
2
3
x 104 HIET 8
I (m
U/L
)
Time (h)
Simulated IMeasured ISimulated I at steady state

135
plasma insulin concentration by the model. Saturation of renal insulin clearance would also explain
a possible reduction of insulin clearance from the plasma.
However, good matching between simulated and measured plasma insulin concentrations was also
observed for Patients 1 and 5. Additionally, similar plasma insulin concentration evolution was
captured by both the measurements and the simulated values for Patients 5, 6 and 7. These two
findings would indicate that the model should be able to capture HIET patient metabolic behaviour,
but requires better measurements of plasma insulin concentrations at such unusually high and
otherwise non-physiological levels.
10.6. Summary
HIET is a supra-physiological insulin dosing protocol used in acute cardiac failure to reduce
dependency on inotropes to augment or generate cardiac output, and is based on the inotropic effects
of insulin at high doses. Such high insulin doses are managed using intravenous glucose infusions
to control glycaemia and prevent hypoglycaemia. However, both insulin dosing and GC in these
patients are managed ad-hoc and are thus very difficult. This chapter examined unique clinical data
from eight patients undergoing HIET.
Results highlighted several issues. First, the process of plasma insulin measurement should be
revised to ensure perfect blood sample conservation and accurate measurement given the extreme,
otherwise non-physiological levels being measured. Second, insulin clearance, especially renal
clearance, should be more deeply studied for such high insulin doses. Results also indicated that
the validated model of the glucose-insulin system would be able to capture HIET patient metabolic
behaviour. However, more data is needed to confirm and further specify these results and confirm
whether the model is adequate or adaption in insulin kinetics modelling should be done for
controlling HIET in a model-based framework. Subsequent studies also should be made to
determine the effect of high insulin dosing on renal clearance and insulin sensitivity

136

137
Chapter 11. Conclusion and future
work
Critically ill patients often present stress-induced hyperglycaemia and low insulin sensitivity, both
associated with worsened patient outcomes. GC aims to reduce and stabilise glycaemic levels taking
into account inter-patient variability, evolving physiological patient condition (intra-patient
variability) and minimising hypoglycaemic risk. GC has been shown to improve patient outcome.
However, in clinical practice, evolving patient condition, fear of hypoglycaemia and increased
nursing staff workload impede safe, effective GC implementation. Safe and effective clinical
protocols are thus required to provide beneficial GC.
Model-based protocols allow customised and patient-specific GC approach, and have been shown
to be able to provide tight GC for critically ill patients. Model-based protocols tend to provide a
safe and effective way to manage inter- and intra- patient variability. These protocols are based on
physiological models of the glucose-insulin regulatory system to capture patient-specific dynamics
and response to insulin and nutrition inputs. As a result, they can enable patient-specific and
adaptive GC in real-time from measurement to measurement. Such protocols can thus provide safe,
effective control to improve patient outcome and quality of care, while reducing cost.
Developing safe and effective model-based protocols that fit within practical clinical workflow is
thus today’s great challenge. The main objective of this thesis was thus to provide answers to three
main questions related to GC implementation in ICUs.
What do intensive care clinicians want in glycaemic control?
The implementation of GC in an ICU setting requires safe and effective clinical protocols. An
increasing number of GC protocols have been developed over the last few years, indicating
continuing interest in GC. However, many of these GC protocols failed to become standard practice

138
in their ICU. Several failed because they increased workload or failed to fit clinical workflow.
Understanding ICU staff needs and expectations related to GC would help to facilitate the safe,
effective adoption of GC systems in ICU daily practice.
Several surveys have been carried out about GC. These surveys focused on hypoglycaemic and
hyperglycaemic thresholds, on the characteristics of a GC protocol (BG target, insulin
administration, control guidelines) and on opinions regarding GC. All these surveys were conducted
nationally. However, clinical practice culture and approach can vary greatly. In this thesis, a more
overall European overview was provided, considering other aspects associated with GC.
In particular, the interest of European medical staff for GC systems was assessed, especially for
computerised protocols, which are appearing now. Equally, key success factors associated with GC
protocols were evaluated to help protocol design meet clinician expectations and concerns. Finally,
personnel involved in GC system selection, GC protocol characterisation and definition was
identified to ensure the survey was addressed to proper population and illuminate population who
should be consulted when considering GC in ICU.
Chapter 3 showed that there is a real need for computerised GC protocols and emerging interest for
model-based protocols with predictions. Whatever the protocol type, GC protocol should be
designed to meet ICU staff expectations. Four main GC protocol elements that are expected by ICU
staff are:
1. Safety: minimising hypoglycaemic risk is a major challenge to ensure safe GC. GC protocol
should recommend specific intervention to deal with nutrition interruption or to manage
hypoglycaemic risk and thus enhance safety.
2. Efficiency: GC protocols have to provide efficient BG regulation, e.g. safely reduce and
stabilise BG levels.
3. Ease-of-use: protocols should be easy to use, have a friendly interface and be clearly
explained to ICU staff to facilitate their adoption and to ensure their right clinical
implementation.
4. Adaptive control: protocol design should allow the GC to be hospital-specific, population-
specific and patient-specific and to fit clinical practice and workflow. Future GC protocols
should thus be designed to allow flexible control in terms of BG targets, control frequency,
patient diabetic status, evolving patient condition and insulin and nutrition inputs.
All these elements, but also published clinical studies related to a GC protocol, help to enhance ICU
staff trust in GC. The opportunity to realise pilot clinical trials in their own ICU also enhances
clinician trust in GC as they can verify that their main expectations are met.

139
Overall, this thesis presented the results of a European survey that is both deeper in questioning and
geographically broader in scope than prior surveys. As a result, some unique features, particularly
regarding model-based methods and other expectations were uncovered. These outcomes should
thus be reflected in subsequent GC development and implementation in this research.
What is the best glycaemic target to achieve during GC?
GC protocols have to ensure safety by limiting hypoglycaemic risk, to be effective using an optimal
target band, and allow assessment of GC quality in real-time. This research provided insight on
primary issues that impede GC implementation in ICU settings. One such is the definition of a
metric that can be used to assess GC performance in real time, and a clear definition or proof of a
good or optimal target glycaemic band.
The cTIB metric was defined to assess GC performance in real-time, as well as providing a useful,
simple target for GC studies. The single metric encapsulates the need to achieve control of both
level and variability to minimise cellular dysfunction, as well as linking the level of achievement
to patient outcome over each day of stay. The overall results showed that cTIB appears to be an
effective, and novel, glycaemic target for control.
In particular, Chapter 4 showed that increased cumulative time in an intermediate glycaemic band
was associated with higher OL. Results suggested that effective GC positively influences patient
outcome, regardless of how the GC is achieved, and that BG < 7.0 mmol/L was associated with a
measurable increase in the OL, if hypoglycaemia is avoided. The impact of the achievement of a
defined glycaemic target band on the severity of organ failure and mortality was also evaluated in
this research. Examining mortality independent of organ failure showed achieving cTIB in the 4.0-
7.0 mmol/L band over 50 %, regardless of the form of GC, improved survival OR on all days of
ICU stay.
How to achieve safe and effective GC?
GC has shown benefits in ICU patients, but has been difficult to achieve consistently due to inter-
and intra- patient variability that requires more adaptive, patient-specific solutions. STAR is a
flexible model-based GC framework accounting for evolving physiological patient condition by
identifying insulin sensitivity at each intervention and using a stochastic model of its future
potential values to optimise control and maximise safety. STAR enables effective, safe GC that fits

140
clinical practice, as it can be customised for clinically specified glycaemic targets, control
approaches, and clinical resources.
This thesis focused on the implementation of the STAR framework in ICUs at the CHU in Liege,
Belgium. STAR GC system implementation required the development of customised GC approach
to fit CHU clinical practice and meet clinician requirements. Virtual trials were used to develop and
optimise the STAR framework and then clinical trials were performed to assess performance in
real, clinical conditions.
The first implementation of the STAR framework in Liege (SL1) was presented in Chapter 5. The
overall results showed that STAR enabled tight, very safe and efficient GC for an insulin-only
approach in Belgian ICU settings. This first clinical trial was an opportunity to assess the ability to
adapt the model-based STAR framework from its development environment at Christchurch
Hospital in New Zealand to a completely separate institute in Liege, Belgium. SL1 showed that
some patients were significantly more variable in their insulin sensitivity than expected from the
initial stochastic cohort model. Post-analysis showed an overall good nurse compliance to STAR,
but implementation issues were also highlighted during this pilot trial. In particular, three-hour
measurement periods would be desirable to further reduce nursing staff effort and the control
scheme would be revised to take better account of specific clinical situations during GC to improve
the clinical implementation and make it more autonomous.
Chapter 6 presented the specific issues to be modified to enhance performance and usability of the
STAR GC approach in a real, clinical environment. First, the suitability of the initial stochastic
model to this Belgian group of patients was explored and new stochastic models were created to
better account for high insulin sensitivity variability observed in this patient cohort. The application
of a stochastic model using data only of the initial 1-2 days of stay would have resulted in different,
more continuous insulin interventions and better forecasting. Second, the STAR framework was
enhanced to further reduce nurse workload, while improving GC approach, by improving the
modelling of the insulin kinetics.
The implementation of this new STAR framework in Liege was required to assess GC performance
and safety in real, clinical environment. Chapter 7 described the second implementation of the
STAR framework in the same Belgian ICU (SL2). Virtual trials showed that the SL2 protocol was
associated with similar BG outcomes to SL1, but with significantly reduced measurement
frequency. Clinical trials show that clinical workload was reduced by over a factor of 2, while safety
was maintained with less frequent measurement and intervention compared to prior clinical trial.
The results presented thus showed that safe, effective GC can be achieved for a highly variable
cohort with significantly reduced workload using a model-based method, where several clinical
studies on similar cardiovascular cohorts have had excessive hypoglycaemia. However, this SL2

141
pilot trial highlighted a “lack of trust” in the protocol recommendations and showed that nurses
were reluctant to insulin rate changes.
Chapter 8 analysed nurse compliance to GC protocol recommendations in the medical ICU where
the next Belgian STAR clinical trial will be performed. This compliance analysis highlighted a lack
of effectiveness of the clinical protocol to manage the patient and/or their variability with what are
considered realistic dose or timing recommendations. This chapter suggested that computerised GC
protocols could help nurses to more easily account for patient variability and also to more easily
adjust insulin rate in the case of a stop in nutrition.
Chapter 9 presented the third clinical implementation of the STAR framework in a different,
medical ICU. The main objective of this new STAR implementation was to improve nurse
compliance to protocol recommendations, while maintaining GC efficiency and safety. Virtual
results showed that SL3 should provide safe, effective GC, at acceptable workload. Clinical trials
are currently being performed to assess SL3 performance in a real ICU setting, and assess nurse
compliance to a new computerised GC system.
Finally, this thesis presented the interest of implementing GC in association with HIET to safely
optimise insulin dosing to treat cardiogenic shock. HIET is a supra-physiological insulin dosing
protocol used in acute cardiac failure to reduce dependency on inotropes to augment or generate
cardiac output, and is based on the inotropic effects of insulin at high doses. Such high insulin doses
are managed using intravenous glucose infusion to control glycaemia and prevent hypoglycaemia.
However, both insulin dosing and GC in these patients are managed ad-hoc. Chapter 10 examined
unique clinical data from eight patient undergoing HIET. Results highlighted several issues. First,
the process of plasma insulin measurement should be revised to ensure perfect blood sample
conservation and accurate measurement. Second, insulin clearance, especially renal clearance,
should be more deeply studied for high insulin doses. Results also indicated that the validated model
of the glucose-insulin system would be able to capture HIET patient metabolic behaviour. However,
more data is needed to confirm and further specify these results and confirm whether the model is
adequate or adaption in insulin kinetics modelling should be done for controlling HIET in a model-
based framework. Subsequent studies also should be made to determine the effect of high insulin
dosing on renal clearance and insulin sensitivity.
Overall, this thesis developed answers to key questions that were impeding GC adoption by ICU
staff and are necessary to ensure successful GC implementation. The primary outcomes include the
development of a framework for compliance analysis to assess specific, local impediments to
adoption, which in turn led to the discovery that a great deal of non-compliance is the action of

142
nursing staff to directly account for patient-specific variability and response to therapy. This novel
outcome strongly supports the need for model-based GC that can directly account for both inter-
and intra- patient variability, which until now was not assumed to be a necessity in GC. This need
in turn objectively leads to the need for any GC protocol to account for nutrition, which has also
not been typical in the field, so that these variabilities can be assessed.
Further to these outcomes was the need to objectively assess GC performance relative to clinical
metrics of concern and patient outcome. This need was addressed in the development of a specific
exposure metric for hyperglycaemia and glycaemic variability (cTIB) that can be directly linked to
reports of the gluco-toxic effects in the literature. Further analysis directly linked this metric to both
organ failure and risk of death, the main, patient-centric clinical outcomes.
These results were assembled with the results of an international survey that further supported these
outcomes to create a STAR framework GC protocol for use in local, Belgian ICUs. Clinical pilot
trials supported these results and aided in their further development. A third clinical implementation
of the STAR framework is currently in progress at the CHU of Liege to validate the final outcomes.
Future results should help to further optimise the STAR GC approach. Future trials should help the
diffusion of the STAR GC approach in ICU settings and STAR could become a standard GC
practice. This thesis also showed that GC can be applied to efficiently and safely manage
intravenous insulin and glucose infusion during HIET. More data and subsequent studies are
required to more accurately determine whether the validated model of the glucose-insulin system
would be able to capture HIET patient metabolic behaviour, and to deeply study insulin clearance
processes during HIET.
143
Appendix 1. Questionnaire
Part 1
Who am I? I am a PhD student in Biomedical Engineering working on computerized glycaemic control. Main goals of this survey:
- Understand clinician opinions about glycaemic control for critically ill patients. - Identify clinician expectations about computerized glycaemic controller.
Part 2
In this part, * corresponds to unavoidable questions.
(2.1) Where is your hospital (city, country)?* (2.2) Is your hospital a tertiary or university affiliated?* ("Yes" means that your hospital is a tertiary one or a university one).
- Yes - No - Do not wish to specify
(2.3) What is your position or function in the hospital?* (2.4) What is the total number of beds in your IC unit(s)? (If you are working in several ICUs, please specify the number of beds per ICU.) (2.5) Do you have a formal glycaemic control protocol in your ICU?*
- Yes - No
Part 3
(3.1) If not, why do you not practice glycaemic control on your ICU? - Lack of trust - Fear of hypoglycemia - Not necessary

144
Part 4
(4.1) Does your glycaemic control protocol adjust: - Insulin only - Insulin and nutrition
(4.2) Is the insulin administrated as: - Boluses - Infusions - Mainly infusions with few boluses - Subcutaneously - Other:
(4.3) What type of glycaemic control protocol do you use? - Flowchart-based - Formula-based - Model-based - Model-based and predictions - Other:
(4.4) Has this controller been developed in collaboration with engineers? - Yes - No
(4.5) Is this glycaemic control protocol computerized? - Yes - No
(4.6) If not, would you prefer a computerized one? - Yes - No
Part 5
(5.1) We consider that the main characteristics necessary for a computerized glycaemic controller to be implemented are: ease of use, friendly interface, and ability to customize the controller to clinical practice. If you think any other characteristics are important, could you specify them?
(5.2) In your opinion, what type of glycaemic control protocol is the most efficient and safe to use? - Flowchart-based - Formula-based - Model-based - Model-based and predictions - Other:
(5.3) Currently, computerized glycaemic controller can be customized in glycaemic target, measurement frequency, patient type (diabetics vs. non diabetics), insulin administration mode (bolus vs. infusion) and maximum allowed insulin/nutrition rates. If there are any other parameters you would wish to customize, please specify them.
(5.4) In your opinion, should a glycaemic control protocol adjust: - Insulin only

145
- Insulin and nutrition
(5.5) In your opinion, should the insulin be administrated as: - Boluses - Infusions - Mainly infusions with few boluses - Subcutaneously - Other:
(5.6) In your ICU unit, who defines the glycaemic control protocol?
(5.7) If the purchase of a computerized glycaemic controller is considered, who would make the purchase decision?
(5.8) If the purchase of a computerized glycaemic controller is considered, who purchases the device?
(5.9) If the purchase of a computerized glycaemic controller is considered, who uses the device?
(5.10) If the purchase of a computerized glycaemic controller is considered, who determines the controller characteristics (glycaemic target, insulin administration mode, measurement frequency…)?
(5.11) If the purchase of a computerized glycaemic controller is considered, who selects the device?
(5.12) If the purchase of a computerized glycaemic controller is considered, your selection of a computerized glycaemic controller will be based on:
- Publications about this device - Knowledge about the developers - Recommendations from other clinicians - Pilot test in your ICU - CE-label - Other:
(5.13) Sometimes, clinicians adapt the glycaemic control protocol. Would you be interested to primarily test changes during virtual trials (computer-based in silico) before clinically implementing them?
- Yes - No
(5.14) If you have any supplemental notes or remarks about computerized glycaemic controller, please specify them here.

146

147
References
Al-Tarifi, A., Abou-Shala, N., Tamim, H. M., Rishu, A. H., & Arabi, Y. M. (2011). What is the optimal blood glucose target in critically ill patients? A nested cohort study. Ann Thorac Med, 6(4), 207-211.
Ali, N. A., O'Brien, J. M., Jr., Dungan, K., Phillips, G., Marsh, C. B., Lemeshow, S., Connors, A. F., Jr., & Preiser, J. C. (2008). Glucose variability and mortality in patients with sepsis. Crit Care Med, 36(8), 2316-2321.
Amrein, K., Ellmerer, M., Hovorka, R., Kachel, N., Fries, H., von Lewinski, D., Smolle, K., Pieber, T. R., & Plank, J. (2012). Efficacy and safety of glucose control with Space GlucoseControl in the medical intensive care unit--an open clinical investigation. Diabetes Technology & Therapeutics, 14(8), 690-695.
Aragon, D. (2006). Evaluation of nursing work effort and perceptions about blood glucose testing in tight glycemic control. Am J Crit Care, 15(4), 370-377.
Bachelet, R. (2012). Recueil, analyse et traitement de données : le questionnaire. Ecole Centrale de Lille. Villeneuve d’Ascq, France. Retrieved from http://rb.ec-lille.fr/Cours_de_recueil_analyse_et_traitement_de_donnees.htm
Bagshaw, S. M., Bellomo, R., Jacka, M. J., Egi, M., Hart, G. K., & George, C. (2009). The impact of early hypoglycemia and blood glucose variability on outcome in critical illness. Critical Care, 13(3).
Berends, N., Hermans, G., Bouckaert, B., Van Damme, P., Schrooten, M., De Vooght, W., Wouters, P., & Van den Berghe, G. (2008). Implementing intensive insulin therapy in daily practice reduces the incidence of critical illness polyneuropathy and/or myopathy. Critical Care, 12(Suppl 2), P155.
Berglund, L., Berne, C., Svardsudd, K., Garmo, H., Melhus, H., & Zethelius, B. (2012). Seasonal variations of insulin sensitivity from a euglycemic insulin clamp in elderly men. Ups J Med Sci, 117(1), 35-40.
Bergman, R. N., Finegood, D. T., & Ader, M. (1985). Assessment of insulin sensitivity in vivo. Endocr Rev, 6(1), 45-86.

148
Black, P. R., Brooks, D. C., Bessey, P. Q., Wolfe, R. R., & Wilmore, D. W. (1982). Mechanisms of insulin resistance following injury. Annals of surgery, 196(4), 420-435.
Borghouts, L. B., & Keizer, H. A. (2000). Exercise and Insulin Sensitivity: a Review. Int J Sports Med, 21(1), 1-12.
Bosy-Westphal, A., Hinrichs, S., Jauch-Chara, K., Hitze, B., Later, W., Wilms, B., Settler, U., Peters, A., Kiosz, D., & Muller, M. J. (2008). Influence of partial sleep deprivation on energy balance and insulin sensitivity in healthy women. Obes Facts, 1(5), 266-273.
Boyer, E. W., Duic, P. A., & Evans, A. (2002). Hyperinsulinemia/euglycemia therapy for calcium channel blocker poisoning. Pediatr Emerg Care, 18(1), 36-37.
Brownlee, M. (2001). Biochemistry and molecular cell biology of diabetic complications. Nature, 414(6865), 813-820.
Brunkhorst, F. M., Engel, C., Bloos, F., Meier-Hellmann, A., Ragaller, M., Weiler, N., Moerer, O., Gruendling, M., Oppert, M., Grond, S., Olthoff, D., Jaschinski, U., John, S., Rossaint, R., Welte, T., Schaefer, M., Kern, P., Kuhnt, E., Kiehntopf, M., Hartog, C., Natanson, C., Loeffler, M., & Reinhart, K. (2008). Intensive insulin therapy and pentastarch resuscitation in severe sepsis. N Engl J Med, 358(2), 125-139.
Carayon, P., & Gurses, A. (2005). A human factors engineering conceptual framework of nursing workload and patient safety in intensive care units. Intensive Crit Care Nurs, 21(5), 284-301.
Chase, J. G., Andreassen, S., Jensen, K., & Shaw, G. M. (2008a). The Impact of Human Factors on Clinical Protocol Performance - A proposed assessment framework and case examples. Journal of Diabetes Science and Technology (JoDST), 2(3), 409-416.
Chase, J. G., Le Compte, A. J., Preiser, J. C., Shaw, G. M., Penning, S., & Desaive, T. (2011a). Physiological modeling, tight glycemic control, and the ICU clinician: what are models and how can they affect practice? Ann Intensive Care, 1(1), 11.
Chase, J. G., Le Compte, A. J., Suhaimi, F., Shaw, G. M., Lynn, A., Lin, J., Pretty, C. G., Razak, N., Parente, J. D., Hann, C. E., Preiser, J. C., & Desaive, T. (2011b). Tight glycemic control in critical care--the leading role of insulin sensitivity and patient variability: a review and model-based analysis. Comput Methods Programs Biomed, 102(2), 156-171.
Chase, J. G., Pretty, C. G., Pfeifer, L., Shaw, G. M., Preiser, J. C., Le Compte, A. J., Lin, J., Hewett, D., Moorhead, K. T., & Desaive, T. (2010a). Organ failure and tight glycemic control in the SPRINT study. Crit Care, 14(4), R154.
Chase, J. G., Shaw, G., Le Compte, A., Lonergan, T., Willacy, M., Wong, X. W., Lin, J., Lotz, T., Lee, D., & Hann, C. (2008b). Implementation and evaluation of the SPRINT protocol for tight glycaemic control in critically ill patients: a clinical practice change. Crit Care, 12(2).
Chase, J. G., Shaw, G. M., Lin, J., Doran, C. V., Hann, C., Robertson, M. B., Browne, P. M., Lotz, T., Wake, G. C., & Broughton, B. (2005). Adaptive bolus-based targeted glucose regulation of hyperglycaemia in critical care. Med Eng Phys, 27(1), 1-11.

149
Chase, J. G., Shaw, G. M., Lotz, T., LeCompte, A., Wong, J., Lin, J., Lonergan, T., Willacy, M., & Hann, C. E. (2007). Model-based insulin and nutrition administration for tight glycaemic control in critical care. Curr Drug Deliv, 4(4), 283-296.
Chase, J. G., Shaw, G. M., Wong, X. W., Lotz, T., Lin, J., & Hann, C. E. (2006). Model-based Glycaemic Control in Critical Care - A review of the state of the possible. Biomedical Signal Processing and Control, 1(1), 3-21.
Chase, J. G., Suhaimi, F., Penning, S., Preiser, J. C., Le Compte, A. J., Lin, J., Pretty, C. G., Shaw, G. M., Moorhead, K. T., & Desaive, T. (2010b). Validation of a model-based virtual trials method for tight glycemic control in intensive care. BioMedical Engineering OnLine, 9, 84.
Cheatham, M. L., Block, E. F., Promes, J., Smith, H., Dent, D., & Mueller, D. (2008). Shock: an overview. Irwin RS si Rippe JM (editori)“Intensive care medicine”. Lippincott Williams & Wilkins, Philadelphia, 1831-1842.
Chiolero, R. L., Revelly, J. P., Leverve, X., Gersbach, P., Cayeux, M. C., Berger, M. M., & Tappy, L. (2000). Effects of cardiogenic shock on lactate and glucose metabolism after heart surgery. Crit Care Med, 28(12), 3784-3791.
Davidson, P. C., Steed, R. D., & Bode, B. W. (2005). Glucommander: a computer-directed intravenous insulin system shown to be safe, simple, and effective in 120,618 h of operation. Diabetes Care, 28(10), 2418-2423.
Davidson, P. C., Steed, R. D., Bode, B. W., Hebblewhite, H. R., Prevosti, L., & Cheekati, V. (2008). Use of a computerized intravenous insulin algorithm within a nurse-directed protocol for patients undergoing cardiovascular surgery. Journal of Diabetes Science and Technology, 2(3), 369-375.
Donga, E., van Dijk, M., van Dijk, J. G., Biermasz, N. R., Lammers, G. J., van Kralingen, K. W., Corssmit, E. P., & Romijn, J. A. (2010). A single night of partial sleep deprivation induces insulin resistance in multiple metabolic pathways in healthy subjects. J Clin Endocrinol Metab, 95(6), 2963-2968.
Doran, C. V., Chase, J. G., Shaw, G. M., Moorhead, K. T., & Hudson, N. H. (2004). Automated insulin infusion trials in the intensive care unit. Diabetes Technol Ther, 6(2), 155-165.
Dungan, K. M., Braithwaite, S. S., & Preiser, J. C. (2009). Stress hyperglycaemia. Lancet, 373(9677), 1798-1807.
Egi, M., Bellomo, R., Stachowski, E., French, C. J., & Hart, G. (2006). Variability of blood glucose concentration and short-term mortality in critically ill patients. Anesthesiology, 105(2), 244-252.
Egi, M., Bellomo, R., Stachowski, E., French, C. J., Hart, G. K., Taori, G., Hegarty, C., & Bailey, M. (2010). Hypoglycemia and outcome in critically ill patients. Mayo Clinic Proceedings, 85(3), 217-224.

150
Eslami, S., Abu-Hanna, A., de Jonge, E., & de Keizer, N. F. (2009). Tight glycemic control and computerized decision-support systems: a systematic review. Intensive Care Medicine, 35(9), 1505-1517.
Eslami, S., Abu-Hanna, A., de Keizer, N. F., Bosman, R. J., Spronk, P. E., de Jonge, E., & Schultz, M. J. (2010). Implementing glucose control in intensive care: a multicenter trial using statistical process control. Intensive Care Medicine, 36(9), 1556-1565.
Eslami, S., de Keizer, N. F., de Jonge, E., Schultz, M. J., & Abu-Hanna, A. (2008). A systematic review on quality indicators for tight glycaemic control in critically ill patients: need for an unambiguous indicator reference subset. Critical Care, 12(6).
Esposito, K., Marfella, R., & Giugliano, D. (2003). Stress hyperglycemia, inflammation, and cardiovascular events. Diabetes Care, 26(5), 1650-1651.
Evans, A., Le Compte, A., Tan, C. S., Ward, L., Steel, J., Pretty, C. G., Penning, S., Suhaimi, F., Shaw, G. M., Desaive, T., & Chase, J. G. (2012). Stochastic targeted (STAR) glycemic control: design, safety, and performance. J Diabetes Sci Technol, 6(1), 102-115.
Evans, A., Shaw, G. M., Le Compte, A., Tan, C. S., Ward, L., Steel, J., Pretty, C. G., Pfeifer, L., Penning, S., Suhaimi, F., Signal, M., Desaive, T., & Chase, J. G. (2011). Pilot proof of concept clinical trials of Stochastic Targeted (STAR) glycemic control. Ann Intensive Care, 1, 38.
Fahy, B. G., Sheehy, A. M., & Coursin, D. B. (2009). Glucose control in the intensive care unit. Crit Care Med, 37(5), 1769-1776.
Falciglia, M., Freyberg, R. W., Almenoff, P. L., D'Alessio, D. A., & Render, M. L. (2009). Hyperglycemia-related mortality in critically ill patients varies with admission diagnosis. Crit Care Med, 37(12), 3001-3009.
Ferreira, F. L., Bota, D. P., Bross, A., Melot, C., & Vincent, J. L. (2001). Serial evaluation of the SOFA score to predict outcome in critically ill patients. Jama, 286(14), 1754-1758.
Finfer, S., Chittock, D. R., Su, S. Y., Blair, D., Foster, D., Dhingra, V., Bellomo, R., Cook, D., Dodek, P., Henderson, W. R., Hebert, P. C., Heritier, S., Heyland, D. K., McArthur, C., McDonald, E., Mitchell, I., Myburgh, J. A., Norton, R., Potter, J., Robinson, B. G., & Ronco, J. J. (2009). Intensive versus conventional glucose control in critically ill patients. N Engl J Med, 360(13), 1283-1297.
Finfer, S., & Delaney, A. (2008). Tight glycemic control in critically ill adults. Jama, 300(8), 963-965.
Finfer, S., Wernerman, J., Preiser, J. C., Cass, T., Desaive, T., Hovorka, R., Joseph, J. I., Kosiborod, M., Krinsley, J., Mackenzie, I., Mesotten, D., Schultz, M. J., Scott, M. G., Slingerland, R., Van den Berghe, G., & Van Herpe, T. (2013). Clinical review: Consensus recommendations on measurement of blood glucose and reporting glycemic control in critically ill adults. Crit Care, 17(3), 229.

151
Fisk, L. M., Le Compte, A. J., Shaw, G. M., & Chase, J. G. (2012a). Improving Safety of Glucose Control in Intensive Care using Virtual Patients and Simulated Clinical Trials. Journal of Healthcare Engineering, 3(3), 415-430.
Fisk, L. M., Le Compte, A. J., Shaw, G. M., Penning, S., Desaive, T., & Chase, J. G. (2012b). STAR development and protocol comparison. IEEE Trans Biomed Eng, 59(12), 3357-3364.
Griesdale, D. E., de Souza, R. J., van Dam, R. M., Heyland, D. K., Cook, D. J., Malhotra, A., Dhaliwal, R., Henderson, W. R., Chittock, D. R., Finfer, S., & Talmor, D. (2009). Intensive insulin therapy and mortality among critically ill patients: a meta-analysis including NICE-SUGAR study data. Canadian Medical Association Journal, 180(8), 821-827.
Guyton, A. C., & Hall, J. E. (2000). Textbook of medical physiology (10th ed.). Philadelphia ; London: Saunders.
Hann, C. E., Chase, J. G., Lin, J., Lotz, T., Doran, C. V., & Shaw, G. M. (2005). Integral-based parameter identification for long-term dynamic verification of a glucose-insulin system model. Comput Methods Programs Biomed, 77(3), 259-270.
Heinz, G. (2006). Cardiogenic shock--an inflammatory disease. Wien Klin Wochenschr, 118(13-14), 382-388.
Hirshberg, E., Lacroix, J., Sward, K., Willson, D., & Morris, A. H. (2008). Blood glucose control in critically ill adults and children: a survey on stated practice. Chest, 133(6), 1328-1335.
Hovorka, R., Kremen, J., Blaha, J., Matias, M., Anderlova, K., Bosanska, L., Roubicek, T., Wilinska, M. E., Chassin, L. J., Svacina, S., & Haluzik, M. (2007). Blood glucose control by a model predictive control algorithm with variable sampling rate versus a routine glucose management protocol in cardiac surgery patients: a randomized controlled trial. The Journal of Clinical Endocrinology & Metabolism, 92(8), 2960-2964.
Hovorka, R., Shojaee-Moradie, F., Carroll, P. V., Chassin, L. J., Gowrie, I. J., Jackson, N. C., Tudor, R. S., Umpleby, A. M., & Jones, R. H. (2002). Partitioning glucose distribution/transport, disposal, and endogenous production during IVGTT. Am J Physiol Endocrinol Metab, 282(5), E992-1007.
Ichai, C., & Preiser, J. C. (2010). International recommendations for glucose control in adult non diabetic critically ill patients. Crit Care, 14(5), R166.
Juneja, R., Roudebush, C., Kumar, N., Macy, A., Golas, A., Wall, D., Wolverton, C., Nelson, D., Carroll, J., & Flanders, S. J. (2007). Utilization of a computerized intravenous insulin infusion program to control blood glucose in the intensive care unit. Diabetes Technol Ther, 9(3), 232-240.
Juneja, R., Roudebush, C. P., Nasraway, S. A., Golas, A. A., Jacobi, J., Carroll, J., Nelson, D., Abad, V. J., & Flanders, S. J. (2009). Computerized intensive insulin dosing can mitigate hypoglycemia and achieve tight glycemic control when glucose measurement is performed frequently and on time. Critical Care, 13(5), R163.
152
Krinsley, J. S. (2003). Association between hyperglycemia and increased hospital mortality in a heterogeneous population of critically ill patients. Mayo Clinic Proceedings, 78(12), 1471-1478.
Krinsley, J. S. (2004). Effect of an intensive glucose management protocol on the mortality of critically ill adult patients. Mayo Clinic Proceedings, 79(8), 992-1000.
Krinsley, J. S. (2008). Glycemic variability: a strong independent predictor of mortality in critically ill patients. Crit Care Med, 36(11), 3008-3013.
Krinsley, J. S., & Jones, R. L. (2006). Cost analysis of intensive glycemic control in critically ill adult patients. Chest, 129(3), 644-650.
Krinsley, J. S., & Keegan, M. T. (2010). Hypoglycemia in the critically ill: how low is too low? Mayo Clinic Proceedings, 85(3), 215-216.
Krinsley, J. S., & Preiser, J. C. (2008). Moving beyond tight glucose control to safe effective glucose control. Crit Care, 12(3), 149.
Krishnan, J. A., Parce, P. B., Martinez, A., Diette, G. B., & Brower, R. G. (2003). Caloric intake in medical ICU patients: consistency of care with guidelines and relationship to clinical outcomes. Chest, 124(1), 297-305.
Laird, A. M., Miller, P. R., Kilgo, P. D., Meredith, J. W., & Chang, M. C. (2004). Relationship of early hyperglycemia to mortality in trauma patients. J Trauma, 56(5), 1058-1062.
Langouche, L., Vander Perre, S., Wouters, P. J., D'Hoore, A., Hansen, T. K., & Van den Berghe, G. (2007). Effect of intensive insulin therapy on insulin sensitivity in the critically ill. J Clin Endocrinol Metab, 92(10), 3890-3897.
Langouche, L., Vanhorebeek, I., Vlasselaers, D., Vander Perre, S., Wouters, P. J., Skogstrand, K., Hansen, T. K., & Van den Berghe, G. (2005). Intensive insulin therapy protects the endothelium of critically ill patients. J Clin Invest, 115(8), 2277-2286.
Le Compte, A. J. (2009). Modelling the glucose-insulin regulatory system for glycaemic control in neonatal intensive care. University of Canterbury, Christchurch, New Zealand.
Le Compte, A. J., Chase, J. G., Lynn, A., Hann, C. E., Shaw, G. M., Wong, X. W., & Lin, J. (2009). Blood Glucose Controller for Neonatal Intensive Care: Virtual trials development and 1st clinical trials. Journal of Diabetes Science and Technology (JoDST), 3(5), 1066-1081.
Le Gall, J. R., Lemeshow, S., & Saulnier, F. (1993). A new Simplified Acute Physiology Score (SAPS II) based on a European/North American multicenter study. Jama, 270(24), 2957-2963.
Liljenquist, J. E., Horwitz, D. L., Jennings, A. S., Chiasson, J. L., Keller, U., & Rubenstein, A. H. (1978). Inhibition of insulin secretion by exogenous insulin in normal man as demonstrated by C-peptide assay. Diabetes, 27(5), 563-570.
153
Lin, J., Lee, D. S., Chase, J. G., Hann, C. E., Lotz, T., & Wong, X. W. (2006). Stochastic Modelling of Insulin Sensitivity Variability in Critical Care. Biomedical Signal Processing and Control, 1(3), 229-242.
Lin, J., Lee, D. S., Chase, J. G., Shaw, G. M., Le Compte, A., Lotz, T., Wong, J., Lonergan, T., & Hann, C. E. (2008). Stochastic modelling of insulin sensitivity and adaptive glycemic control for critical care. Comput Methods Programs Biomed, 89(2), 141-152.
Lin, J., Razak, N. N., Pretty, C. G., Le Compte, A., Docherty, P., Parente, J. D., Shaw, G. M., Hann, C. E., & Geoffrey Chase, J. (2011). A physiological Intensive Control Insulin-Nutrition-Glucose (ICING) model validated in critically ill patients. Comput Methods Programs Biomed, 102(2), 192-205.
Lonergan, T., Compte, A. L., Willacy, M., Chase, J. G., Shaw, G. M., Hann, C. E., Lotz, T., Lin, J., & Wong, X. W. (2006a). A pilot study of the SPRINT protocol for tight glycemic control in critically Ill patients. Diabetes Technol Ther, 8(4), 449-462.
Lonergan, T., Le Compte, A., Willacy, M., Chase, J. G., Shaw, G. M., Wong, X. W., Lotz, T., Lin, J., & Hann, C. E. (2006b). A simple insulin-nutrition protocol for tight glycemic control in critical illness: development and protocol comparison. Diabetes Technol Ther, 8(2), 191-206.
Lotz, T. F., Chase, J. G., McAuley, K. A., Shaw, G. M., Docherty, P. D., Berkeley, J. E., Williams, S. M., Hann, C. E., & Mann, J. I. (2010). Design and clinical pilot testing of the model-based dynamic insulin sensitivity and secretion test (DISST). J Diabetes Sci Technol, 4(6), 1408-1423.
Mackenzie, I. M., Ingle, S., Zaidi, S., & Buczaski, S. (2005). Tight glycaemic control: a survey of intensive care practice in large English hospitals. Intensive Care Med, 31(8), 1136.
Mackenzie, I. M., Whitehouse, T., & Nightingale, P. G. (2011). The metrics of glycaemic control in critical care. Intensive Care Med, 37(3), 435-443.
Marik, P. E., & Preiser, J. C. (2010). Toward understanding tight glycemic control in the ICU: a systematic review and metaanalysis. Chest, 137(3), 544-551.
Marik, P. E., & Raghavan, M. (2004). Stress-hyperglycemia, insulin and immunomodulation in sepsis. Intensive Care Medicine, 30(5), 748-756.
Massion, P. B., & Preiser, J. C. (2010). Réanimation métabolique du myocarde: à la redécouverte de l'insuline. Réanimation, 19(5), 406-415.
McCowen, K. C., Malhotra, A., & Bistrian, B. R. (2001). Stress-induced hyperglycemia. Critical Care Clinics, 17(1), 107-124.
McMullin, J., Brozek, J., Jaeschke, R., Hamielec, C., Dhingra, V., Rocker, G., Freitag, A., Gibson, J., & Cook, D. (2004). Glycemic control in the ICU: a multicenter survey. Intensive Care Med, 30(5), 798-803.

154
Mesotten, D., & Van den Berghe, G. (2009). Clinical benefits of tight glycaemic control: focus on the intensive care unit. Best Pract Res Clin Anaesthesiol, 23(4), 421-429.
Mitchell, I., Finfer, S., Bellomo, R., Higlett, T., & Investigators, A. C. T. G. G. M. (2006). Management of blood glucose in the critically ill in Australia and New Zealand: a practice survey and inception cohort study. Intensive Care Med, 32(6), 867-874.
Moerer, O., Plock, E., Mgbor, U., Schmid, A., Schneider, H., Wischnewsky, M. B., & Burchardi, H. (2007). A German national prevalence study on the cost of intensive care: an evaluation from 51 intensive care units. Critical Care, 11(3), R69.
Moghissi, E. S., Korytkowski, M. T., DiNardo, M., Einhorn, D., Hellman, R., Hirsch, I. B., Inzucchi, S. E., Ismail-Beigi, F., Kirkman, M. S., Umpierrez, G. E., American Association of Clinical, E., & American Diabetes, A. (2009). American Association of Clinical Endocrinologists and American Diabetes Association consensus statement on inpatient glycemic control. Diabetes Care, 32(6), 1119-1131.
Motulsky, H. J. (2002). Biostatistique: Une approche intuitive: de boeck.
Natali, A., Gastaldelli, A., Camastra, S., Sironi, A. M., Toschi, E., Masoni, A., Ferrannini, E., & Mari, A. (2000). Dose-response characteristics of insulin action on glucose metabolism: a non-steady-state approach. Am J Physiol Endocrinol Metab, 278(5), E794-801.
Ouwens, D. M., & Diamant, M. (2007). Myocardial insulin action and the contribution of insulin resistance to the pathogenesis of diabetic cardiomyopathy. Arch Physiol Biochem, 113(2), 76-86.
Pachler, C., Plank, J., Weinhandl, H., Chassin, L. J., Wilinska, M. E., Kulnik, R., Kaufmann, P., Smolle, K. H., Pilger, E., Pieber, T. R., Ellmerer, M., & Hovorka, R. (2008). Tight glycaemic control by an automated algorithm with time-variant sampling in medical ICU patients. Intensive Care Medicine, 34(7), 1224-1230.
Patel, N. P., Pugh, M. E., Goldberg, S., & Eiger, G. (2007). Hyperinsulinemic euglycemia therapy for verapamil poisoning: a review. Am J Crit Care, 16(5), 498-503.
Paw, H., & Park, G. (2006). Handbook of Drugs in Intensive Care: An A-Z Guide (3rd ed.). New York, USA: Cambridge University Press.
Penning, S., Le Compte, A. J., Massion, P., Moorhead, K. T., Pretty, C. G., Preiser, J. C., Shaw, G. M., Suhaimi, F., Desaive, T., & Chase, J. G. (2012a). Second pilot trials of the STAR-Liege protocol for tight glycemic control in critically ill patients. BioMedical Engineering OnLine, 11, 58.
Penning, S., Le Compte, A. J., Moorhead, K. T., Desaive, T., Massion, P., Preiser, J. C., Shaw, G. M., & Chase, J. G. (2011). First pilot trial of the STAR-Liege protocol for tight glycemic control in critically ill patients. Comput Methods Programs Biomed.
Penning, S., Le Compte, A. J., Moorhead, K. T., Desaive, T., Massion, P., Preiser, J. C., Shaw, G. M., & Chase, J. G. (2012b). First pilot trial of the STAR-Liege protocol for tight glycemic control in critically ill patients. Comput Methods Programs Biomed, 108(2), 844-859.

155
Pielmeier, U., Andreassen, S., Juliussen, B., Chase, J. G., Nielsen, B. S., & Haure, P. (2010a). The Glucosafe system for tight glycemic control in critical care: a pilot evaluation study. Journal of Critical Care, 25(1), 97-104.
Pielmeier, U., Andreassen, S., Nielsen, B. S., Chase, J. G., & Haure, P. (2010b). A simulation model of insulin saturation and glucose balance for glycemic control in ICU patients. Comput Methods Programs Biomed, 97(3), 211-222.
Pielmeier, U., Rousing, M. L., Andreassen, S., Nielsen, B. S., & Haure, P. (2012). Decision support for optimized blood glucose control and nutrition in a neurotrauma intensive care unit: preliminary results of clinical advice and prediction accuracy of the Glucosafe system. J Clin Monit Comput, 26(4), 319-328.
Plank, J., Blaha, J., Cordingley, J., Wilinska, M. E., Chassin, L. J., Morgan, C., Squire, S., Haluzik, M., Kremen, J., Svacina, S., Toller, W., Plasnik, A., Ellmerer, M., Hovorka, R., & Pieber, T. R. (2006). Multicentric, randomized, controlled trial to evaluate blood glucose control by the model predictive control algorithm versus routine glucose management protocols in intensive care unit patients. Diabetes Care, 29(2), 271-276.
Preiser, J. C., & Devos, P. (2007). Steps for the implementation and validation of tight glucose control. Intensive Care Medicine, 33(4), 570-571.
Preiser, J. C., Devos, P., Ruiz-Santana, S., Melot, C., Annane, D., Groeneveld, J., Iapichino, G., Leverve, X., Nitenberg, G., Singer, P., Wernerman, J., Joannidis, M., Stecher, A., & Chiolero, R. (2009). A prospective randomised multi-centre controlled trial on tight glucose control by intensive insulin therapy in adult intensive care units: the Glucontrol study. Intensive Care Medicine, 35(10), 1738-1748.
Pretty, C. G. (2012). Analysis, classification and management of insulin sensitivity variability in a glucose-insulin system model for critical illness. University of Canterbury, Christchurch, New Zealand.
Pretty, C. G., Chase, J. G., Lin, J., Shaw, G. M., Le Compte, A., Razak, N., & Parente, J. D. (2011). Impact of glucocorticoids on insulin resistance in the critically ill. Comput Methods Programs Biomed, 102(2), 172-180.
Pretty, C. G., Le Compte, A. J., Chase, J. G., Shaw, G. M., Preiser, J. C., Penning, S., & Desaive, T. (2012). Variability of insulin sensitivity during the first 4 days of critical illness: Implications for tight glycaemic control. Annals of Intensive Care.
Prigeon, R. L., Roder, M. E., Porte, D., Jr., & Kahn, S. E. (1996). The effect of insulin dose on the measurement of insulin sensitivity by the minimal model technique. Evidence for saturable insulin transport in humans. J Clin Invest, 97(2), 501-507.
Rizza, R. A., Mandarino, L. J., & Gerich, J. E. (1981). Dose-response characteristics for effects of insulin on production and utilization of glucose in man. Am J Physiol, 240(6).
Saad, E., Shwaihet, N., Mousa, A., Kalloghlian, A., Afrane, B., Guy, M., & Canver, C. (2008). Tight blood glucose control decreases surgical wound infection in the cardiac surgical patient population in the ICU. Critical Care, 12(Suppl 2), P150.
156
Sakr, Y., Vincent, J.-L., Ruokonen, E., Pizzamiglio, M., Installe, E., Reinhart, K., & Moreno, R. (2008). Sepsis and organ system failure are major determinants of post-intensive care unit mortality. Journal of Critical Care, 23(4), 475-483.
Schultz, M. J., Binnekade, J. M., Harmsen, R. E., de Graaff, M. J., Korevaar, J. C., van Braam Houckgeest, F., van der Sluijs, J. P., Kieft, H., & Spronk, P. E. (2010). Survey into blood glucose control in critically ill adult patients in the Netherlands. Neth J Med, 68(2), 77-83.
Siegelaar, S. E., Holleman, F., Hoekstra, J. B., & DeVries, J. H. (2010). Glucose variability; does it matter? Endocr Rev, 31(2), 171-182.
Suhaimi, F., Le Compte, A., Preiser, J. C., Shaw, G. M., Massion, P., Radermecker, R., Pretty, C. G., Lin, J., Desaive, T., & Chase, J. G. (2010). What makes tight glycemic control tight? The impact of variability and nutrition in two clinical studies. J Diabetes Sci Technol, 4(2), 284-298.
Szabo, Z., Arnqvist, H., Hakanson, E., Jorfeldt, L., & Svedjeholm, R. (2001). Effects of high-dose glucose-insulin-potassium on myocardial metabolism after coronary surgery in patients with Type II diabetes. Clin Sci (Lond), 101(1), 37-43.
Tortora, G. J., & Grabowski, S. R. (1994). Principes d'anatomie et de physiologie (Deuxième édition française ed.): De Boeck Université.
Treggiari, M. M., Karir, V., Yanez, N. D., Weiss, N. S., Daniel, S., & Deem, S. A. (2008). Intensive insulin therapy and mortality in critically ill patients. Crit Care, 12(1), R29.
Uchida, Y., Takeshita, K., Yamamoto, K., Kikuchi, R., Nakayama, T., Nomura, M., Cheng, X. W., Egashira, K., Matsushita, T., Nakamura, H., & Murohara, T. (2012). Stress augments insulin resistance and prothrombotic state: role of visceral adipose-derived monocyte chemoattractant protein-1. Diabetes, 61(6), 1552-1561.
Van den Berghe, G. (2004). How does blood glucose control with insulin save lives in intensive care? J Clin Invest, 114(9), 1187-1195.
Van den Berghe, G., Wilmer, A., Hermans, G., Meersseman, W., Wouters, P. J., Milants, I., Van Wijngaerden, E., Bobbaers, H., & Bouillon, R. (2006a). Intensive Insulin Therapy in the Medical ICU. N Engl J Med, 354(5), 449-461.
Van den Berghe, G., Wouters, P., Weekers, F., Verwaest, C., Bruyninckx, F., Schetz, M., Vlasselaers, D., Ferdinande, P., Lauwers, P., & Bouillon, R. (2001). Intensive insulin therapy in the critically ill patients. The New England Journal of Medicine, 345(19), 1359-1367.
Van den Berghe, G., Wouters, P. J., Kesteloot, K., & Hilleman, D. E. (2006b). Analysis of healthcare resource utilization with intensive insulin therapy in critically ill patients. Critical Care Medicine, 34(3), 612-616.
Van Herpe, T. (2008). Blood glucose control in critically ill patients: design of assessment procedures and a control system. Katholieke Universiteit Leuven, Leuven, Belgium.

157
Van Herpe, T., Espinoza, M., Pluymers, B., Goethals, I., Wouters, P., Van den Berghe, G., & De Moor, B. (2006). An adaptive input-output modeling approach for predicting the glycemia of critically ill patients. Physiol Meas, 27(11), 1057-1069.
Van Herpe, T., Mesotten, D., Wouters, P. J., Herbots, J., Voets, E., Buyens, J., De Moor, B., & Van den Berghe, G. (2013). LOGIC-insulin algorithm-guided versus nurse-directed blood glucose control during critical illness: the LOGIC-1 single-center, randomized, controlled clinical trial. Diabetes Care, 36(2), 188-194.
Vanhorebeek, I., Ellger, B., Gunst, J., Boussemaere, M., Debaveye, Y., Rabbani, N., Thornalley, P., Schetz, M., & Van den Berghe, G. (2008). Mechanisms of kidney protection by intensive insulin therapy during critical illness. Critical Care, 12(Suppl 2), P151.
Vermandele, C. (2009). Chapitre 11 - Méthodologie d'enquêtes. Laboratoire de Méthodologie du Traitement des Données (LMTD) / Institut de Sociologie Institut de recherche en statistique (IRSTAT) Université Libre de Bruxelles (ULB). Bruxelles, Belgique. Retrieved from http://www.ulb.ac.be//soco/statrope/cours/stat-d-307/notes/Chap11_0910.pdf
Vincent, J. L. (2006). Organ dysfunction in patients with severe sepsis. Surg Infect (Larchmt), 7 Suppl 2, S69-72.
Vincent, J. L., de Mendonca, A., Cantraine, F., Moreno, R., Takala, J., Suter, P. M., Sprung, C. L., Colardyn, F., & Blecher, S. (1998). Use of the SOFA score to assess the incidence of organ dysfunction/failure in intensive care units: results of a multicenter, prospective study. Working group on "sepsis-related problems" of the European Society of Intensive Care Medicine. Crit Care Med, 26(11), 1793-1800.
Vincent, J. L., Moreno, R., Takala, J., Willatts, S., De Mendonca, A., Bruining, H., Reinhart, C. K., Suter, P. M., & Thijs, L. G. (1996). The SOFA (Sepsis-related Organ Failure Assessment) score to describe organ dysfunction/failure. On behalf of the Working Group on Sepsis-Related Problems of the European Society of Intensive Care Medicine. Intensive Care Med, 22(7), 707-710.
Vogelzang, M., Loef, B. G., Regtien, J. G., van der Horst, I. C., van Assen, H., Zijlstra, F., & Nijsten, M. W. (2008). Computer-assisted glucose control in critically ill patients. Intensive Care Medicine, 34(8), 1421-1427.
Ward, L., Steel, J., Le Compte, A., Evans, A., Tan, C. S., Penning, S., Shaw, G. M., Desaive, T., & Chase, J. G. (2012). Interface design and human factors considerations for model-based tight glycemic control in critical care. Journal of Diabetes Science and Technology, 6(1), 125-134.
Weber-Carstsens, S. (2010). Insulin Resistance. Paper presented at the Endocrinology, Metabolism and Nutrition in the ICU.
Weekers, F., Giulietti, A. P., Michalaki, M., Coopmans, W., Van Herck, E., Mathieu, C., & Van den Berghe, G. (2003). Metabolic, endocrine, and immune effects of stress hyperglycemia in a rabbit model of prolonged critical illness. Endocrinology, 144(12), 5329-5338.

158
Wiener, R. S., Wiener, D. C., & Larson, R. J. (2008). Benefits and risks of tight glucose control in critically ill adults: a meta-analysis. Jama, 300(8), 933-944.


![[Base Carbone] Documentation Générale v11.0](https://img.dokumen.tips/doc/110x75/56d6bdf31a28ab30168ff8ce/base-carbone-documentation-generale-v110.jpg)