Embed Size (px)
Citation preview
Why tight glycaemic control may notbe appropriate in hospital settings
D Mesotten MD, PhDKatholieke Universiteit Leuven
Department of Intensive Care MedicineUniversity Hospitals Leuven
Belgium
FDA public MeetingBlood Glucose Meters
16-17 March 2010
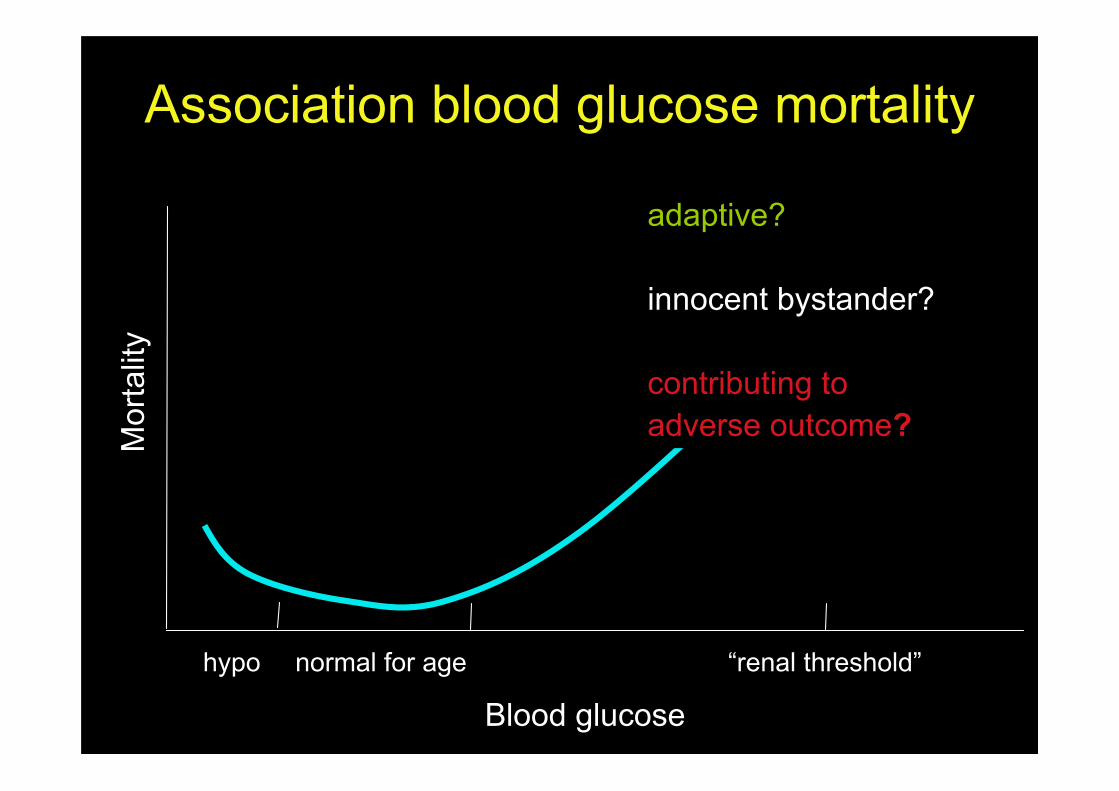
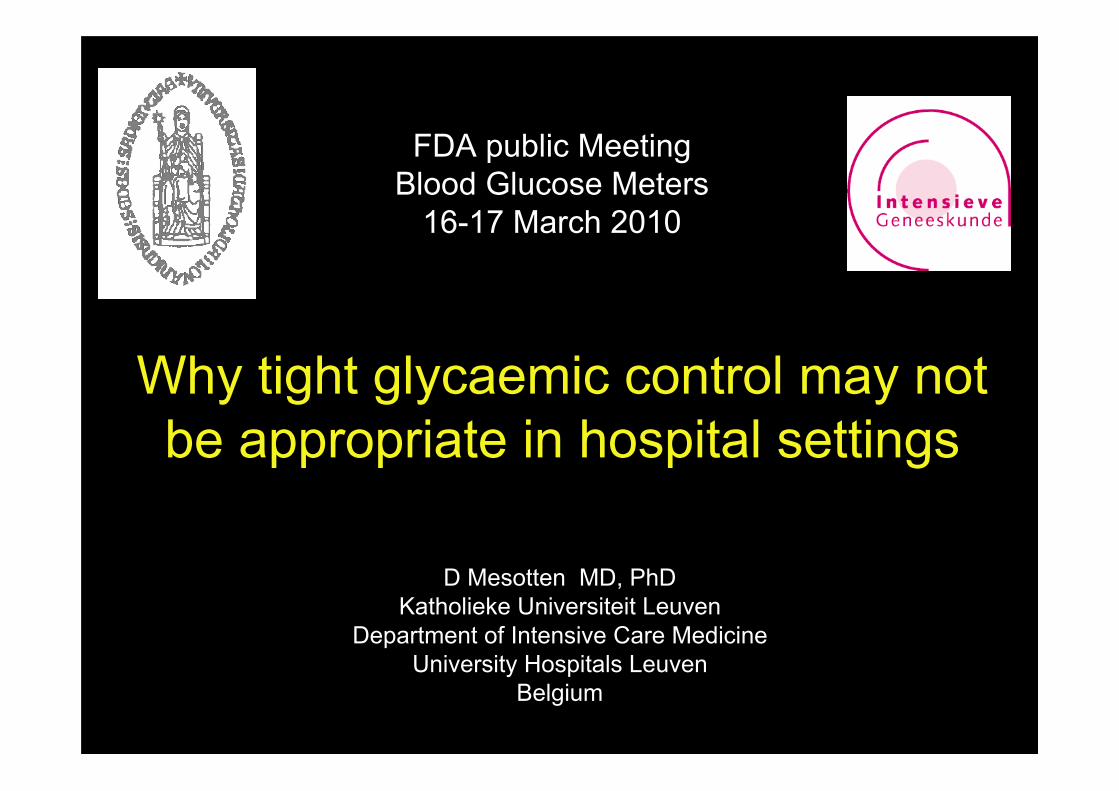
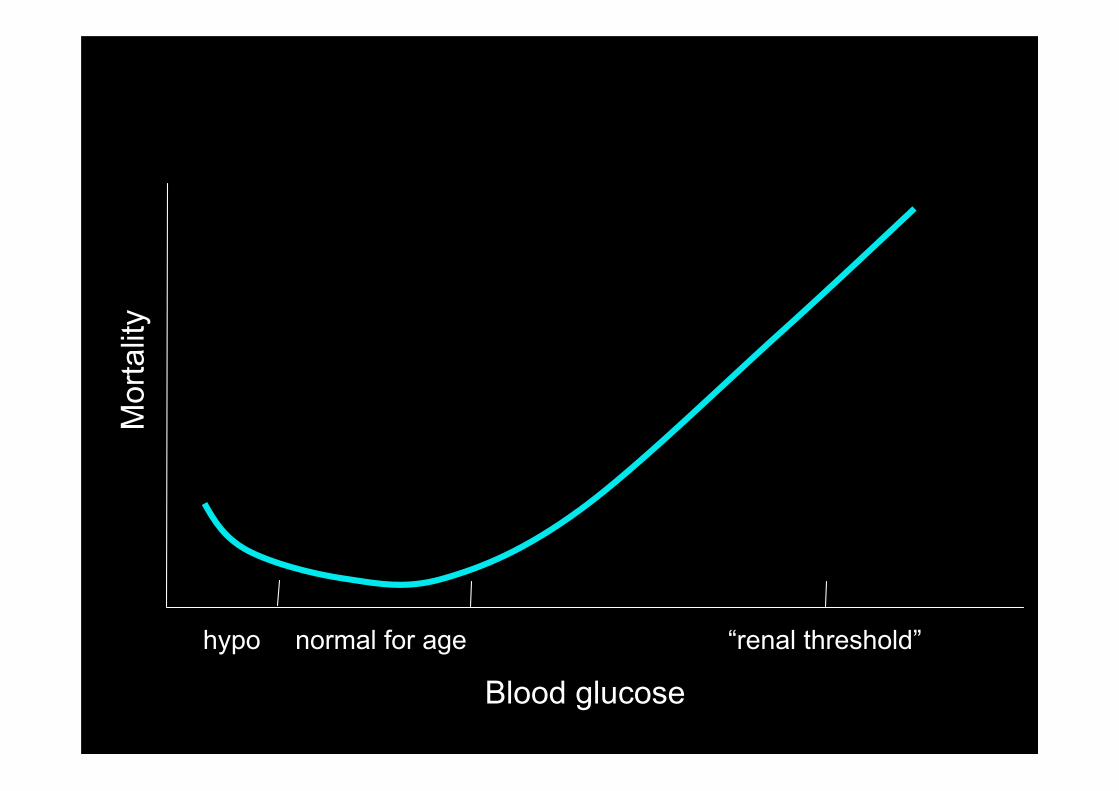
Blood glucose
Mor
talit
y
hypo normal for age “renal threshold”
adaptive?
innocent bystander?
contributing toadverse outcome?
Association blood glucose mortality
The Leuven hypothesis
TGC
Blood glucose
Mor
talit
y
hypo normal for age “renal threshold”
“Hyperglycaemia is not adaptive”“Don’t Touch”

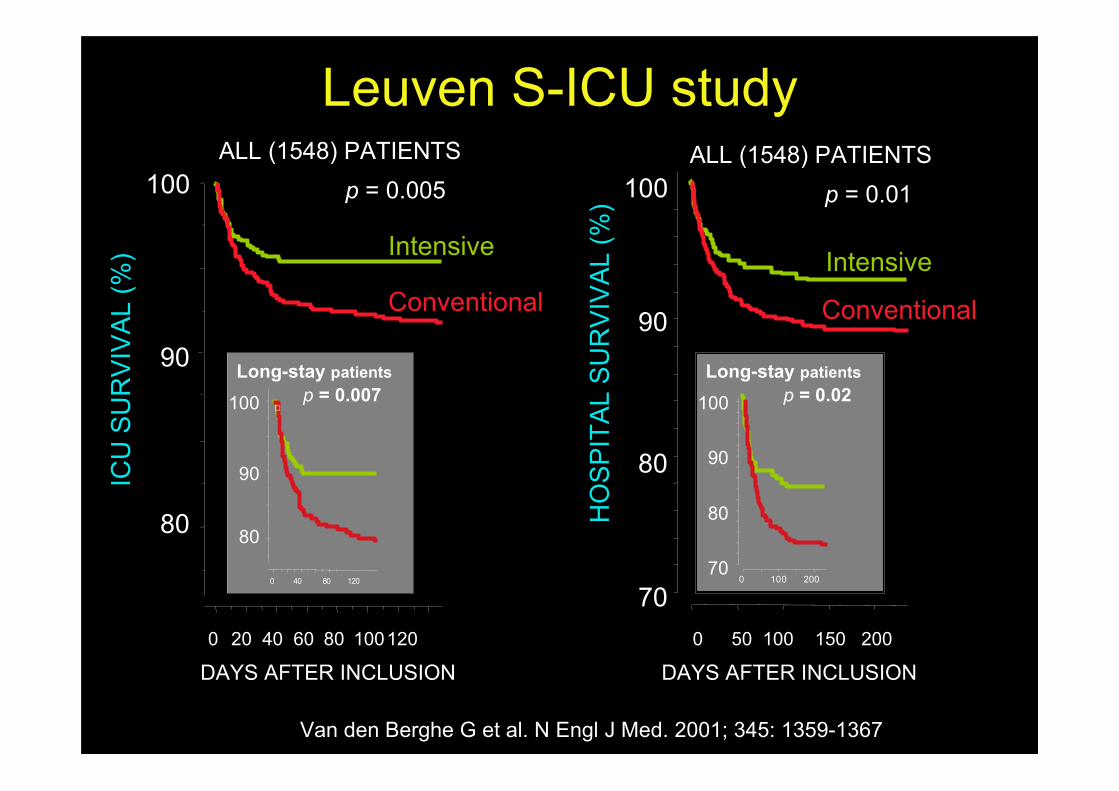
• Prospective randomized single centre trial in surgicalICU patients
• N=1548 mechanically ventilated / 12 months• TGC = insulin infusion for BGL 80-110mg/dL (4.4-
6.1mmol/L)• Conventional = only insulin when BGL >215mg/dL
(>12 mmol/L) and stopped when <180mg/dL (<10mmol/L) (“do not touch”)
• ICU mortality: 8.0% 4.6%• Glycaemia <40 mg/dL: 0.8% 5.1%
Leuven S-ICU study
Leuven S-ICU studyIC
U S
UR
VIV
AL
(%)
80
90
100ALL (1548) PATIENTS
p = 0.005
DAYS AFTER INCLUSION0 20 40 60 80 100120
Intensive
Conventional
Van den Berghe G et al. N Engl J Med. 2001; 345: 1359-1367
HO
SP
ITA
L S
UR
VIV
AL
(%)
80
90
100
70
p = 0.01
100
0 40 80 120
Long-stay patientsp = 0.007
90
80
0 100 200
Long-stay patientsp = 0.02100
90
80
70
DAYS AFTER INCLUSION0 50 100 150 200
Intensive
Conventional
ALL (1548) PATIENTS
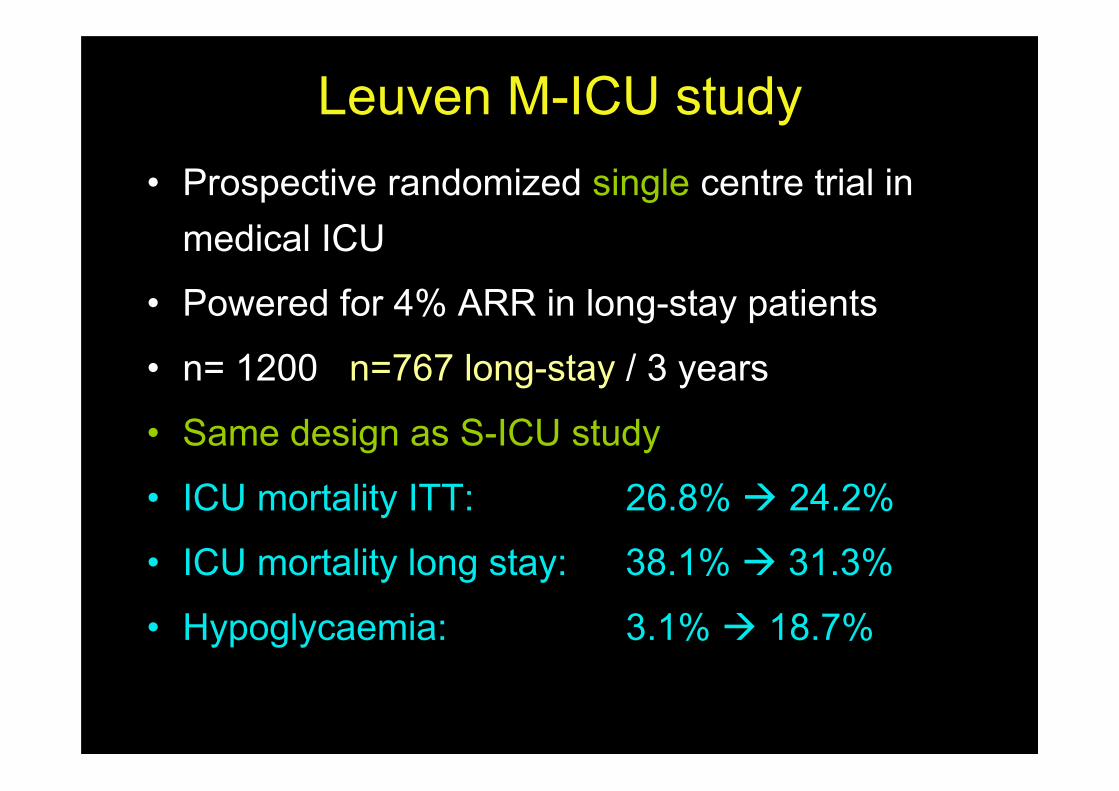
• Prospective randomized single centre trial inmedical ICU
• Powered for 4% ARR in long-stay patients
• n= 1200 n=767 long-stay / 3 years
• Same design as S-ICU study
• ICU mortality ITT: 26.8% 24.2%
• ICU mortality long stay: 38.1% 31.3%
• Hypoglycaemia: 3.1% 18.7%
Leuven M-ICU study
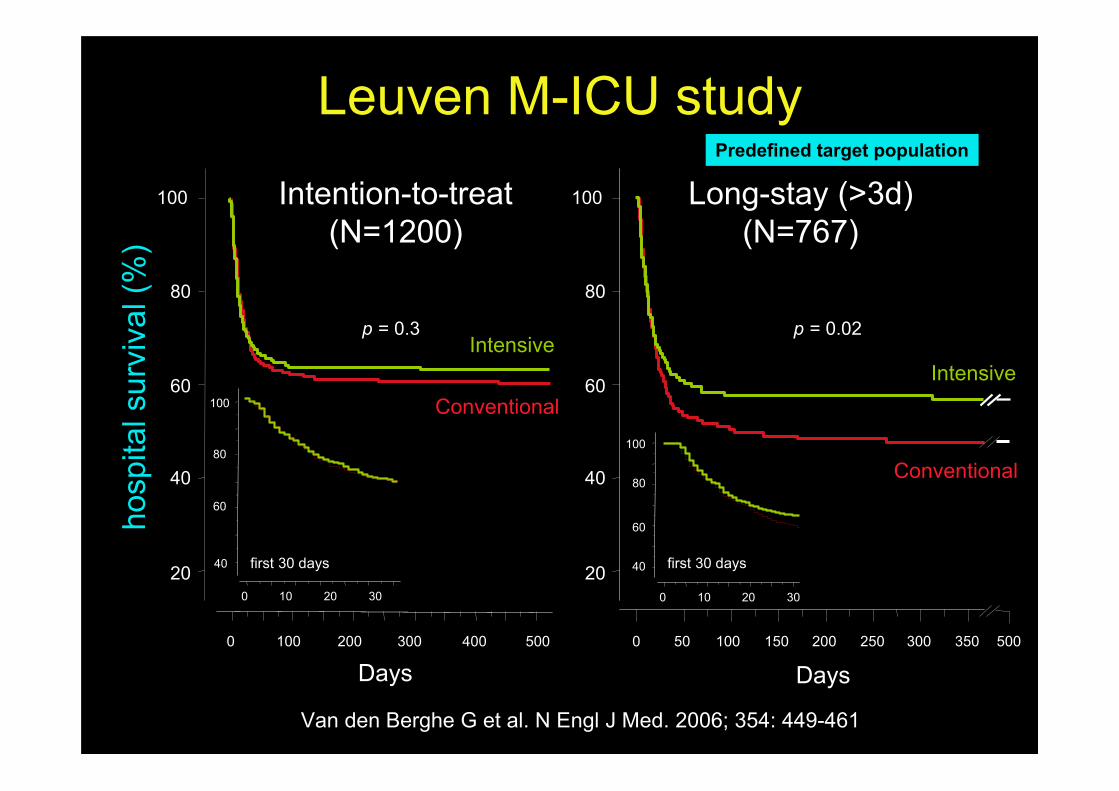
Leuven M-ICU study
.
20
40
60
80
100
hosp
ital s
urvi
val (
%)
0 100 200 300 500400
0 10 20 30
40
60
80
100
Days
first 30 days
p = 0.3
Intention-to-treat(N=1200)
Intensive
Conventional
40
60
80
100
0 10 20 30
first 30 days
0 100 200 300
Days50 150 250 350
20
40
60
80
100
p = 0.02
Intensive
Conventional
500
Long-stay (>3d)(N=767)
Predefined target population
Van den Berghe G et al. N Engl J Med. 2006; 354: 449-461
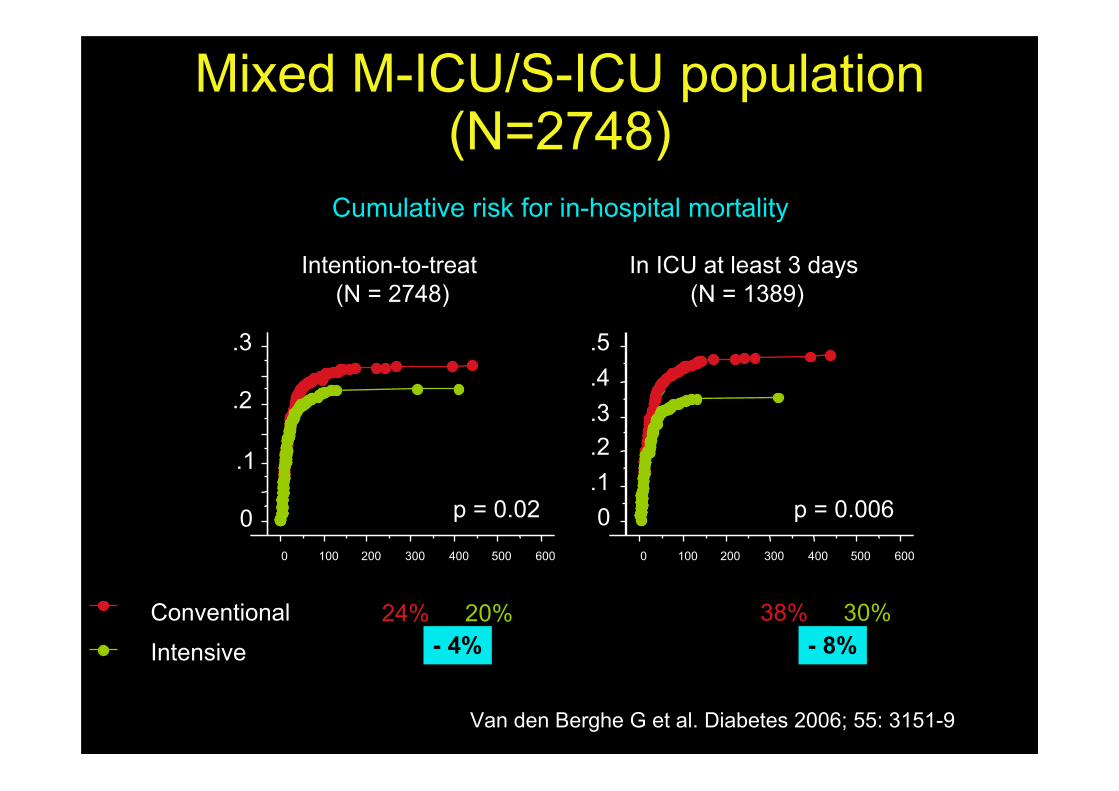
Mixed M-ICU/S-ICU population(N=2748)
Van den Berghe G et al. Diabetes 2006; 55: 3151-9
0.1.2.3.4.5
0 100 200 300 400 500 600
p = 0.006
In ICU at least 3 days (N = 1389)
Cumulative risk for in-hospital mortality
Hosp mort 38% -> 30%Intensive
Conventional
0
.1
.2
.3
0 100 200 300 400 500 600
p = 0.02
Intention-to-treat (N = 2748)
24% -> 20%- 4% - 8%
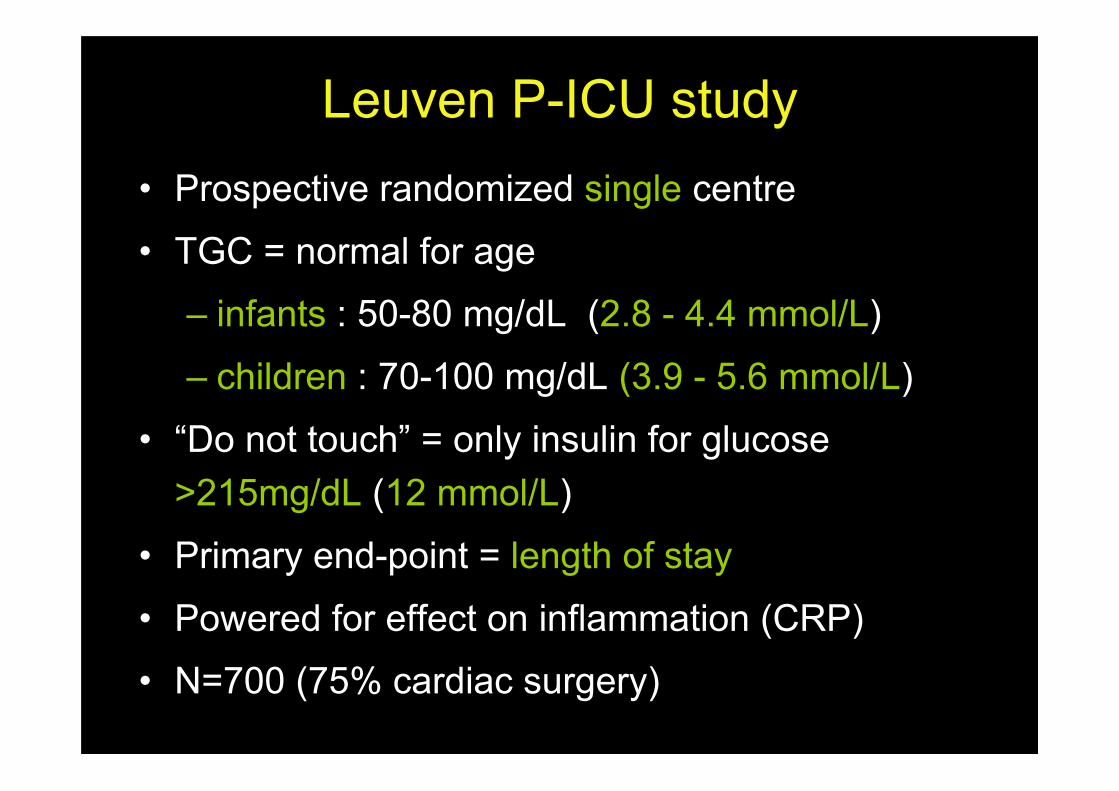
Leuven P-ICU study• Prospective randomized single centre
• TGC = normal for age
– infants : 50-80 mg/dL (2.8 - 4.4 mmol/L)
– children : 70-100 mg/dL (3.9 - 5.6 mmol/L)
• “Do not touch” = only insulin for glucose>215mg/dL (12 mmol/L)
• Primary end-point = length of stay
• Powered for effect on inflammation (CRP)
• N=700 (75% cardiac surgery)

Leuven P-ICU study
0 20 40 60 80 100
Cumulative incidence of PICU death (%)
1
0
2
3
456
p = 0.038
days after admission
Usual careTGC
N = 700
Vlasselaers et al. Lancet 2009;373: 547-56
5.7%
2.6%
3.1%
Hypoglycaemia 1 25%
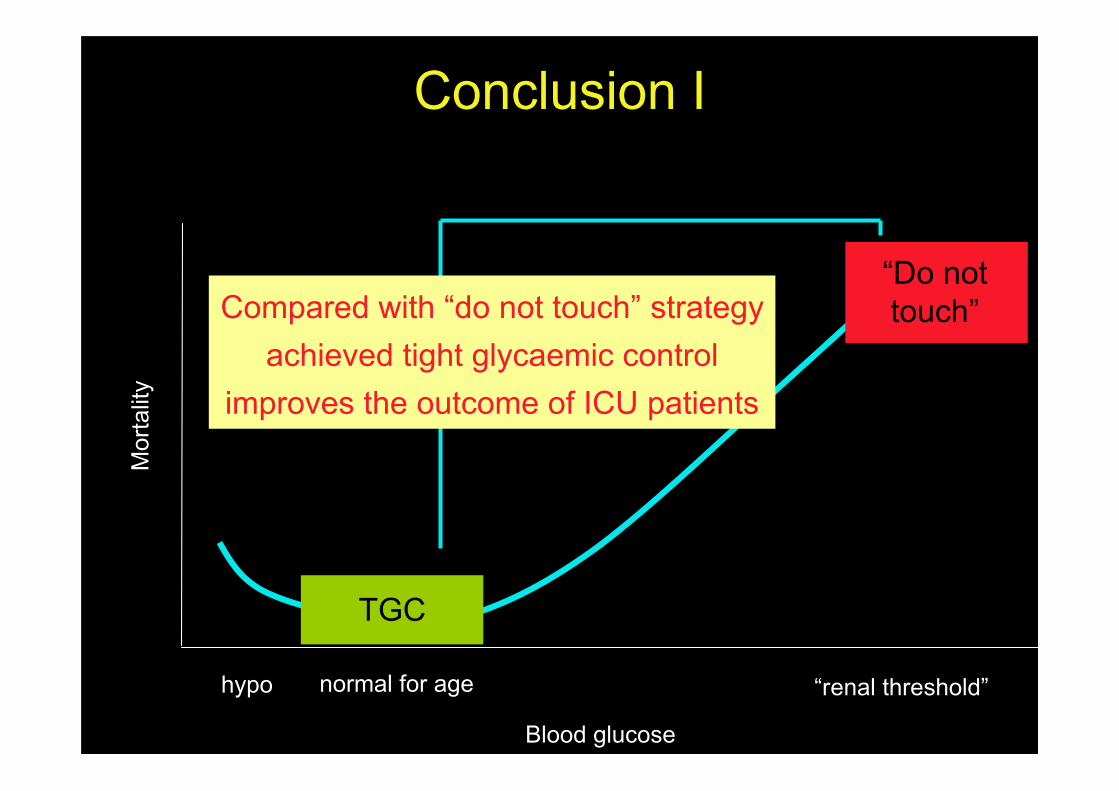
Conclusion I
TGC
Blood glucose
Mor
talit
y
hypo normal for age “renal threshold”
Compared with “do not touch” strategyachieved tight glycaemic control
improves the outcome of ICU patients
“Do nottouch”
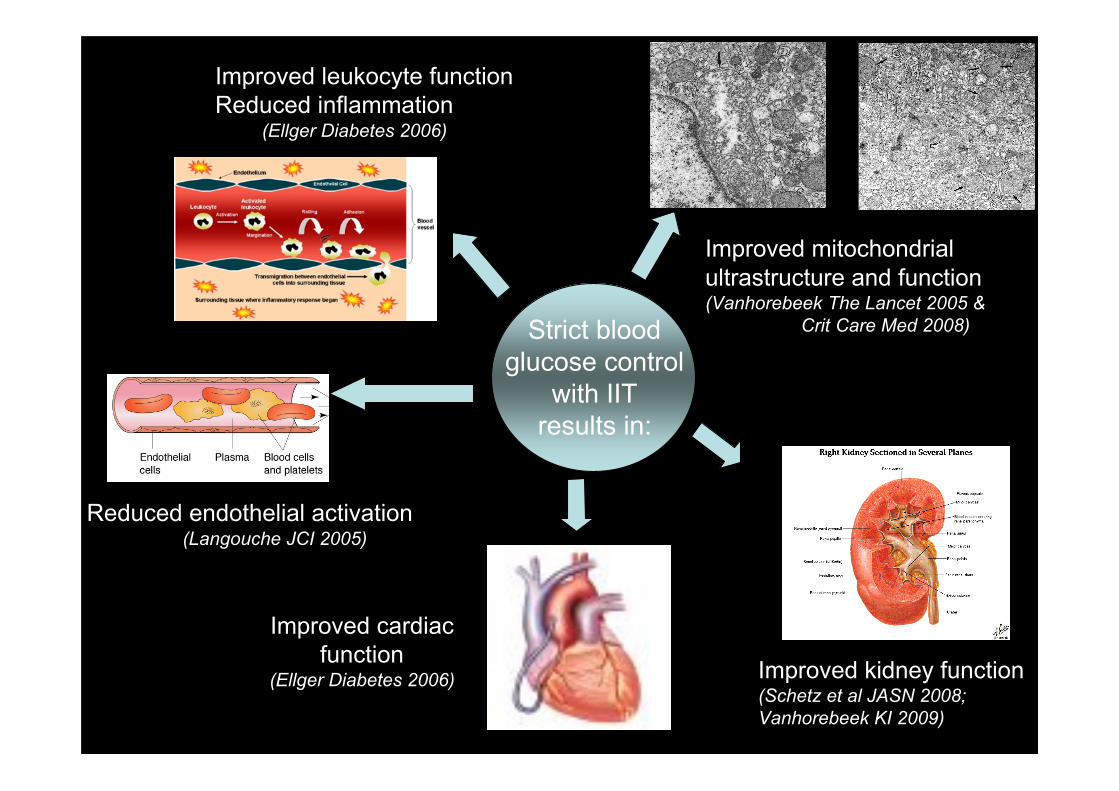
Improved mitochondrialultrastructure and function(Vanhorebeek The Lancet 2005 &
Crit Care Med 2008)Strict bloodglucose control
with IITresults in:
Reduced endothelial activation(Langouche JCI 2005)
Improved leukocyte functionReduced inflammation (Ellger Diabetes 2006)
Improved cardiacfunction
(Ellger Diabetes 2006) Improved kidney function(Schetz et al JASN 2008; Vanhorebeek KI 2009)
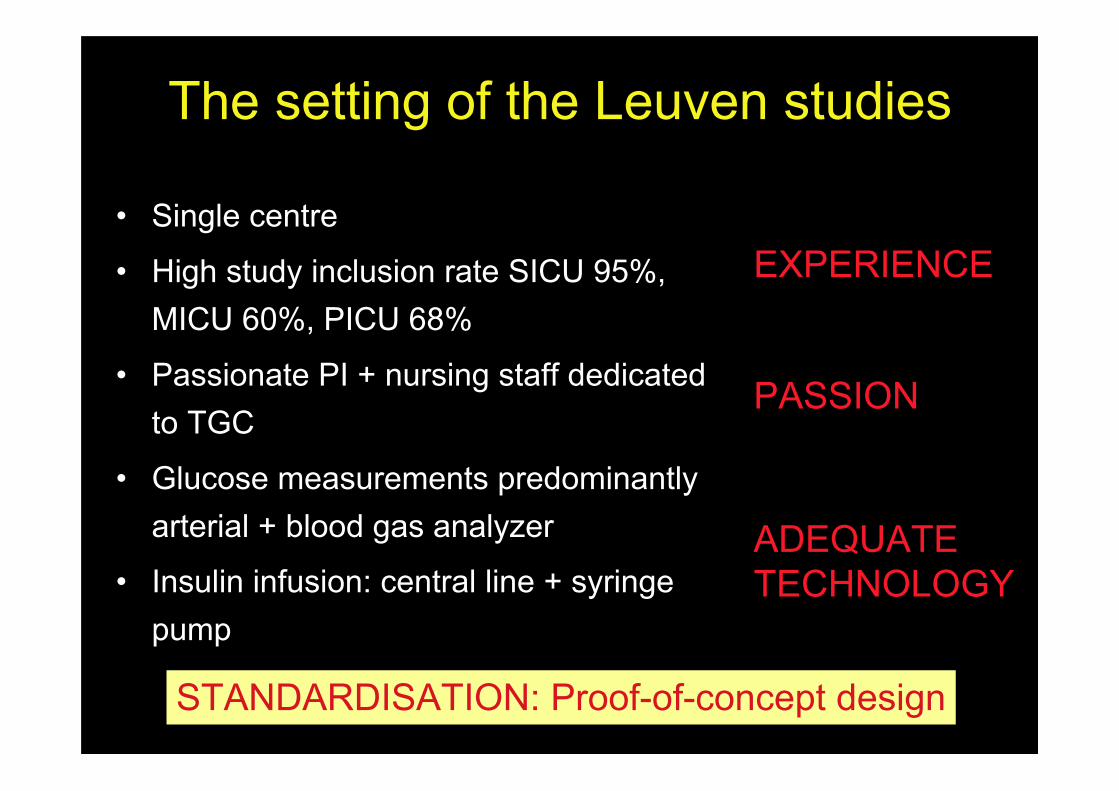
• Single centre
• High study inclusion rate SICU 95%,MICU 60%, PICU 68%
• Passionate PI + nursing staff dedicatedto TGC
• Glucose measurements predominantlyarterial + blood gas analyzer
• Insulin infusion: central line + syringepump
The setting of the Leuven studies
STANDARDISATION: Proof-of-concept design
EXPERIENCE
PASSION
ADEQUATETECHNOLOGY
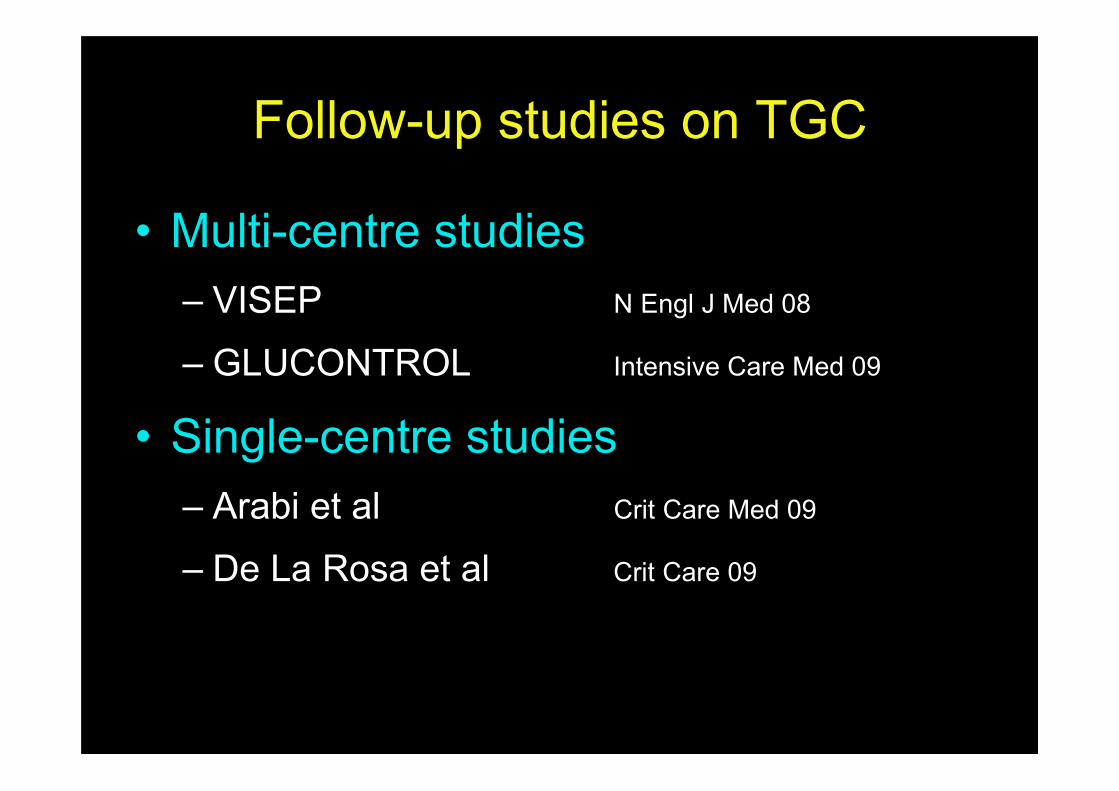
Follow-up studies on TGC
• Multi-centre studies– VISEP N Engl J Med 08
– GLUCONTROL Intensive Care Med 09
• Single-centre studies– Arabi et al Crit Care Med 09
– De La Rosa et al Crit Care 09
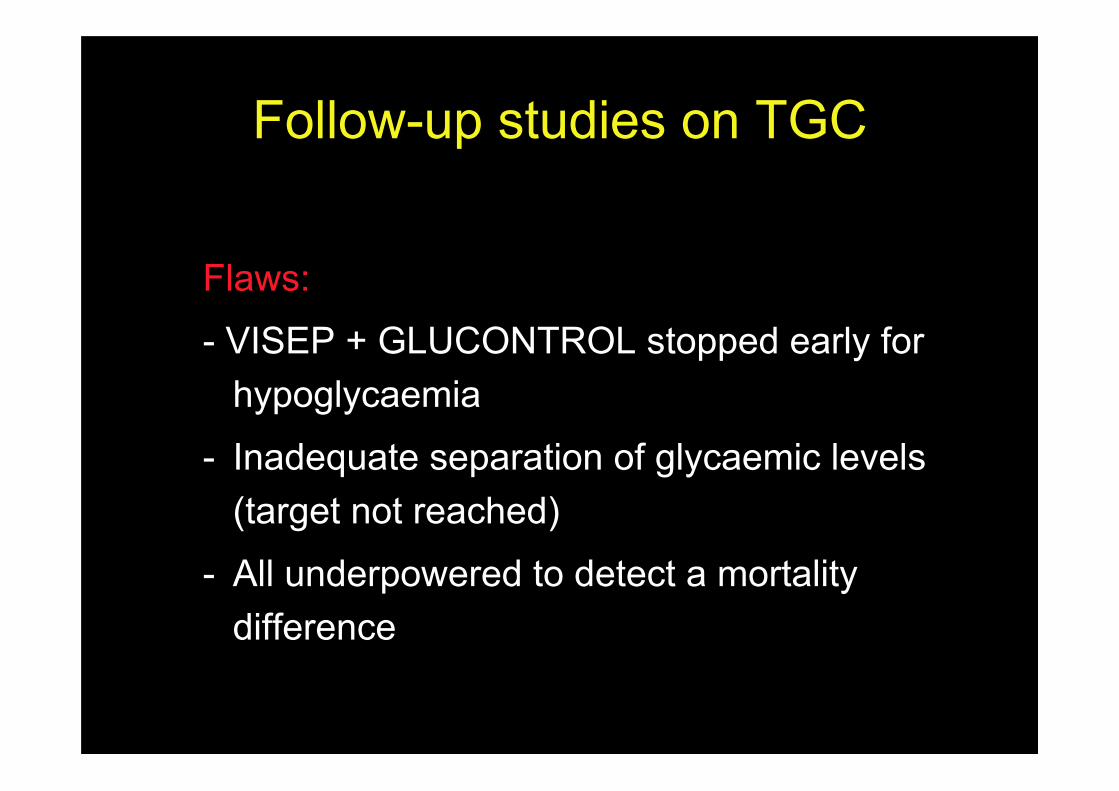
Flaws:
- VISEP + GLUCONTROL stopped early forhypoglycaemia
- Inadequate separation of glycaemic levels(target not reached)
- All underpowered to detect a mortalitydifference
Follow-up studies on TGC
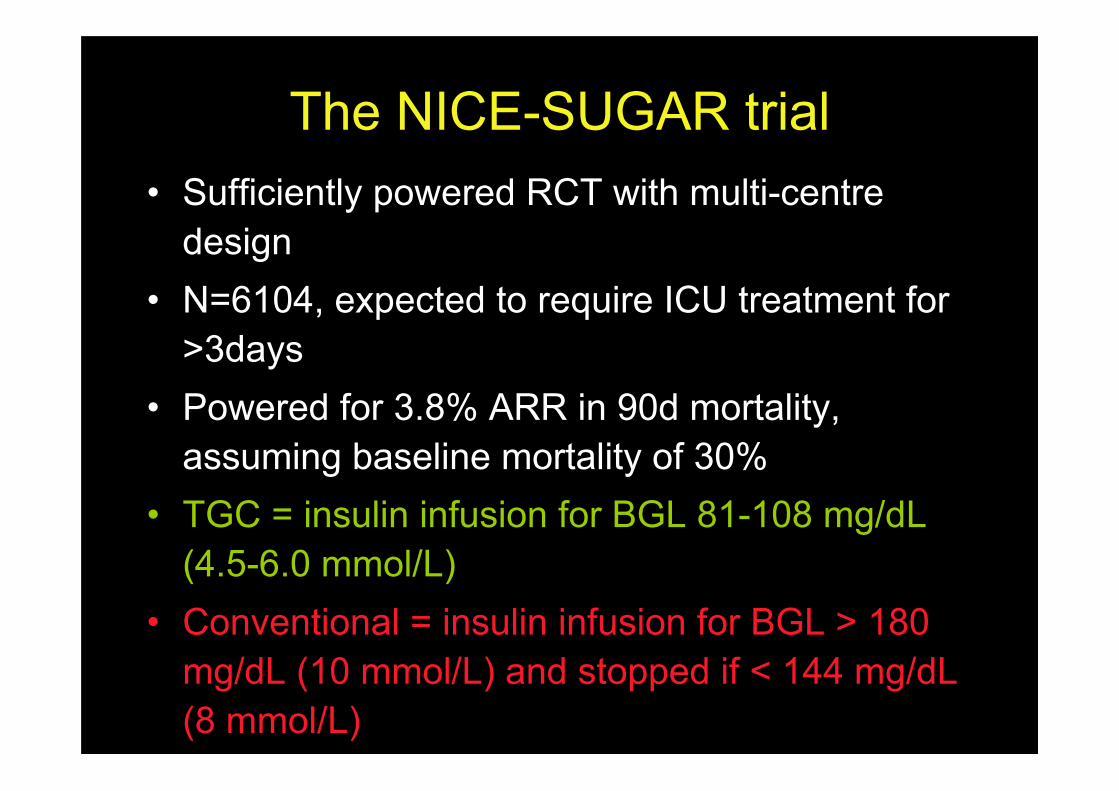
The NICE-SUGAR trial• Sufficiently powered RCT with multi-centre
design• N=6104, expected to require ICU treatment for
>3days• Powered for 3.8% ARR in 90d mortality,
assuming baseline mortality of 30%• TGC = insulin infusion for BGL 81-108 mg/dL
(4.5-6.0 mmol/L)• Conventional = insulin infusion for BGL > 180
mg/dL (10 mmol/L) and stopped if < 144 mg/dL(8 mmol/L)
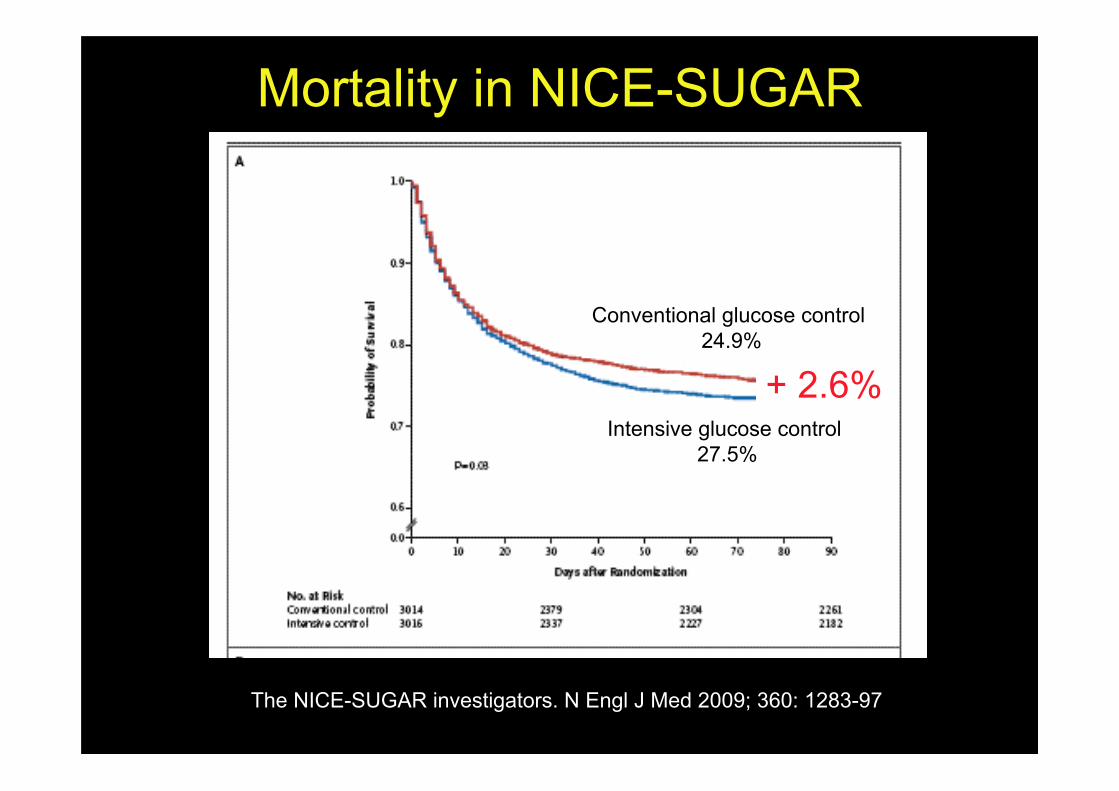
Mortality in NICE-SUGAR
The NICE-SUGAR investigators. N Engl J Med 2009; 360: 1283-97
Conventional glucose control 24.9%
Intensive glucose control 27.5%
+ 2.6%
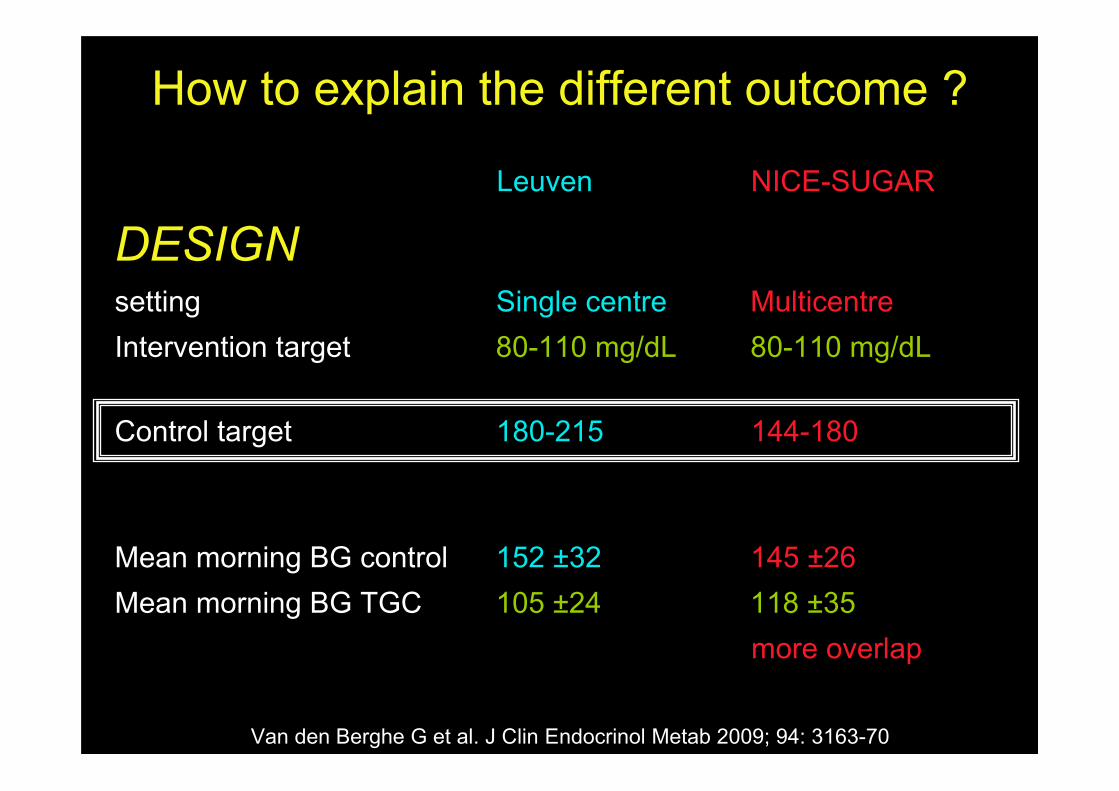
How to explain the different outcome ?
Leuven NICE-SUGAR
DESIGNsetting Single centre MulticentreIntervention target 80-110 mg/dL 80-110 mg/dL
Control target 180-215 144-180
Mean morning BG control 152 ±32 145 ±26Mean morning BG TGC 105 ±24 118 ±35
more overlap
Van den Berghe G et al. J Clin Endocrinol Metab 2009; 94: 3163-70
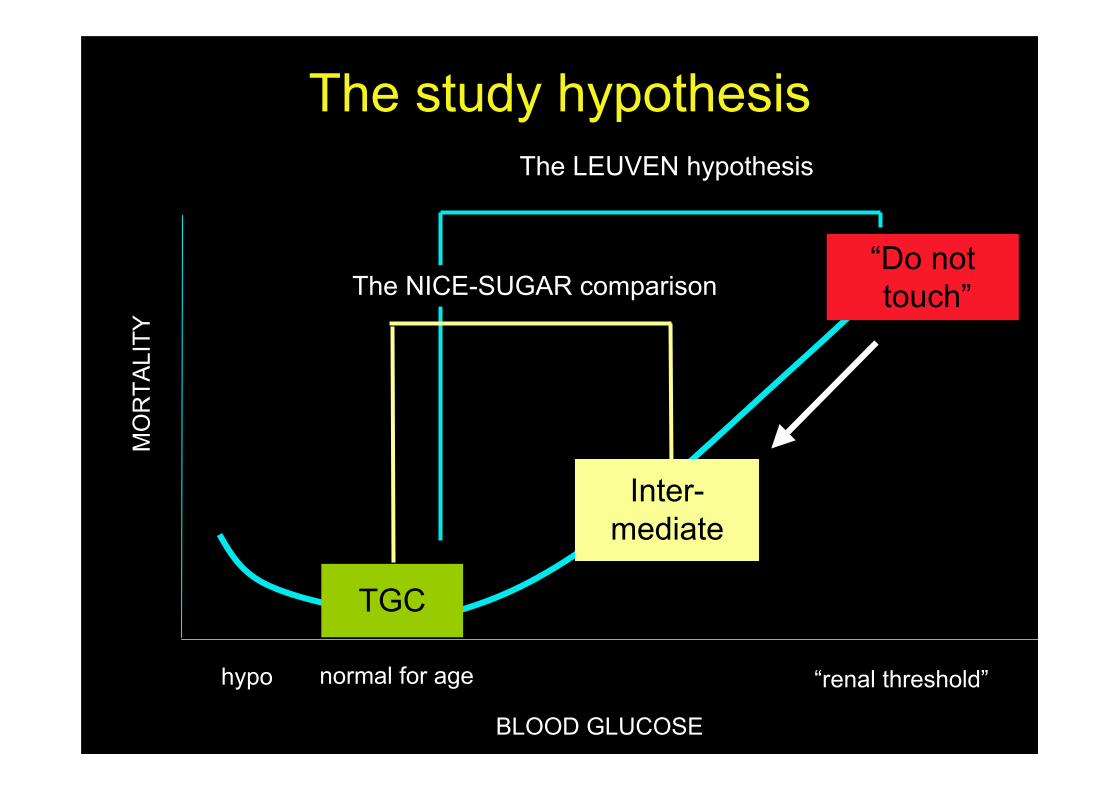
The study hypothesis
BLOOD GLUCOSE
MO
RTA
LITY
hypo normal for age “renal threshold”
The LEUVEN hypothesis
“Do not touch”
TGC
The NICE-SUGAR comparison
Inter-mediate
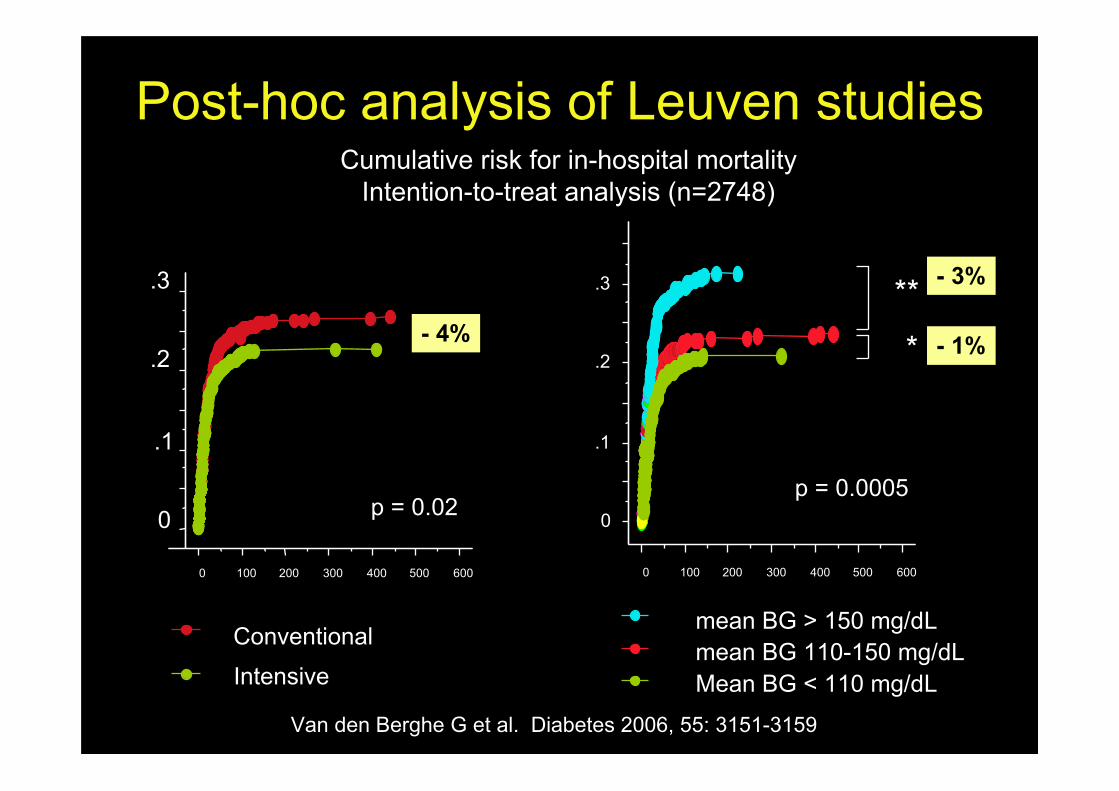
Post-hoc analysis of Leuven studies
Van den Berghe G et al. Diabetes 2006, 55: 3151-3159
Cumulative risk for in-hospital mortalityIntention-to-treat analysis (n=2748)
mean BG > 150 mg/dLmean BG 110-150 mg/dLMean BG < 110 mg/dLIntensive
Conventional
- 4%
0
.1
.2
.3
0 100 200 300 400 500 600
p = 0.02 0
.1
.2
.3
0 100 200 300 400 500 600
p = 0.0005
**
*
- 3%
- 1%
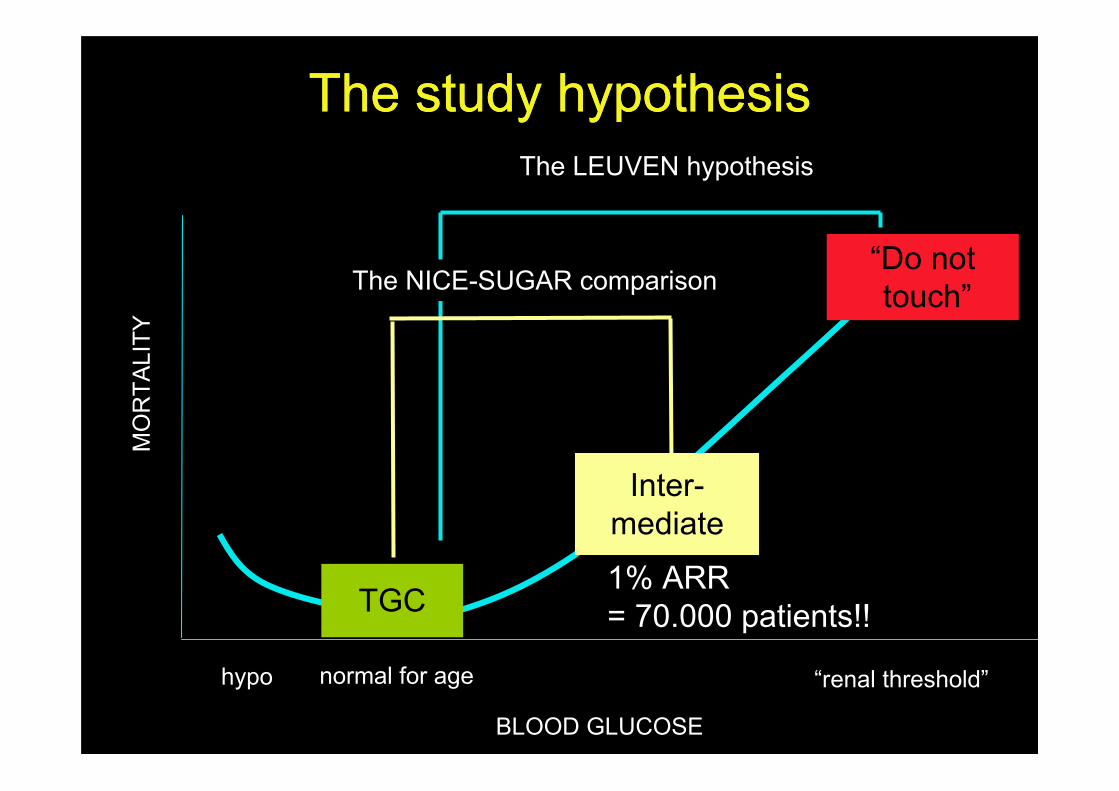
The study hypothesisThe study hypothesis
BLOOD GLUCOSE
MO
RTA
LITY
hypo normal for age “renal threshold”
The LEUVEN hypothesis
“Do not touch”
TGC
The NICE-SUGAR comparison
Inter-mediate
1% ARR= 70.000 patients!!
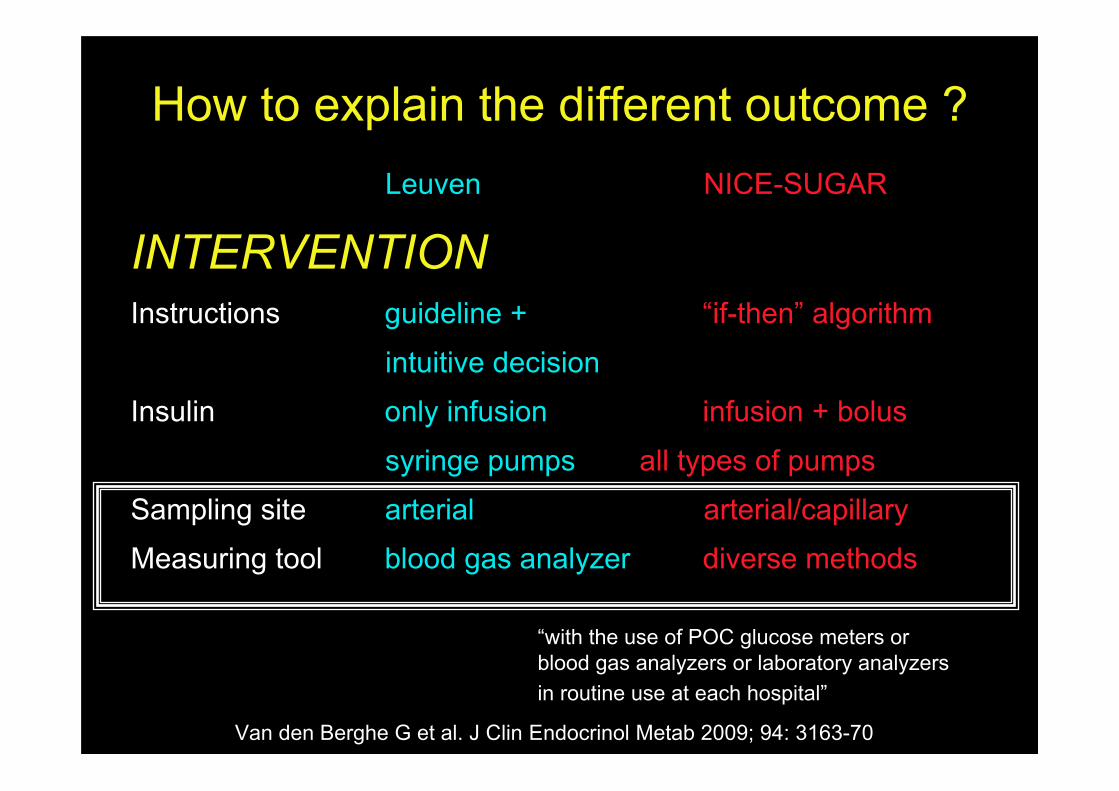
How to explain the different outcome ?Leuven NICE-SUGAR
INTERVENTIONInstructions guideline + “if-then” algorithm
intuitive decision
Insulin only infusion infusion + bolus
syringe pumps all types of pumps
Sampling site arterial arterial/capillary
Measuring tool blood gas analyzer diverse methods
Van den Berghe G et al. J Clin Endocrinol Metab 2009; 94: 3163-70
“with the use of POC glucose meters orblood gas analyzers or laboratory analyzersin routine use at each hospital”.
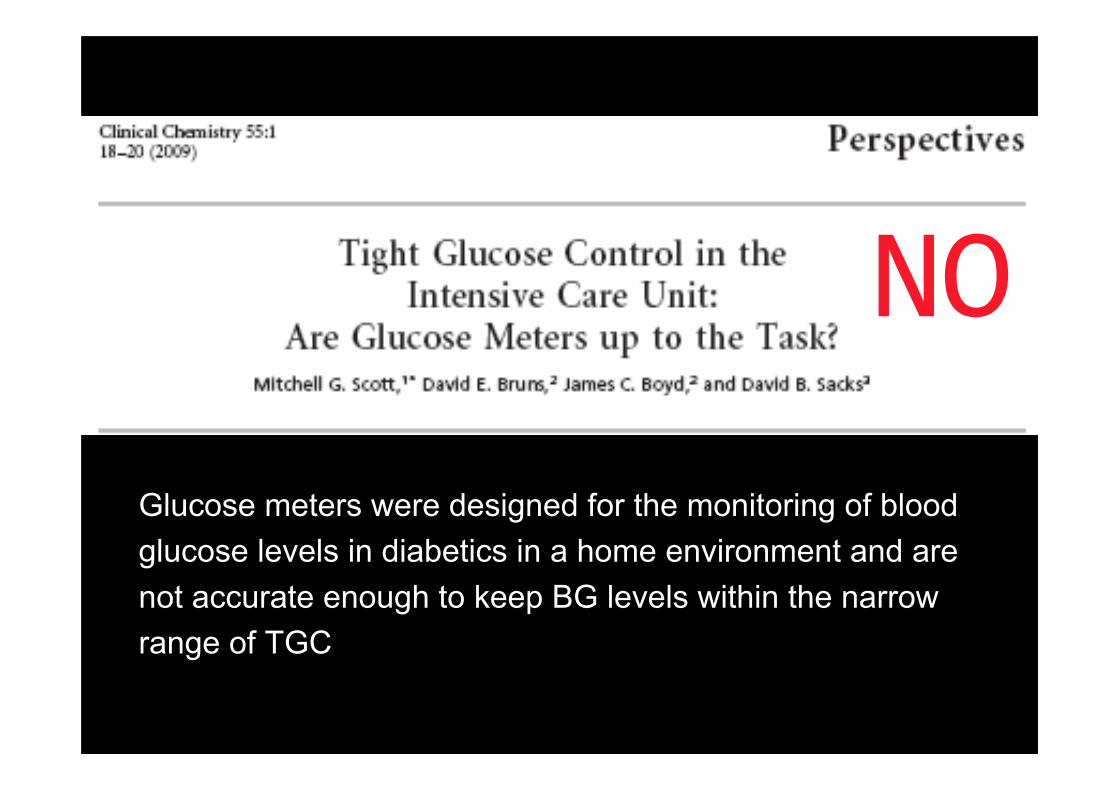
NO
Glucose meters were designed for the monitoring of bloodglucose levels in diabetics in a home environment and arenot accurate enough to keep BG levels within the narrowrange of TGC
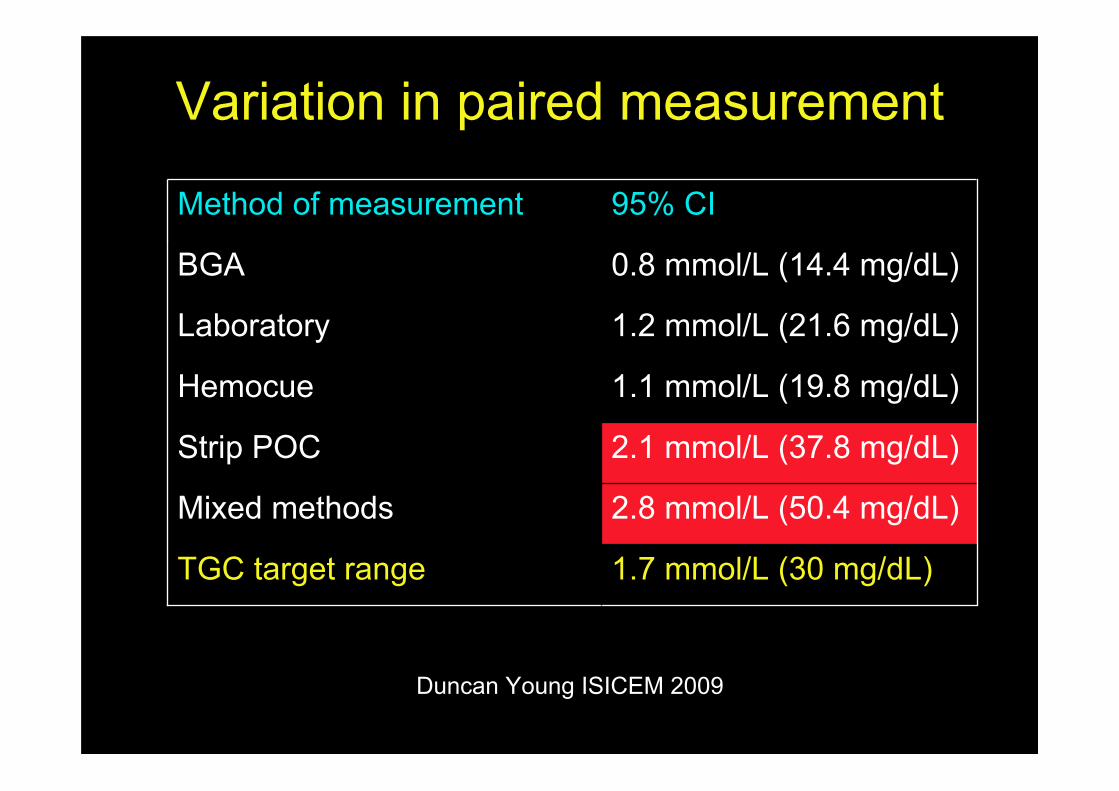
Variation in paired measurement
1.7 mmol/L (30 mg/dL)TGC target range
2.8 mmol/L (50.4 mg/dL)Mixed methods
2.1 mmol/L (37.8 mg/dL)Strip POC
1.1 mmol/L (19.8 mg/dL)Hemocue
1.2 mmol/L (21.6 mg/dL)Laboratory
0.8 mmol/L (14.4 mg/dL)BGA
95% CIMethod of measurement
Duncan Young ISICEM 2009

Blood gas analyzer versus central lab
Kanji et al. Crit Care Med 2005; 33: 2778-2785
1% outsidetargetrange (20% error)
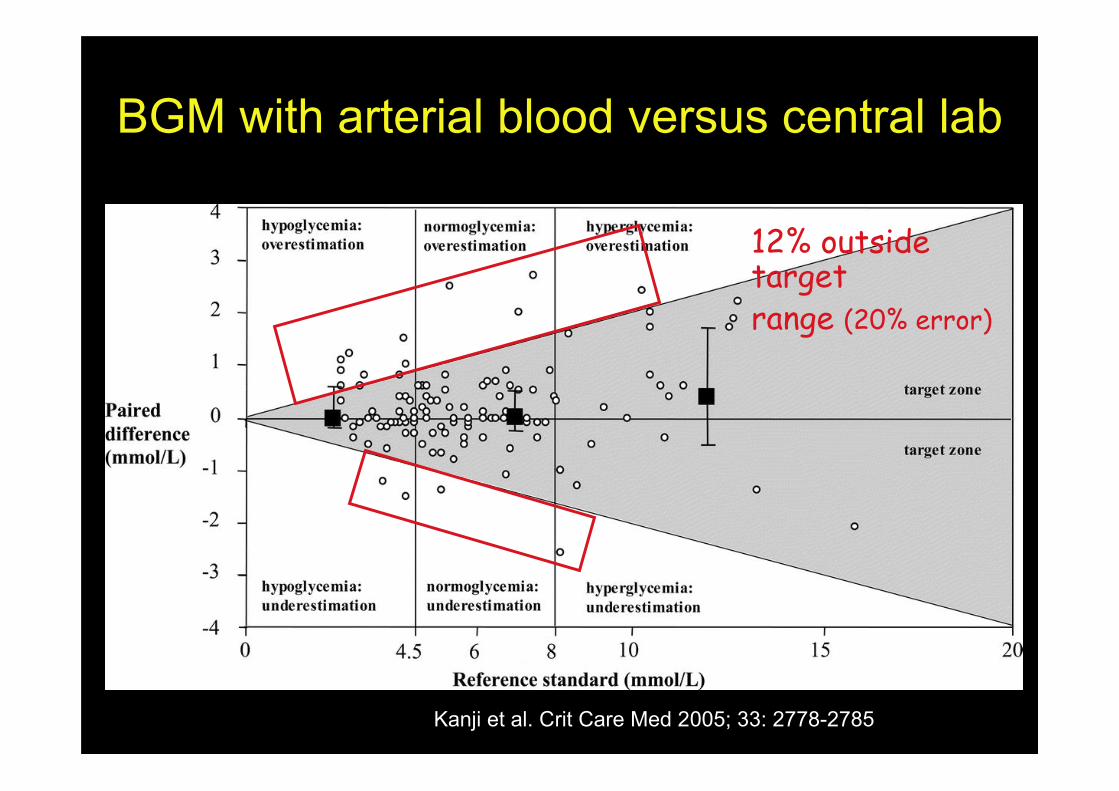
BGM with arterial blood versus central lab
Kanji et al. Crit Care Med 2005; 33: 2778-2785
12% outsidetargetrange (20% error)

BGM with capillary blood versus central lab
Kanji et al. Crit Care Med 2005; 33: 2778-2785
27% outsidetargetrange (20% error)
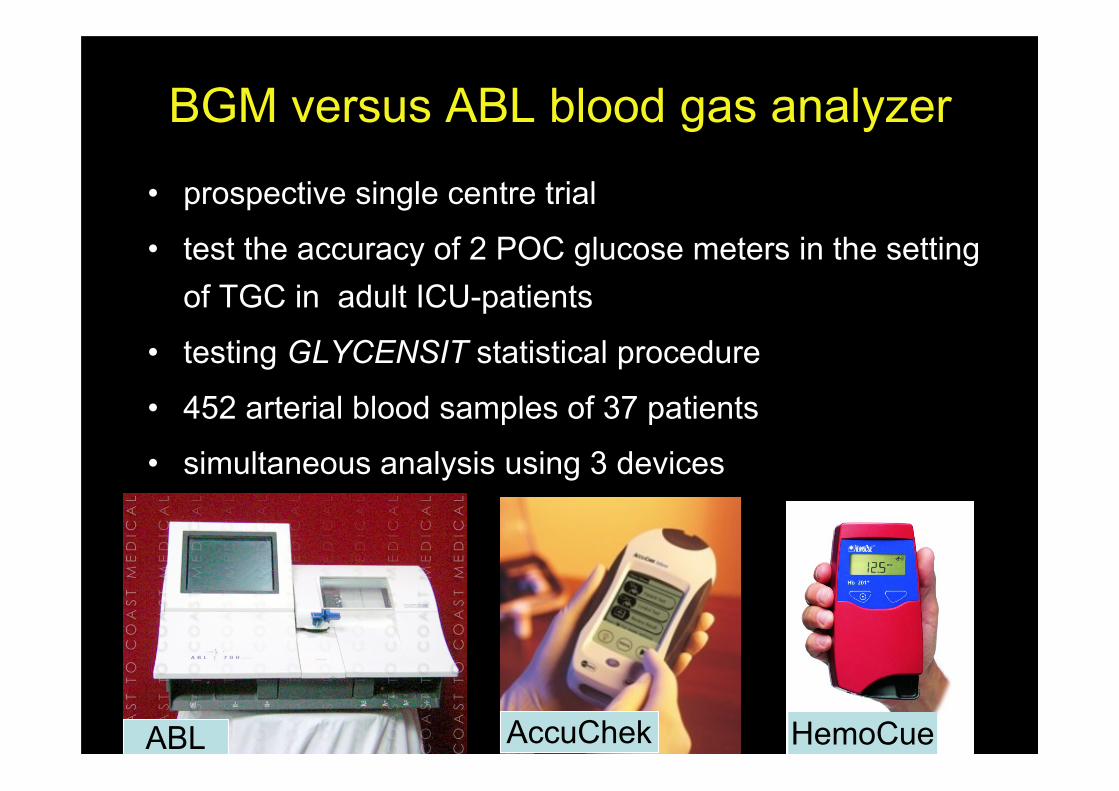
BGM versus ABL blood gas analyzer
• prospective single centre trial
• test the accuracy of 2 POC glucose meters in the settingof TGC in adult ICU-patients
• testing GLYCENSIT statistical procedure
• 452 arterial blood samples of 37 patients
• simultaneous analysis using 3 devices
ABL AccuChek HemoCue

0 50 100 150 200 250 300
350
300
250
200
150
100
50
0
ABL
Accu
Ch
eck
0 50 100 150 200 250 300
350
300
250
200
150
100
50
0
ABLH
em
ocu
e
r = 0.967(CI 0.961-0.973) (p<0.0001)r = 0.983(CI 0.980-0.988) (p<0.0001)
Correlation with ABL blood gas analyzer
AccuChek HemoCue
Vlasselaers D et. al J Diabetes Sci Technol 2008; 2: 932-938
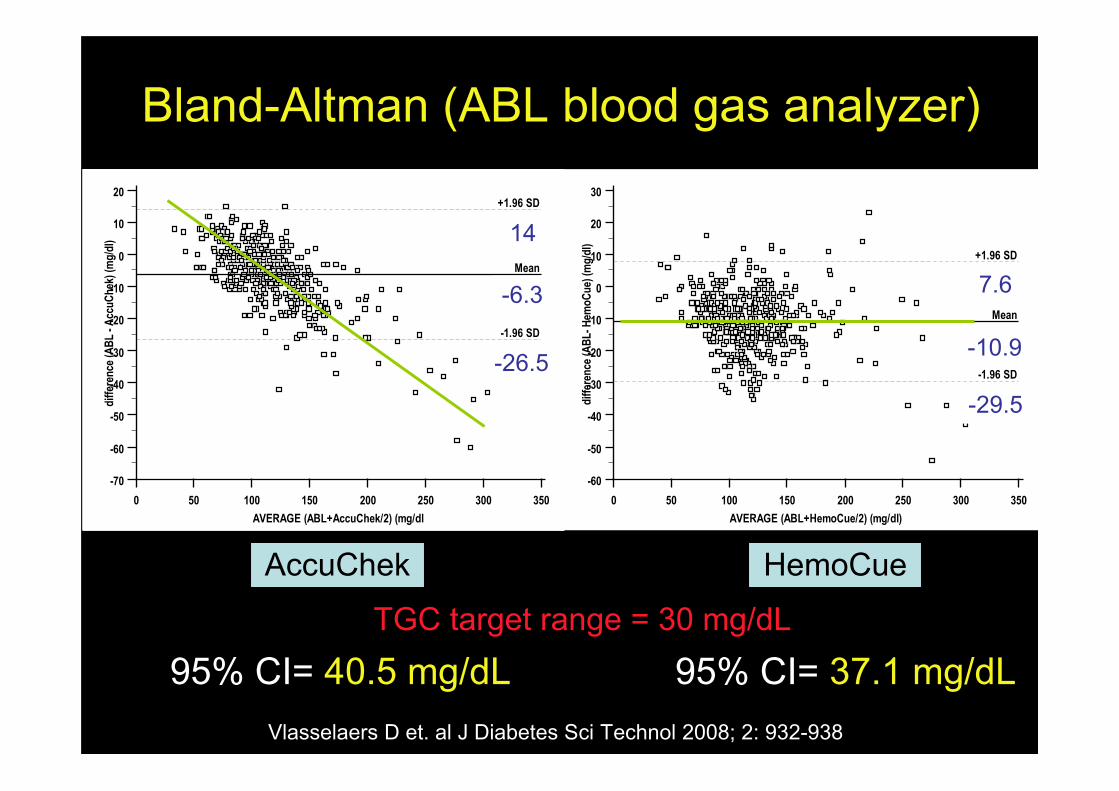
Bland-Altman (ABL blood gas analyzer)
0 50 100 150 200 250 300 350
20
10
0
-10
-20
-30
-40
-50
-60
-70
AVERAGE (ABL+AccuChek/2) (mg/dl
dif
fere
nce
(A
BL
- A
ccu
Ch
ek)
(mg
/dl)
Mean
-6,3
-1.96 SD
-26,5
+1.96 SD
14,0
0 50 100 150 200 250 300 350
30
20
10
0
-10
-20
-30
-40
-50
-60
AVERAGE (ABL+HemoCue/2) (mg/dl)
dif
fere
nce
(A
BL
- H
emo
Cu
e) (
mg
/dl)
Mean
-10,9
-1.96 SD
-29,5
+1.96 SD
7,6
AccuChek HemoCue
14
-6.3
-26.5
7.6
-10.9
-29.5
95% CI= 40.5 mg/dL 95% CI= 37.1 mg/dL Vlasselaers D et. al J Diabetes Sci Technol 2008; 2: 932-938
TGC target range = 30 mg/dL

Hoedemaekers C et. al Crit Care Med 2008; 36: 3062-3066
BGM versus RapidLab blood gas analyzer28.8
-32.4
16.9
-22.3
61.2 mg/dL 39.2 mg/dL
TGC target range30 mg/dL
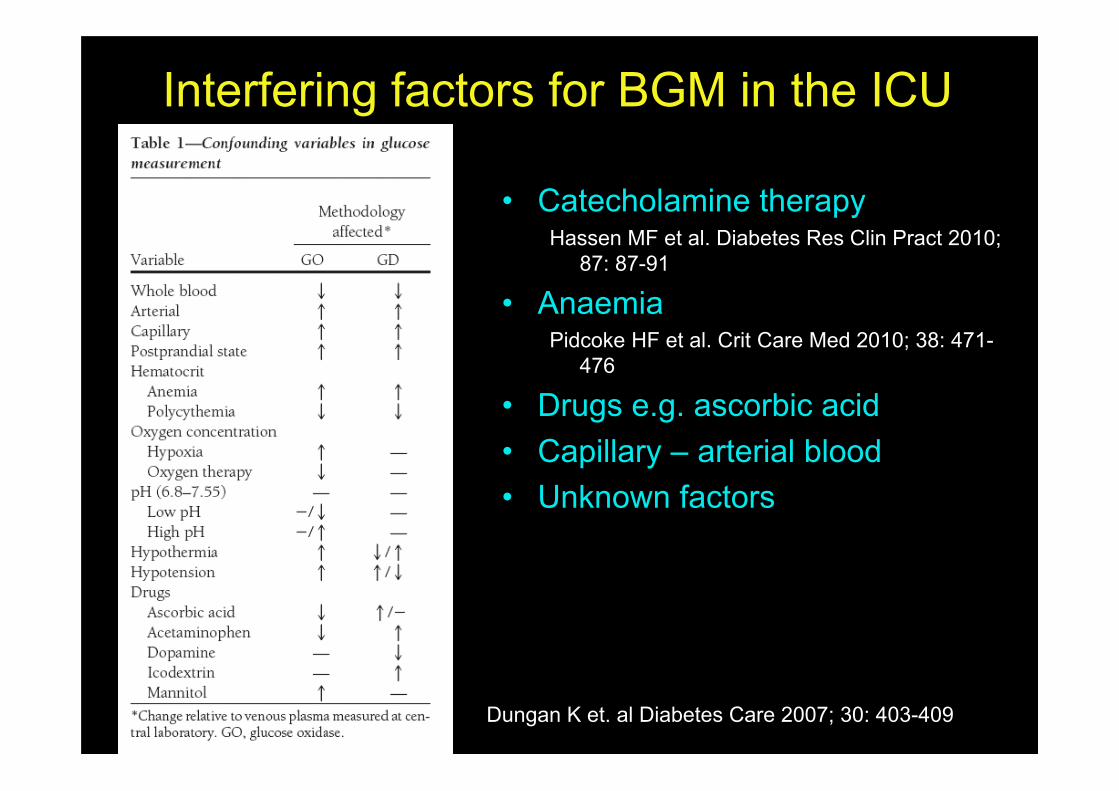
• Catecholamine therapyHassen MF et al. Diabetes Res Clin Pract 2010;
87: 87-91
• AnaemiaPidcoke HF et al. Crit Care Med 2010; 38: 471-
476
• Drugs e.g. ascorbic acid• Capillary – arterial blood• Unknown factors
Interfering factors for BGM in the ICU
Dungan K et. al Diabetes Care 2007; 30: 403-409
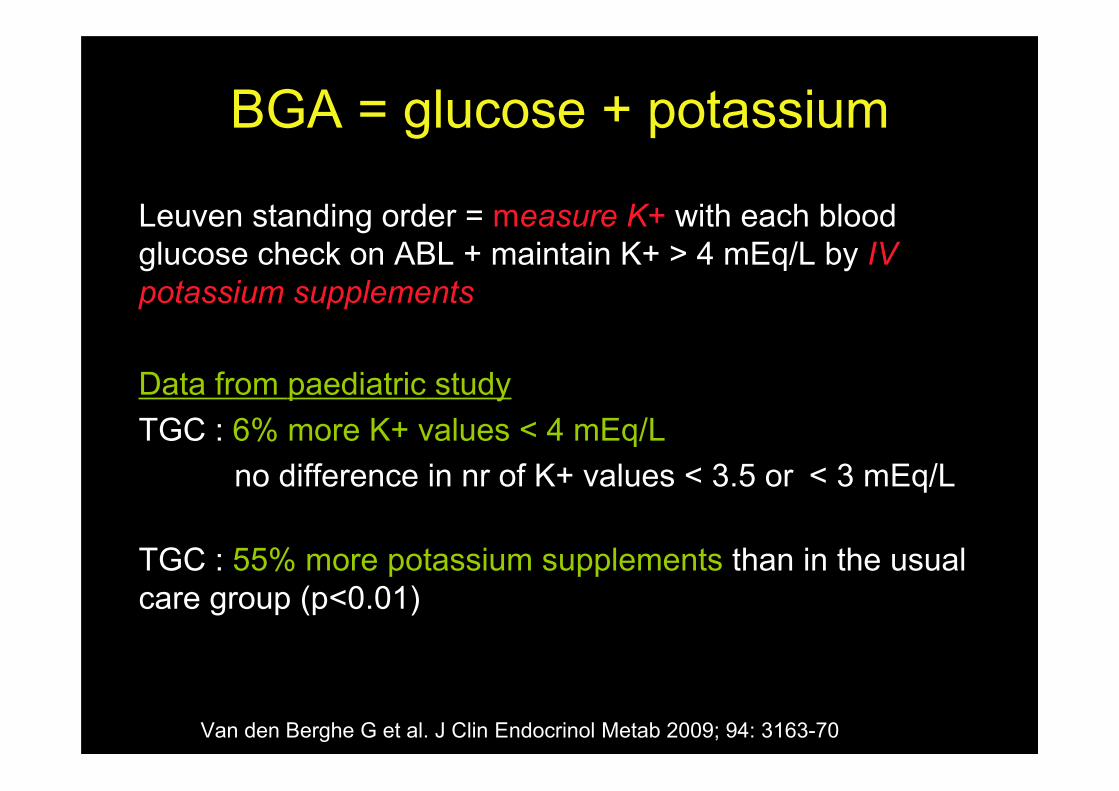
Leuven standing order = measure K+ with each bloodglucose check on ABL + maintain K+ > 4 mEq/L by IVpotassium supplements
Data from paediatric studyTGC : 6% more K+ values < 4 mEq/L
no difference in nr of K+ values < 3.5 or < 3 mEq/L
TGC : 55% more potassium supplements than in the usualcare group (p<0.01)
BGA = glucose + potassium
Van den Berghe G et al. J Clin Endocrinol Metab 2009; 94: 3163-70
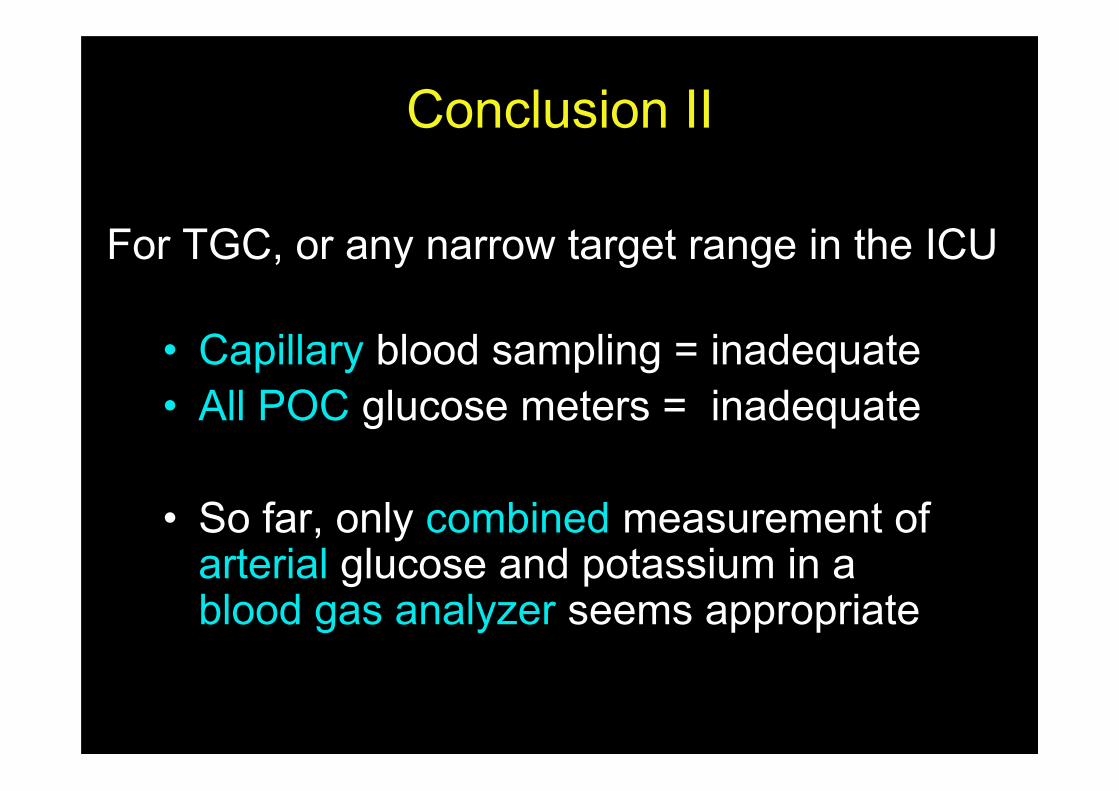
• Capillary blood sampling = inadequate• All POC glucose meters = inadequate
• So far, only combined measurement ofarterial glucose and potassium in ablood gas analyzer seems appropriate
Conclusion II
For TGC, or any narrow target range in the ICU
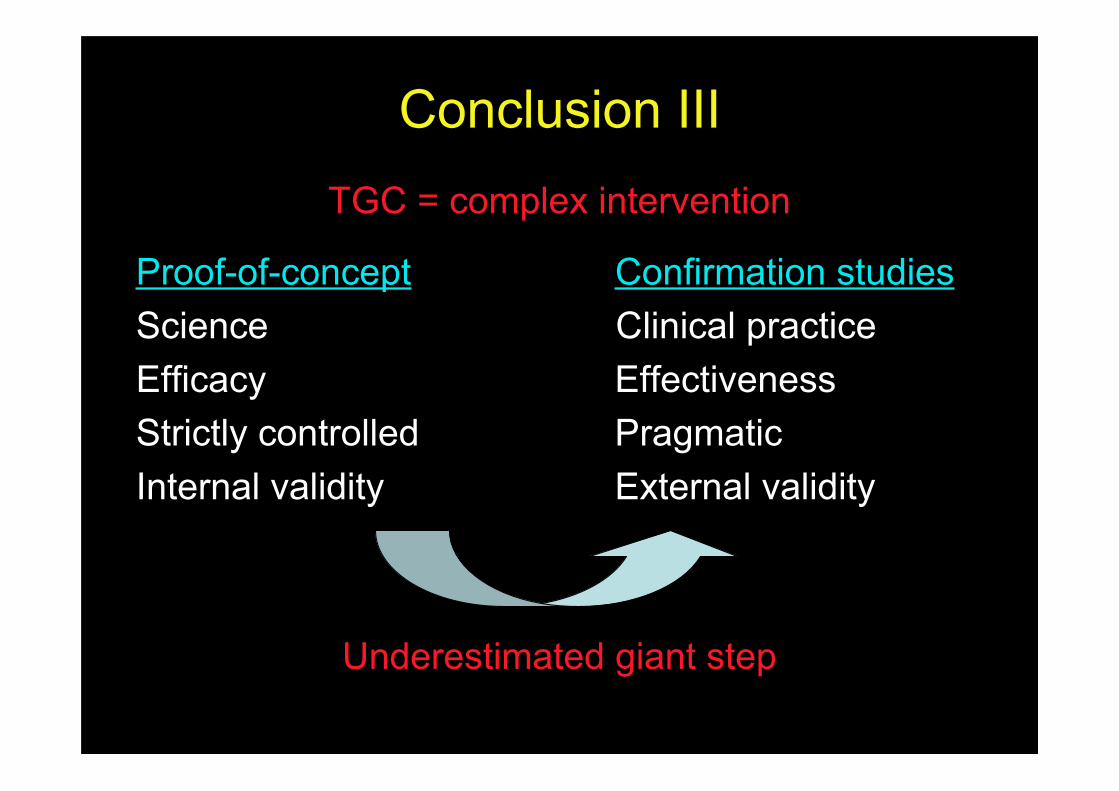
Proof-of-concept Confirmation studiesScience Clinical practiceEfficacy EffectivenessStrictly controlled PragmaticInternal validity External validity
Conclusion IIITGC = complex intervention
Underestimated giant step
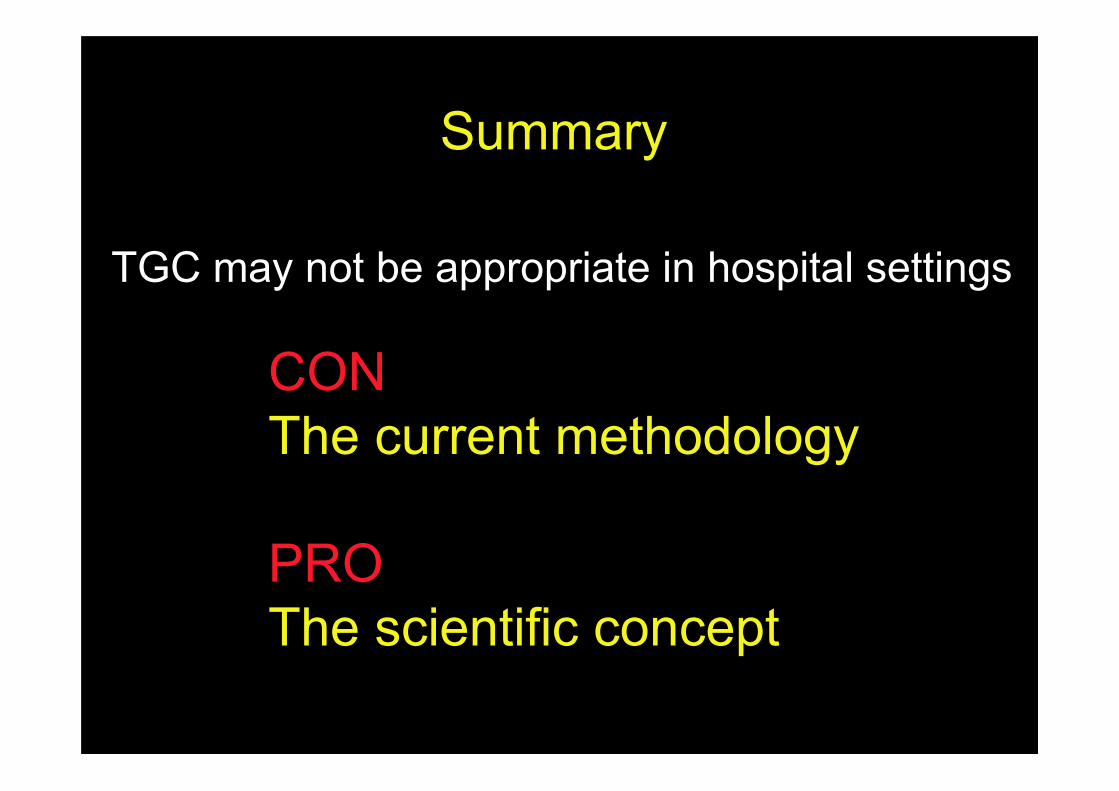
TGC may not be appropriate in hospital settings
Summary
CONThe current methodology
PROThe scientific concept
Blood glucose
Mor
talit
y
hypo normal for age “renal threshold”