Embed Size (px)
Citation preview
Tier 2 Advanced Power Strips:
Examining Energy Savings Potential in a New and Changing Market
Prepared by:
Dr. Katherine Johnson, Johnson Consulting Group and Dr. Jim Bradford, Mesa Point Energy
September 21, 2017

Tier 2 Advanced Power Strips: Examining Energy Savings Potential in a New and Changing Market
Johnson Consulting Group and Mesa Point Energy 2017 1
Abstract While there is no doubt that Advanced Power Strip (APS) devices save energy, the real question is how
much? The purpose of this white paper is to summarize the current thinking regarding the energy savings
possibilities of Tier 2 APS and identify areas for research in this fast-changing and evolving market.
Reliable savings quantification is possible, but to ensure the use of best practices, DSM program design
and Technical Reference Manual (TRM) development must avoid using incomplete and limited research
that does not have wide support in the industry to differentiate between different APS Tier 2 products
and their various implementation and control strategies. Some TRMs have diverted from best practices
by using preliminary and questionable information to differentiate different Tier 2 APS products. Such use
of potentially unreliable information creates an unfair and incorrect view of the available technology and
thus negatively affects the development and implementation of this valuable measure in the market
place. It may also adversely affect the ability of sponsoring organizations, such as investor-owned utilities,
to achieve their long-term energy savings goals by relying on deemed values that may significantly over-
state actual energy savings.
Introduction
The average American is surrounded by a constellation of digital and electronic devices that map out
nearly every aspect of everyday. Using these devices can be so overwhelming that in 2013 the Oxford
Dictionary defined the term digital detox as “a period of time during which a person refrains from using
electronic devices such as smartphones or computers…” –by adding the definition to its online version
(which, ironically, is accessible only via a digital device) (Nielsen 2014, p. 2).
According to the most recent studies available, most U.S. households own four digital devices including
high-definition televisions (HDTVs), Internet-connected computers and smartphones, and they spend an
average of 60 hours a week consuming content across multiple screens. In addition to more devices,
consumers now have more choices for how and when they access content, such as broadband-only
delivery of programming and DVRs for time-shifted viewing (See Figure 1) (Nielsen 2014, p. 3).
The rapid adoption of a second screen has also fundamentally shifted the traditional TV viewing habits.
Consumers now use smartphones and tablets as natural extensions of the programming they watch
(Nielsen 2014, p. 3).
The rapid proliferation of household electronics and digital devices has also led to an increase in plug-load
energy usage or consumption across U.S. homes. Most of the times these appliances stay plugged in, and
are just turned off (but not unplugged) when not in use by a homeowner. Even in an off state, they
continue to draw power, however because they are not unplugged. The power so drawn is called
“phantom, "vampire," or "standby" energy use. Energy consumption from these standby devices can
increase electric usage by as much as 10 percent (ENERGY STAR 2013).
This increase in power usage has created a new market and opportunity for electric utilities to target these
standby-loads (and loads resulting from electronic equipment that is left on) by encouraging customers
to install these devices into Advanced Power Strips (APS). An APS acts as a central power supply for

Tier 2 Advanced Power Strips: Examining Energy Savings Potential in a New and Changing Market
Johnson Consulting Group and Mesa Point Energy 2017 2
clusters of computer, video (TV, DVD, video games, etc.), or audio products such as receivers, amplifiers,
etc., so everything can be switched off with one action - or no action in the case of more advanced units
- when the equipment is not in use (Extension 2015).
APS devices work in several ways to turn off equipment when not in use either through a timer, occupancy
sensor, or current sensing (ENERGY STAR 2013; Extension 2015). Residential APS devices are designed
primarily for home entertainment centers and home office areas where there are typically many
consumer electronics plugged into a power strip, and they work by preventing electronics from drawing
power when they are off or not being used (ENERGY STAR 2013; CalPlug 2014, p. 11).
While there is no doubt that APS devices save energy, the real question is how much? The purpose of this
white paper is to summarize the current thinking regarding the energy savings possibilities of Tier 2 APS
and identify areas for research in this fast-changing and evolving market.

Tier 2 Advanced Power Strips: Examining Energy Savings Potential in a New and Changing Market
Johnson Consulting Group and Mesa Point Energy 2017 3
(Source: Nielsen National People Meter Panel, September 2013)
Figure 1: Media Universe

Tier 2 Advanced Power Strips: Examining Energy Savings Potential in a New and Changing Market
Johnson Consulting Group and Mesa Point Energy 2017 4
Methodology This paper was commissioned to provide an independent review of the current savings estimates for Tier
2 APS devices and provide guidance for future program designers, implementers and evaluators regarding
its energy savings potential.
The findings in this white paper are drawn from two separate research activities:
• A literature review of the most recent studies completed documenting savings from Tier 2 APS
devices; and
• In-depth interviews with the specialists engaged in these studies. To ensure candor and protect
privacy, the actual names of these respondents will remain confidential.
The data sources for the white paper are listed in the references section. The in-depth interviews were
completed with the following types of respondents:
Table 1: Summary of In-Depth Interviews Completed by Organizational Type
Organization Type Number of Interviews Completed
Government-Affiliated Organizations 1
Non-Profit Associations 1
Testing Laboratories/Consultants 2
Program Evaluators 1
Total 5
Background of Advanced Power Strips
Advanced Power Strip Technology Overview
Advanced Power Strips (APS) save energy by cutting power to attached devices when they are not being
actively used. Tier 2 devices use external sensory systems to detect user engagement (active use of the
controlled AV system) and determine when a user is not engaged and accordingly un-power the master
and control devices in unison. The action of this external sensor unit is paired with a countdown timer
which is reset by detected sensor input. Tier 2 APS devices sense when a user is not present and a device
that is designated as the master or “principle use” device is turned on – in this case, after a designated
elapsed time, the connected devices are un-powered. Other Tier 2 APS devices use a master-less approach
instead of a master/control system. This approach does not require a specific outlet for the master device
to be plugged into it. Instead, the Tier 2 APS auto-detects the master (“principle use”) device and uses it
to control the other devices. The principle use device is thus conceptually identical to a master device
(EEDAL Paper 2017, p. 2).
The Tier 2 APS products that make up the large majority of the market are manufactured by Embertec®
(left) and TrickleStar® (right) and thus current research focuses on these two products. Both units are
shown with an external sensor that contains both the shutdown warning mechanism and the user
engagement detection system (EEDAL Paper 2017, p. 2).

Tier 2 Advanced Power Strips: Examining Energy Savings Potential in a New and Changing Market
Johnson Consulting Group and Mesa Point Energy 2017 5
Figure 2: Examples of APS Tier 2 Power Strips
Unlike the Embertec units, the TrickleStar units include an occupancy sensor (OS) designed to avoid
unwanted system shutdowns. Noting that the two variations of APS units are (1) with IR only and (2) with
IR and OS, Tier two APS may be categorized as to as IR and IR-OS.
IR: Embertec – IR only
IR-OS: TrickleStar – both IR and OS capabilities
Understanding Equipment Loads
Entertainment devices make up 60 percent of all plug load consumption by home electronics. Nationally,
plug loads for household electronics in the United States are estimated to account for almost 20 percent
of all residential energy usage and that percentage is projected to increase as households purchase more
electronics (CalPlug 2014, p. 15).
Therefore, it is critical for utility program designers, planners, and evaluators to accurately quantify the
estimated savings possible from a Tier 2 APS (NEEP 2012, p 5). But, therein lies the challenge. Savings from
APS are harder to quantify compared to other energy efficiency products such as lighting since APS units
include a control system that are not in and of themselves inherently efficient. Rather, APS devices create
efficiencies because they control the amount of energy that other devices use (NEEP Case Study 2015, p. 1).
In this way, APS devices are more similar to smart or programmable thermostats that rely on the
interaction of customer behavior with programming to capture energy savings. Both programmable
thermostats and APS devices require user engagement to achieve energy savings. Energy savings
estimation is further complicated by the nearly limitless configurations and types of residential audio
visual (AV) entertainment systems (EEDAL 2017, pp. 1,8,).
A related concern is that the length of the testing period reported in these studies. Most of the current
studies rely on a relatively short-period of time which does not yield the type of data to provide necessary
to provide good quality estimates of energy savings based on both equipment configurations and user
behavior (EEDAL 2017, pp. 16, 20-22; PG&E Study 2016, p. 39).
Evaluating a product designed to save energy requires comparing the new energy usage to the baseline
or normal energy usage to show the differential savings. However, quantifying the energy savings from
these devices is challenging for several reasons:

Tier 2 Advanced Power Strips: Examining Energy Savings Potential in a New and Changing Market
Johnson Consulting Group and Mesa Point Energy 2017 6
• The kilowatt hour (kWh) savings of any particular APS depends upon how many and which
products are plugged into the device;
• Energy savings are dependent upon the interaction of Tier 2 APS with other devices such as game
consoles and set-top-boxes which draw considerable load but interruption of which may not be
acceptable to users (NEEP Case Study 2015, p. 1);
• User behavior contributes to potential energy savings as users may interact differently with the
entertainment center components on a daily basis (EEDAL Paper 2017, p. 2); and
• Measuring the energy savings achieved by a Tier 2 APS device is complicated by the variability of
user behavior, both across users and within users over time (EEDAL Paper 2017, p. 2).
Every subject matter expert interviewed raised concerns with the current methodologies that have been
used to quantify savings, given the variability of the savings estimates to date.
“Evaluation is difficult because there are a lot of different configurations. It is challenging because
of the complications there.” (APS Researcher)
Despite the large number of variables in play, reliable quantification of savings from APS units is possible,
and additional research is needed to improve savings calculation methods. The EEDAL paper observes that
consistent savings has been shown despite variation in user types and baseline energy levels.1
As the authors of the EEDAL 2017 paper observe, the “gold standard” of M&V research is to rely on the
standard pre-test/post-test experimental design, where measures during a baseline period are compared
to measures during an experimental period, and any difference is interpreted as the result of the
experimental intervention. This pre/post research strategy is common in measurement and verification
(M&V) studies and is recognized by the U.S. Department of Energy Uniform Methods Project as a reliable
M&V methodology (EEDAL 2017, p. 10).
Furthermore, the International Performance for Measurement and Verification Performance (IPMVP)
recommends using the pre-test/post-test methodology as the preferred approach for determining energy
savings from an installed energy savings measure.2 This approach is considered ideal because it is a true
apples-to-apples comparison of actual measure results under the identical parameters conducted by an
independent third-party.
In contrast, the laboratory simulation results relied on data from separate experiments, conducted under
different conditions, and relying on an M&V approach developed by one of the main APS providers.
Therefore, these results are not comparable nor completely objective.
1 “It should be noted that, on average, Tier 2 APS field test studies have shown consistent savings with different user types and at different baseline energy usage levels.” (EEDAL Paper 2017, p. 2) 2 https://evo-world.org/en/products-services-mainmenu-en/protocols/ipmvp

Tier 2 Advanced Power Strips: Examining Energy Savings Potential in a New and Changing Market
Johnson Consulting Group and Mesa Point Energy 2017 7
Summary of Previous Research Efforts
Recently, the Northeast Energy Efficiency Partnership (NEEP) summarized the findings from several
studies into a case study highlighting the savings estimates derived from several field tests. In the report,
NEEP concludes that that there is still need for additional study.
Table 2 summarizes the results of the most recently completed savings estimates; it is notable that the
table shows that the results from the various studies vary significantly. Furthermore, the studies are not
identical, and even the individual product trials did not have the same parameters, so the energy savings
vary from 79 to 386 kWh (Wang, 2014, PG&E Study 2016, p. 16).
Although it appears from Table 2 that M&V on Tier 2 units has been extensive, with the exception of the
TrickleStar UL test and PG&E pre/post testing, all of these experiments were conducted using Embertec
equipment using the same simulation protocol. All of these Embertec tests are similar, and give similar
percentages savings results. On the other hand, both alternate approaches, the UL test and pre/post
testing, have only conducted on a small sample, and both alternate methods show lower savings than the
simulation method.
Additionally, the simulation savings estimate is quite optimistic, showing 50 percent savings based only
on a simulation which has not been observed in other, more real world M&V approaches.
Table 2: Comparison of Energy Savings Estimates for Tier 2 APS Devices
Study/Program Products Test method Savings Established (kWh) Percentage of Savings
BPA Embertec and
TrickleStar Simulated –
Literature Review 300 – 327 Not specified
MA Embertec and
TrickleStar Simulated –
Literature Review 242 Not specified
CalPlug Embertec Simulated savings 306 – 386 48-53%
CalPlug TrickleStar Laboratory Testing 323 Not specified
PG&E Embertec Simulated savings 214 50%
PG&E TrickleStar Simulated savings 118 27%
PG&E Embertec Pre / post testing 125 29%
PG&E TrickleStar Pre / post testing 110 25%
San Diego Gas & Electric
Embertec Simulated savings 303 50.50%
Silicon Valley Power Embertec Simulated savings 164 49.50%
UL Environment TrickleStar Laboratory Testing 79 – 333 22-47%
(Sources: NEEP Tier 2 APS Case Study, April 2015 p. 3.; San Diego Gas & Electric Energy Efficiency Engineering Work Papers, Wang, 2014; PG&E Study, 2016, p. 71)

Tier 2 Advanced Power Strips: Examining Energy Savings Potential in a New and Changing Market
Johnson Consulting Group and Mesa Point Energy 2017 8
Field Testing – PG&E Energy Savings of Tier 2 Advanced Power Strips in Residential AV Systems
To date, the most commonly cited field study approach used to estimate the savings resulting from
participant use of APS power strips was conducted by PG&E in California (Project Number ET13PGE1331),
(PG&E 2016). The study employed two methods to assess savings, including the “pre/post” method and
the simulation or “Log Mode Evaluation (LME)” method.
Within the study, two separate phases were conducted and, although small, these trials constitute the
best understood field testing of Tier 2 APS units to date:
1. Phase 1 was conducted in SDG&E service territory and only considered IR devices. Thus, only the
IR (Embertec) unit was tested, and while 42 sites were field tested, the pre/post testing was
limited to a sample of nine units.
2. Phase 2 was conducted at 56 sites also in the SDG&E service territory and only considered IR-OS
devices. Both simulated and pre/post testing were completed during this phase (Energy Savings of Tier
2 Advanced Power Strips in residential AV systems, Project Number ET13PGE1441, PG&E 2016).
Combining phases 1 and 2 in the study, the IR and the IR-OS devices were tested using both a simulated
savings (LME) methodology and a pre/post approach. However as discussed below, the two phases are
not comparable and do not show agreement between the two M&V methods.
The study was specifically designed to assess the energy savings potential of Tier 2 APS in residential
audio/video (AV) applications (PG&E Study 2016, p. 1). This study used four scenarios that included both
simulated and pre/post monitoring; however, the sample sizes and certain experimental parameters
differed across these device groups. The IR model savings were estimated using engineering simulation at
94 total sites while pre/post monitoring IR trials were conducted at just nine sites. The IR-OS model was
tested using both the simulated and pre/post methods at 52 and 56 sites, respectively (PG&E Study 2016,
p. 6). Phase 2 of the study revealed significantly lower savings estimates (PG&E Study 2016 pp. 6-7).
Additionally, a customer satisfaction study was completed with customers who participated in the field
trials and were cited in 2016 PG&E Work Papers (PG&E 2016 Study). The independent evaluator found
that device shut downs have a negative effect on customer satisfaction. Of note, respondents who did not
have a device shutdown while viewing television were more satisfied than those who did experience a
shutdown (i.e., 71% satisfaction rating of “6” or “7” on a scale of “1” to “10” for IR-OS devices & compared
to 51% satisfaction rating of “6” or “7” for IR only devices). This finding suggests that those respondents
who had an IR-OS APS were more satisfied than those who did not have an APS with an occupancy sensor.
This finding also suggests that the OS enhancement plays a large role in product persistence. Rather than
forcing the operator to respond, the IR-OS unit will provide a better experience because false shutoffs are
greatly reduced (PG&E Study 2016, p. 58).
The two M&V methods (Pre/post and LME) are discussed in more detail next.
Pre/Post Testing

Tier 2 Advanced Power Strips: Examining Energy Savings Potential in a New and Changing Market
Johnson Consulting Group and Mesa Point Energy 2017 9
In the pre/post testing approach, energy savings are observed by comparing usage during a pre-
intervention period, to a subsequent, post-intervention period when a Tier 2 APS is implemented. The
pre/post method is “recognized by the US DOE Uniform Method Project as a reliable M&V methodology”
(EEDAL 2017, p. 10).
Pros and Cons of Pre/Post Savings Method
• Includes all user interaction effects and feedback with APS controls and functions (EEDAL 2017, p. 21);
• Cannot control variability in usage patterns between pre and post timespans (daily host uses and
total use time of AV system) (EEDAL 2017, p. 21);
• Simple approach that can easily be replicated for various models without equipment and
instrumentation modification for M&V purposes (PG&E Study 2016, p. 19); and
• Widely accepted as a valid M&V approach.
Simulation / Log Mode Evaluation
In the LME approach, the APS system does not actually control the equipment, but rather turns on a
flashing LED (during phase 1) or a combination of an LED and a beeping sound (phase 2) indicating that
the system may be controlling the system to reduce system loads. The savings are then calculated based
on the time the equipment operates after the signal occurs.
Pros and Cons of simulation / LME Savings Method
• Developed by CalPlug to address uncertainty associated with behavior variation from pre to post
periods and to reduce overall time needed for monitoring;
• Eliminates potential variation in usage patterns between pre and post timespans because only one
period is used;
• May not fully account for user interaction with APS when system is turned off (since shutdown is
only simulated after baseline data collection) Additionally, phase 2 of the study used both a flashing
LED light and an audible signal, rendering the two phases difficult to compare; 3
• Methodology is not widely accepted in the M&V community, and serious questions have been
raised regarding its reliability especially regarding using this type of non-standard approach (EEDAL
2015, pp. 19-21); and
• The energy savings method was designed by one of the APS manufacturers, and the manufacturer
receive and analyzed the data, which has raised concerns regarding the independence, reliability
and objectivity of the data. Third party M&V design and implementation may provide more
confidence in the results.
3 An LED warning light flashes continually when countdown timer reaches zero in order to prompt user response as in actual APS use (EEDAL 2017, p. 19).
Tier 2 Advanced Power Strips: Examining Energy Savings Potential in a New and Changing Market
Johnson Consulting Group and Mesa Point Energy 2017 10
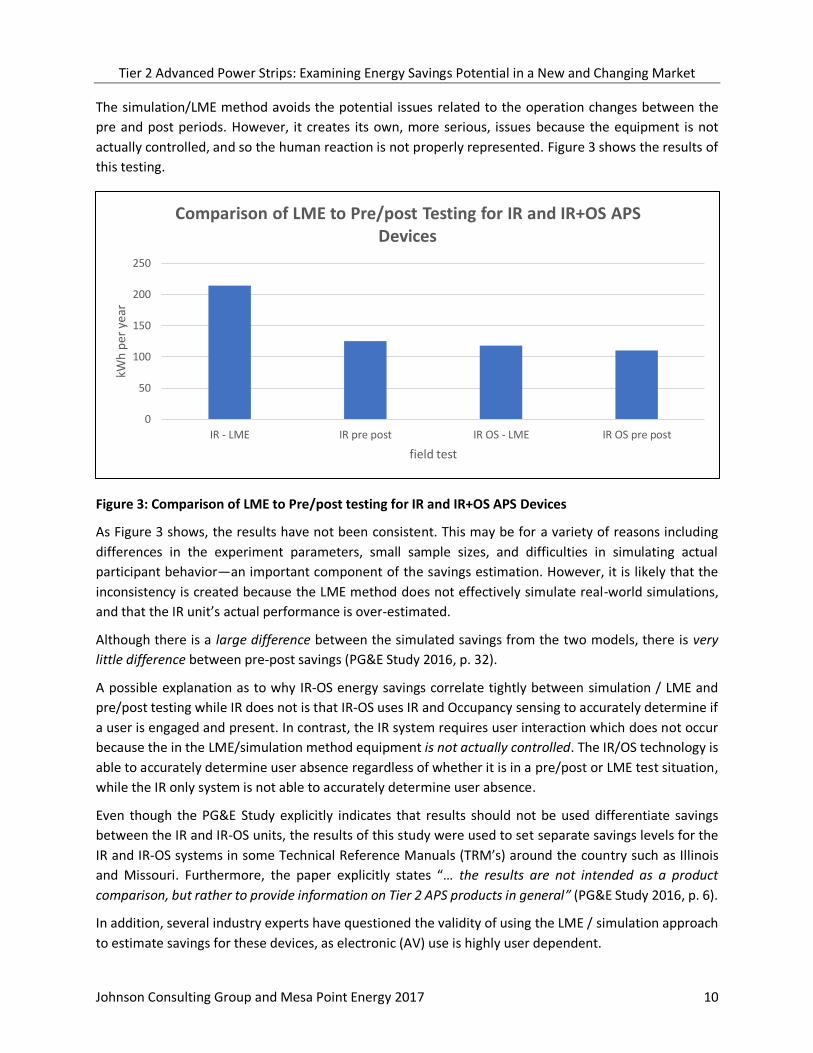
The simulation/LME method avoids the potential issues related to the operation changes between the
pre and post periods. However, it creates its own, more serious, issues because the equipment is not
actually controlled, and so the human reaction is not properly represented. Figure 3 shows the results of
this testing.
Figure 3: Comparison of LME to Pre/post testing for IR and IR+OS APS Devices
As Figure 3 shows, the results have not been consistent. This may be for a variety of reasons including
differences in the experiment parameters, small sample sizes, and difficulties in simulating actual
participant behavior—an important component of the savings estimation. However, it is likely that the
inconsistency is created because the LME method does not effectively simulate real-world simulations,
and that the IR unit’s actual performance is over-estimated.
Although there is a large difference between the simulated savings from the two models, there is very
little difference between pre-post savings (PG&E Study 2016, p. 32).
A possible explanation as to why IR-OS energy savings correlate tightly between simulation / LME and
pre/post testing while IR does not is that IR-OS uses IR and Occupancy sensing to accurately determine if
a user is engaged and present. In contrast, the IR system requires user interaction which does not occur
because the in the LME/simulation method equipment is not actually controlled. The IR/OS technology is
able to accurately determine user absence regardless of whether it is in a pre/post or LME test situation,
while the IR only system is not able to accurately determine user absence.
Even though the PG&E Study explicitly indicates that results should not be used differentiate savings
between the IR and IR-OS units, the results of this study were used to set separate savings levels for the
IR and IR-OS systems in some Technical Reference Manuals (TRM’s) around the country such as Illinois
and Missouri. Furthermore, the paper explicitly states “… the results are not intended as a product
comparison, but rather to provide information on Tier 2 APS products in general” (PG&E Study 2016, p. 6).
In addition, several industry experts have questioned the validity of using the LME / simulation approach
to estimate savings for these devices, as electronic (AV) use is highly user dependent.
0
50
100
150
200
250
IR - LME IR pre post IR OS - LME IR OS pre post
kWh
per
yea
r
field test
Comparison of LME to Pre/post Testing for IR and IR+OS APS Devices

Tier 2 Advanced Power Strips: Examining Energy Savings Potential in a New and Changing Market
Johnson Consulting Group and Mesa Point Energy 2017 11
“The savings depend on time of use of various components and what exactly is being used on the
system.” (Testing Engineer)
“Embertec does field trials in a recording mode documenting where the device would have turned
off (equipment). But it is not a flawless system… I am not convinced of the robustness of the CalPlug
studies. These devices have to be looked at in the aggregate. You can tell what the individual
kilowatt hour savings will be, but you might be able to get a reasonable estimate for an entire
service territory. (APS Subject Matter Expert)
One industry researcher described this technology as “exotic” because there are no established usage
patterns.
“It is difficult to get individual behaviors regarding TV (usage).” (APS Subject Matter Expert).
“(Equipment) logging is expensive.” (CalPlug Study Expert)
The Regional Technical Forum (RTF, 2015) also raises concerns it its report; “Energy savings due to APS
measures are likely to be highly sensitive to human behavior. “For this reason, the RTF recommends APS
research to derive savings estimated from actual pre/post energy consumption data.” (RTF 2015, p. 2). In
the same report, RTF says:
“… the RTF has determined that the following approaches are not likely to yield savings estimates that
are sufficiently reliable for proven UES values: Bottom-up savings estimates that are not based on data
capturing actual APS savings, Pre-only or post-only metering with simulated counterfactuals.” 4(RTF
2015, p. 3).
But perhaps the most important finding is that energy experts are still not sure what are the estimated
savings from these devices. As the PG&E Study authors observed,
“The confounding feature of this study is that there is agreement between the simulated and pre/-
post savings for the IR-OS model but not for the IR model. This suggests that pre-post savings are
consistently lower than the simulated method. Based on this, further testing may be warranted
and could clarify this unresolved uncertainty.” (PG&E Study 2016, p. 32).
The PG&E Study 2016 further explains that the average annual savings from these devices are somewhere
between 110 and 214 kWh (and 25%-50% percent of annual savings) (PG&E Study 2016, p. 36).
The study found that the APS devices functioned as designed and operation was intuitive with simple,
quick installation. Energy savings, demand reduction, and estimated simple payback from the CalPlug
method are presented in Table 1 (Valmiki & Corrandini 2015, p. 3).
However, simulation of the controlled state internally and on the back-end without actually turning any
AV devices off introduces uncertainty and most likely bias. This is because the M&V approach does not
capture user interaction effects that could potentially alter actual savings. The instrumentation attempts
to mitigate this issue by flashing an LED light whenever the device believes that the AV system is not in
4 For example, much of the recent research on Tier II APS in home entertainment applications has used an estimation protocol developed by the CalPlug Center at UC Irvine. In lieu of pre/post meter data, the CalPlug protocol relies on critical assumptions about when and whether an A/V power-down would be acceptable to the user.

Tier 2 Advanced Power Strips: Examining Energy Savings Potential in a New and Changing Market
Johnson Consulting Group and Mesa Point Energy 2017 12
use. When the user signals with the remote that the AV devices are still being used, the simulation resets
its use timer. This is similar to the actual APS device function where the user is supposed to react to the
flashing LED in order to reset the shutdown timer.
It should be noted that the alternative pre/post methodology has its own uncertainties, largely associated
with varying use patterns between the pre/post timespans (Valmiki & Corrandini 2015, p. 23).
“Laboratory conditions are a great start, but to see the behavioral connection, you have to deploy
into the field.” (CalPlug Study Expert)
UL Environment (ULE) to conduct an Environmental Claims Verification
In the fall of 2014, TrickleStar hired UL Environment (ULE) to conduct an Environmental Claims Verification on the
energy savings capability of the TrickleStar Tier 2 APS unit. ULE completed their laboratory testing, auditing, and
analysis in accordance to their “ULE ECVP 108 Version 3 - Estimating Energy Savings for Energy Saving Power Strips”
methodology in December 2014 and later issued a certification letter in January 2015. The ULE report validated
energy savings between 20 to 47 percent a year (estimated a range of 79.2kWh/yr. to 333.48 kWh/yr. savings) in
reference to the TrickleStar Tier 2 APS unit (NEEP Case Study 2015, p. 2).
While each of the individual loads was measured in the laboratory; UL did not perform field measurements. As the
testing engineer explained, “There are a lot of configurations (for APS devices), so one of the working points was to
establish an equipment standard.”
“There were two goals (for the study). One was to have transparency on what is actually being done. There
were a lot of claims and no basis for the claims… We are trying to keep everyone measuring (energy savings)
in the same way under the same conditions, so we could compare two different systems based on their
performance not on different equipment sets.” (Testing Engineer).
“The UL testing was a reality check to see how much is the energy use for this equipment; how long devices
are plugged in. Our desk review found that the savings range for the Tier 2 equipment was in the low 100
kWh.” (Program Evaluator)
Another researcher who completed similar testing added that the focus of this research is not to identify a savings
estimate as “energy savings are entirely dependent upon how people use devices.”
“Our conclusion is that most APS power strips do work as advertised; but saving energy depends on choosing
the right product.” (APS Subject Matter Expert)
Both the previous researchers and the subject matter experts interviewed for this white paper pointed out numerous
flaws with the previous research conducted on APS devices to estimate energy savings. These flaws are summarized
next.
Flaws in the Previous Research
Inconsistent testing parameters. Prior studies suggest potential annual savings of 100 to more than 400
kWh, but they have used different testing methodologies on different APS units. To generate trustworthy
savings estimates for use in energy efficiency incentive programs, it is critical to standardize simulation
and field test methods across testing efforts (EEDAL Paper 2017, p. 1). Furthermore, the comparable data
for user movement (as sensed by an occupancy sensor) have not been evaluated in the same manner by
CalPlug as IR remote control interaction. For APS devices with occupancy sensors, CalPlug developed a

Tier 2 Advanced Power Strips: Examining Energy Savings Potential in a New and Changing Market
Johnson Consulting Group and Mesa Point Energy 2017 13
“negation” factor calculation that estimates the magnitude of impact of the occupancy sensor may have
on energy savings for a particular setup (EEDAL 2017, pp. 8-9).
Previous pre/post testing did not always account from the variability in usage among participants. The
California IOU field trial report featured presentation of pre/post savings as a combination between direct
measured and simulated pre/post. However, the main drawback of the pre/post method as applied to
this particular situation is the potential variability between the baseline and experimental periods that is
unrelated to the use of the Tier 2 APS unit. Variances in usage are especially problematic when testing
energy savings for AV systems, as the usage of a residential home entertainment system displays
considerable variability both across users and within users over time.
The complexity of possible behaviors contributes to this problem; in addition to watching satellite or
broadcast TV, the TV or audio system may also be used for streaming music, watching DVDs or streaming
video content, and playing games using a game console.
In addition, external factors and cyclic patterns can shift TV viewing and AV system usage habits, such as
sporting events, TV seasons, release of a new video game, weather, political events, and school/work
calendars. If either the activity or the viewing time of the entertainment system varies, a comparable
baseline can be difficult to establish. With potential variability in both the baseline and experimental
periods, the final magnitude of the error is difficult to assess. If an individual is more actively using the
entertainment in the pre (baseline period) versus the post period (experimental period), the assessed
savings can be lower than expected (or in extreme cases, negative, as has been metered). Conversely, if
an individual is less actively using the device during the post (experimental period), the resulting savings
can be overestimated. Accuracy of pre/post is strongly dependent on the assumption that common usage
exists between the pre/post period to the extent at which these assumptions do not hold in field testing
affects the accuracy of the results (EEDAL 2017, pp. 11-12).
“Additional investigations are necessary to evaluate the root of the discrepancy between field test
data comparing the two Tier 2 APS products and the effectiveness of the two metering methods. With
a large enough sample pool, the measurement results of both methods in independent studies should
be equivalent, provided that the methods are inherently equivalent at estimating energy savings.”
(EEDAL 2017, p. 17)
Several subject matter experts agreed citing their own concerns with the ways in which these previous
studies have been conducted.
“There is variability of usage patterns. To normalize that variability, we need to gather more data
than two weeks on/two more weeks off.” (CalPlug Study Expert)
However, such comparisons may not be warranted either as there are little discernible differences
between the two units according to an industry expert.
“In many studies, the devices had a 30 to 50 percent savings. I have more faith in that number (the
percentage of savings) rather than the actual kilowatt hour savings because there is so much
variability. NYSERDA ‘s Study in 2010 (found) that home entertainment centers use about 600
kilowatt hours per year. So that is the underlying assumption for establishing a savings claim by
looking at the percentage reduction… It is most helpful to focus on the percentage of savings.” (APS
Researcher)

Tier 2 Advanced Power Strips: Examining Energy Savings Potential in a New and Changing Market
Johnson Consulting Group and Mesa Point Energy 2017 14
“In the absence of the pre/post findings, the simulation results reigned supreme. But given that we
have now done three phases of testing and the pre/post results were pretty close, the savings are
almost a wash…I am not comfortable with simulations.” (CalPlug Study Expert)
“Some studies… have to be really careful with the assumptions that go into the study. Setting up
people in a room watching TV is not normal (simulations)... What they were recording was
inattentiveness …it is more than just a single focus. People will work out when do TV, do multi-
tasking and that all affects the savings numbers… It is difficult to determine how many times
someone falls asleep in front of the TV. We haven’t found anything reliable.” (Testing Engineer)
“There have been studies that have looked at what’s installed in homes…But you have to discount
things so as not to be overly generous with the savings. A 150 kWh seems to be a more comfortable
savings estimate.” (APS Researcher)
Several of the APS industry experts were also not in favor of trying to create savings bands between the
two APS power devices. As one expert noted, these devices are not like lighting products where banded
savings levels make sense.
“There are deemed savings values and in some jurisdictions, they are using a savings band… a
certain savings number that applies across the same product category… But this works for
commercial lighting, where the change-outs are more straightforward.” (CalPlug Study Expert)
“Banded savings estimates are much more dependent on whether (the researcher) can verify
multiple peripherals. I think if we get better data on run hours and the power draw of peripherals
and TV plugged in, the savings are just about transferable between the two manufacturers.” (APS
Researcher)
“The difference in the expected savings between the two products currently available are not as
significant compared to the noise in the variations of the savings estimates for each product… I
think we are struggling enough to come up with reasonable savings estimates for Tier 2 APS
products. I can’t say there is anything to distinguish between the two products (regarding energy
savings).” (APS Industry Researcher)
For simplicity, the California utilities want one product category across all units. However, at the current
savings estimate of 130 kWh, the technology is not cost effective, according to the CalPlug Study expert.
“The California study is risky and that is the basis for the IL TRMs. It seems unfair to provide higher
savings for one device over another. They are not different enough…The utilities would be better
off taking a conservative number. The risk is high with higher savings estimates, and that will hurt
these devices in the long run.” (Program Evaluator)
Emerging Trends in Consumer Electronics
This is also a fast-changing area for researchers. Not only did the Nielsen research indicate dramatic shifts
in viewer habits (see Figure 4), several respondents pointed out that new APS devices will be able to
provide wireless data reporting. If that capacity materializes, then the data could be collected during
program implementation rather than during evaluation. This will provide a more definitive savings
estimate.

Tier 2 Advanced Power Strips: Examining Energy Savings Potential in a New and Changing Market
Johnson Consulting Group and Mesa Point Energy 2017 15
“If the devices have connectivity and are able to upload the data and usage in real time, that will
allow the data to be collected and will actually enhance the credibility of the device.” (CalPlug Study
Expert)
These industry experts also agreed that Tier 2 APS devices should be part of a direct install program
offered through the utility.
“We can’t rely on consumers to buy their own. They need to be part of a program.” (APS Industry
Researcher)
Other industry experts noted that several new types of technologies were moving into this category,
making it even more important to have Tier 2 APS installed in customers’ homes.
“We are looking at the peripherals like the new sound bar speaker system. This is an all-in-one
device. It is a newer product that is replacing traditional speakers and uses a lot of energy. It is in
vogue with younger folks. The ENERGY STAR Retail Products Platform has identified that there is a
growing market for sound bars.” (APS Researcher)
“Now we have all kinds of things connected to speakers and piped into other rooms. We can no
longer assume that the TV is master device. I think that we are onto a good idea with the Tier 2
APS… it is a good stop-gap measure. But they keep needing to change their design or thinking to
accommodate the change in electronics that are happening.” (APS Industry Researcher)
“There needs to be more understanding of the end uses of the home entertainment center and
what each device consumes.” (APS Industry Researcher)

Tier 2 Advanced Power Strips: Examining Energy Savings Potential in a New and Changing Market
Johnson Consulting Group and Mesa Point Energy 2017 16
(Source: Nielsen Cross Platform Report, Table 3)
Figure 4: How Consumers Spend Media Time Each Month

Tier 2 Advanced Power Strips: Examining Energy Savings Potential in a New and Changing Market
Johnson Consulting Group and Mesa Point Energy 2017 17
Key Research Findings
Based on our review of the available literature and interviews with subject matter experts, we have the
following findings:
Finding 1 – Because differentiated savings levels are not reliable, use of a single savings value for all Tier 2 products is appropriate.
While reliable savings quantification is possible, to ensure the use of best practices, DSM program design
and TRM development must avoid using incomplete and limited research that does not have wide support
in the industry to differentiate between different APS Tier 2 products and implementation and control
strategies. Some TRMs have diverted from best practices by using preliminary and questionable
information to differentiate different Tier 2 products. Such use of potentially unreliable information
creates an unfair and incorrect view of the available technology and thus negatively affects the
development and implementation of this valuable measure in the market place.
Program designers, TRM developers and program evaluators should use a single deemed savings value
for all Tier 2 APS products until further research validates a more granular breakdown based on specific
products or specific feature sets.
A default Product Class should be assigned to both the IR and the IR-OS products and differentiation of
these or any other product should only be implemented upon the completion of reliable and widely
accepted research.
Finding 2 –The simulation method likely overestimates savings for the IR-only devices.
Evaluation of savings based on existing M&V methods have not been completed for the IR product.
However, it appears from the limited data that the IR product would show significantly less savings in the
second, pre/post test, and thus may be a better representation of real world device operation.
It is not surprising that the IR without OS capabilities shows more theoretical savings than actual savings.
The IR-OS device includes an occupancy sensor, which is a more advanced control that helps provide more
reliable operation by considering an additional independent variable in the algorithm; specifically,
occupancy.
Additionally, the IR-OS tests used a flashing light and a buzzer, while the IR products used only a flashing
light. (PG&E, 2016, p. 24) This difference in the experiment interface with the user renders the two study
phases mismatched and not comparable.
Involved parties should de-emphasize simulated savings estimation methods in favor of field studies
implementing complete pre-/post- in-situ measurement of associated energy consumption. If products
are ready for market, it is reasonable that the devices can be tested using real-world conditions. Removal
of the simulation element of from consideration in developing savings estimates would resolve questions
regarding the validity of such simulation.

Tier 2 Advanced Power Strips: Examining Energy Savings Potential in a New and Changing Market
Johnson Consulting Group and Mesa Point Energy 2017 18
Finding 3 – More field research is needed.
Use of a product classification system that reliably differentiates between products would require a more
rigorous and complete M&V effort. First, the existing research project that was partially implemented
should be completed, so that savings results for IR’s project is completed. Secondly, new independent
research should be designed and implemented.
All involved parties should emphasize rigorous research into product persistence, or in-service rate (ISR),
of Tier 2 APS devices. If a granular breakdown of Tier 2 deemed savings carries forward in the future, the
TRM managers should recognize the importance of ISR for Tier 2 APS devices and include it as a variable
in determination of product-specific energy savings instead of using a deemed ISR for each of the devices.
Finding 4 –Product Class systems in TRMs are too complex to be supported given currently available research results.
Given the uncertainty associated with actual savings achieved by both APS devices, it is premature to
develop separate savings classifications. This level of complexity appears premature, given there are only
two Advanced Tier 2 power strips in the market. Rather, determining a savings estimate by class is more
appropriate for those products which have dozens, if not hundreds, of product offerings such as energy
efficient lighting, ENERGY STAR appliances, or premium efficiency motors.
Finding 5 – There is little consensus that the existing research is reliable.
The pre/post research strategy is common in measurement and verification (M&V) studies and is
recognized by the U.S. Department of Energy Uniform Methods Project as a reliable M&V methodology.
It is based on standard pre-test/post-test experimental design, where measures during a baseline period
are compared to measures during an experimental period, and any difference is interpreted as the result
of the experimental intervention (EEDAL 2017, p. 10).
Overall, the widely accepted UMP and IPMVP M&V guidance documents simply do not support using
simulation method only to determine savings but rather do strongly support using the pre/post testing
methodologies describe in these protocols.
Recommendation: More work is required to develop reliable, comparable and independent savings
estimates for APS devices.
The authors recommend that Tier 2 units deemed savings values should be put in place for the Tier 2
devices discussed in this paper, and more field studies be conducted, using larger data sets and more
careful experimentation.
• The EEDAL 2017 paper urges developing a research protocol that ensures future data collection
methodologies will be consistent and standardized for both device types (EEDAL 2017, p. 21);
• The emerging capability of providing wireless data reporting from these devices may provide the
dataset required to prove energy savings; however, these estimates should be independently
verified; and
• Involved parties should monitor the Regional Technical Forum’s (RTF 2015) treatment of the APS
measure as they complete their review of the technology over the next year.

Tier 2 Advanced Power Strips: Examining Energy Savings Potential in a New and Changing Market
Johnson Consulting Group and Mesa Point Energy 2017 19
Bibliography
Earle, L. & Sparn, B. 2013, Choose the Right Advanced Power Strip for You, Department of Energy’s
National Renewable Energy Laboratories, October 28, https://energy.gov/energysaver/articles/choose-
right-advanced-power-strip-you <<Accessed August 6, 2017>>
Extension, 2015, Phantom/Standby Energy Use by Home Electronics and Appliances, September 25, Energy
Star. (2013). More IT Energy Saving Tips. Retrieved on November 05, 2013, from
http://www.energystar.gov/index.cfm?c=power_mgt.pr_power_mgt_more_tips, and
http://articles.extension.org/pages/25636/phantomstandby-energy-use-by-home-electronics-and-appliances
<<Accessed August 6, 2017>>
Klopfer, M., Pixley, J. Wang, X., Segarra, K., 2017. Tier 2 Advanced Power Strips – Revisiting behavior based
models for estimation of savings in laboratory and field trial evaluations, California Plug Load Research
Center (CalPlug), University of California, Irvine in Irvine, California, USA (EEDAL Paper 2017).
Malik, L. 2011 (a). Advanced Power Strips: Energy Efficiency through Plug Loads. ACEEE's Energy Efficiency
as a Resource Conference. Denver.
Malik, L. 2012 (b). Advanced Power Strips: Overview of NE Programs Promoting APS. Northeast Energy
Efficiency Partnerships (NEEP), AESP Brownbag Webinar. Efficiency Vermont, Mass Save, and NYSERDA.
Nielsen, 2014, THE U.S. DIGITAL CONSUMER REPORT, 2-10. http://www.nielsen.com/us/en/insights/
reports/2014/the-us-digital-consumer-report.html <<Accessed August 6, 2017>>
Northeast Energy Efficiency Partnerships (NEEP) Data Working Group 2012. Advanced Power Strips Deemed
Savings Methodology, Northeast Energy Efficiency Partnerships, January.
Northeast Energy Efficiency Partnerships, 2015. Case Study: Tier 2 Advanced Power Strips and Efficiency
Program, April.
Regional Technical Forum, 2015. “Research Strategy: Residential Advanced Power Strips,” August 18.
Valmiki, M. M. & Corradini, A. 2015 (a), Work Paper WPSDGEREHE0004, Revision 0.1, San Diego Gas &
Electric, Alternative Energy Systems Consulting, Inc., Energy Efficiency Engineering, April 28.
________, (b), TIER 2 ADVANCED POWER STRIPS IN RESIDENTIAL AND COMMERCIAL APPLICATIONS, San
Diego Gas & ElectricEmerging Technologies Program Technology Assessment Report Project IDs
ET14SDG8021 & ET14SDG8031, April 15.
________, 2016 (c), Energy Savings of Tier 2 Advanced Power Strips in Residential AV Systems Project
Number ET13PGE1441, Alternative Energy Systems Consulting, Inc., February (PG&E Study).
Wang M., Yang, Zhang, A. & Li, G. (CalPlug), 2014. Tier 2 Advanced Power Strip Evaluation for Energy Saving
Incentive, prepared by California Plug Load Research Center & California Institute for Telecommunications
& Information Technology 4100 Calit2 Building, UC Irvine, May 14.