Embed Size (px)
Citation preview

Throughput Per formance of the Distr ibuted and Point Coordination Functions of an IEEE 802.11 Wireless LAN
Leena Chandran-Wadia,# Shruti Mahajan∗ and Sridhar Iyer# # K. R. School of Information Technology,
* Department of Electrical Engineering Indian Institute of Technology Bombay,
Powai, Mumbai – 400 076 (e-mail: [email protected]; [email protected]; [email protected])
Abstract
We study the throughput and delay as a function of load, of data traffic in an IEEE 802.11 Wireless LAN using the public domain network simulator ns-2. We evaluate the Distributed Coordination Function (DCF) as well as the Point Coordination Function (PCF) modes of operation of IEEE 802.11 in detail. Although the PCF gives consistently higher throughput in the ranges of load studied, it has higher delay in the relatively lighter ranges of load. So it is optimal to use DCF at light loads and switch to PCF when the load increases.
1.0 Introduction
Wireless LANs based on the IEEE 802.11 standard are very widely used today. The success of the IEEE 802.11 standard has resulted in the easy availability of commercial hardware and a proliferation of wireless network deployment, in wireless LANs as well as in mobile ad hoc networks. So much so that even multi-hop mobile ad hoc networks covering relatively large areas are deployed using off-the-shelf IEEE 802.11 hardware, despite the fact that the IEEE 802.11 protocols were not really designed for this purpose.
IEEE 802.11wireless LANs (WLANs) can operate either in the infrastructure mode or in the ad hoc mode. An infrastructure network is established using Access Points (APs) for each Basic Service Set (BSS). The AP is similar to a base station in a cellular network. It provides scheduled medium access to all the other stations in the BSS. The BSS is simply a group of stations, which can all communicate directly with each other. Larger networks are built by connecting several Access Points over a Distribution System as shown in Fig.1 [4]. An ad hoc (single-hop) network is a group of stations within a single BSS (called IBSS) communicating with each other without the aid of an infrastructure network.

We present early results from a systematic study of throughput and delay behavior of multi-hop mobile ad hoc networks based on the IEEE 802.11 standard. Measurements, in testbeds as well as in simulations, have shown that the throughput values obtained in multi-hop ad hoc networks are only a small fraction of the raw channel capacity of individual stations. To try and understand the causes of this, we began by studying single-hop ad hoc networks, and the results presented in this paper are confined to these. We have simulated throughput and delay as a function of load, varying packet sizes and the number of stations in the network. This we have done for the Distributed Coordination Function (DCF) and the Point Coordination Function (PCF) modes of operation of the IEEE 802.11 WLAN, and we present a comparison.
Figure 1: Components of the IEEE 802.11 Wireless LAN
The PCF has not been studied as much as the DCF. Existing studies of PCF [3, 6] have concentrated on the ability of the PCF mode to service real time audio traffic and on improving its efficiency using new polling mechanisms. This is because sequential polling wastes bandwidth and causes increased delays when the network is lightly loaded. Crow et al. [3] concluded that the PCF does have the ability to carry audio flows but echo cancellers must be used since the end-to-end delay cannot be kept below 25ms. Kopsel et al. [6] have also compared the throughput performance of DCF and PCF but they have not specified which simulator they have used, and have also not provided values for the PCF and DCF specific parameters used in their simulation. We show here that several of these parameters influence the results for throughput and delay substantially. Our results agree with some of the conclusions in these two papers.
In the following section, we briefly summarize the salient features of the DCF and PCF modes of operation of the IEEE 802.11 standard. We then move on to describe the simulation scenario in section 3 and our results in detail in section 4. We conclude with some directions for future work.

2.0 IEEE 802.11 Standard
The IEEE 802.11 standard for wireless LANs covers the Medium Access Control (MAC) and the physical (PHY) layers. Three different Physical layers specifications exist in the 2.4 GHz range of the unlicensed spectrum, but commonly used hardware is based on the Direct Sequence Spread Spectrum (DSSS) technique. The MAC protocol operates in the DCF and PCF modes. The DCF is the fundamental access method. It uses Carrier Sense Multiple Access with Collision Avoidance (CSMA/CA) for channel access, Request-To-Send and Clear-To-Send (RTS/CTS) messages for reservations and Acknowledgements (ACK) for reliability. The PCF mode is used only in infrastructure networks. It relies on a Point Coordinator (PC) that resides in the Access Point to perform polling, so that polled stations may have contention-free access to the channel.
2.1 Distr ibuted Coordination function (DCF)
When a station has data to send it first senses the channel. If the channel is idle it waits for a time interval called the DIFS period and then samples the channel again. If the channel is still idle it transmits either an RTS frame or a data frame, depending on whether it is using RTS/CTS or not. The receiving station waits for a time interval called the SIFS time and replies with either a CTS for the RTS or an ACK for the data. The sequence of frame exchange with RTS/CTS is shown in Fig.2 [4].
Figure 2: Data transmission with RTS/CTS in DCF, and NAV settings
Carrier sensing is performed at the air interface, called physical carrier sensing, as well as at the MAC sublayer, called virtual carrier sensing. A source station assists virtual carrier sensing by sending duration information relating to the packet in the header of RTS/CTS/Data frames. The duration field in the header indicates the amount of time in microseconds required to successfully send the data frame. Stations in the BSS, other than the source and the destination, use this information to set their Network Allocation Vector (NAV). The latter indicates the amount of time for which the station must defer access, after which the channel can be sampled again for idle status. The channel is marked busy if either the physical or virtual carrier sensing mechanism (NAV) indicates a busy status. Fig.2 also illustrates the setting of the NAV by stations depending on whether they receive the RTS or the CTS frames.

Collision Avoidance is performed using a backoff procedure. A station that senses the
channel to be busy must defer until the medium is free. Since multiple stations could have been waiting for access, there is a higher probability of collisions immediately after the medium becomes free. In order to reduce collisions during this period, a station must generate a random backoff time (a random integer times a fixed interval called the SlotTime), which is an additional interval beyond the DIFS time that the station must defer before it can transmit again [Fig.2]. The value of this random integer must lie within an interval called the Congestion Window (CWmax), whose length is adjusted dynamically depending on the number of collisions that occur as stations try to access the channel. When multiple stations go into random backoff, the station that selects the smallest backoff time transmits first.
Stations can choose whether to use RTS/CTS always, use it only when the MPDU size exceeds a threshold value (RTS threshold), or never use RTS/CTS. In a lightly loaded network, additional delay and bandwidth overhead is imposed by the use of RTS/CTS frames. However, less bandwidth is wasted when the smaller RTS/CTS frames collide instead of the longer data frames in more heavily loaded networks. Simulation studies have shown that using RTS/CTS frames for data packets larger than 250 bytes is optimal [3]. This value, called the RTS/CTS threshold, is known to also depend on the number of stations in the network [1], reducing with increasing number of stations. 2.2 Point Coordination Function (PCF)
PCF is an optional capacity, built on top of the DCF, which provides contention free frame transfer with the aid of a Point Coordinator (PC). The PC, which resides in the Access Point, polls individual stations for a period of time called the Contention Free Period (CFP). This is followed by a Contention Period (CP) during which stations communicate directly under the control of the DCF. Thus in the PCF mode, as shown in Fig.3 [4], contention-free frame transfer controlled by the PC alternates with contention based transfer subject to the rules of DCF. The frequency with which contention-free transfer occurs is determined by the CFP repetition interval (or CFPRate), a parameter controlled by the PC.
A beacon sent out by the PC signals the start of each CFP. Stations are polled sequentially
from a polling list maintained by the PC. A station that receives the poll from the PC can send data either to the PC or to any other station in the BSS. A poll can also be accompanied by data from the PC to the station.
Figure 3: Contention free per iods alternating with Contention per iods in the PCF

The number of stations that can be polled during a CFP depends on the length of the CFP period (CFPMaxDuration) and the size of the data packets that are exchanged between stations and the PC. The minimum as well as the maximum length of this CFPMaxDuration parameter is specified in the standard. The minimum length must be sufficient to allow the PC to send at least one maximum-sized frame to a station while polling that station, and for the station to respond with the same. The maximum value of this parameter must be such that there is sufficient time to send at least one maximum-sized data frame during the contention period before the PC takes over again and a new CFP period begins. Thus the relative values of the CFP repetition interval and the CFPMaxDuration parameters will determine the balance between distributed and scheduled medium access, and we expect them to have a strong bearing on the performance of the PCF. 3.0 Simulation Scenar io
Our simulations are done using the public domain network simulator ns-2 (2.1b8) [5]. Support for wireless simulations in ns was added as a part of the CMU Monarch project [2]. We have used the default values for all the physical and MAC layer parameters like transmission power (281.8mW) and SlotTime (20µs) etc. The data rate is 2 Mbps and the transmission range is 250m.
Our studies are confined to a single cell of radius 200m, smaller than the transmission range of individual radios. Conceptually, every station in such a cell can communicate directly with every other station. However transmission medium degradations due to multipath fading or interference from nearby BSSs reusing the same physical-layer characteristics can cause some stations to appear ‘hidden’ from other stations. In our simulations we are working with only one BSS, a clean channel without errors and fading effects etc., and a static configuration of nodes, so all stations can indeed communicate directly with each other.
The number of stations in a cell is varied from 4 to 32 asynchronous data users. At each station, a Poisson process simulates the arrival of frames for transmission. Packet sizes are kept constant at either 500 bytes or 1500 bytes for most simulations, except when throughput is studied as a function of packet size. The choice of 500 bytes as a packet size worth studying is motivated by the fact that we consider messaging applications to be appropriate for ad hoc networks. The RTS/CTS threshold is set to be 250 bytes and the fragmentation threshold 2200 bytes.
Support for the PCF mode of IEEE 802.11 has recently been added to ns [7]. We have modified the patch so that the PC polls stations continuously during the entire CFP period, instead of polling just one station during each CFP. At each poll a station sends a fixed-sized packet back to the PC. The PC does not send any data to the stations. We have simulated heavy load conditions in which all nodes have data to send, both in the PCF and DCF modes. The PCF specific parameters are as follows: The CFP repetition interval is 0.2 seconds or 200 Time Units (TUs) of which CFPMaxDuration is 0.18 seconds or 180 TUs (TU=1024µs). At the channel rate of 2 Mbps the time taken to transfer a packet of 1500 bytes is approximately 6 TUs, so a value of 180 TUs for CFPMaxDuration allows one full polling cycle to be completed for 16 nodes. Other values of the CFP repetition interval that are used are 400 TUs, 100 TUs and 40 TUs. In all of these, the CFPMaxDuration is always set to be the maximum length possible.

4.0 Results and Discussion
Figure 4: Total throughput vs. load in the DCF mode without RTS/CTS
4.1 Throughput
The overheads to throughput and delay in the DCF mode (without RTS/CTS) come from losses due to collisions and backoff, which increase as the number of nodes in the network increase. The results in Fig.4 show that the total throughput for a 16-node network exchanging 1500 byte packets can vary from just over 60% for a 32-node network to a little over 80% in a 4-node network. When RTS/CTS frames are introduced collisions become restricted to these smaller control frames. Large data packets will not be lost due to collisions anymore, but the saving in bandwidth comes at the price of the increased bandwidth overhead of the RTS/CTS frames themselves.
In the PCF mode the overheads come from having to poll stations, which may or may not
have data to send. In our simulations all nodes have data to send, so no polls are being wasted. Even so the throughput in the PCF mode depends sensitively on the value of the CFP repetition interval, as shown in Fig.5 for the 16-node network. The throughput varies as much as 20% in the range of parameters that we have studied. Throughput is defined to be the total number of bits per second

passed up from the MAC sublayer at each destination. So the throughput as measured here is also the goodput, because control and management frames are not counted. The offered load is defined to be the average number of bits per second passed down to the MAC sublayer at each source.
Figure 5: Throughput in the PCF mode for different CFP repetition intervals (TU=1024µµµµs)
Figs.6a and 6b show throughput as a function of offered load, in the DCF mode with RTS/CTS and in the PCF modes respectively, for varying packet sizes. The number of nodes is kept fixed at 8. The throughput as well as load values plotted here are per-node values i.e., a load value of 0.2 Mbps implies that the total load in the network is 1.6 Mbps.
Since all our simulations are done using an error-free channel, longer packet sizes make the system more efficient. However when the channel operates in a degraded mode i.e., with errors and fading etc. built in, the effects of large packet lengths will not be so pronounced. All the packet sizes are above the RTS/CTS threshold so the channel is reserved for all of them, but in a degraded channel the advantage of making reservations for larger packets will have to be weighed against the higher probability of errors in larger packets.

Figure 6a: Throughput vs. load in the DCF mode for an 8-node network
Figure 6b: Throughput vs. load in the PCF mode, for an 8-node network
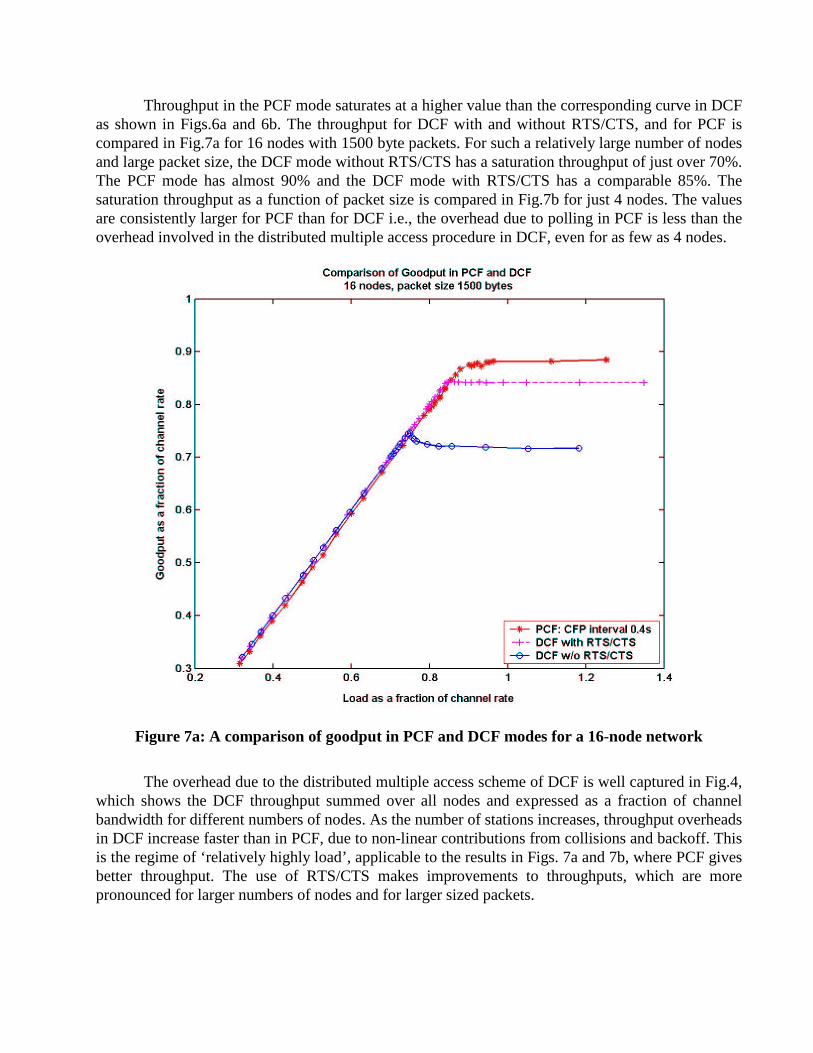
Throughput in the PCF mode saturates at a higher value than the corresponding curve in DCF as shown in Figs.6a and 6b. The throughput for DCF with and without RTS/CTS, and for PCF is compared in Fig.7a for 16 nodes with 1500 byte packets. For such a relatively large number of nodes and large packet size, the DCF mode without RTS/CTS has a saturation throughput of just over 70%. The PCF mode has almost 90% and the DCF mode with RTS/CTS has a comparable 85%. The saturation throughput as a function of packet size is compared in Fig.7b for just 4 nodes. The values are consistently larger for PCF than for DCF i.e., the overhead due to polling in PCF is less than the overhead involved in the distributed multiple access procedure in DCF, even for as few as 4 nodes.
Figure 7a: A compar ison of goodput in PCF and DCF modes for a 16-node network
The overhead due to the distributed multiple access scheme of DCF is well captured in Fig.4, which shows the DCF throughput summed over all nodes and expressed as a fraction of channel bandwidth for different numbers of nodes. As the number of stations increases, throughput overheads in DCF increase faster than in PCF, due to non-linear contributions from collisions and backoff. This is the regime of ‘ relatively highly load’ , applicable to the results in Figs. 7a and 7b, where PCF gives better throughput. The use of RTS/CTS makes improvements to throughputs, which are more pronounced for larger numbers of nodes and for larger sized packets.

Figure 7b: Saturation throughput in DCF (with RTS/CTS) and PCF modes for 4 nodes
DCF will do better than PCF only in truly lightly loaded networks i.e., those in which only some of the stations present have data to send. This is because the DCF overhead depends only on the number of stations which are accessing the channel because they have data to send i.e., the number of active stations. The PCF overhead on the other hand depends on the total number of stations. When several nodes that do not have data to send are present, the PCF mode wastes more bandwidth trying to poll such stations. This regime of ‘ light loads’ is not explored in this paper.
In the traffic pattern that we have chosen to simulate, all the nodes present have data to send.
Only the quantity of data at each node is varied. Thus PCF overhead is the smallest possible and it performs better, at least in terms of throughput. Results for delay are discussed in the following section. It is important to note that in our simulation conditions, the maximum throughput (totaled over all the nodes) cannot exceed 2Mbps, the capacity of a single station. This is because all the nodes can hear each other which means that only one node can be transmitting at a time.
The graph in Fig. 8 shows the effect of RTS/CTS on the throughput for different numbers of nodes. In the 16-node network with 500-byte packets we see that introducing RTS/CTS actually improves the throughput. The situation is exactly the opposite in the case of 8 nodes and 500 byte packets where the overhead of RTS/CTS costs more than it delivers, giving rise to lower throughputs. The savings in terms of reduction of collisions must balance the bandwidth overhead due to RTS/CTS. The former is larger for higher numbers of nodes and the latter is larger for smaller packets. This experiment was done for a fixed RTS/CTS threshold value of 250 bytes. Simulation

studies have typically tended to keep this threshold fixed at the recommended value of 250 bytes [3], irrespective of the number of nodes in the network. Theoretical studies [1] show that the optimal value of this threshold varies with the number of nodes in a network, reducing with increasing numbers of nodes (sharply for small networks of up to 15 nodes). Bianchi [1] recommends using 750 bytes as the threshold for 10 nodes.
Figure 8: Throughput with and without RTS/CTS for different numbers of nodes
4.2 Delay
In Fig.9 we compare the average delay behavior of DCF without RTS/CTS and PCF (solid lines) for a fixed packet size of 1500 bytes in a 16-node network. Initially at lower throughputs (and loads), the PCF mode has slightly higher delay (11ms relative to 8ms for DCF) because a station has to wait until it is polled before it can send data. As throughput increases, the DCF delays start to increase faster because of collisions and backoff. At about 70% throughput relative to channel rate the delays in PCF mode become smaller and stay small for a further range of throughputs (up to 80%), before growing uncontrollably as the station buffers fill up. Delay values for DCF with RTS/CTS are also shown in the same plot (dashed line). It gives delay behavior quite comparable to PCF.

Figure 9: Average delay (as a fraction of the channel rate of 2Mbps) in a 16-node network
The crossover point at which delay in PCF mode becomes smaller than delay in DCF mode has been suggested as the switching point from DCF mode to PCF mode [6]. The values for delay, which are of the order of 20 ms, and the value of throughput at which the crossover occurs are comparable with those obtained by Kopsel et al. [6]. The throughput plots corresponding to the delays in Fig.9 have been shown earlier in Fig. 7a. PCF has better throughput all through so the crossover must indeed be defined on the basis of delay values alone. The argument is not very convincing though because the values of delay at low throughputs are quite comparable (11ms and 8 ms). Only when DCF throughputs are also higher will the argument be convincing. This regime is yet to be explored.
The same three plots of delay for 8 nodes and 1500 byte packets are shown in Fig. 10 (solid
lines). When the number of stations is fewer, the difference in the delay values of the PCF and DCF modes at low throughputs is negligible and the argument for using PCF is very strong. The figure also shows the three delay plots for 500 byte packets (dashed lines) for the same 8 nodes. The interesting thing to note is the reversal in the roles of RTS/CTS. At 500 bytes the bandwidth overhead actually results in a reduction in throughput, but at 1500 bytes RTS/CTS gives an improvement in throughput over the basic DCF. This was also seen earlier in Fig.8. More RTS/CTS frames need to be sent for smaller packets, thus costing a larger fraction of the bandwidth.

Figure 10: Compar ison of delay for 8 nodes and 2 packet sizes, 1500 (solid lines) and 500 bytes
5.0 Conclusion and Future Work
We have obtained a detailed understanding of some of the factors affecting throughput and delay performance of IEEE 802.11 WLANs in the PCF mode as compared to the DCF mode. We have worked with a single hop ad hoc network as a first step towards understanding multi-hop ad hoc networks.
We have been able to explain most of our results for throughput as arising out of the particular traffic pattern that we have used for the simulation i.e., all nodes have data to send. This causes PCF to uniformly behave better in terms of throughput. We have not touched on the regime of light loads. We need to study this and quantify it in terms of the number of active users and other performance parameters.
The dependence of the PCF throughput on parameters like the length of the CFPMaxDuration and the CFP repetition interval are being studied for the first time. We intend to make a detailed study and quantify this variation more carefully.

Although our studies have shown that it is optimal to switch between DCF and PCF dynamically, based on load conditions, the IEEE 802.11 as it currently stands does not have any mechanism to do so. We will need a mechanism, which will augment the standard in the simplest way possible.
Acknowledgments
We would like to thank Srinath Perur and Krishna Paul for useful discussions and the referees of this paper for constructive criticism that led to improvements in the paper.
References
[1] Giuseppe Bianchi, Performance Analysis of the IEEE 802.11 Distributed Coordination Function, IEEE Journal on Selected Areas in Communications, March 2000 pp 535-547.
[2] Josh Broch, David A. Maltz David B. Johnson, Yih-Chun Hu and Jorjeta Jetcheva, A Performance Comparison of
Multi-hop Wireless ad hoc Networking Routing Protocols, Proceedings of Mobicom, October 1998. [3] Brain P. Crow, Indra Widjaja, Jeong Geun Kim and Prescott T. Sakai, IEEE 802.11 wireless Local Area Networks,
IEEE Communications Magazine, September 1997 pp 116-126. [4] IEEE Computer Society LAN MAN Standards Committee: Wireless LAN Medium Access Control (MAC) and Physical
Layer (PHY) Specifications, ANSI/IEEE Std. 802.11 1999 Edition, The Institute of Electrical and Electronic Engineers, New York.
[5] Kevin Fall and Kannan Varadhan editors, NS notes and documentation, http//www.isi.edu/nsnam/ns. [6] Andreas Kopsel, Jean-Pierre Ebert and Adam Wolisz, A Performance Comparison and Distributed Coordination
Function of an IEEE 802.11 WLAN in the Presence of Real-Time Requirements, Proceedings of the 7th Intl. Workshop on Mobile Multimedia Communications (MoMuC2000), October 2000.
[7] Anders Lindgren and Andreas Almquist, Implementation of the PCF mode of IEEE 802.11 for the NS-2 Network
Simulator, http://www.sm.luth.se/~dugdale/index/software.shtml
![Distributed Spectral Efficiency Optimization At Hotspots ... · Distributed Spectral Efficiency Optimization At ... the QoS and system wide throughput in WCS. ... HSDPA [6] and LTE](https://img.dokumen.tips/doc/110x75/5b1906037f8b9a3c258c4bb6/distributed-spectral-efficiency-optimization-at-hotspots-distributed-spectral.jpg)