Embed Size (px)
Citation preview
315 S Allen St Suite 416 | State College PA 16801 USA | +18148611299 phone | +18148611308 fax | salesremcomcom | wwwremcomcom
Electromagnetic Simulation Software
Throughput of a 5G New Radio FD-MIMO System in an Urban Area Using Custom Beamforming
Wireless InSitersquos Communication Systems Analysis module is a set of post-processing routines that builds on the X3D modelrsquos high-fidelity MIMO calculations to predict system throughput and bit error rate This example utilizes these routines to analyze throughput between three small-cell base stations employing Full Dimension (FD) MIMO beamforming to User Equipment (UE) moving along a route using 5G New Radio (NR) in a dense urban environment
Project Description
The building and foliage geometry was imported from a high resolution shapefile of geometry for a section of downtown Boston MA The imported city model foliage and the terrain contain a total of 6452 faces The buildings and terrain are assigned concrete material properties with conductivity of 0484 Sm and permittivity of 531 taken from ITU data for concrete at 28 GHz [1] [2] while foliage is modeled using a foliage penetration loss model by Weissberger [3]
Each transmitter represents a base station and uses an 8x8 dual polarized patch array consisting of a total of 128 elements Cross-polarized isotropic antennas are used at receiver locations along the route Wireless InSitersquos GPU-accelerated X3D model was used to provide high fidelity propagation results which include reflections from the buildings and terrain and diffractions from building edges The combination of high resolution geometry and high fidelity propagation modeling is necessary to achieve accurate results at 5G NR frequencies The propagation model calculates the H-matrix from each element of the three transmitters to the receiver locations (128 x 2 = 256 entries per tx-rx pair)
Figure 1 Isometric and overhead view of project geometry in Wireless InSite
315 S Allen St Suite 416 | State College PA 16801 USA | +18148611299 phone | +18148611308 fax | salesremcomcom | wwwremcomcom
Communication Systems Analyzer
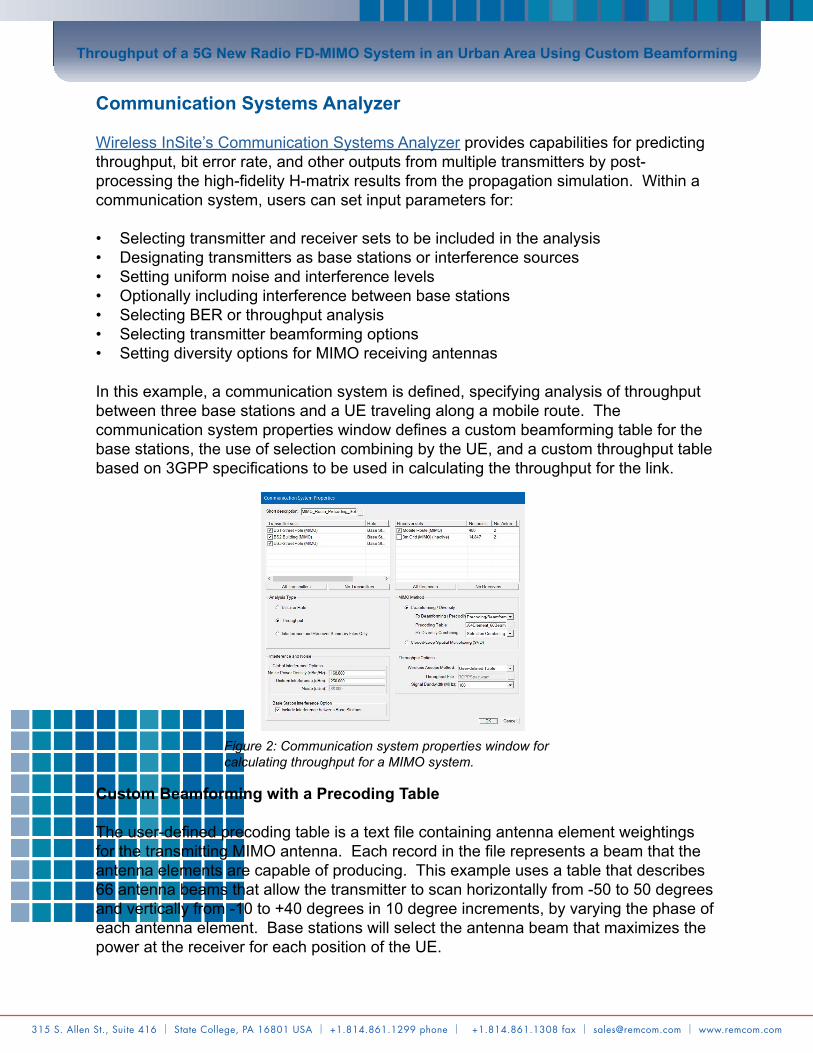
Wireless InSitersquos Communication Systems Analyzer provides capabilities for predicting throughput bit error rate and other outputs from multiple transmitters by post-processing the high-fidelity H-matrix results from the propagation simulation Within a communication system users can set input parameters for
bull Selecting transmitter and receiver sets to be included in the analysisbull Designating transmitters as base stations or interference sourcesbull Setting uniform noise and interference levelsbull Optionally including interference between base stationsbull Selecting BER or throughput analysisbull Selecting transmitter beamforming optionsbull Setting diversity options for MIMO receiving antennas
In this example a communication system is defined specifying analysis of throughput between three base stations and a UE traveling along a mobile route The communication system properties window defines a custom beamforming table for the base stations the use of selection combining by the UE and a custom throughput table based on 3GPP specifications to be used in calculating the throughput for the link
Custom Beamforming with a Precoding Table
The user-defined precoding table is a text file containing antenna element weightings for the transmitting MIMO antenna Each record in the file represents a beam that the antenna elements are capable of producing This example uses a table that describes 66 antenna beams that allow the transmitter to scan horizontally from -50 to 50 degrees and vertically from -10 to +40 degrees in 10 degree increments by varying the phase of each antenna element Base stations will select the antenna beam that maximizes the power at the receiver for each position of the UE
Throughput of a 5G New Radio FD-MIMO System in an Urban Area Using Custom Beamforming
Figure 2 Communication system properties window for calculating throughput for a MIMO system
315 S Allen St Suite 416 | State College PA 16801 USA | +18148611299 phone | +18148611308 fax | salesremcomcom | wwwremcomcom
Custom Throughput Analysis for a 5G NR Device
The throughput for the 5G NR device at the receiver also uses a custom file mapping SINR at the device to an achievable downlink data rate Throughput values for this table were calculated using the equation published in 3GPP TS 38306 v152 which calculates data rates for 5G NR for each potential modulation and coding scheme (MCS) and takes into account overhead for signaling and control and differences between uplink and downlink transmission [4] [5] Estimates were for a single component carrier with a 100 MHz bandwidth and assumed similar relationships between the achievable MCS and the SINR as has been observed for LTE
Results
Receiver Diversity
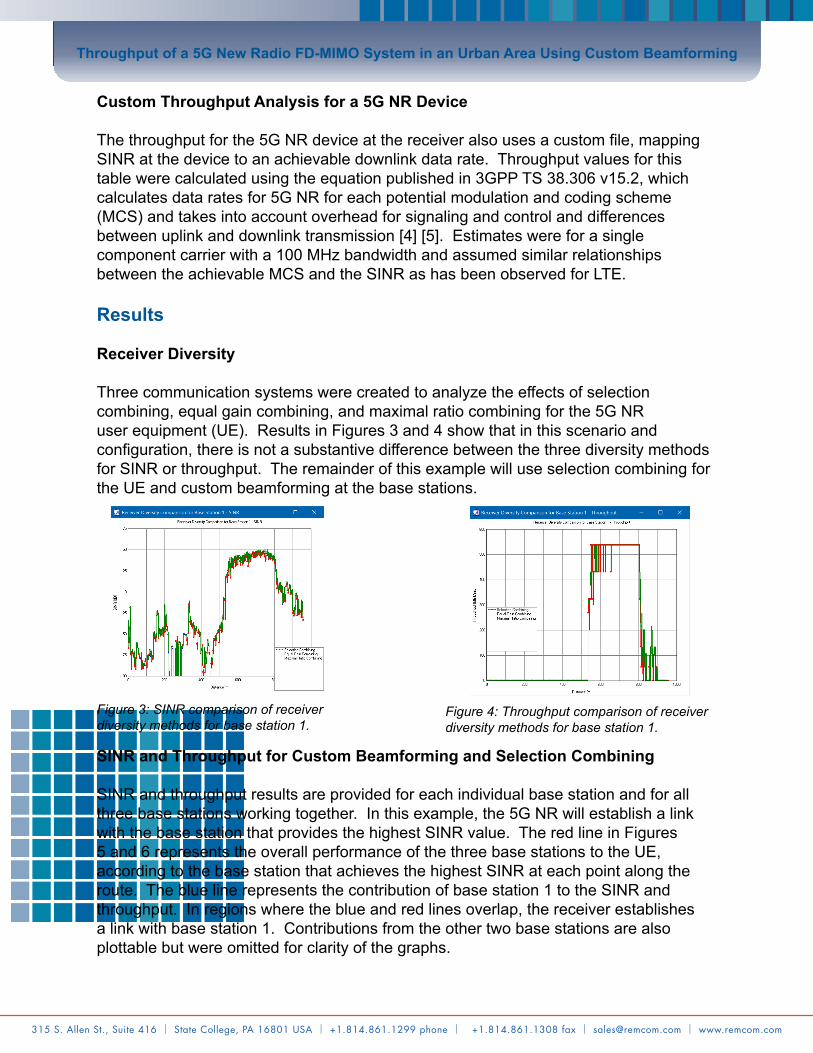
Three communication systems were created to analyze the effects of selection combining equal gain combining and maximal ratio combining for the 5G NR user equipment (UE) Results in Figures 3 and 4 show that in this scenario and configuration there is not a substantive difference between the three diversity methods for SINR or throughput The remainder of this example will use selection combining for the UE and custom beamforming at the base stations
SINR and Throughput for Custom Beamforming and Selection Combining
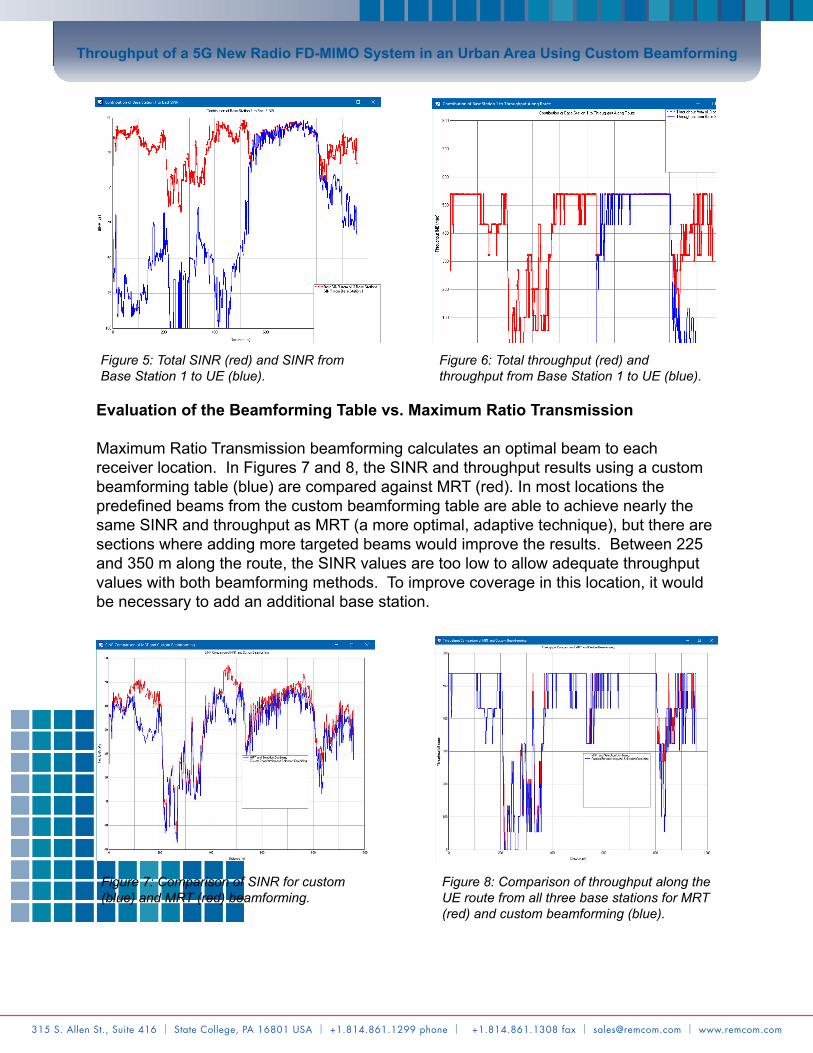
SINR and throughput results are provided for each individual base station and for all three base stations working together In this example the 5G NR will establish a link with the base station that provides the highest SINR value The red line in Figures 5 and 6 represents the overall performance of the three base stations to the UE according to the base station that achieves the highest SINR at each point along the route The blue line represents the contribution of base station 1 to the SINR and throughput In regions where the blue and red lines overlap the receiver establishes a link with base station 1 Contributions from the other two base stations are also plottable but were omitted for clarity of the graphs
Throughput of a 5G New Radio FD-MIMO System in an Urban Area Using Custom Beamforming
Figure 3 SINR comparison of receiver diversity methods for base station 1
Figure 4 Throughput comparison of receiver diversity methods for base station 1
315 S Allen St Suite 416 | State College PA 16801 USA | +18148611299 phone | +18148611308 fax | salesremcomcom | wwwremcomcom
Evaluation of the Beamforming Table vs Maximum Ratio Transmission
Maximum Ratio Transmission beamforming calculates an optimal beam to each receiver location In Figures 7 and 8 the SINR and throughput results using a custom beamforming table (blue) are compared against MRT (red) In most locations the predefined beams from the custom beamforming table are able to achieve nearly the same SINR and throughput as MRT (a more optimal adaptive technique) but there are sections where adding more targeted beams would improve the results Between 225 and 350 m along the route the SINR values are too low to allow adequate throughput values with both beamforming methods To improve coverage in this location it would be necessary to add an additional base station
Throughput of a 5G New Radio FD-MIMO System in an Urban Area Using Custom Beamforming
Figure 5 Total SINR (red) and SINR from Base Station 1 to UE (blue)
Figure 6 Total throughput (red) and throughput from Base Station 1 to UE (blue)
Figure 7 Comparison of SINR for custom (blue) and MRT (red) beamforming
Figure 8 Comparison of throughput along the UE route from all three base stations for MRT (red) and custom beamforming (blue)
315 S Allen St Suite 416 | State College PA 16801 USA | +18148611299 phone | +18148611308 fax | salesremcomcom | wwwremcomcom
Conclusion
Wireless InSitersquos Communication Systems Analyzer can be used to calculate throughput SINR and other system level quantities for realistic MIMO systems including both transmit beamforming and receiver diversity
This example demonstrates how a custom beamforming table can be used to model the dynamic behavior of three MIMO base stations in a section of Boston A custom throughput table was used to model downlink data rates for 5G New Radio Wireless InSitersquos X3D high fidelity ray tracing and MIMO capabilities allowed for efficient calculation of SINR and throughput
This example also demonstrates how built-in theoretical beamforming and receiver diversity options allow quick comparison of the throughput coverage provided by custom techniques
Remcomrsquos Communication Systems Analyzer provides network planners and equipment designers with the tools needed to evaluate base station location and estimate the throughput in realistic scenarios With the ability to incorporate custom beamforming and throughput rates users have the flexibility to design and assess new equipment and network configurations
Request project files for this example
Click to see the web version of this example
Request a free trial
Throughput of a 5G New Radio FD-MIMO System in an Urban Area Using Custom Beamforming
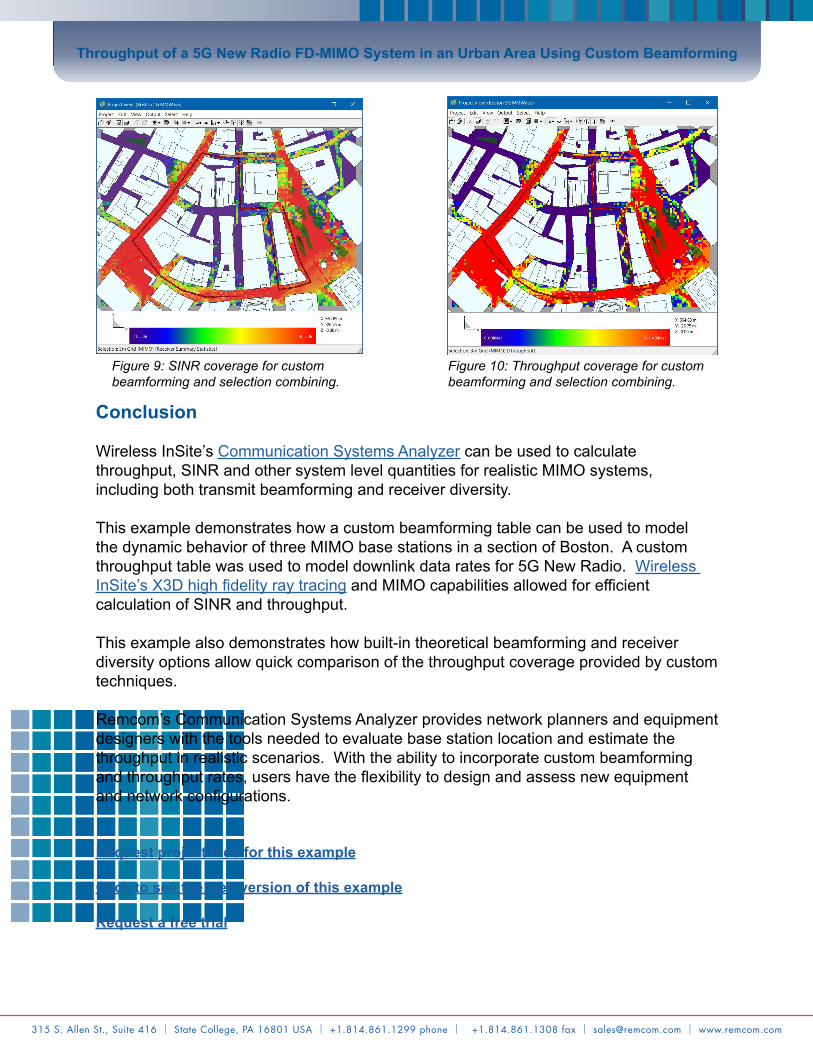
Figure 9 SINR coverage for custom beamforming and selection combining
Figure 10 Throughput coverage for custom beamforming and selection combining
315 S Allen St Suite 416 | State College PA 16801 USA | +18148611299 phone | +18148611308 fax | salesremcomcom | wwwremcomcom
Remcom Inc315 S Allen St Suite 416
State College PA 16801 USA
+18887 REMCOM (USCAN)+18148611299 phone+18148611308 fax
salesremcomcom
Visit wwwremcomcom for more information copy 2018 Rem
com Inc
All rights reserved
References
[1] ldquoElectrical characteristics of the surface of the earthrdquo Recommendation ITU-R P527-3 1992
[2] ldquoEffects of building materials and structures on radiowave propagation above about 100 MHzrdquo Recommendation ITU-R P2040-1 pp 22ndash23 July 2015
[3] M Weissberger ldquoAn Initial Critical Summary of Models for Predicting the Attenuation of Radio Waves by Treesrdquo 1982 Electromagnetic compatibility analysis center Annapolis Maryland Final report httpsappsdticmildtictrfulltextu2a118343pdf
[4] 3GPP TS 38306 V1520 [10] for 5G NR was used to calculate peak throughput based on the modulation order and coding rate
[5] G Skidmore ldquoUsing Modeling and Simulation to Assess Challenges and Solutions for 5G Fixed Wireless Accessrdquo
Throughput of a 5G New Radio FD-MIMO System in an Urban Area Using Custom Beamforming
315 S Allen St Suite 416 | State College PA 16801 USA | +18148611299 phone | +18148611308 fax | salesremcomcom | wwwremcomcom
Communication Systems Analyzer
Wireless InSitersquos Communication Systems Analyzer provides capabilities for predicting throughput bit error rate and other outputs from multiple transmitters by post-processing the high-fidelity H-matrix results from the propagation simulation Within a communication system users can set input parameters for
bull Selecting transmitter and receiver sets to be included in the analysisbull Designating transmitters as base stations or interference sourcesbull Setting uniform noise and interference levelsbull Optionally including interference between base stationsbull Selecting BER or throughput analysisbull Selecting transmitter beamforming optionsbull Setting diversity options for MIMO receiving antennas
In this example a communication system is defined specifying analysis of throughput between three base stations and a UE traveling along a mobile route The communication system properties window defines a custom beamforming table for the base stations the use of selection combining by the UE and a custom throughput table based on 3GPP specifications to be used in calculating the throughput for the link
Custom Beamforming with a Precoding Table
The user-defined precoding table is a text file containing antenna element weightings for the transmitting MIMO antenna Each record in the file represents a beam that the antenna elements are capable of producing This example uses a table that describes 66 antenna beams that allow the transmitter to scan horizontally from -50 to 50 degrees and vertically from -10 to +40 degrees in 10 degree increments by varying the phase of each antenna element Base stations will select the antenna beam that maximizes the power at the receiver for each position of the UE
Throughput of a 5G New Radio FD-MIMO System in an Urban Area Using Custom Beamforming
Figure 2 Communication system properties window for calculating throughput for a MIMO system
315 S Allen St Suite 416 | State College PA 16801 USA | +18148611299 phone | +18148611308 fax | salesremcomcom | wwwremcomcom
Custom Throughput Analysis for a 5G NR Device
The throughput for the 5G NR device at the receiver also uses a custom file mapping SINR at the device to an achievable downlink data rate Throughput values for this table were calculated using the equation published in 3GPP TS 38306 v152 which calculates data rates for 5G NR for each potential modulation and coding scheme (MCS) and takes into account overhead for signaling and control and differences between uplink and downlink transmission [4] [5] Estimates were for a single component carrier with a 100 MHz bandwidth and assumed similar relationships between the achievable MCS and the SINR as has been observed for LTE
Results
Receiver Diversity
Three communication systems were created to analyze the effects of selection combining equal gain combining and maximal ratio combining for the 5G NR user equipment (UE) Results in Figures 3 and 4 show that in this scenario and configuration there is not a substantive difference between the three diversity methods for SINR or throughput The remainder of this example will use selection combining for the UE and custom beamforming at the base stations
SINR and Throughput for Custom Beamforming and Selection Combining
SINR and throughput results are provided for each individual base station and for all three base stations working together In this example the 5G NR will establish a link with the base station that provides the highest SINR value The red line in Figures 5 and 6 represents the overall performance of the three base stations to the UE according to the base station that achieves the highest SINR at each point along the route The blue line represents the contribution of base station 1 to the SINR and throughput In regions where the blue and red lines overlap the receiver establishes a link with base station 1 Contributions from the other two base stations are also plottable but were omitted for clarity of the graphs
Throughput of a 5G New Radio FD-MIMO System in an Urban Area Using Custom Beamforming
Figure 3 SINR comparison of receiver diversity methods for base station 1
Figure 4 Throughput comparison of receiver diversity methods for base station 1
315 S Allen St Suite 416 | State College PA 16801 USA | +18148611299 phone | +18148611308 fax | salesremcomcom | wwwremcomcom
Evaluation of the Beamforming Table vs Maximum Ratio Transmission
Maximum Ratio Transmission beamforming calculates an optimal beam to each receiver location In Figures 7 and 8 the SINR and throughput results using a custom beamforming table (blue) are compared against MRT (red) In most locations the predefined beams from the custom beamforming table are able to achieve nearly the same SINR and throughput as MRT (a more optimal adaptive technique) but there are sections where adding more targeted beams would improve the results Between 225 and 350 m along the route the SINR values are too low to allow adequate throughput values with both beamforming methods To improve coverage in this location it would be necessary to add an additional base station
Throughput of a 5G New Radio FD-MIMO System in an Urban Area Using Custom Beamforming
Figure 5 Total SINR (red) and SINR from Base Station 1 to UE (blue)
Figure 6 Total throughput (red) and throughput from Base Station 1 to UE (blue)
Figure 7 Comparison of SINR for custom (blue) and MRT (red) beamforming
Figure 8 Comparison of throughput along the UE route from all three base stations for MRT (red) and custom beamforming (blue)
315 S Allen St Suite 416 | State College PA 16801 USA | +18148611299 phone | +18148611308 fax | salesremcomcom | wwwremcomcom
Conclusion
Wireless InSitersquos Communication Systems Analyzer can be used to calculate throughput SINR and other system level quantities for realistic MIMO systems including both transmit beamforming and receiver diversity
This example demonstrates how a custom beamforming table can be used to model the dynamic behavior of three MIMO base stations in a section of Boston A custom throughput table was used to model downlink data rates for 5G New Radio Wireless InSitersquos X3D high fidelity ray tracing and MIMO capabilities allowed for efficient calculation of SINR and throughput
This example also demonstrates how built-in theoretical beamforming and receiver diversity options allow quick comparison of the throughput coverage provided by custom techniques
Remcomrsquos Communication Systems Analyzer provides network planners and equipment designers with the tools needed to evaluate base station location and estimate the throughput in realistic scenarios With the ability to incorporate custom beamforming and throughput rates users have the flexibility to design and assess new equipment and network configurations
Request project files for this example
Click to see the web version of this example
Request a free trial
Throughput of a 5G New Radio FD-MIMO System in an Urban Area Using Custom Beamforming
Figure 9 SINR coverage for custom beamforming and selection combining
Figure 10 Throughput coverage for custom beamforming and selection combining
315 S Allen St Suite 416 | State College PA 16801 USA | +18148611299 phone | +18148611308 fax | salesremcomcom | wwwremcomcom
Remcom Inc315 S Allen St Suite 416
State College PA 16801 USA
+18887 REMCOM (USCAN)+18148611299 phone+18148611308 fax
salesremcomcom
Visit wwwremcomcom for more information copy 2018 Rem
com Inc
All rights reserved
References
[1] ldquoElectrical characteristics of the surface of the earthrdquo Recommendation ITU-R P527-3 1992
[2] ldquoEffects of building materials and structures on radiowave propagation above about 100 MHzrdquo Recommendation ITU-R P2040-1 pp 22ndash23 July 2015
[3] M Weissberger ldquoAn Initial Critical Summary of Models for Predicting the Attenuation of Radio Waves by Treesrdquo 1982 Electromagnetic compatibility analysis center Annapolis Maryland Final report httpsappsdticmildtictrfulltextu2a118343pdf
[4] 3GPP TS 38306 V1520 [10] for 5G NR was used to calculate peak throughput based on the modulation order and coding rate
[5] G Skidmore ldquoUsing Modeling and Simulation to Assess Challenges and Solutions for 5G Fixed Wireless Accessrdquo
Throughput of a 5G New Radio FD-MIMO System in an Urban Area Using Custom Beamforming
315 S Allen St Suite 416 | State College PA 16801 USA | +18148611299 phone | +18148611308 fax | salesremcomcom | wwwremcomcom
Remcom Inc315 S Allen St Suite 416
State College PA 16801 USA
+18887 REMCOM (USCAN)+18148611299 phone+18148611308 fax
salesremcomcom
Visit wwwremcomcom for more information copy 2018 Rem
com Inc
All rights reserved
References
[1] ldquoElectrical characteristics of the surface of the earthrdquo Recommendation ITU-R P527-3 1992
[2] ldquoEffects of building materials and structures on radiowave propagation above about 100 MHzrdquo Recommendation ITU-R P2040-1 pp 22ndash23 July 2015
[3] M Weissberger ldquoAn Initial Critical Summary of Models for Predicting the Attenuation of Radio Waves by Treesrdquo 1982 Electromagnetic compatibility analysis center Annapolis Maryland Final report httpsappsdticmildtictrfulltextu2a118343pdf
[4] 3GPP TS 38306 V1520 [10] for 5G NR was used to calculate peak throughput based on the modulation order and coding rate
[5] G Skidmore ldquoUsing Modeling and Simulation to Assess Challenges and Solutions for 5G Fixed Wireless Accessrdquo
Throughput of a 5G New Radio FD-MIMO System in an Urban Area Using Custom Beamforming