Embed Size (px)
Citation preview
Fall and Winter 2012 Volume 10, Number 2
Journal of Organizational Learning and Leadership 68
Through Different Perspectives on Leadership: Comparing the Full Range Leadership
Theory to Implicit Leadership Theories
Heiko Verlage
Jens Rowold
TU Dortmund University
Jan Schilling
University of Applied Administrative Sciences Hannover, Germany
Abstract
According to constructivist tradition, leadership is understood as a phenomenon of subjective
perception. With this in mind, we compared empirical theories of leadership with subjective
leadership theories (Phillips & Lord, 1986; Calder, 1977). A sample of leaders' superiors and
followers (N = 694) answered the Multifactor Leadership Questionnaire which is associated to
the Full Range of Leadership Theory (FRLT, Avolio & Bass, 1991). Additionally, the participants
gave insight into their implicit leadership theories by answering open questions. The analysis of
implicit leadership theories resulted in 17 categories of leadership traits and behaviors which are
not covered by the FRLT. Some new categories show significant correlations with leadership
outcome measures. In this regard the new categories explain unique variance beyond the
dimensions of the FRLT. The results, limitations and implications are discussed.
"Leadership researchers may find that certain aspects of leadership are commonly understood or
inferred (as indicated by their presence in implicit leadership theories) that are not taken
into account in current theories and models of leadership. The study of implicit theories can
provide clues that will help in the development of explicit theories to understand the
phenomenon called leadership." (Offermann, Kennedy, & Wirtz, 1994, p. 45).
The full range of leadership theory (FRLT; Avolio & Bass, 1991; House, 1977; Burns, 1978; Bass,
1985) is one of the best known exponents of the currently discussed neocharismatic leadership
theories. One of the theory’s central elements consists in the description of transformational
leadership: Leaders motivate their followers by, for example, presenting an appealing vision of
future, satisfying their followers’ needs or encouraging their creativity (Bass & Riggio, 2006).
Nevertheless, there is criticism of the leadership behavior styles as described within the theory. It has
been argued that the FRLT lacks some parts of the "full range", i.e. several important factors of
leadership may still have to be included (Antonakis & House, 2004; Yukl, 1999). Offermann, Kennedy
& Wirtz (1994) point out that the analysis of implicit leadership theories could lead to the
identification of additional leadership factors which have not yet been considered. The present
paper contributes to the discussion about identifying additional, important leadership factors.
The examination of implicit leadership theories (ILT) of leaders’ followers and supervisors results in
traits and behavior styles of leadership which correlate with measures of leadership effects. Overall,
the goal was to extend current thinking on leadership and to add additional elements to the
FRLT.
Fall and Winter 2012 Volume 10, Number 2
Journal of Organizational Learning and Leadership 69
Review of Full Range of Leadership Research
The full range of leadership theory postulates five transformational and three transactional factors
of leadership. Additionally there is another factor which represents the absence of leadership (i.e.,
laissez-faire, Bass & Riggio, 2006).
The dimensions of transformational leadership are characterized by a high leadership efficacy and an
intensive activity of the leader (Judge & Piccolo, 2004). Inspirational motivation describes leader
behavior which is based on an optimistic and enthusiastic way of communicating a vision to the
followers. The job to be done should not be felt as an obligation but as a challenge. Idealized
influence (attributed) refers to the degree to which followers attribute positive traits (e.g. charisma) to
their leader. Idealized influence (behavior) represents a set of leadership behaviors which is based on
high ethical standards in combination with a distinct achievement motive. Intellectual stimulation
describes the leadership behavior a leader shows to involve followers in decision making processes.
The leader emphasizes innovation and creativity in this behavior mode particularly. If followers make
mistakes during the creative process of solving problems, they are not criticized in front of their
colleagues (Bass & Riggio, 2006). Individualized consideration means promoting the followers’
career development and meeting their individual needs.
Compared to the dimensions of transformational leadership, those of transactional leadership share
lower leadership efficacy. Among the transactional dimensions contingent reward is theoretically the
most effective one. It describes a more or less implicit contract between leader and follower, as, in
exchange for the work done by the follower, the leader promises a reward. This can consist in
material boni, but also in verbal praising. Active management-by-exception is the label of
leadership behavior which is shown by leaders who interfere only to prevent failure of their followers
or to avert deviations from designated standards. In contrast, management-by-exception passive
describes leaders who intervene after mistakes have occurred to limit possible damage (Rowold,
2005).
Many empirical studies have concluded that transformational leadership correlates with leadership
efficacy and follower satisfaction (Smith, Matkin, & Fritz, 2004; House & Aditya, 1997; Judge &
Piccolo, 2004; Rowold & Heinitz, 2007), around the globe and across organizational contexts (Bass
& Riggio, 2006).
Implicit Leadership Theories
The scientific construct of implicit theories (or naive theories) originates from the attribution
theory (Heider, 1944) and from the theory of personal constructs (Kelly, 1955). Both theories
focus on the subjective perception of everyday life. As the phenomenon of leadership also belongs
to everyday life, Eden & Leviatan (1975) and Calder (1977) introduced the construct of implicit
theories into leadership research (q.v. Hollander & Julian, 1969). Lührmann (2004) refers to this as
a cognitive, constructivist turnaround, because the basic principle of implicit leadership theories
clarifies that the way in which leaders and their performance are perceived depends on the
cognitive processing of the observer (Yammarino, Dionne, Chun, & Dansereau, 2005):
“[L]eadership is in the eye of the beholder” (Kenny, Blascovich, & Shaver, 1994, p. 409).
Schilling (2001) defines implicit leadership theories as a subcategory of implicit theories which
refer to leaders and the process of leadership. This definition combines two aspects of implicit
leadership theories which had been treated separately in the past: The first aspect consists in
Fall and Winter 2012 Volume 10, Number 2
Journal of Organizational Learning and Leadership 70
implicit leadership theories in the function of categorization processes. In this case, implicit
prototypes lead to the individual decision whether a person is perceived as a leader or not,
dependent on the perception of the observed person’s traits (Phillips & Lord, 1986; Lührmann,
2004; House & Aditya, 1997). The second aspect refers to the process of leadership itself: In this
context implicit leadership theories are patterns of explanation in regard to causes and effects of
leadership behavior and results (Kenny et al., 1994).
Implicit leadership theories “help to organize perceptions, permit reasonable predictions, and may
even specify appropriate behavioral reactions to others” (Phillips & Lord, 1986, p. 34), so they
function as cognitive simplifications in everyday leadership contexts. The possibility of a biased (i.e.,
scheme-congruent) perception of leadership is only one factor in how implicit leadership theories
may affect leadership processes. Additionally, implicit leadership theories themselves are part
of the dyadic leadership process: The better the behavior shown by a leader fits to the implicit
leadership theories of the followers, the more they evaluate their leader’s efficacy in his/her
favor, and furthermore a higher quality of the leader-member-exchange (LMX) can be observed
(Epitropaki & Martin, 2004; Schyns & Hansbrough, 2008).
This finding becomes even more important when one considers that many leaders do their job in
an international context, leading internationally composed teams. The question comes up whether
there exist cultural similarities and differences concerning implicit leadership theories. A well
known research activity in this field of science is the GLOBE study which was conducted in more
than 900 organizations worldwide (House, Hanges, Javidan, Dorfman, & Gupta, 2004). One of its
key results was the finding that charismatic leadership is seen as a good leadership style worldwide
and seems to be a solid component of implicit leadership theories held by leaders (Dickson, Den
Hartog, & Mitchelson, 2003; Den Hartog, House, Hanges, & Ruiz-Quintanilla, 1999; Steyrer,
Schiffinger, & Lang, 2007; Schilling, 2008).
To conclude, implicit leadership theories hold that leadership could be described as a phenomenon
of perception (Schilling, 2001). Consequently, a statement of requirements was formulated: “If
leadership resides, at least in part, in the minds of followers, then it is imperative to discover what
followers are thinking“ (Lord & Emrich, 2001, p. 551), because we need to know more about the
construction of leadership perception so that we can finally learn about leadership itself.
Exploratory Research Objectives
In the past years a few studies have been published examining both the FRLT and the concept of
implicit leadership theories. In most cases the studies were seeking to answer the question whether
charismatic/transformational leadership is an international leadership ideal (e.g. Den Hartog et al.,
1999). These and other studies examining the FRLT and implicit leadership theories in
combination are still few and far between. Utilizing implicit leadership theories, the goal of the
present paper is to contribute to the examination and further development of the FRLT.
Given the overall goal (i.e., to examine and extend the FRLT), we plan to formulate explorative
research objectives (c.f. Früh, 2001) instead of hypotheses. First, Yukl (1999) argues the FRLT
discounted critical behavioral patterns of leadership. The analysis of implicit leadership theories may
help to identify leadership behaviors and leaders’ traits that are individually perceived as being
important to the process of leadership. The collective structure of the data to be examined leads to
inferences that exceed the individual level of analysis. Thus, the first explorative research objective
consists in the following question: Do any components of implicit leadership theories exist that are not

Fall and Winter 2012 Volume 10, Number 2
Journal of Organizational Learning and Leadership 71
already taken into account by the FRLT (Research objective 1)?
If the first research objective turns out to be answered positively, the question arises whether
the identified components of implicit leadership theories are relevant to organizational
effectiveness. More specifically, do they add significant, unique variance to account for leadership
outcome criteria (Research objective 2)?
Methods
For the purpose of the present study, a 360°-feedback survey was utilized in various German
profit and non-profit organizations. The participating organizations were heterogeneous:
telecommunications enterprises and call center service providers took part in this study as well
as research facilities, schools and other kinds of organization. The goal of the 360°-feedback
survey was to provide managers with feedback about their respective individual leadership
strengths and weaknesses and thus to promote their development. Executive managers, their
subordinates, supervisors and peers were asked to fill out the survey. The survey focused on
managers’ leadership behavior (MLQ, see below).
Sample
A data set included N = 694 persons. Hereof, N = 544 (78.4 %) persons belong to the group
of the managers’ subordinates and N = 150 (21.6 %) to the group of the managers’
supervisors. There were 51.4 % male and 48.6 % female executive managers. Due to
concerns of anonymity of the subordinates and supervisors, additional demographic
characteristics were not available.
Survey: Multifactor Leadership Questionnaire (MLQ)
The standard instrument to measure the dimensions of the FRLT is the Multifactor Leadership
Questionnaire (Bass & Avolio, 1992). The theoretically intended (Avolio & Bass, 1991) nine-
dimensional factor structure has been confirmed in Anglo-American countries (e.g. Antonakis,
Avolio, & Sivasubramaniam, 2003; Bass & Riggio, 2006) as well as in Germany (Rowold &
Rohmann, 2009; Rowold & Rohmann, 2008).
Rowold’s (2004) German translation of the MLQ-5X was utilized in the present study. It was
administered to the participants as a paper and pencil questionnaire and consists of 45 items.
Hereof, 36 items form (in groups of 4 items each) the nine FRLT scales described above which
constitute the following three categories of leadership styles: transformational leadership
(inspirational motivation, idealized influence [attributed], idealized influence [behavior], intellectual
stimulation, individualized consideration), transactional leadership (contingent reward, active
management-by-exception, management-by-exception passive) and laissez-faire. The remaining
items form three outcome scales named extra effort (3 items), effectiveness (4 items) and satisfaction
(2 items). The participants answer the items via a five-point Likert scale (not at all – once in a while
– sometimes – fairly often – frequently, if not always).
Additionally, there are three items attached to the questionnaire which are formulated as open
questions, i.e. they are presented without standardized response options: What are two or three
things that would help this leader be more effective? One thing that gets in the way of this leader's
effectiveness is... What I admire most about his/her leadership is...
Fall and Winter 2012 Volume 10, Number 2
Journal of Organizational Learning and Leadership 72
Although these open items are not part of the MLQ in a theoretical perspective, they were added by
Bass & Avolio (2002) to its commercially distributed version, because the open items were useful
for executive development. In the context of the present study, these items were used for
gathering implicit leadership theories. While the items are focused at a specific leader on the
individual level, the aggregated answers (i.e. across the subjects in this study) to these questions
reveal common thinking and everyday beliefs concerning (effective) leadership. In the present study
we analyzed the data of (a) the managers’ subordinates and (b) of the managers’ supervisors.
The managers themselves did not have the chance to enter qualitative data. Finally, the inclusion of
data from the colleagues’ perspective would not be in line with the majority of leadership research as
they are typically not concerned with their peer’s leadership.
Applied Methods of Qualitative Data Analysis
Within the present study, Mayring's (1994) principle of qualitative data analysis was used in
combination with quantitative statistical methods. First, the participants’ answers had to be made
anonymous. Names of persons and organizations were removed from the data. In the same
procedural step we excluded answers which did not deliver any content (i.e. if there was nothing more
than e.g. “????”, “No answer”, “I don’t know” etc.). The result consisted in what we defined as
qualitative raw data that was to be inspected in the course of analysis.
The second procedural step included different kinds of qualitative content analysis. Mayring (2003)
defines three different basic types of qualitative content analysis. We made use of two of them:
summarizing and structuring content analysis. The summarizing type describes the process of
reducing and abstracting qualitative data so that the result is less bulky but still contains the
essential pieces of information of the original data. The structuring type of content analysis is
used to examine certain aspects of qualitative data material. Developing a category system
inductively means arranging data in categories which arise gradually during the process of analysis.
The opposite method is to apply a category system deductively, i.e. using a given category
system for the analysis right from the start (Mayring, 2000).
We began the actual content analysis using the summarizing type first. Before the start, a codebook
was written which contained explicit rules for summarizing to provide a systematic approach for
processing the given qualitative data. The codebook defined the steps of analysis and their
sequence to ensure the maximum reduction in arbitrariness. In the course of the summarizing
content analysis the participants’ statements were paraphrased, i.e. those parts of each
statement which did not deliver much or any information were excluded while the relevant
elements were rephrased, shortened and unified to the same level of linguistic complexity. In
the same step the statements’ different units of meaning were identified and referred to as coding
units. The paraphrased coding units were semantically generalized to a medium level of abstraction.
Finally, we reduced the number of elements by excluding those coding units which were
unimportant in respect of the research objectives. The decision whether a coding unit had to be
excluded or not was made in reference to definite rules: Schilling (2001) formulated criteria of
implicit leadership theories of which two are applicable in the present study. After the wording
had been adjusted the criteria were used as rules to reduce the number of coding units. In each
case, the fulfillment of both criteria was required to exclude the respective coding unit: (1) Content
criterion regarding the research topic: Only those coding units are relevant to the subsequent analysis
which refer to the nature or functionality of leadership; (2) Pragmatic action-related criterion:
Coding units must refer to a greater or lesser extent directly to a leader’s actions to be relevant
Fall and Winter 2012 Volume 10, Number 2
Journal of Organizational Learning and Leadership 73
for the present study.
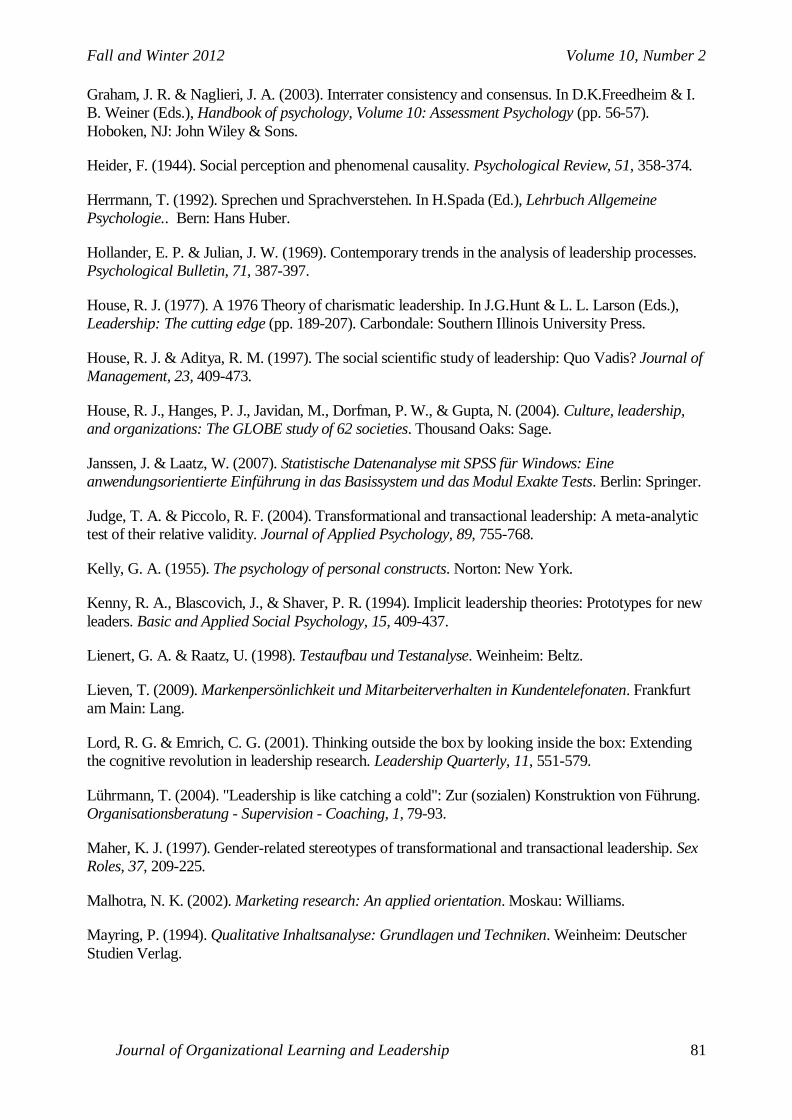
Because of the huge amount of qualitative data, the steps of generalization and reduction took
place in parallel, as described by Schilling (2001). A practical insight into the process conducted in
summarizing content analysis is provided in Table 1 by showing an exemplary extract of the data
along with the different steps of the procedure. The output of the summarizing content analysis
was checked by the analyst and one additional research team member in order to test (a) whether
the paraphrases had been formulated adequately, (b) whether the generalizations did not change
the meanings of the paraphrased coding units, and (c) whether the exclusion of coding units
conformed to the rules (Schilling, 2006). The result of the summarizing content analysis consisted
in definite and distinct elements concerning leadership for subsequent analyses.
Categorizing Data
After the summarizing content analysis had been finished, we used its results to conduct a
structuring content analysis. The identified coding units had to be arranged in a category system. In
consideration of the first research objective, we followed a deductive approach and used a category
system that consisted in the nine aspects of leadership as postulated by the FRLT. Again, a
codebook was written at the beginning. It explained the coding process and contained short
descriptions of the nine leadership categories (together with their codes a1 – a9). The
descriptions were similar to the ones written by Avolio, Bass & Jung (1999). To guarantee a
categorization process that was conducted as closely as possible to the theoretical assumptions
of the FRLT, the codebook contained the corresponding MLQ items as model examples for each
leadership category. Concerning the categorization process, the codebook explicitly
suggested that the reader should perceive each category as distinct dimensions. Consequently,
coding units which meant exactly the opposite of a particular category description, had also to be
assigned to this very category, if both coding unit and category dealt with the same basic aspect
of leadership: If there was a coding unit like e.g. to offer opportunities to communicate, it had to be
aligned to the ninth category (laissez-faire), because this aspect of leadership deals (among other
issues) with leadership behavior of (not) staying in contact to followers.
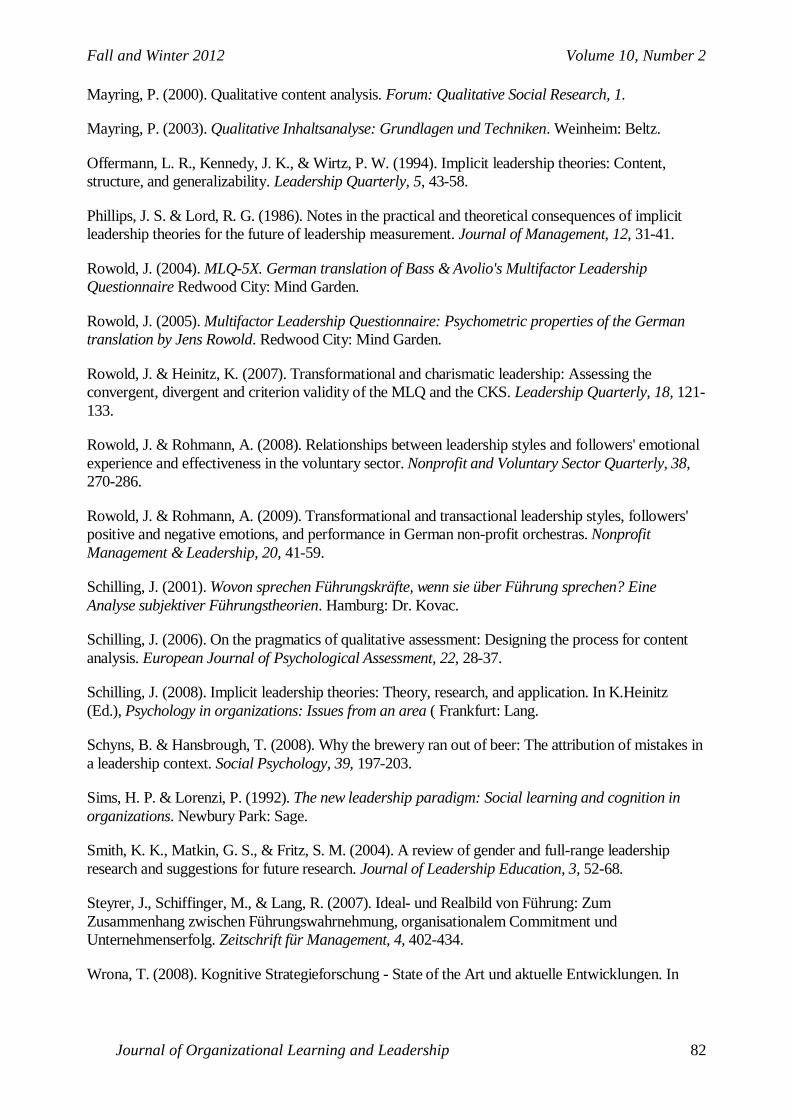
Additional to the nine FRLT-categories there was a category (coded as a10) for miscellaneous
content, i.e. for coding units which did not fit into the nine theoretical categories. Table 2 shows an
example of coding units which were assigned to different
categories.
Intercoder Reliability
A comparison between the experimenter’s coding outcomes and the results of a coding assistant
was drawn to control the categorization process quality. For this purpose, Früh (2001) states that
30-50 coding units should be re-coded at a minimum, but he recommends an amount of 200-300
coding units. A stratified random sample of the participants was drawn consisting of 15
supervisors and 55 subordinates. This sample was the source of 251 coding units out of the entire
qualitative data.
The coding assistant was blind to the research objectives. She was trained to use the written code
book and to handle the deductive categorization process via software. Subsequently, and
independently of the experimenter, she conducted the deductive structuring content analysis by
re-coding the coding units of the drawn sample.
Fall and Winter 2012 Volume 10, Number 2
Journal of Organizational Learning and Leadership 74
Inductive structuring content analysis: Emerging categories
The category system of the applied deductive structuring content analysis contained a category
for miscellaneous content as aforementioned (a10). To organize the heterogeneous content of
this category we conducted an inductive structuring content analysis for the above-named
category. As done in the processes of the prior content analyses, a codebook was written to
define the actions to be executed (e.g. repeated control steps). After the inductive categorization
had been completed, the coding team was requested to discuss the coding units’ allocation to the
developed categories (while adhering to the code book) and to think through these new
categories themselves. The team discussions at the end of the analysis processes led to the final
state of the category systems for each one of the inductive content analyses.
Linking the New Categories to Assessed Manager’s Parameter Values
Concerning the attempt to validate the new categories of the inductive categorization process,
neither the rated managers nor the participants were available to generate data. Consequently,
we had to switch to an indirect way of generating the necessary data: To evaluate the
managers’ parameter values regarding the new categories, a frequency-based approach was
used: The more a manager was described by raters/coding units (coded as miscellaneous in the
first deductive categorization) which had been assigned to a certain new category (within the
inductive categorization), the higher we estimated his or her parameter value regarding this
special new category. To account for the fact that there were different numbers of raters per
manager, neither absolute nor relative quantities were adequate to describe the managers’
parameter values. Instead, we used a bipolar four point Likert scale. It consisted of the points very
low, low, high, very high. There was an additional point called unclear. An instruction was written
to guide the experimenters through the process of analysis. In particular, the instruction explained
how to use the aforementioned scale: If there was more than one rater whose coding units indicated
a certain level of parameter value regarding a certain new category, the respective manager was
graded as very high / very low in terms of this category. If there was only one rater whose coding
units indicated a certain level of parameter value regarding a certain new category, the respective
manager was (only) graded as high / low in terms of this category. If there was not any information
about the parameter value of a particular new category, the respective manager had to be graded as
unclear regarding this new category. In case of (inter- or intra-individual) contradictions the
instruction told the experimenter to code the managers’ parameter values in accordance with the
opinion held by the majority of the ratings. If a majority did not exist, the respective category had to
be graded as unclear. After this process of generating data had been finished, two members of the
research team checked the entire new data material for mistakes due to the possibility of incorrect
scale use.
Results
The total volume of quantitative data originating from the MLQ includes 8.4 % missing data. We
did not exclude single participants due to high amounts of missing data, because we did not want to
reduce the extent of the qualitative data artificially.
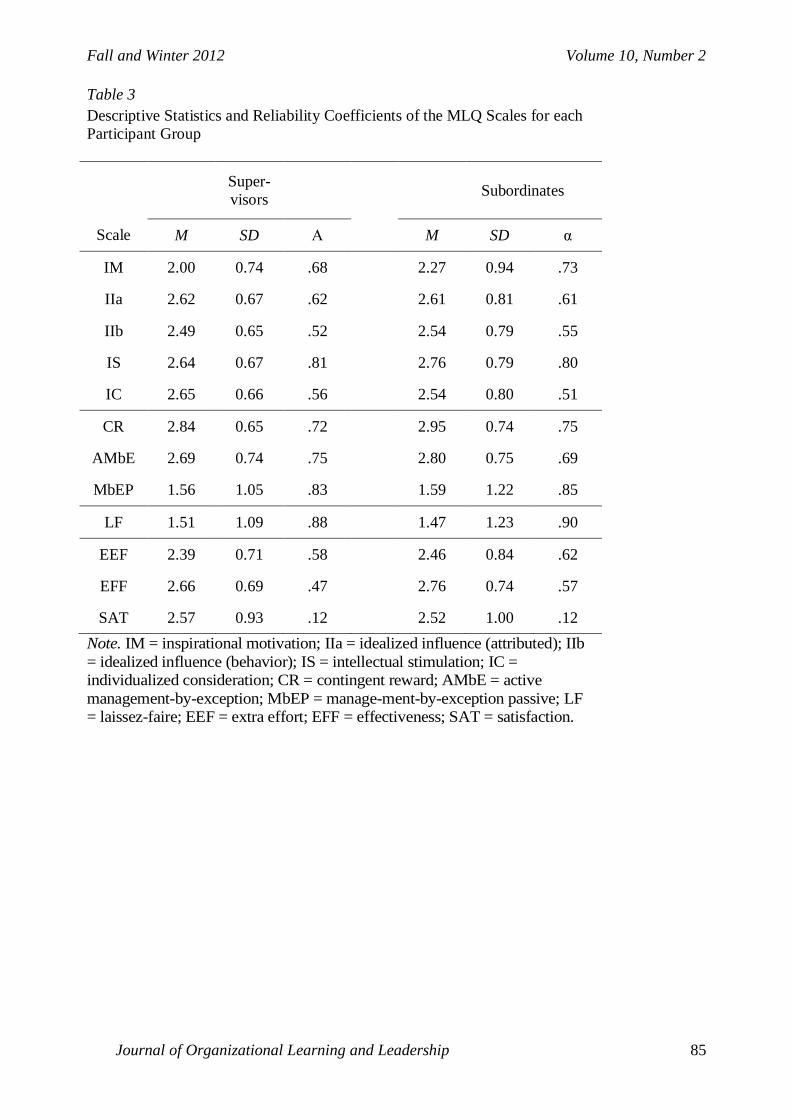
The means, standard deviations and Cronbach’s alpha coefficients of the MLQ scales are
presented in Table 3. Obviously, the alpha coefficients are very heterogeneous and are ranging
from α = .12 (satisfaction) to α = .90 (laissez-faire). According to conventions, we excluded the
Fall and Winter 2012 Volume 10, Number 2
Journal of Organizational Learning and Leadership 75
MLQ outcome scale satisfaction from further analyses, because its alpha coefficient was below α =
.50 in both of the participant groups. The MLQ outcome scale effectiveness also shows a low alpha
coefficient. In the supervisors’ participant group the coefficient (α = .47) is below the
aforementioned limit. Nevertheless, scales with less than four items often have low reliabilities
(especially in sample sizes below N = 500), and should not be excluded from further analyses
(Cortina, 1993; Charter, 2003).
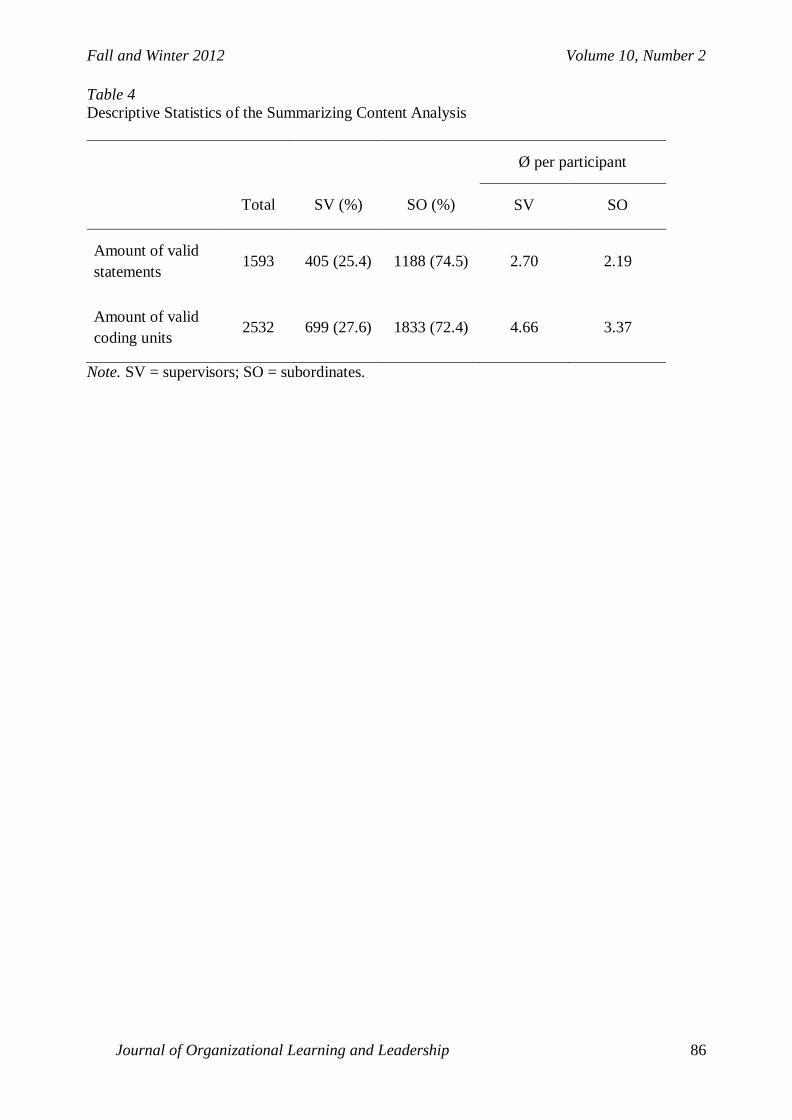
Considering the qualitative data, there was a possible maximum of 2082 statements (694
participants multiplied by 3 open questions). In 22 cases a question remained completely
unanswered (1.1 % of the possible maximum). 467 (22.7 %) of the actual 2060 answers were
excluded because of lacking informative content. The remaining 1593 statements entered the
process of the summarizing content analysis where they were split into 2688 coding units. Hereof
156 coding units (5.8 %) were excluded due to not meeting the defined criteria of implicit
leadership theories. On average each supervisor introduced 4.66 coding units to the subsequently
conducted structuring content analyses, while the subordinates produced 3.37 coding units on
average (see Table 4).
Cohen’s kappa was calculated to check the quality of the deductive structuring content analysis.
This coefficient, as used in the present study, expresses the degree of congruence between the coding
outcomes of the experimenter and his research assistant concerning the drawn stratified sample of
the qualitative data. Kappa coefficients of K ~ .60 are commonly considered as good, K ~ .75 as
very good (Graham & Naglieri, 2003). For the deductive categorization a kappa coefficient of K = .77
was calculated, indicating a very good coding quality.
Descriptive Statistics
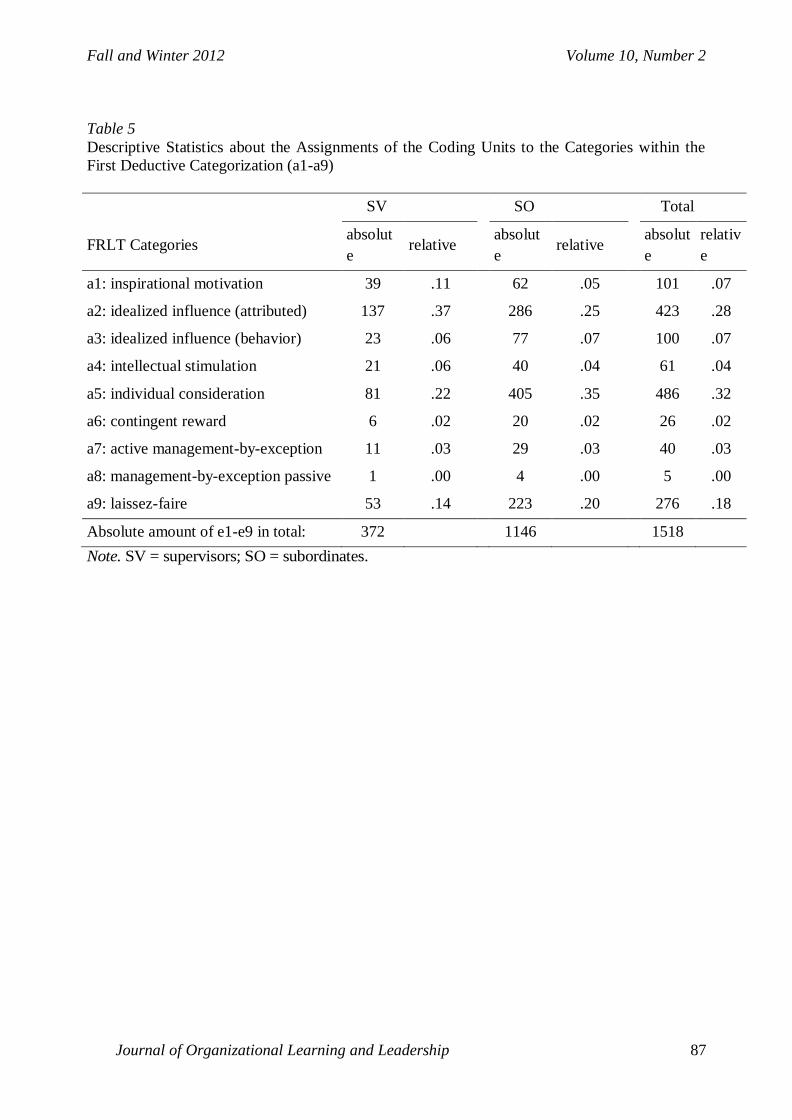
The first deductive categorization was about assigning the 2532 available coding units to the nine
categories as taken from the FRLT leadership dimensions, while the tenth category (miscellaneous,
a10) was reserved for not categorizable coding units. The descriptive statistics show the
extensiveness of the miscellaneous category in both of the participant groups in a clear way: 327
coding units (46.8 %) originating from the supervisors’ group and 687 coding units (37.5 %) from
the subordinates’ group included content differing qualitatively from the FRLT categories and had
to be coded as miscellaneous.
Big differences stand out in analyzing the frequencies of the FRLT codes a1-a9 (see Table 5 and
Figure 1). The issues of the FRLT categories idealized influence (attributed), individualized
consideration, and laissez-faire were broached most frequently by the participants. In contrast,
contingent reward, management-by-exception active and passive show very low occurrence.
Results and Further Analyses of the Inductive Categorizations
The miscellaneous category (a10) of the first deductive structuring content analysis contained a total
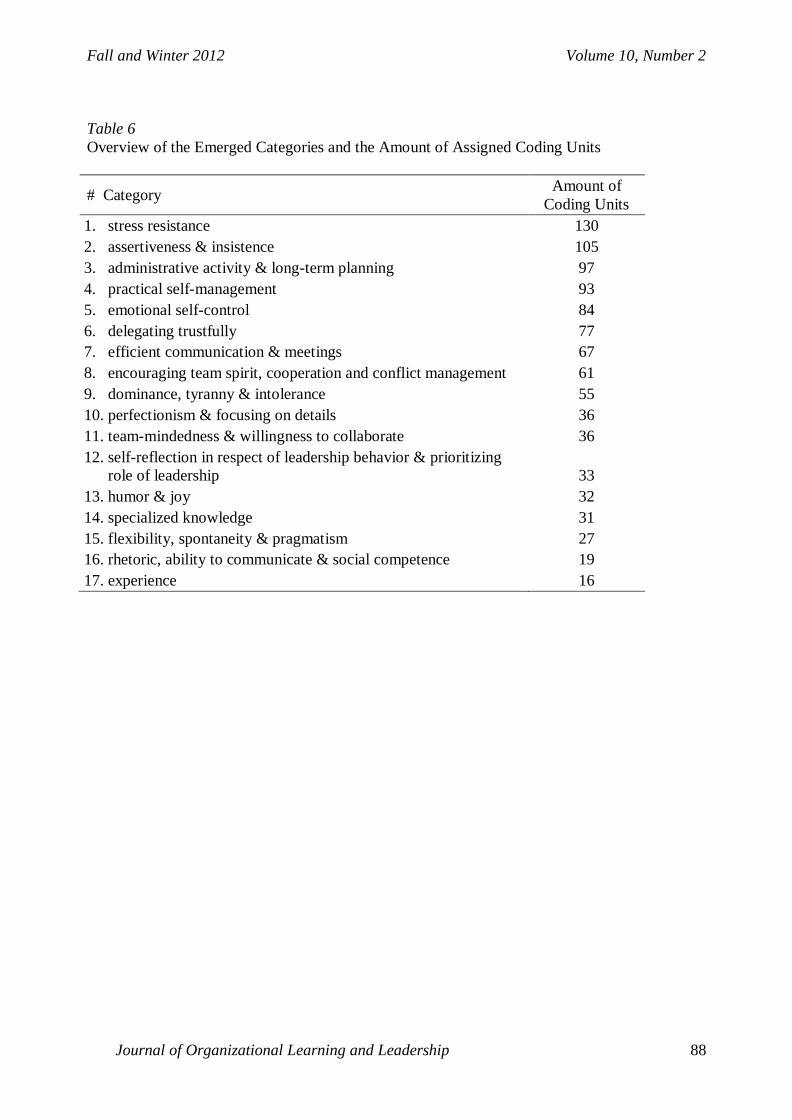
sum of 1014 coding units. These were sorted within the process of the inductive structuring content
analysis. The categorization led to 19 different categories aside the FRLT. We decided that a
category should consist of at least 15 coding units to be relevant for subsequent analyses.
According to this criterion, we excluded the category creativity and the comparatively unspecific
category performing leadership tasks, because each of them contained only six coding units. A
total of 3 coding units represented single deviant meanings and could not be assigned to any of

Fall and Winter 2012 Volume 10, Number 2
Journal of Organizational Learning and Leadership 76
the other categories. They were also not considered in the continued course of this study. To
present the final 17 new categories together with their main contents we refer to Schilling’s (2006)
recommendation of using concept maps for visualizing results of qualitative content analyses (see
Figure 2). Additionally, Table 6 offers an overview of the categories which emerged and the
number of assigned coding units.
Validating the New Categories
The process of generating the managers’ parameter values regarding the new categories required
1785 scaling trials (105 managers multiplied by 17 categories). This approach resulted in many
missing values. According to the rules of the written instructions, the applied principle of
generating data led to leaving parameter values unclear if the qualitative data did not clearly indicate
a single point of the scale we used. In 1250 (70 %) scaling trials we assigned unclear parameter
values to the managers while 535 (30 %) parameter values were non-ambiguous in terms of the
written guidelines. Among the 105 managers there was 1 person (0.95 %) whose parameter
values were all identified as unclear. Regarding the other 104 managers (99.05 %) the scaling
process resulted in at least one non-ambiguous parameter value per person (M = 5.08, SD = 2.66).
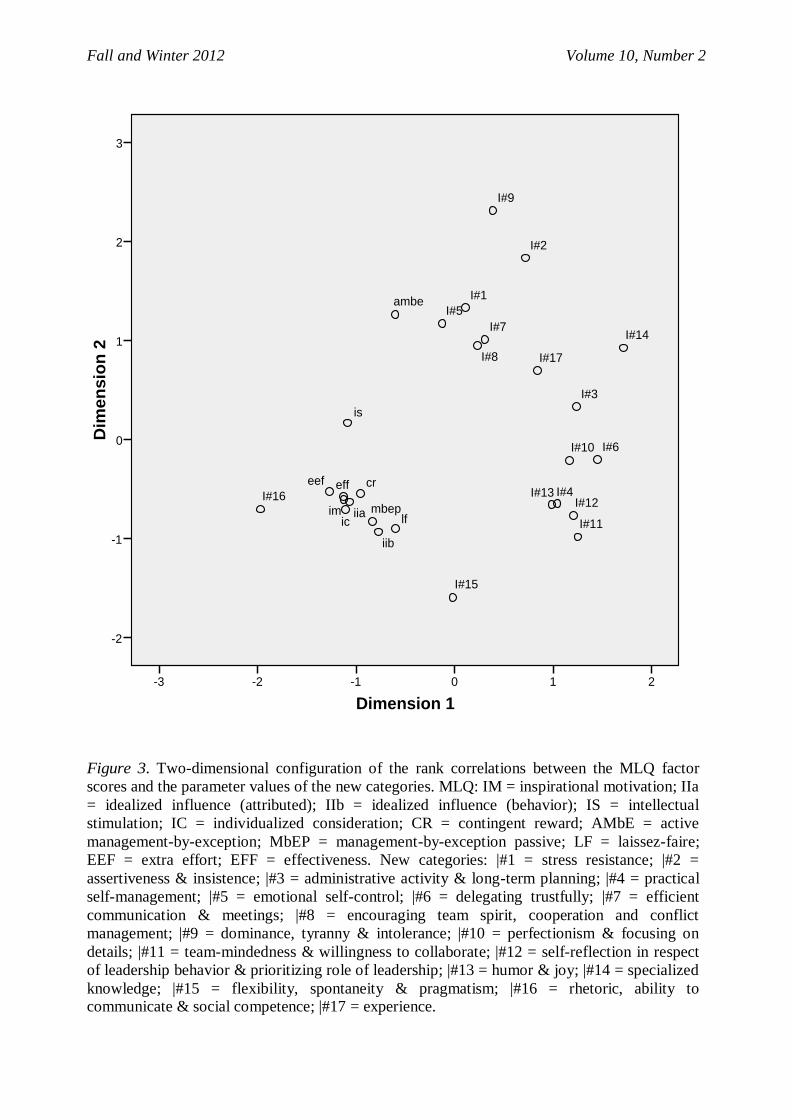
We used multidimensional scaling (MDS) to analyze the generated data. Janssen & Laatz (2007)
recommend this method particularly in cases of explorative studies; it is especially regarded as
useful in the field of management research (Wrona, 2008). First we calculated the rank
correlations (Spearman’s rho) between the managers’ parameter values [in the newly emerged
categories and their MLQ factor scores (averaged about each manager’s raters), as presented in
Table 7. The results were used as input into an ordinally scaled MDS. The standard quality
criterion for MDS analyses is called stress, expressing the mismatch between the coordinate
configuration of the MDS and the ranking of the similarities. According to conventions presented by
Bortz & Döring (2006), the resulting two-dimensional scaling proves to be of a moderate quality
(stress = 0.17). An additional criterion for the adequacy of the MDS results is the extent of explained
variance (RSQ, R²). Although no definite thresholds for acceptable RSQs exist, most authors agree
that the MDS should be within the range RSQ ≥ .60 (Malhotra, 2002) to RSQ ≥ .90 (Lieven, 2009).
The RSQ coefficient of the resulting two-dimensional scaling meets these requirements (RSQ =
.86).
While analyzing the results of the MDS (see Figure 3) it is not obligatory to interpret the dimensions
themselves (e.g., Ekman, 1954). In an ordinally-scaled MDS it is more important to interpret the
relations of the shown constructs to each other than to the dimensions. The entire structure of the
two-dimensionally positioned constructs looks slightly rhomboid. This indicates a multitude of
only weak correlations which, consequently, result in big distances between most of the shown
constructs. The structure mainly consists of three clusters. Most factors of transformational
leadership are located close to each other because of high intercorrelations. The outcome scales
extra effort and effectiveness can be found among these dimensions, too. In contrast, the factors of
transactional leadership are comparatively scattered: Contingent reward is positioned closest to the
transformational constructs, while management-by-exception passive is between contingent reward
and laissez-faire. Active management-by-exception is integrated into another accumulation
consisting of stress resistance, emotional self-control, encouraging team spirit, cooperation and
conflict management as well as efficient communication & meetings. These categories allow an
effective functioning of the leader in cooperation with the followers even in situations of stress,
conflicts, problems and mistakes.
Fall and Winter 2012 Volume 10, Number 2
Journal of Organizational Learning and Leadership 77
The content of the third main accumulation (self-reflection in respect of leadership behavior &
prioritizing role of leadership, humor & joy, practical self-management as well as team-mindedness &
willingness to collaborate) appears to be quite heterogeneous, but in contrast to the aforementioned
accumulation, these elements have in common that they refer more to the leader’s character and
less to the leader’s function in the followers’ context. Consequently, the adjacently positioned
category perfectionism & focusing on details is in line with this accumulation. The last named
category forms the intersection to a low-density combination implying the categories delegating
trustfully, administrative activity & long-term planning as well as experience and specialized
knowledge. They represent leadership behaviors and traits which play an important role in the day-
to-day work of leaders and describe the essence of leadership in a very basal way.
Interestingly, the distance between the new category rhetoric, ability to communicate & social
competence and the factors of transformational leadership, respectively, was small. The category
dominance, tyranny & intolerance is positioned as a peculiar outsider and seems to be antipodal
to the factors of transformational leadership. This constellation is obviously caused by strikingly
negative correlations between the new category dominance, tyranny & intolerance and all
transformational leadership styles plus contingent reward (see Table 7)
As shown in Table 7, there are some significant correlations between the managers’ parameter values
regarding the new categories and the outcome scales effectiveness and extra effort measured by the
MLQ. According to this there is a coherence between the ability to practice efficient communication
& meetings and the perceived leadership effectiveness (ρ = .34). Regarding the willingness for extra
effort we found a positive correlation with the new category rhetoric, ability to communicate & social
competence (ρ = .61) while the category dominance, tyranny & intolerance shows a negative
correlation (ρ = - .46). Additionally, we want to point to the negative correlation between practical self-
management and extra effort (ρ = -.32).
Regression analyses were conducted to determine if variance in criteria of effective leadership could be
explained by the new categories. For a conservative test, stepwise regression was applied: In the first
step, the transactional leadership scales and laissez-faire were utilized to explain variance in the criteria
of effective leadership (i.e. extra effort and effectiveness), respectively. Next, transformational
leadership was utilized in the second step. Finally, in the third step, it was tested whether the new
categories explained incremental variance in the criteria of effective leadership, over and above
transactional and transformational leadership scales and laissez-faire. Table 8 displays the
unstandardized and standardized regression coefficients.
Transactional leadership and laissez-faire explained 58% of variance in extra effort, and 73% in
effectiveness, respectively. In the second step, transformational leadership accounted for 12%
additional variance in extra effort and for 8% additional variance in effectiveness. The new leadership
categories explained 3% of incremental variance in both extra effort and effectiveness. All these
incremental amounts of variance were significant (p ≤ .01). Apparently, the new categories of
leadership account for variances in criteria of leadership effectiveness that were hitherto untapped by
the FRLT.
Discussion
The present study aimed at identifying effective leadership styles that are not included in the FRLT, the
current most dominant leadership theory. Interestingly, 17 categories of leadership were extracted from
an extensive data set.
Fall and Winter 2012 Volume 10, Number 2
Journal of Organizational Learning and Leadership 78
The first research objective implied an examination of implicit leadership theories to identify aspects
of leadership which have not hitherto been covered by the FRLT. In the deductive structuring
content analysis more than a third of the coding units could not be assigned to one of the nine FRLT
categories, but had to be assigned to the miscellaneous category. This is a clear indication of the
high number of different leadership aspects which can be identified in implicit leadership theories.
Finally, 17 new categories of leadership behavior and traits resulted from an inductive structuring
content analysis. An MDS indicated that these new categories were distinct from the nine well-
established MLQ subscales.
Several of these new leadership styles correlated with outcome measures of the MLQ. This is true
for the new categories efficient communication & meetings and rhetoric, ability to communicate & social
competence as well as dominance, tyranny & intolerance and practical self-management. Counter-
intuitively, the last named category correlates negatively with the MLQ outcome scale extra effort.
This result remains unclear until further research is conducted.
Comparing the findings of this study with other findings we would especially like to point to a study
reported by Sims & Lorenzi (1992). The authors describe research on prototypical
characterizations of good and poor managers (as described by managers). Among Sims &
Lorenzi’s (1992) results are some characterizations which are similar to 7 of the 17 new
categories found in the present study. Each of the new categories administrative activity & long-
term planning, assertiveness & insistence, perfectionism & focusing on details, delegating trustfully,
humor & joy as well as rhetoric, ability to communicate & social competence and team-mindedness &
willingness to collaborate have one to two equivalents in Sims and Lorenzi's study. Furthermore,
these authors presented the category of self-management. This can be associated with the new
categories practical self-management and self-reflection in respect of leadership behavior &
prioritizing role of leadership in the present study.
The FRLT has often been criticized for not considering certain aspects of leadership.
Yukl (1999) states the FRLT lacked task behaviors (like clarifying and planning) and relations
behaviors (like team building). Antonakis et al. (2003) point to the fact that the FRLT does not
contain a construct of strategic leadership. The absence of these leadership aspects results in the
necessity of assigning the respective coding units to the new categories efficient communication
& meetings (clarifying), administrative activity & longterm planning (planning, strategic leadership)
and encouraging team spirit, cooperation and conflict management (team building). According to
Antonakis et al. (2003) , the authors of the FRLT wanted to limit the range of leadership aspects
covered, because this limitation allowed them to examine the leadership aspects involved more
intensively. We think this view should be reconsidered, given the fact that in the present study a
large part of the participants’ statements could not be assigned to any of the FRLT dimensions.
For instance, Antonakis & House (2004) postulate the construct instrumental leadership and
explicitly discuss it as an extension of the FRLT. This construct adds four new dimensions to the
FRLT (among them the already named dimension of strategic leadership). With the goal of
complementing the FRLT in mind, this approach should be considered positively.
With regard to criterion validity, it could be demonstrated that the new categories accounted for
incremental and unique variance in the MLQ outcome scales extra effort and effectiveness, over
and above the nine dimensions of the FRLT. Thus, the new categories of leadership are not only
relevant from a theoretical perspective, but also for practitioners. Consequently, the new categories
seem to be organizationally relevant and should be considered for further investigation.
Fall and Winter 2012 Volume 10, Number 2
Journal of Organizational Learning and Leadership 79
Sample and Generalizability
Consisting of 694 participants, the sample size is large enough to deliver results of interest.
Nevertheless, the proportions of the group sizes are not equal: Many more subordinates were
involved in the study compared to the number of supervisors. This turned out due to the
hierarchical organizational structures and could not be changed without varying the basic study
design.
The participants worked in different German profit and non-profit organizations. Consequently, the
results can be generalized to various organizations in Germany. Cause for concern about the
representativeness might arise from the fact that we had to delete almost one quarter of the
participants’ statements due to lacks of informative content. If one considers that the statements
were given as answers to open questions which were asked after the participants had already
answered the 45 items of the MLQ, this does not seem to be unusual.
Limitations and Directions for Future Research
With regard to the research objectives, this study was conducted exploratively. Consequently, all
results are to be regarded as preliminary and descriptive findings (Früh, 2001). Smith et al. (2004)
point out that there are differences between implicit leadership theories of men and women. Thus,
men have similar implicit leadership theories for male and female leaders while women associate
active leadership behavior more to prototypical female than to prototypical male leaders (Maher,
1997). Because of matters of anonymity we cannot form any conclusions in the present study
about sex-related differences.
While the reliability coefficient of the outcome scale effectiveness was not critical in the
subordinates’ participant group, it was insufficient in the supervisors’ participant group. Nevertheless we
decided to keep this scale, because the coefficient barely missed α ≥ .50 - according to Lienert &
Raatz (1998) a minimum for group comparisons - and the comparability of the results would have
suffered from another scale exclusion. Originally, the MLQ was not designed for supervisors
assessing managers who are in a hierarchically lower position. This could have caused the low
alpha coefficients of the supervisors’ participant group compared to the subordinates.
The present study mixes traits and behaviors within the new categories of leadership, but in the
long term of leadership research, traits and behaviors should be analyzed separately. Yukl (2002)
criticizes the fact that many theoretical models of leadership still confound traits and behavior. A clear
conceptual separation of behavior and traits makes very good sense on account of the resulting clear-
cut interpretations and non-ambiguous options for a professional human resource management.
In conclusion, the findings of this study give cause for optimism that the analysis of implicit leadership
theories may prove useful to enhance leadership theories and practice.
References
Antonakis, J., Avolio, B. J., & Sivasubramaniam, N. (2003). Context and leadership: An examination
of the nine-factor full-range leadership theory using the Multifactor Leadership Questionnaire.
Leadership Quarterly, 14, 261-295.
Antonakis, J. & House, R. (2004). On instrumental leadership: Beyond transactions and
Fall and Winter 2012 Volume 10, Number 2
Journal of Organizational Learning and Leadership 80
transformations. Omaha: UNL Gallup Leadership Institute Summit.
Avolio, B. J., Bass, B. M., & Jung, D. I. (1999). Re-examining the components of transformational
and transactional leadership using the Multifactor Leadership Questionnaire. Journal of Occupational
and Organizational Psychology, 72, 441-462.
Bass, B. M. (1985). Leadership and performance beyond expectations. New York: Free Press.
Bass, B. M. & Avolio, B. J. (1992). Transformational leadership development: Manual for the
Multifactor Leadership Questionnaire. Palo Alto, CA: Consulting Psychologist Press.
Bass, B. M. & Avolio, B. J. (2002). Multifactor Leadership Questionnaire Feedback Report
Redwood City, CA: Mindgarden.
Bass, B. M. & Riggio, R. E. (2006). Transformational Leadership. Mahwah: Lawrence Erlbaum
Associates.
Bortz, J. & Döring, N. (2006). Forschungsmethoden und Evaluation für Human- und
Sozialwissenschaftler. Heidelberg: Springer.
Burns, J. M. (1978). Leadership. New York: Harper & Row.
Busch, M. W. (2008). Kompetenzsteuerung in Arbeits- und Innovationsteams: Eine
gestaltungsorientierte Analyse. Wiesbaden: Gabler.
Calder, B. J. (1977). An attribution theory of leadership. In B.Staw & B. Salancik (Eds.), New
Directions in Organizational Behavior (pp. 179-204). Chicago: St. Clair Press.
Charter, R. A. (2003). Study samples are too small to produce sufficiently precise reliability
coeffcients. The Journal of General Psychology, 130, 117-129.
Cortina, J. M. (1993). What is coefficient alpha? An examination of theory and applications. Journal
of Applied Psychology, 78, 98-104.
Den Hartog, D. N., House, R. J., Hanges, P. J., & Ruiz-Quintanilla, S. A. (1999). Culture specific and
cross-culturally generalizable implicit leadership theories: are attributes of charismatic/
transformational leadership universally endorsed? Leadership Quarterly, 10, 219-256.
Dickson, M. W., Den Hartog, D. N., & Mitchelson, J. K. (2003). Research on leadership in a cross-
cultural context: Making progress, and raising new questions. Leadership Quarterly, 14, 729-768.
Eden, D. & Leviatan, U. (1975). Implicit leadership theory as a determinant of the factor structure
underlying supervisory behavior scales. Journal of Applied Psychology, 60, 736-741.
Ekman, G. (1954). Dimensions of color vision. Journal of Psychology, 38, 467-474.
Epitropaki, O. & Martin, R. (2004). Implicit leadership theories in applied settings: Factor structure,
generalizability, and stability over time. Journal of Applied Psychology, 89, 293-310.
Früh, W. (2001). Inhaltsanalyse: Theorie und Praxis. Konstanz: UVK.
Fall and Winter 2012 Volume 10, Number 2
Journal of Organizational Learning and Leadership 81
Graham, J. R. & Naglieri, J. A. (2003). Interrater consistency and consensus. In D.K.Freedheim & I.
B. Weiner (Eds.), Handbook of psychology, Volume 10: Assessment Psychology (pp. 56-57).
Hoboken, NJ: John Wiley & Sons.
Heider, F. (1944). Social perception and phenomenal causality. Psychological Review, 51, 358-374.
Herrmann, T. (1992). Sprechen und Sprachverstehen. In H.Spada (Ed.), Lehrbuch Allgemeine
Psychologie.. Bern: Hans Huber.
Hollander, E. P. & Julian, J. W. (1969). Contemporary trends in the analysis of leadership processes.
Psychological Bulletin, 71, 387-397.
House, R. J. (1977). A 1976 Theory of charismatic leadership. In J.G.Hunt & L. L. Larson (Eds.),
Leadership: The cutting edge (pp. 189-207). Carbondale: Southern Illinois University Press.
House, R. J. & Aditya, R. M. (1997). The social scientific study of leadership: Quo Vadis? Journal of
Management, 23, 409-473.
House, R. J., Hanges, P. J., Javidan, M., Dorfman, P. W., & Gupta, N. (2004). Culture, leadership,
and organizations: The GLOBE study of 62 societies. Thousand Oaks: Sage.
Janssen, J. & Laatz, W. (2007). Statistische Datenanalyse mit SPSS für Windows: Eine
anwendungsorientierte Einführung in das Basissystem und das Modul Exakte Tests. Berlin: Springer.
Judge, T. A. & Piccolo, R. F. (2004). Transformational and transactional leadership: A meta-analytic
test of their relative validity. Journal of Applied Psychology, 89, 755-768.
Kelly, G. A. (1955). The psychology of personal constructs. Norton: New York.
Kenny, R. A., Blascovich, J., & Shaver, P. R. (1994). Implicit leadership theories: Prototypes for new
leaders. Basic and Applied Social Psychology, 15, 409-437.
Lienert, G. A. & Raatz, U. (1998). Testaufbau und Testanalyse. Weinheim: Beltz.
Lieven, T. (2009). Markenpersönlichkeit und Mitarbeiterverhalten in Kundentelefonaten. Frankfurt
am Main: Lang.
Lord, R. G. & Emrich, C. G. (2001). Thinking outside the box by looking inside the box: Extending
the cognitive revolution in leadership research. Leadership Quarterly, 11, 551-579.
Lührmann, T. (2004). "Leadership is like catching a cold": Zur (sozialen) Konstruktion von Führung.
Organisationsberatung - Supervision - Coaching, 1, 79-93.
Maher, K. J. (1997). Gender-related stereotypes of transformational and transactional leadership. Sex
Roles, 37, 209-225.
Malhotra, N. K. (2002). Marketing research: An applied orientation. Moskau: Williams.
Mayring, P. (1994). Qualitative Inhaltsanalyse: Grundlagen und Techniken. Weinheim: Deutscher
Studien Verlag.
Fall and Winter 2012 Volume 10, Number 2
Journal of Organizational Learning and Leadership 82
Mayring, P. (2000). Qualitative content analysis. Forum: Qualitative Social Research, 1.
Mayring, P. (2003). Qualitative Inhaltsanalyse: Grundlagen und Techniken. Weinheim: Beltz.
Offermann, L. R., Kennedy, J. K., & Wirtz, P. W. (1994). Implicit leadership theories: Content,
structure, and generalizability. Leadership Quarterly, 5, 43-58.
Phillips, J. S. & Lord, R. G. (1986). Notes in the practical and theoretical consequences of implicit
leadership theories for the future of leadership measurement. Journal of Management, 12, 31-41.
Rowold, J. (2004). MLQ-5X. German translation of Bass & Avolio's Multifactor Leadership
Questionnaire Redwood City: Mind Garden.
Rowold, J. (2005). Multifactor Leadership Questionnaire: Psychometric properties of the German
translation by Jens Rowold. Redwood City: Mind Garden.
Rowold, J. & Heinitz, K. (2007). Transformational and charismatic leadership: Assessing the
convergent, divergent and criterion validity of the MLQ and the CKS. Leadership Quarterly, 18, 121-
133.
Rowold, J. & Rohmann, A. (2008). Relationships between leadership styles and followers' emotional
experience and effectiveness in the voluntary sector. Nonprofit and Voluntary Sector Quarterly, 38,
270-286.
Rowold, J. & Rohmann, A. (2009). Transformational and transactional leadership styles, followers'
positive and negative emotions, and performance in German non-profit orchestras. Nonprofit
Management & Leadership, 20, 41-59.
Schilling, J. (2001). Wovon sprechen Führungskräfte, wenn sie über Führung sprechen? Eine
Analyse subjektiver Führungstheorien. Hamburg: Dr. Kovac.
Schilling, J. (2006). On the pragmatics of qualitative assessment: Designing the process for content
analysis. European Journal of Psychological Assessment, 22, 28-37.
Schilling, J. (2008). Implicit leadership theories: Theory, research, and application. In K.Heinitz
(Ed.), Psychology in organizations: Issues from an area ( Frankfurt: Lang.
Schyns, B. & Hansbrough, T. (2008). Why the brewery ran out of beer: The attribution of mistakes in
a leadership context. Social Psychology, 39, 197-203.
Sims, H. P. & Lorenzi, P. (1992). The new leadership paradigm: Social learning and cognition in
organizations. Newbury Park: Sage.
Smith, K. K., Matkin, G. S., & Fritz, S. M. (2004). A review of gender and full-range leadership
research and suggestions for future research. Journal of Leadership Education, 3, 52-68.
Steyrer, J., Schiffinger, M., & Lang, R. (2007). Ideal- und Realbild von Führung: Zum
Zusammenhang zwischen Führungswahrnehmung, organisationalem Commitment und
Unternehmenserfolg. Zeitschrift für Management, 4, 402-434.
Wrona, T. (2008). Kognitive Strategieforschung - State of the Art und aktuelle Entwicklungen. In
Fall and Winter 2012 Volume 10, Number 2
Journal of Organizational Learning and Leadership 83
T.Wrona (Ed.), Strategische Managementforschung (pp. 44-83). Wiesbaden: Gabler.
Yammarino, F. J., Dionne, S. D., Chun, J. U., & Dansereau, F. (2005). Leadership and levels of
analysis: A state-of-the-science review. Leadership Quarterly, 16, 879-919.
Yukl, G. (1999). An evaluative essay on current conceptions of effective leadership. European
Journal of Work and Organizational Psychology, 8, 33-48.
Yukl, G. (2002). Leadership in organizations. (5th ed.) Upper Saddle River, NJ: Prentice Hall.
Table 1.
Example of the Summarizing Content Analysis Process, from Raw Data to Generalized and
Reduced Coding Units
Raw data
Paraphrases
(incl. identification of the
coding units)
Generalizing & Reduction
Answer to the first
question:
“Being more often on
the spot, giving
insight into her tasks,
so you can show more
understanding for
each other.”
to be on the spot to be present in the team
to give insight into one’s tasks to keep one’s work
transparent for employees
Answer to the second
question:
“Competitors from
other departments
who grant her nothing,
and loafers who do
nothing else but to
denounce”
Competitors [excluded]
Loafers [excluded]
Fall and Winter 2012 Volume 10, Number 2
Journal of Organizational Learning and Leadership 84
Table 2.
Exemplary View of Coded Coding Units within the First Deductive
Structuring Content Analysis
Coding Unit Code
Consistent e2
To treat all employees equally e3
Leadership on a par with employees e10
To be geared to ethical values e3
To want to control all situations e7
Note. e2 = idealized influence (attributed); e3 = idealized influence (behavior); e7 = active
management-by-exception; e10 = miscellaneous.
Fall and Winter 2012 Volume 10, Number 2
Journal of Organizational Learning and Leadership 85
Table 3
Descriptive Statistics and Reliability Coefficients of the MLQ Scales for each
Participant Group
Scale
Super-
visors
Subordinates
M SD Α M SD α
IM 2.00 0.74 .68 2.27 0.94 .73
IIa 2.62 0.67 .62 2.61 0.81 .61
IIb 2.49 0.65 .52 2.54 0.79 .55
IS 2.64 0.67 .81 2.76 0.79 .80
IC 2.65 0.66 .56 2.54 0.80 .51
CR 2.84 0.65 .72 2.95 0.74 .75
AMbE 2.69 0.74 .75 2.80 0.75 .69
MbEP 1.56 1.05 .83 1.59 1.22 .85
LF 1.51 1.09 .88 1.47 1.23 .90
EEF 2.39 0.71 .58 2.46 0.84 .62
EFF 2.66 0.69 .47 2.76 0.74 .57
SAT 2.57 0.93 .12 2.52 1.00 .12
Note. IM = inspirational motivation; IIa = idealized influence (attributed); IIb
= idealized influence (behavior); IS = intellectual stimulation; IC =
individualized consideration; CR = contingent reward; AMbE = active
management-by-exception; MbEP = manage-ment-by-exception passive; LF
= laissez-faire; EEF = extra effort; EFF = effectiveness; SAT = satisfaction.
Fall and Winter 2012 Volume 10, Number 2
Journal of Organizational Learning and Leadership 86
Table 4
Descriptive Statistics of the Summarizing Content Analysis
Total
SV (%)
SO (%)
Ø per participant
SV SO
Amount of valid
statements 1593 405 (25.4) 1188 (74.5) 2.70 2.19
Amount of valid
coding units 2532 699 (27.6) 1833 (72.4) 4.66 3.37
Note. SV = supervisors; SO = subordinates.
Fall and Winter 2012 Volume 10, Number 2
Journal of Organizational Learning and Leadership 87
Table 5
Descriptive Statistics about the Assignments of the Coding Units to the Categories within the
First Deductive Categorization (a1-a9)
SV SO Total
FRLT Categories absolut
e relative
absolut
e relative
absolut
e
relativ
e
a1: inspirational motivation 39 .11 62 .05 101 .07
a2: idealized influence (attributed) 137 .37 286 .25 423 .28
a3: idealized influence (behavior) 23 .06 77 .07 100 .07
a4: intellectual stimulation 21 .06 40 .04 61 .04
a5: individual consideration 81 .22 405 .35 486 .32
a6: contingent reward 6 .02 20 .02 26 .02
a7: active management-by-exception 11 .03 29 .03 40 .03
a8: management-by-exception passive 1 .00 4 .00 5 .00
a9: laissez-faire 53 .14 223 .20 276 .18
Absolute amount of e1-e9 in total: 372 1146 1518
Note. SV = supervisors; SO = subordinates.
Fall and Winter 2012 Volume 10, Number 2
Journal of Organizational Learning and Leadership 88
Table 6
Overview of the Emerged Categories and the Amount of Assigned Coding Units
# Category Amount of
Coding Units
1. stress resistance 130
2. assertiveness & insistence 105
3. administrative activity & long-term planning 97
4. practical self-management 93
5. emotional self-control 84
6. delegating trustfully 77
7. efficient communication & meetings 67
8. encouraging team spirit, cooperation and conflict management 61
9. dominance, tyranny & intolerance 55
10. perfectionism & focusing on details 36
11. team-mindedness & willingness to collaborate 36
12. self-reflection in respect of leadership behavior & prioritizing
role of leadership
33
13. humor & joy 32
14. specialized knowledge 31
15. flexibility, spontaneity & pragmatism 27
16. rhetoric, ability to communicate & social competence 19
17. experience 16
Fall and Winter 2012 Volume 10, Number 2
Journal of Organizational Learning and Leadership 89
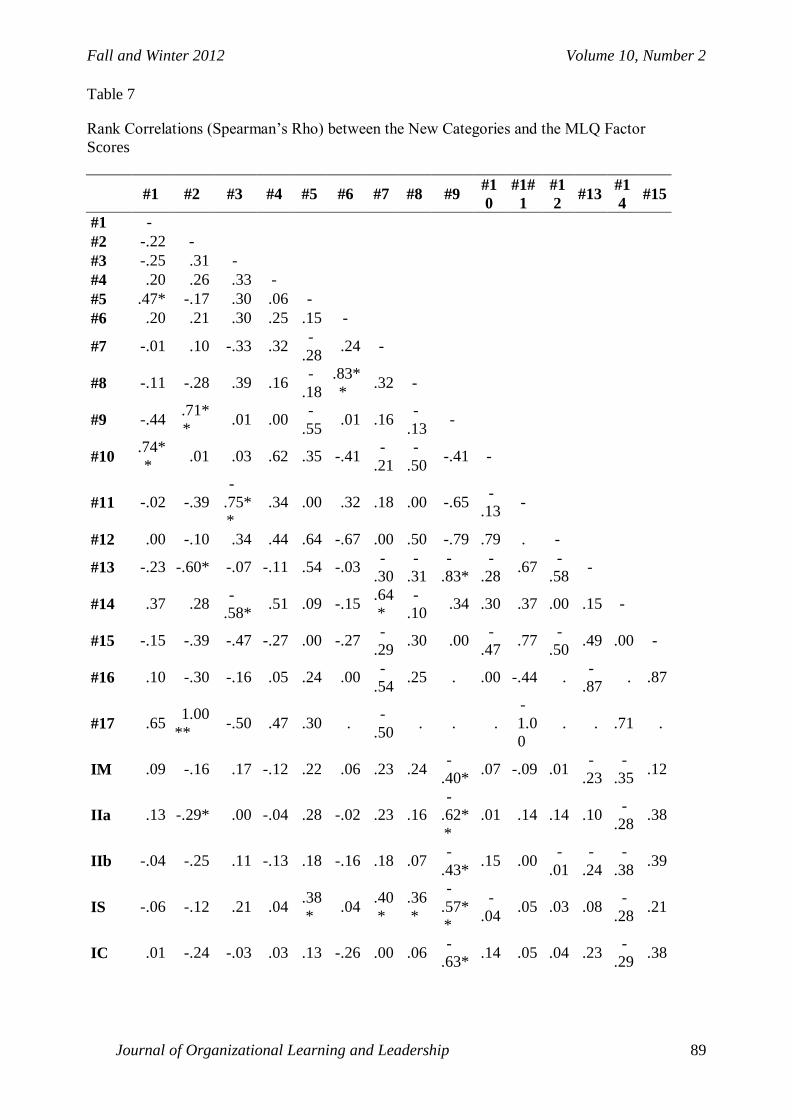
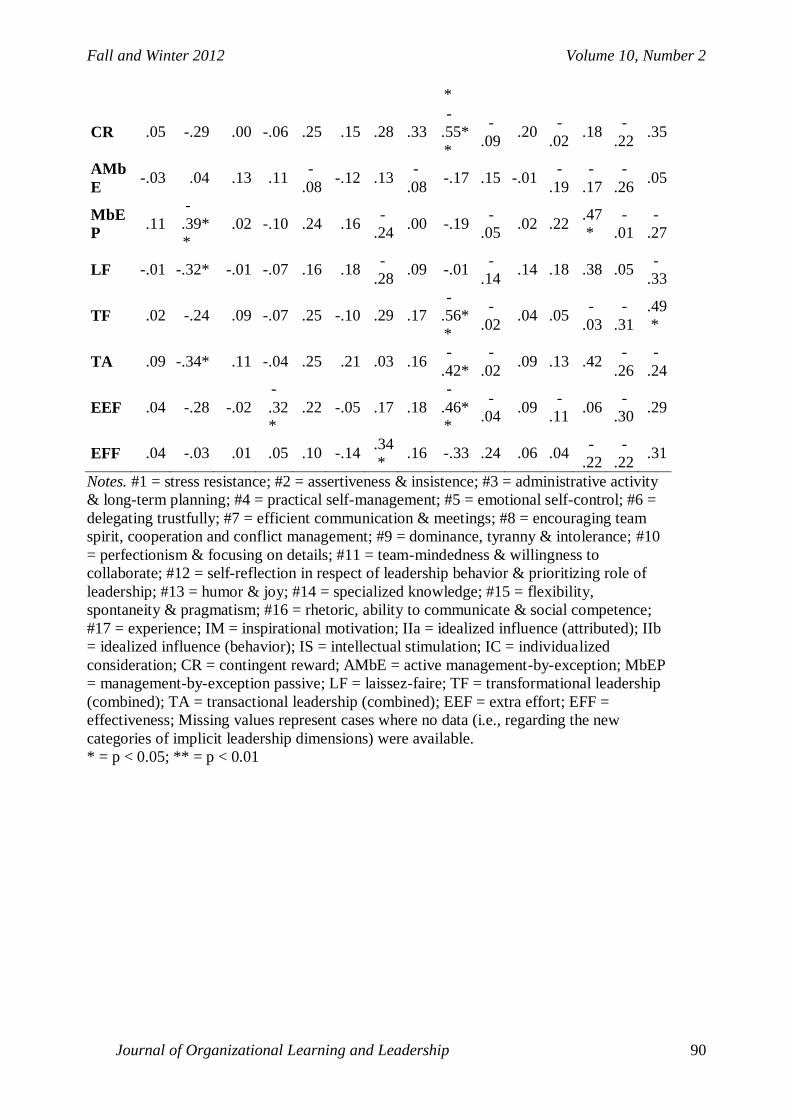
Table 7
Rank Correlations (Spearman’s Rho) between the New Categories and the MLQ Factor
Scores
#1 #2 #3 #4 #5 #6 #7 #8 #9 #1
0
#1#
1
#1
2 #13
#1
4 #15
#1 -
#2 -.22 -
#3 -.25 .31 -
#4 .20 .26 .33 -
#5 .47* -.17 .30 .06 -
#6 .20 .21 .30 .25 .15 -
#7 -.01 .10 -.33 .32 -
.28 .24 -
#8 -.11 -.28 .39 .16 -
.18
.83*
* .32 -
#9 -.44 .71*
* .01 .00
-
.55 .01 .16
-
.13 -
#10 .74*
* .01 .03 .62 .35 -.41
-
.21
-
.50 -.41 -
#11 -.02 -.39
-
.75*
*
.34 .00 .32 .18 .00 -.65 -
.13 -
#12 .00 -.10 .34 .44 .64 -.67 .00 .50 -.79 .79 . -
#13 -.23 -.60* -.07 -.11 .54 -.03 -
.30
-
.31
-
.83*
-
.28 .67
-
.58 -
#14 .37 .28 -
.58* .51 .09 -.15
.64
*
-
.10 .34 .30 .37 .00 .15 -
#15 -.15 -.39 -.47 -.27 .00 -.27 -
.29 .30 .00
-
.47 .77
-
.50 .49 .00 -
#16 .10 -.30 -.16 .05 .24 .00 -
.54 .25 . .00 -.44 .
-
.87 . .87
#17 .65 1.00
** -.50 .47 .30 .
-
.50 . . .
-
1.0
0
. . .71 .
IM .09 -.16 .17 -.12 .22 .06 .23 .24 -
.40* .07 -.09 .01
-
.23
-
.35 .12
IIa .13 -.29* .00 -.04 .28 -.02 .23 .16
-
.62*
*
.01 .14 .14 .10 -
.28 .38
IIb -.04 -.25 .11 -.13 .18 -.16 .18 .07 -
.43* .15 .00
-
.01
-
.24
-
.38 .39
IS -.06 -.12 .21 .04 .38
* .04
.40
*
.36
*
-
.57*
*
-
.04 .05 .03 .08
-
.28 .21
IC .01 -.24 -.03 .03 .13 -.26 .00 .06 -
.63*.14 .05 .04 .23
-
.29 .38
Fall and Winter 2012 Volume 10, Number 2
Journal of Organizational Learning and Leadership 90
*
CR .05 -.29 .00 -.06 .25 .15 .28 .33
-
.55*
*
-
.09 .20
-
.02 .18
-
.22 .35
AMb
E -.03 .04 .13 .11
-
.08 -.12 .13
-
.08 -.17 .15 -.01
-
.19
-
.17
-
.26 .05
MbE
P .11
-
.39*
*
.02 -.10 .24 .16 -
.24 .00 -.19
-
.05 .02 .22
.47
*
-
.01
-
.27
LF -.01 -.32* -.01 -.07 .16 .18 -
.28 .09 -.01
-
.14 .14 .18 .38 .05
-
.33
TF .02 -.24 .09 -.07 .25 -.10 .29 .17
-
.56*
*
-
.02 .04 .05
-
.03
-
.31
.49
*
TA .09 -.34* .11 -.04 .25 .21 .03 .16 -
.42*
-
.02 .09 .13 .42
-
.26
-
.24
EEF .04 -.28 -.02
-
.32
*
.22 -.05 .17 .18
-
.46*
*
-
.04 .09
-
.11 .06
-
.30 .29
EFF .04 -.03 .01 .05 .10 -.14 .34
* .16 -.33 .24 .06 .04
-
.22
-
.22 .31
Notes. #1 = stress resistance; #2 = assertiveness & insistence; #3 = administrative activity
& long-term planning; #4 = practical self-management; #5 = emotional self-control; #6 =
delegating trustfully; #7 = efficient communication & meetings; #8 = encouraging team
spirit, cooperation and conflict management; #9 = dominance, tyranny & intolerance; #10
= perfectionism & focusing on details; #11 = team-mindedness & willingness to
collaborate; #12 = self-reflection in respect of leadership behavior & prioritizing role of
leadership; #13 = humor & joy; #14 = specialized knowledge; #15 = flexibility,
spontaneity & pragmatism; #16 = rhetoric, ability to communicate & social competence;
#17 = experience; IM = inspirational motivation; IIa = idealized influence (attributed); IIb
= idealized influence (behavior); IS = intellectual stimulation; IC = individualized
consideration; CR = contingent reward; AMbE = active management-by-exception; MbEP
= management-by-exception passive; LF = laissez-faire; TF = transformational leadership
(combined); TA = transactional leadership (combined); EEF = extra effort; EFF =
effectiveness; Missing values represent cases where no data (i.e., regarding the new
categories of implicit leadership dimensions) were available.
* = p < 0.05; ** = p < 0.01
Fall and Winter 2012 Volume 10, Number 2
Journal of Organizational Learning and Leadership 91
Table 7 (continued)
#16 #17 IM IIa IIb IS IC CR AMb
E
MbE
P LF TF TA EEF
#1
#2
#3
#4
#5
#6
#7
#8
#9
#10
#11
#12
#13
#14
#15
#16 -
#17 . -
IM .39 -.25 -
IIa .46 .19 .79** -
IIb .33 .00 .80** .80** -
IS .42 .06 .63** .80** .72** -
IC .42 .37 .68** .79** .72** .69** -
CR .42 .00 .64** .75** .64** .80** .64** -
AMb
E .10 -.13 .19 .25** .30** .36** .20*
.39*
* -
MbE
P -.20 -.57
-
.49**
-
.47**
-
.61**
-
.30**
-
.54** -.14 .05 -
LF -.26 -.45 -
.53**
-
.51**
-
.56**
-
.33**
-
.55** -.17 .02 .90** -
TF .45 .00 .86** .95** .89** .86** .86** .78*
* .30** -.52**
-
.54** -
TA .23 -.64 .04 .06 -.05 .26** -.03 .50*
* .52** .68** .61** .07 -
EEF .61* .24 .71** .73** .70** .66** .68** .63**
.13 -.47** -
.47** .78**
.03 -
EFF .44 .03 .71** .79** .70** .66** .73** .56*
* .20* -.63**
-
.73**
.81*
* -.15
.65*
*

Fall and Winter 2012 Volume 10, Number 2
Table 8
Results of Regression Analyses (Final Betas)
EEF EFF
B
SE B
β
B
SE B
β
CR .13 .06 .11*
.03 .04 .03
AMbE -.03 .03 -.03 -.06 .02 -.05*
MbEP -.20 .04 -.31**
.17 .03 .29**
LF .07 .03 .12*
-.33 .02 -.62**
IM .23 .04 .25**
.02 .03 .02
IIa .28 .05 .30**
.26 .03 .31**
IIb -.20 .06 -.18**
.05 .04 .06
IS .18 .05 .17**
.22 .03 .23**
IC .16 .04 .15**
.09 .03 .10**
#1 .01 .01 .05 -.01 .01 -.05*
#2 -.01 .01 -.03 -.02 .01 -.06*
#3 .03 .01 .09**
.00 .01 -.01
#4 -.03 .01 -.06 .00 .01 .00
#5 -.02 .01 -.05 .00 .01 -.02
#6 -.01 .01 -.02 -.03 .01 -.06**
#7 -.04 .01 -.09**
.03 .01 .09**
#8 -.01 .01 -.03 -.01 .01 -.03
#9 .00 .01 .00 .02 .01 .05*
#10 -.01 .01 -.03 .03 .01 .09**
#11 .04 .02 .06*
-.03 .01 -.06**
#12 .00 .01 -.01 .02 .01 .04*
#13 .03 .01 .08**
.02 .01 .05**
#14 .00 .01 -.01 .00 .01 .00
#15 .03 .01 .06*
-.02 .01 -.04*
#16 .03 .02 .05*
.05 .01 .09**
#17 .00 .02 .00 -.07 .02 -.08**
R2 = .73 R
2 = .84
Notes. EEF = extra effort; EFF = effectiveness; CR = contingent reward; AMbE = active
management-by-exception; MbEP = management-by-exception passive; LF = laissez-faire; IM
= inspirational motivation; IIa = idealized influence (attributed); IIb = idealized influence
(behavior); IS = intellectual stimulation; IC = individualized consideration; #1 = stress
resistance; #2 = assertiveness & insistence; #3 = administrative activity & long-term planning;
#4 = practical self-management; #5 = emotional self-control; #6 = delegating trustfully; #7 =
efficient communication & meetings; #8 = encouraging team spirit, cooperation and conflict
management; #9 = dominance, tyranny & intolerance; #10 = perfectionism & focusing on
details; #11 = team-mindedness & willingness to collaborate; #12 = self-reflection in respect of
leadership behavior & prioritizing role of leadership; #13 = humor & joy; #14 = specialized
knowledge; #15 = flexibility, spontaneity & pragmatism; #16 = rhetoric, ability to communicate
& social competence; #17 = experience.
* p < .05; ** p < .01

Fall and Winter 2012 Volume 10, Number 2
Figures
Figure 1. Relative proportions of coding units which were assigned to one of the
nine FRLT categories a1-a9. SV = supervisors; SO = subordinates; IM =
inspirational motivation; IIa = idealized influence (attributed); IIb = idealized
influence (behavior); IS = intellectual stimulation; IC = individualized
consideration; CR = contingent reward; AMbE = active management-by-
exception; MbEP = management-by-exception passive; LF = laissez-faire.

Fall and Winter 2012 Volume 10, Number 2
Journal of Organizational Learning and
Leadership 94
Figure 2. Concept map of the new
leadership categories (arranged in a
concentric circle) which resulted
from the first inductive structuring
content analysis. Each category is
shown together with min. 1 to max.
3 of the mainly mentioned issues.
Dashed borders indicate issues
which are diametrically opposed to
the category name. Straight
connecting lines indicate
hierarchical relationships. Angled
connecting lines are not
hierarchical. The sizes of the
categories decrease in clockwise
direction, while stress resistance is
the largest category and experience
the smallest.
Fall and Winter 2012 Volume 10, Number 2
Figure 3. Two-dimensional configuration of the rank correlations between the MLQ factor
scores and the parameter values of the new categories. MLQ: IM = inspirational motivation; IIa
= idealized influence (attributed); IIb = idealized influence (behavior); IS = intellectual
stimulation; IC = individualized consideration; CR = contingent reward; AMbE = active
management-by-exception; MbEP = management-by-exception passive; LF = laissez-faire;
EEF = extra effort; EFF = effectiveness. New categories: |#1 = stress resistance; |#2 =
assertiveness & insistence; |#3 = administrative activity & long-term planning; |#4 = practical
self-management; |#5 = emotional self-control; |#6 = delegating trustfully; |#7 = efficient
communication & meetings; |#8 = encouraging team spirit, cooperation and conflict
management; |#9 = dominance, tyranny & intolerance; |#10 = perfectionism & focusing on
details; |#11 = team-mindedness & willingness to collaborate; |#12 = self-reflection in respect
of leadership behavior & prioritizing role of leadership; |#13 = humor & joy; |#14 = specialized
knowledge; |#15 = flexibility, spontaneity & pragmatism; |#16 = rhetoric, ability to communicate & social competence; |#17 = experience.
Dimension 1
210-1-2-3
Dim
en
sio
n 2
3
2
1
0
-1
-2
effeef
lfmbep
ambe
cr
ic
is
iib
iiaim
I#15
I#11
I#12I#4
I#10
I#3
I#17
I#14
I#13
I#5
I#9
I#2
I#6
I#8
I#16
I#7
I#1
Konfiguration des abgeleiteten Stimulus
Euklidisches Distanzmodell