Embed Size (px)
Citation preview

Through-Culm Wall Mechanical Behaviour of Bamboo 1
Yusuf Akinbade1, Kent A. Harries2, Chelsea V. Flower3, Ian Nettleship4, Christopher Papadopoulos5 and 2
Shawn Platt6 3
4
Abstract 5
Performance of full-culm bamboo structures is dominated by longitudinal splitting behaviour, often 6
exacerbated by connection details. This behaviour is a function of the transverse properties of this highly 7
orthotropic material. Considerable study of the longitudinal properties of bamboo is available in which it 8
is often concluded that bamboo may be considered as a fibre-reinforced composite material and material 9
properties may be assessed using rule-of-mixture methods. Nonetheless, few studies have addressed the 10
transverse properties of the bamboo culm wall, despite these largely governing full-culm behaviour. This 11
study investigated the transverse material property gradient through the culm wall and attempts to connect 12
the mechanical results to physical observations and phenomena. Most importantly, the study demonstrates 13
that the complex transverse behaviour of bamboo does not appear to behave as a classic fibre-reinforced 14
composite material in the direction transverse to the fibres. In this study, five different bamboo species, 15
Phyllostachys edulis, Phyllostachys bambusoides, Phyllostachys meyeri, Phyllostachys nigra, and 16
Bambusa stenostachya were tested using a modification of the flat-ring flexure test to obtain a measure of 17
the transverse tensile capacity of the bamboo. Microscopy analyses are used to qualitatively describe the 18
culm wall architecture and to quantitatively assess the failure modes through the culm wall thickness. 19
20
Keywords 21
bamboo; fibre gradient; fibre volume; material testing; rule of mixtures; splitting 22
23
1. Introduction 24
A functionally graded, natural fibre-reinforced material [Ghavami et al 2003], bamboo has evolved in 25
nature to efficiently resist environmental loads. Bamboo has been shown to have mechanical properties 26
comparable to those of conventional building materials and its worldwide availability gives it great 27
potential as an alternative building material. Rapid growth (mature in 3 to 5 years followed by a 2 to 3 28
year harvest cycle), very low fertilizer requirement (typically none) and the ability to replace conventional 29
1 PhD candidate, Department of Civil and Environmental Engineering, University of Pittsburgh 2 Bicentennial Board of Visitors Faculty Fellow and Professor, Department of Civil and Environmental Engineering,
University of Pittsburgh; [email protected] 3 Undergraduate Research Fellow, Department of Civil and Environmental Engineering, University of Pittsburgh 4 Associate Professor, Department of Materials and Mechanical Engineering, University of Pittsburgh 5 Associate Professor, Department of Civil and Engineering, University of Puerto Rico at Mayaguez 6 Post doctoral Researcher, University of Bath, United Kingdom.

materials that are resource and energy intensive, combine to make bamboo a potentially sustainable 30
material in terms of both ‘carbon footprint’ and social equity. Bamboo offers versatility for use in a broad 31
range of international contexts, from use as an affordable and sustainable material in developing countries 32
to rapidly-deployable structures for disaster relief, to mainstream or niche construction in wealthier 33
countries. 34
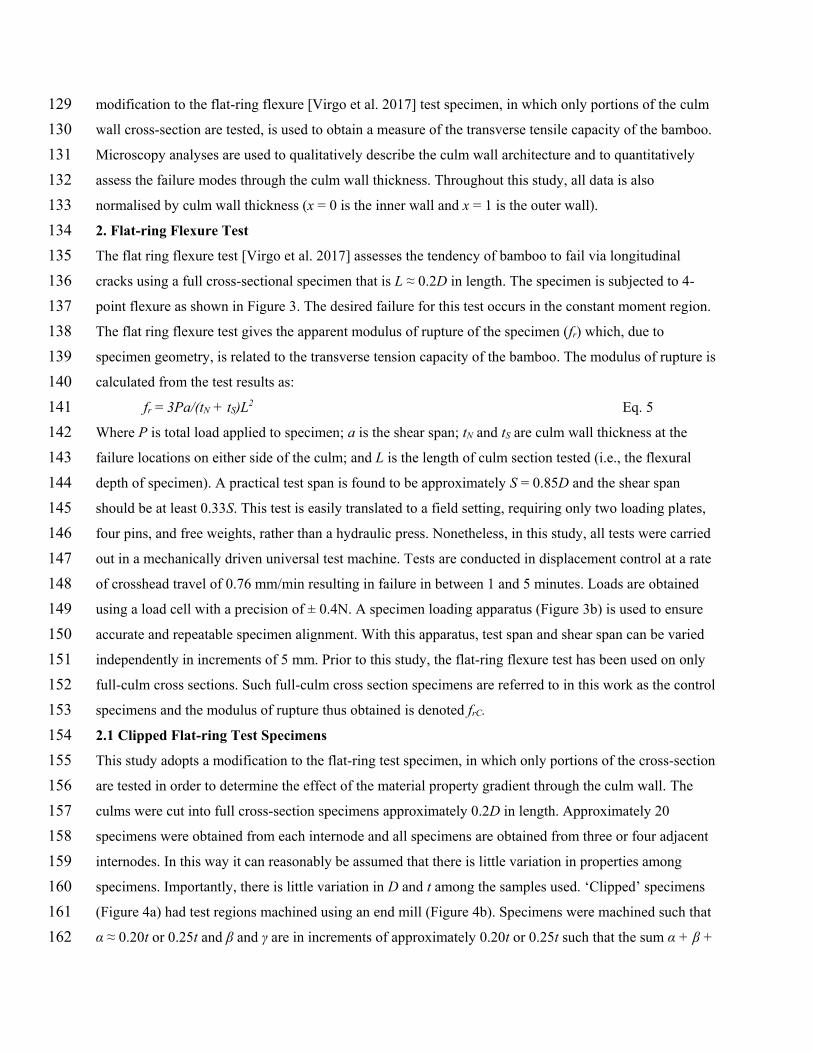
The structure of bamboo is composed of culms (stalks) with solid transverse diaphragms or ‘nodes’ 35
separating hollow inter-nodal regions along its height (Figure 1a). The circular cross section (Figures 1b-36
d) is composed of unidirectional cellulosic fibres oriented parallel to the culm’s longitudinal axis 37
embedded in a parenchyma tissue matrix [Grosser and Liese 1971]. The parenchyma tissue matrix 38
lignifies (hardens) as the culm matures leading to increased density and improved mechanical properties. 39
As a functionally graded material, bamboo has evolved to resist its primary loading in nature: its own 40
self-weight and the lateral effects of wind. As seen in Figure 1c, the density of fibres increases from the 41
inner culm wall to the outer culm wall. The wall thickness is largest at the base of the culm and decrease 42
with height up the culm. However, the size and quantity of vessels decrease with the height of the culm 43
and are replaced with bamboo fibres. This addition of fibres compensates for loss in strength and stiffness 44
due to reductions in diameter and wall thickness near the top of the culm, resulting in relatively uniform 45
engineering properties along the entire culm height [Amada 1996; Harries et al. 2017]. Like any fibre-46
reinforced material, mechanical properties are highly correlated to the proportion and distribution of 47
fibres in the cross section. Mechanical properties are influenced by density, which depends on fibre 48
content, fibre diameter, and cell wall thickness [Janssen 2000]. The density of most bamboo is 700 – 800 49
kg/m3 depending on species, growing conditions, and position along the culm. The volume fraction of 50
fibres ranges from approximately 60% at the exterior face of the culm wall to 10-15% near the interior 51
face (Figure 1c). The variation in density through the culm wall has been assumed by various researchers 52
to be linear, quadratic, exponential, or a power function and is known to be species-dependent [Amada et 53
al. 1996 and 1997]. Table 1 summarises fibre volume distributions reported in the literature in addition to 54
gross section and inner and outer wall fibre volume ratios (Vf) and longitudinal moduli (EL). Due to the 55
complex variation of the fibres and vascular bundles, the variation of material properties through the 56
culm-wall thickness has been shown to be significant [Richard and Harries 2015] and to have the effect of 57
increasing gross culm stiffness by about 10% as compared to an assumed uniform distribution of the same 58
volume of fibers [Janssen 2000]. Harries et al. [2017], in a more refined analysis, showed the effect of 59
fibre gradient on gross culm stiffness to result in about a 5% increase for thin-walled culms (D/t < 8) and 60
as much as 20% for thick-walled culms (D/t > 8; where D is the culm outer diameter and t is the culm 61
wall thickness). 62

In general, while highly variable, the longitudinal behaviour of bamboo is relatively well understood in a 63
qualitative sense. From an engineering perspective, the longitudinal behaviour is most typically 64
considered as a fibre-reinforced material in which longitudinal properties are obtained using a rule of 65
mixtures approach. For example, gross section modulus, EL, is estimated from: 66
EL= VfEf + (1 – Vf)Em Eq. 1 67
Where Vf is the fibre volume ratio and Ef and Em are the moduli of the fibre and matrix (parenchyma) 68
phases, respectively. Janssen (2000) reports typical values of Ef = 35 GPa and Em = 1.8 GPa. 69
The dominant failure mode of bamboo, however, is longitudinal splitting associated with bamboo 70
carrying flexure, compression or tension loads; splitting is exacerbated by the use of simple bolted 71
connection details common in some bamboo construction [Sharma et al. 2012]. Janssen [1981] describes 72
the bending stresses in a culm as being characterised by the longitudinal compressive stress and 73
transverse strain in the compression zone of the culm, with failure eventually occurring due to 74
longitudinal splitting. This is ideally a Mode II7 longitudinal shear failure. However, in the presence of 75
perpendicular stresses (as is the case where ever there is a non-zero shear-to-moment ratio), there is some 76
Mode I component stress which significantly reduces the Mode II capacity. Richard et al. [2017] 77
demonstrate the effects of such mode mixity using longitudinal shear tests [ISO 2004] which capture pure 78
Mode II behaviour, split pin tests [Mitch et al. 2010] which capture Mode I behaviour, and culm bending 79
tests of different spans resulting in different degrees of mode mixing. For two different species, a thin 80
walled P. edulis and thick-walled B. stenostachya, the split pin tests resulted in Mode I capacities equal to 81
only 18% of the Mode II capacity determined from the longitudinal shear tests. Beam tests having mixed 82
mode behaviour exhibited shear capacities ranging from 40-70% of the Mode II capacity. 83
Both the Mode I and II behaviours described are primarily functions of the transverse properties of the 84
fibre-reinforced culm which are believed to be dominated by matrix (parenchyma) properties. Despite 85
their importance in the dominant observed behaviour of full-culm bamboo, there are few studies of the 86
transverse properties of the culm wall. In early work, Arce-Villalobos [1993] concluded that there is no 87
correlation between the density of bamboo and its transverse tensile strength. Janssen [2000], based on 88
flexural tests, reports that a transverse strain of 0.0013 results in transverse tensile failure of the culm wall 89
(with no indication of species or other variation). More recently, test methods have been proposed for 90
obtaining transverse properties of bamboo culms [Mitch et al. 2010; Sharma et al. 2012; Virgo et al. 91
2017] although these have not yet been widely adopted to obtain material properties over a range of 92
species and conditions. Sharma and Harries [2012] report a unique attempt to refine an edge bearing test 93
to determine through culm-wall distribution of properties. In this study, the culm was cut, using a water 94
7 Reference to Modes II and I are in relation to classical fracture mechanics in which Mode II refers to forces resulting
in ‘in-plane shear’ and Mode I refers to perpendicular in-plane ‘peeling’ forces.

jet, into two or three concentric annular sections. Edge bearing test results for each resulting ‘ring’ 95
provided an improved measure of through-thickness transverse properties than could be obtained from a 96
single full-culm section. The approach was limited to thicker culm walls, provided only two or three data 97
points across the culm wall and did not result in repeatable specimens and was therefore abandoned. 98
Tan et al. [2011] conducted a micro-scale study on the crack growth and toughening mechanisms of P. 99
edulis. The study revealed that toughening was inversely related to fibre density. The authors noted that 100
their results suggest the need to account for the anisotropic strength and fracture properties of bamboo in 101
the design of bamboo structures. 102
In order to understand the transverse behaviour of bamboo, it is informative to consider laminate theory 103
and the rule of mixtures for transverse properties: 104
ET = [Vf/Ef + (1 – Vf)/Em]-1 Eq. 2 105
Equation 2 is conventionally considered a lower-bound estimate of transverse properties since it does not 106
account for the anisotropic nature of the fibre itself and, as a result, underestimates off-longitudinal 107
properties [Mallick 2008]. The Halpin-Tsai equations [Halpin and Kadros 1976] are most often adopted 108
to describe transverse behaviour of fibre-reinforced composites: 109
ET = Em(1 + ξnVf)/(1-nVf) Eq. 3 110
Where n = (Ef/Em – 1)/(Ef/Em + ξ) Eq. 4 111
The value of ξ is an empirical constant fitted to the elasticity solution for a fibre geometry and confirmed 112
by experimental data [Halpin and Kadros 1976]: 113
ξ = 2 + 40Vf10 Eq. 5 114
When considering transverse properties of longitudinally reinforced fibre composites having Vf less than 115
0.5, it is conventional to assign ξ = 2 [Hewitt and de Malherbe 1970]. Halpin-Tsai is equally applicable to 116
determining longitudinal properties. For longitudinal properties of long continuous fibre composites (such 117
as bamboo) however, Halpin-Tsai results in the same relationship as the rule-of-mixtures (Eq. 1). 118
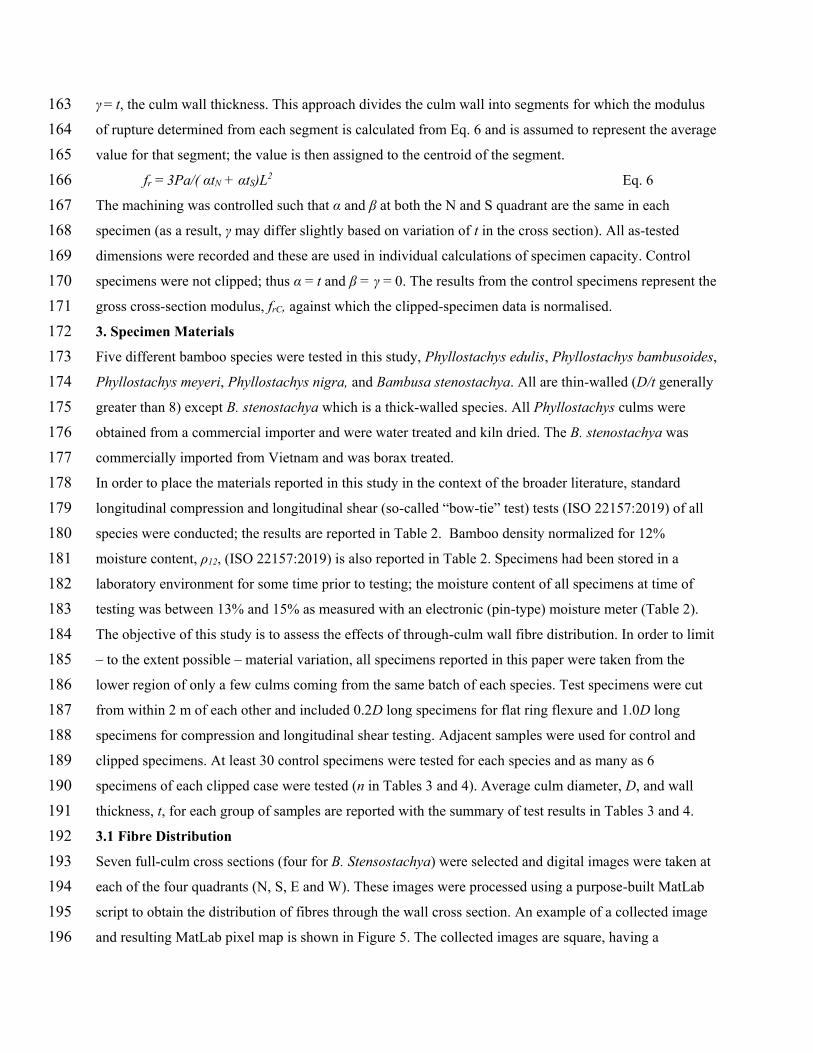
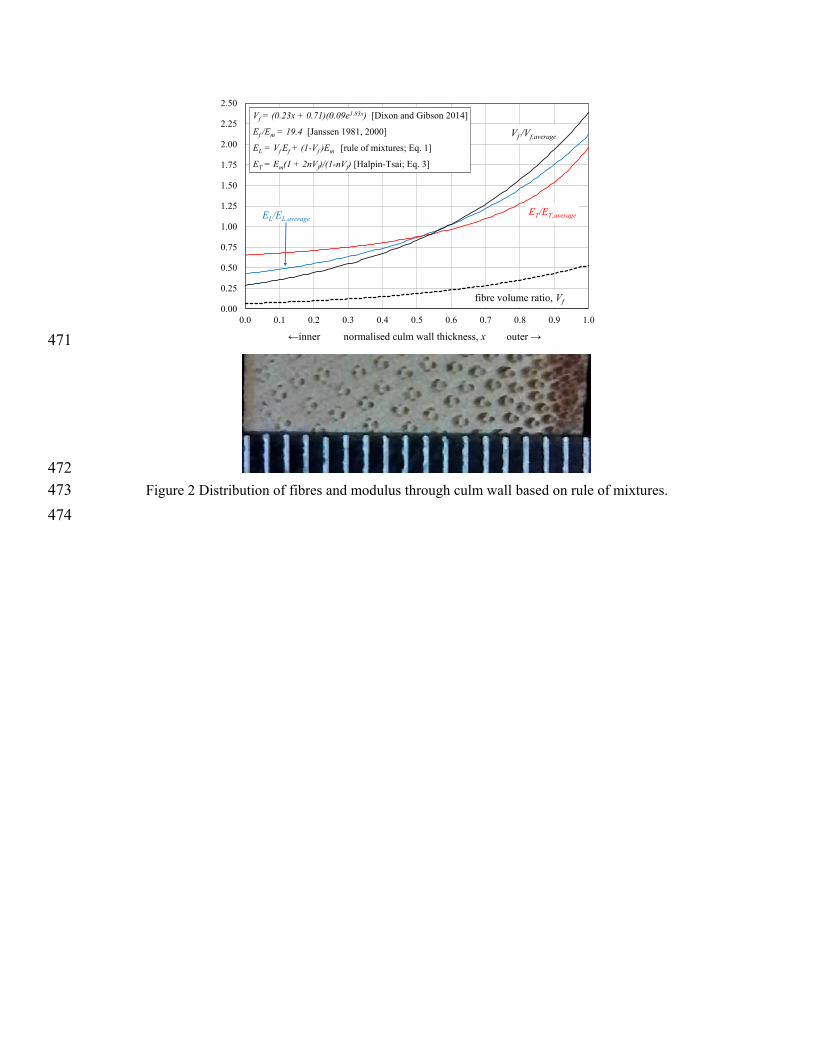
Figure 2 presents theoretical longitudinal and transverse modulus distributions determined using the rule 119
of mixtures and Halpin-Tsai, respectively (Equations 1 and 3). The fibre volume distribution illustrated is 120
that proposed by Dixon and Gibson [2014] for P. edulis and is representative of most distributions 121
reported in Table 1. The modulus distributions shown are normalised by the average modulus for the 122
culm wall which is what should be obtained when testing a full-culm specimen (i.e., the apparent modulus 123
of the gross section). In addition to the variation in properties, a shift of the neutral axis of the section (at 124
which location ratios equal unity) toward the outer culm wall is evident. This shift results in the increase 125
in gross culm stiffness described previously [Janssen 2000; Harries et al. 2017]. 126
The objective of the present study is to investigate the transverse material property gradient through the 127
culm wall and to connect the mechanical results to physical results, such as fibre density. In this study, a 128
modification to the flat-ring flexure [Virgo et al. 2017] test specimen, in which only portions of the culm 129
wall cross-section are tested, is used to obtain a measure of the transverse tensile capacity of the bamboo. 130
Microscopy analyses are used to qualitatively describe the culm wall architecture and to quantitatively 131
assess the failure modes through the culm wall thickness. Throughout this study, all data is also 132
normalised by culm wall thickness (x = 0 is the inner wall and x = 1 is the outer wall). 133
2. Flat-ring Flexure Test 134
The flat ring flexure test [Virgo et al. 2017] assesses the tendency of bamboo to fail via longitudinal 135
cracks using a full cross-sectional specimen that is L ≈ 0.2D in length. The specimen is subjected to 4-136
point flexure as shown in Figure 3. The desired failure for this test occurs in the constant moment region. 137
The flat ring flexure test gives the apparent modulus of rupture of the specimen (fr) which, due to 138
specimen geometry, is related to the transverse tension capacity of the bamboo. The modulus of rupture is 139
calculated from the test results as: 140
fr = 3Pa/(tN + tS)L2 Eq. 5 141
Where P is total load applied to specimen; a is the shear span; tN and tS are culm wall thickness at the 142
failure locations on either side of the culm; and L is the length of culm section tested (i.e., the flexural 143
depth of specimen). A practical test span is found to be approximately S = 0.85D and the shear span 144
should be at least 0.33S. This test is easily translated to a field setting, requiring only two loading plates, 145
four pins, and free weights, rather than a hydraulic press. Nonetheless, in this study, all tests were carried 146
out in a mechanically driven universal test machine. Tests are conducted in displacement control at a rate 147
of crosshead travel of 0.76 mm/min resulting in failure in between 1 and 5 minutes. Loads are obtained 148
using a load cell with a precision of ± 0.4N. A specimen loading apparatus (Figure 3b) is used to ensure 149
accurate and repeatable specimen alignment. With this apparatus, test span and shear span can be varied 150
independently in increments of 5 mm. Prior to this study, the flat-ring flexure test has been used on only 151
full-culm cross sections. Such full-culm cross section specimens are referred to in this work as the control 152
specimens and the modulus of rupture thus obtained is denoted frC. 153
2.1 Clipped Flat-ring Test Specimens 154
This study adopts a modification to the flat-ring test specimen, in which only portions of the cross-section 155
are tested in order to determine the effect of the material property gradient through the culm wall. The 156
culms were cut into full cross-section specimens approximately 0.2D in length. Approximately 20 157
specimens were obtained from each internode and all specimens are obtained from three or four adjacent 158
internodes. In this way it can reasonably be assumed that there is little variation in properties among 159
specimens. Importantly, there is little variation in D and t among the samples used. ‘Clipped’ specimens 160
(Figure 4a) had test regions machined using an end mill (Figure 4b). Specimens were machined such that 161
α ≈ 0.20t or 0.25t and β and γ are in increments of approximately 0.20t or 0.25t such that the sum α + β + 162
γ = t, the culm wall thickness. This approach divides the culm wall into segments for which the modulus 163
of rupture determined from each segment is calculated from Eq. 6 and is assumed to represent the average 164
value for that segment; the value is then assigned to the centroid of the segment. 165
fr = 3Pa/( αtN + αtS)L2 Eq. 6 166
The machining was controlled such that α and β at both the N and S quadrant are the same in each 167
specimen (as a result, γ may differ slightly based on variation of t in the cross section). All as-tested 168
dimensions were recorded and these are used in individual calculations of specimen capacity. Control 169
specimens were not clipped; thus α = t and β = γ = 0. The results from the control specimens represent the 170
gross cross-section modulus, frC, against which the clipped-specimen data is normalised. 171
3. Specimen Materials 172
Five different bamboo species were tested in this study, Phyllostachys edulis, Phyllostachys bambusoides, 173
Phyllostachys meyeri, Phyllostachys nigra, and Bambusa stenostachya. All are thin-walled (D/t generally 174
greater than 8) except B. stenostachya which is a thick-walled species. All Phyllostachys culms were 175
obtained from a commercial importer and were water treated and kiln dried. The B. stenostachya was 176
commercially imported from Vietnam and was borax treated. 177
In order to place the materials reported in this study in the context of the broader literature, standard 178
longitudinal compression and longitudinal shear (so-called “bow-tie” test) tests (ISO 22157:2019) of all 179
species were conducted; the results are reported in Table 2. Bamboo density normalized for 12% 180
moisture content, ρ12, (ISO 22157:2019) is also reported in Table 2. Specimens had been stored in a 181
laboratory environment for some time prior to testing; the moisture content of all specimens at time of 182
testing was between 13% and 15% as measured with an electronic (pin-type) moisture meter (Table 2). 183
The objective of this study is to assess the effects of through-culm wall fibre distribution. In order to limit 184
– to the extent possible – material variation, all specimens reported in this paper were taken from the 185
lower region of only a few culms coming from the same batch of each species. Test specimens were cut 186
from within 2 m of each other and included 0.2D long specimens for flat ring flexure and 1.0D long 187
specimens for compression and longitudinal shear testing. Adjacent samples were used for control and 188
clipped specimens. At least 30 control specimens were tested for each species and as many as 6 189
specimens of each clipped case were tested (n in Tables 3 and 4). Average culm diameter, D, and wall 190
thickness, t, for each group of samples are reported with the summary of test results in Tables 3 and 4. 191
3.1 Fibre Distribution 192
Seven full-culm cross sections (four for B. Stensostachya) were selected and digital images were taken at 193
each of the four quadrants (N, S, E and W). These images were processed using a purpose-built MatLab 194
script to obtain the distribution of fibres through the wall cross section. An example of a collected image 195
and resulting MatLab pixel map is shown in Figure 5. The collected images are square, having a 196

dimension equal to the culm-wall thickness, t (Figure 5a). The image is divided in the through-thickness 197
direction into ten equal regions of thickness t/10 (Figure 5b) and the fibre volume ratio obtained for each 198
(Figure 5c). From this analysis, the average fibre distribution (expressed as third-order polynomial best-199
fit curves) is obtained as summarised at the bottom of Table 1 in terms of the normalised culm wall 200
thickness, x (x = 0 is the inner culm wall and x = 1 is the outer culm wall). The coefficient of variation of 201
measured fibre volume ratios was less than 0.18 for all but P. nigra, which exhibited a COV = 0.24. The 202
28 P. edulis samples shown in Figure 5c have a COV = 0.13. The best-fit equations representing fibre 203
volume distribution reported in Table 1 all have a coefficient of determination R2 = 0.99. 204
The fibre distribution among the four thin-wall Phyllostachys species is very similar. Indeed, a single 205
relationship could be given for all four species having R2 = 0.96 as shown in Table 1. A marked 206
difference in fibre distribution is observed in the thick-walled B. stenostachya. Thus, fibre distribution is 207
observed to differ by genera (Phyllostachys and Bambusa) but less so among species in the same genera 208
(Phyllostachys). 209
4. Full-wall Thickness Flat-Ring Flexure Test Results 210
Modulus of rupture, frC, (Eq. 5) determined for the full-culm control specimens is reported in Table 3. 211
Within the genus Phyllostachys, these values are similar and notably greater than that observed for B. 212
stenostachya. Observed variation of test results is typical of bamboo and similar to that reported in Virgo 213
et al. [2017]. As recommended by Virgo et al., only specimens failing within the constant moment region 214
(Figure 3a) are included in the reported data. Additionally, outliers defined as data falling outside 1.5 215
times the interquartile range (so called Tukey fences (Hoaglin 2003)), were excluded from the reported 216
data. 217
5. Clipped Flat-ring Test Results 218
Experimentally determined values of normalised fr/frC determined from the clipped tests are shown in 219
Figure 6 and the corresponding best fit second-order polynomial relationships are reported in Table 3. 220
These all illustrate a similar trend although P. nigra specimens exhibit relatively little variation through 221
the culm wall compared to the other species. With the clipped specimens, all failures occurred in the 222
clipped region and no data was determined to be an outlier. 223
6. Effect of Outer Layer of Bamboo Culm 224
Integrating the fr/frC best-fit curves (Table 3) from x = 0 to x = 1 should represent the gross modulus 225
across the section; that is, the integral ∫fr/frCdx should equal unity. However, as shown in Table 3, with the 226
exception of P. meyeri, the gross modulus obtained by integrating the clipped data exceeds unity by as 227
much as 20%. A possible explanation for this behaviour – one in which the sum of the parts exceeds the 228
capacity of the whole – is that failure of the full wall section control specimens is being initiated by a 229

‘weak link’. A brittle failure of the outer layer of the culm wall initiating failure would explain this 230
observation. 231
The extreme outer layer of a bamboo culm consists of a silica-rich outer skin (epidermis) and a thin 232
region of densely packed fibres (this can be seen at the top of Figure 5). It is believed that this layer will 233
be more brittle than the rest of the culm wall and may help to initiate failures in specimens in which the 234
outer wall is included. Therefore in the clipped specimen testing a question arises: is the outer layer 235
contributing disproportionately to the observed behaviour, especially to the control and β = 0 tests? To 236
investigate this effect, additional specimens were tested having β ≈ 0.05t and α ≈ 0.95t (i.e. γ = 0, see 237
Figure 4a); essentially, these are full-culm sections with only the outer layer ‘shaved’ away. 238
Twenty flat-ring flexure specimens were cut from comparable samples of each species tested in the 239
clipped test program (P. edulis was not included as there were no comparable specimens available). 240
Alternating specimens along the culm were prepared using a belt sander such that β ≈ 0.05t and α ≈ 0.95t 241
(Figure 4a). Resulting wall thicknesses in the constant moment region are reported in Table 4. Apart from 242
specimen preparation, all tests were identical to those reported previously. To assess potential changes in 243
specimen ductility, displacement of the applied load, δ, was measured and reported at failure of each 244
specimen. Results are presented in Table 4. Also shown in Table 4 is the p-value determined from an 245
unpaired t-test for each set of ‘shaved’ and unshaved specimen. The p-value is the probability that there is 246
no statistically significant difference between the compared conditions. 247
It is seen that the modulus of rupture, fr, is essentially unaffected by the removal of the outer layer. With 248
the exception of P. nigra, the displacement at failure is observed to increase upon the removal of the outer 249
layer. This increase is greater than can be attributed to the loss of 5% of the moment of inertia of the cross 250
section (resulting from shaving the specimen) alone. To consider the observed behaviour in a normalised 251
fashion, the tangent ‘stiffness’, fr/δ is also calculated. As seen in Figure 7, specimen stiffness (represented 252
as linear best-fit line in Figure 7) falls on the order of 15 to 30% (with the exception of P. nigra) despite 253
the moment of inertia being reduced only 5%. The modulus of rupture itself remains unchanged. 254
7. Discussion of Observed Transverse Behaviour 255
The data shown in Figure 6 and equations reported in Table 3 indicate a generally parabolic distribution 256
of modulus of rupture through the culm wall thickness with higher values at both the inner and outer 257
walls and a minimum near the middle of the wall thickness. The fibre volume distributions, also shown in 258
Figure 6 and given in Table 1, indicate a typically observed distribution having few fibres at the inner 259
wall and a greater volume fraction at the outer wall. Based on these fibre distributions, the predicted 260
distribution of modulus of rupture using the Halpin-Tsai equation (Equation 3) does not appear to capture 261
the experimentally observed behaviour, particularly in the inner half of the culm wall where fibre volumes 262
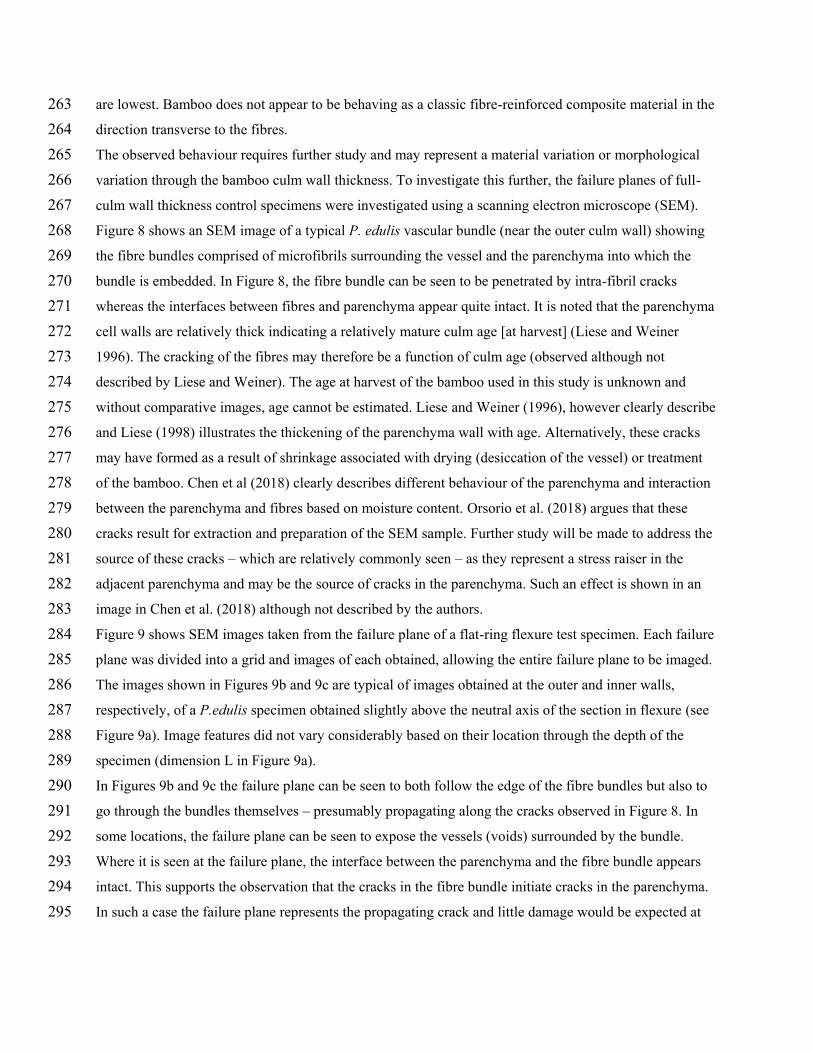
are lowest. Bamboo does not appear to be behaving as a classic fibre-reinforced composite material in the 263
direction transverse to the fibres. 264
The observed behaviour requires further study and may represent a material variation or morphological 265
variation through the bamboo culm wall thickness. To investigate this further, the failure planes of full-266
culm wall thickness control specimens were investigated using a scanning electron microscope (SEM). 267
Figure 8 shows an SEM image of a typical P. edulis vascular bundle (near the outer culm wall) showing 268
the fibre bundles comprised of microfibrils surrounding the vessel and the parenchyma into which the 269
bundle is embedded. In Figure 8, the fibre bundle can be seen to be penetrated by intra-fibril cracks 270
whereas the interfaces between fibres and parenchyma appear quite intact. It is noted that the parenchyma 271
cell walls are relatively thick indicating a relatively mature culm age [at harvest] (Liese and Weiner 272
1996). The cracking of the fibres may therefore be a function of culm age (observed although not 273
described by Liese and Weiner). The age at harvest of the bamboo used in this study is unknown and 274
without comparative images, age cannot be estimated. Liese and Weiner (1996), however clearly describe 275
and Liese (1998) illustrates the thickening of the parenchyma wall with age. Alternatively, these cracks 276
may have formed as a result of shrinkage associated with drying (desiccation of the vessel) or treatment 277
of the bamboo. Chen et al (2018) clearly describes different behaviour of the parenchyma and interaction 278
between the parenchyma and fibres based on moisture content. Orsorio et al. (2018) argues that these 279
cracks result for extraction and preparation of the SEM sample. Further study will be made to address the 280
source of these cracks – which are relatively commonly seen – as they represent a stress raiser in the 281
adjacent parenchyma and may be the source of cracks in the parenchyma. Such an effect is shown in an 282
image in Chen et al. (2018) although not described by the authors. 283
Figure 9 shows SEM images taken from the failure plane of a flat-ring flexure test specimen. Each failure 284
plane was divided into a grid and images of each obtained, allowing the entire failure plane to be imaged. 285
The images shown in Figures 9b and 9c are typical of images obtained at the outer and inner walls, 286
respectively, of a P.edulis specimen obtained slightly above the neutral axis of the section in flexure (see 287
Figure 9a). Image features did not vary considerably based on their location through the depth of the 288
specimen (dimension L in Figure 9a). 289
In Figures 9b and 9c the failure plane can be seen to both follow the edge of the fibre bundles but also to 290
go through the bundles themselves – presumably propagating along the cracks observed in Figure 8. In 291
some locations, the failure plane can be seen to expose the vessels (voids) surrounded by the bundle. 292
Where it is seen at the failure plane, the interface between the parenchyma and the fibre bundle appears 293
intact. This supports the observation that the cracks in the fibre bundle initiate cracks in the parenchyma. 294
In such a case the failure plane represents the propagating crack and little damage would be expected at 295

interfaces parallel to the crack plane. Similar behaviour is reported by Chen et al. (2018) as the 296
propagation of cracks through the parenchyma but around the mircofibrils comprising the fibre bundle. 297
Additionally, the parenchyma shown in Figures 9b and 9c, appear to be behaving differently. Near the 298
outer culm wall (Figure 9b), the failure appears to follow the interfaces between parenchyma cells. Near 299
the inner culm wall (Figure 9c), the failure plane often appears to pass through the parenchyma cells (seen 300
as non-intact cell walls in Figure 9c). This observation is typical of all images obtained in this study. 301
Indeed, near the outer culm wall, the parenchyma is occasionally observed to fail in ‘sheets’ of intact cells 302
as shown in Figure 10a. In other images (Figure 10b) the intact parenchyma close to the inner culm wall 303
appear ‘desiccated’: the intact cell wall appears to be ‘caving in’ or concave rather than being slightly 304
convex nearer the outer culm wall (Figure 8). This observation may suggest a gradient in moisture content 305
through the culm wall or a residual effect of moisture gradient during the drying process – recall that the 306
P. edulis was kiln-dried. Such a gradient should be expected. The bamboo culm epidermis is relatively 307
impermeable and resistant to wetting whereas the inner culm wall is permeable (Liese 1998, Yao et al. 308
2011). The effects of moisture content, 0%, 6% and 20%, on parenchyma behaviour of P. edulis has been 309
recently reported by Chen et al. (2018) who attribute increased toughness – particularly of the 310
parenchyma matrix, with increased moisture content. 311
The longitudinal aspect ratio of the parenchyma cells can be seen to be different in the outer (Figure 10a) 312
and inner (Figure 10b) regions of the culm wall. In recent work, Zeng et al. (2019) identified significantly 313
different morphology of parenchyma cell walls through the culm wall thickness of P. edulis samples. 314
Near the outer culm wall, parenchyma cell walls were tightly packed laminar structures with little annular 315
space at interstices (Figure 11c). Nearer the inner culm wall, the laminar structure of the cell wall was 316
separating and a larger triangular pore is present at parenchyma cell interstices (Figure 11a). It is unclear 317
how these differences impact the behaviour illustrated in Figure 9 but it is evident that parenchyma is not 318
homogeneous through the cross section. Neither Zeng et al. (2019) nor Liese (1998) provide insight on 319
the source of this inhomogeneity and the present authors can only speculate on its cause, although it does 320
appear to affect the through thickness mechanical behaviour of the culm wall. 321
8. Conclusion 322
This study investigated the transverse material property gradient through the bamboo culm wall and 323
attempts to connect the mechanical results to physical observations and phenomena. Most importantly, 324
the study demonstrates that the transverse behaviour is complex and that bamboo does not appear to 325
behave as a classic fibre-reinforced composite material in the direction transverse to the fibres. 326
In this study, a modification to the flat-ring flexure test specimen, in which only portions of the culm wall 327
cross-section are tested, is used to obtain a measure of the transverse tensile capacity of the bamboo. 328

Microscopy analyses are used to qualitatively describe the culm wall architecture and to quantitatively 329
assess the failure modes through the culm wall thickness. The following conclusions are made: 330
1. Fibre volume distribution through the culm wall was best described by third-order polynomial curves 331
and the COV was observed to be on the order of 0.20 in all cases. Fibre distribution and modulus of 332
rupture, frC, among the four thin-wall Phyllostachys species was very similar, while the same values 333
for B. stenostachya was markedly different. 334
2. The gross modulus obtained by integrating the clipped data exceeds the experimentally determined 335
value of frC by as much as 20%; that is, the sum of the parts exceeds the capacity of the whole culm. 336
3. The silica-rich epidermal layer of the culm wall appears to disproportionately affect the full-culm 337
modulus, frC. Full-culm specimens were tested without this layer and the modulus of rupture was 338
essentially unaffected. The stiffness of the specimens tested without the epidermal layer was reduced 339
considerably more than the small reduction in geometry implies. 340
4. The distribution of fibre volume and modulus of rupture though the culm wall thickness are shown to 341
not be correlated by conventional assumptions of fibre-reinforced composite material behaviour. The 342
Halpin-Tsai equation (Equation 3) does not appear to capture the experimentally observed behaviour, 343
particularly in the inner half of the culm wall where fibre volumes are lowest. 344
Scanning electron microscopy (SEM) images of the flat-ring flexure tests failure surfaces reveal a 345
complex behaviour that is not consistent with the assumptions of fibre-reinforced composite behaviour. 346
The following is observed: 347
5. Failure planes generally pass through the fibre bundles, affected by the vessels (voids) contained in 348
the bundles and cracking between individual fibres comprising the bundles. In general, the interface 349
between fibres and parenchyma (matrix) remains intact. 350
6. Failure within the parenchyma also varies based on location through the culm wall. Near the outer 351
culm wall, the failure appears to follow the interfaces between parenchyma cells however near the 352
inner culm wall, the failure often appears to pass through the parenchyma cells. 353
7. Morphologic characteristics of the parenchyma are seen to vary through the culm wall thickness 354
although it is unclear how these differences impact behaviour. 355
Considerably more research is required to understand the source of the variation in parenchyma structure 356
and its effect on mechanical properties of the bamboo culm. The variation may simply be the natural 357
morphology of the bamboo but may also arise from drying, curing and/or treatment processes. While 358
gross section properties are most important for full-culm bamboo construction, variation of properties 359
through the culm wall may be critical to the performance of laminated bamboo products, particularly 360
those employing tangentially cut strips such as glue-laminated bamboo and cross laminated bamboo 361
[Sharma et al. 2015]. 362

363
Acknowledgements 364
This research was funded through National Science Foundation Award 1634739 Collaborative Research: 365
Full-culm Bamboo as a Full-fledged Engineering Material. Additional support from the 2015 Institute of 366
International Education Global Innovation Initiative Award Bamboo in the Urban Environment and the 367
University of Pittsburgh Swanson School Of Engineering Summer Research Internship Program is 368
gratefully acknowledged. 369
370
371

References 372
Amada, S., Ichikawa, T., Munekata, T., Nagase, Y., and Shimizu, H., (1997) Fiber texture and mechanical 373 graded structure of bamboo, Composites: Part B, 28B, 13-20. 374
Amada, S., Munekata, T., Nagase, Y., Ichikawa, Y., Kirigai, A. and Zhifei, Y. (1996) The mechanical 375 structures of bamboos in viewpoint of functionally gradient and composite materials, Journal of 376 Composite Materials, 30, 800-819. 377
Arce-Villalobos O.A. (1993) Fundamentals of the design of bamboo structures, Master’s thesis, 378 Eindhoven University of Technology, The Netherlands. 379
Chen G., Luo H., Yang H., Zhang, T. and Li, S. (2018) Water effects on the deformation and fracture 380 behaviors of the multi-scaled cellular fibrous bamboo. Acta Biomaterialia 65, 203-215 381
Dixon, P.G. and Gibson, L.J. (2014) The structure and mechanics of Moso bamboo material, Journal of 382 the Royal Society Interface 11, 20140321. 383
Dixon, P.G., Ahvenainen, P., Aijazi, A.N., Chen, S.H., Lin, S., Augusciak, P.K., Borrega, M., Svedstrom, 384 K. and Dixon, L.J., Comparison of the structure and flexural properties of Moso, Guadua and Tre Gai 385 bamboo, Construction and Building Materials, 90, 11-17. 386
Ghavami, K. and Marinho, A.B. (2005) Propriedades físicas e mecânicas do colmo inteiro do bambu da 387 espécie Guadua angustifolia, Revista Brasileira de Engenharia Agrícola e Ambiental, 9(1), 107-114. 388 (in Portuguese) 389
Ghavami, K., Rodriques, C.S., and Paciornik, S., (2003) Bamboo: Functionally Graded Composite 390 Material, Asian Journal of Civil Engineering (Building and Housing), 4(1), 1-10. 391
Grosser and Liese (1971) On the anatomy of Asian Bamboos, with Special Reference to their vascular 392 bundles. Wood Science and Technology, 5, 290-312. 393
Habibi, M.K., Samaei, A.T., Gheshlaghi, B., Lu, J. and Lu, Y. (2015) Asymmetric flexural behaviour 394 from bamboo’s functionally graded hierarchical structure: Underlying mechanisms, Acta 395 Biomaterialia, 16, 178-186. 396
Halpin, J.C. and Kardos, J.L. (1976) The Halpin-Tsai Equations: A Review, Polymer Engineering and 397 Science 16(5), 344-352. 398
Harries, K.A., Bumstead, J., Richard, M.J. and Trujillo, D. (2017) Geometric and Material Effects on 399 Bamboo Buckling Behaviour, ICE Structures and Buildings Themed issue on bamboo in structures 400 and buildings, 170(4), 236-249. 401
Hewitt, R.L. and de Malherbe, M.C. (1970) An Approximation for the Longitudinal Shear Modulus of 402 Continuous Fiber Composites, Composite Materials, 4, 280. 403
Hoaglin, D.C. (2003) John W. Tukey and Data Analysis, Statistical Science 18(3), 311-318. 404
ISO 22157:2019 Bamboo structures -- Determination of physical and mechanical properties of bamboo 405 culms -- Test methods. International Organization for Standardization 406
Janssen, J. (1981) Bamboo in Building Structures. Doctoral Dissertation, Eindhoven University of 407 Technology, Netherlands. 408
Janssen, J.J.A., (2000) Designing and Building with Bamboo, INBAR Technical Report 20. International 409 Network for Bamboo and Rattan, Beijing, China. 410
Krause, J.Q., Andrade Silva, F., Ghavami, K., Gomes, O.F.M, Toledo Filho, R.D., On the influence of 411 Dendrocalamus giganteus bamboo microstructure on its mechanical behavior, Construction and 412 Building Materials, 127, 199-209. 413
Liese, W. (1998) The Anatomy of Bamboo Culms, Brill. 204 pp. 414
Liese, W. and Weiner, W. (1996) Ageing of Bamboo Culms. A Review. Wood Science and Technology, 415 30, 77-89. 416
Mallick, P. K. (2008). Fiber-reinforced composites: materials, manufacturing, and design (third edition). 417 CRC press. 418
Mitch, D., Harries, K.A., and Sharma, B. (2010) Characterization of Splitting Behavior of Bamboo 419 Culms. ASCE Journal of Materials in Civil Engineering 22, 1195-1199. 420
Nogata, F. and Takahashi, H. (1995) Intelligent functionally graded material: bamboo, Composites 421 Engineering, 5, 743-751. 422
Osorio L., Trujillo E., Lens F., Ivens, J. Verpoest, I. and Van Vuure, AW., (2018) In-depth study of the 423 microstructure of bamboo fibres and their relation to the mechanical properties. Journal of Reinforced 424 Plastics and Composites 37, 1099-1113 425
Richard, M. (2013) Assessing the Performance of Bamboo Structural Components, Doctoral Dissertation, 426 University of Pittsburgh. 427
Richard, M., Gottron, J., Harries, K.A. and Ghavami. K. (2017) Experimental Evaluation of Longitudinal 428 Splitting of Bamboo Flexural Components, ICE Structures and Buildings Themed issue on bamboo in 429 structures and buildings, 170(4), 265-274 430
Richard, M.J., Harries, K.A., (2015) On Inherent Bending in Tension Tests of Bamboo, Wood Science 431 and Technology 49(1) 99-119. 432
Shao, Z.P., Zhou, L., Liu, Y.M., Wu, Z.M. and Arnauld, C. (2010) Differences in structures and strength 433 between internode and node sections of Moso bamboo, Journal of Tropical Forest Science, 22(2), 434 133-138. 435
Sharma B, Gatoo A, Bock M, Ramage M (2015) Engineered Bamboo for structural applications. 436 Construction and Building Materials, 81, 66-73. 437
Sharma, B., Harries, K.A. and Ghavami, K. (2012) Methods of Determining Transverse Mechanical 438 Properties of Full-Culm Bamboo, Journal of Construction and Building Materials, 38, 627-637. 439
Sharma, B. and Harries, K.A. (2012). Effect of Fiber Gradation on the Edge Bearing Strength on Bamboo 440 Culms, Key Engineering Materials, Vol 517, pp 63-70. 441
Tan, T., Rahbar, N., Allameh, S.M., Kwolfie, S., Dissmore, D., Ghavami, K. and Soboyejo, W.O. (2011) 442 Mechanical Properties of functionally graded hierarchical bamboo structures, Acta Biomaterialia 7, 443 3796-3803. 444
Vaessen, M.J. and Janssen, J.A. (1997) Analysis of the critical length of culms of bamboo in four-point 445 bending tests, HERON, 42(2), 113-124. 446
Virgo, J., Moran, R., Harries, K.A., Garcia, J.J., and Platt, S. (2017) Flat Ring Flexure Test for Full-Culm 447 Bamboo, Proceedings of 17th International Conference on Non-Conventional Materials and 448 Technologies (17NOCMAT), Yucatán, México, November 2017. 449
Yao, L.H., Wang, X.M. and Fei, B.H. (2011) Study on Permeability Coefficient of Different Bamboo/Fir 450 Veneer Surface, Advanced Materials Research, 311-313, 1634-1637. 451
Zeng, Q., Zhang, Q., Lu, Q., Zhou, Y., Chen, N., Rao, J. and Fan, M. (2019; in press) Wetting behavior 452 and laminate bonding performance of profiled tangential surfaces of moso bamboo, Industrial Crops 453 and Products 454
455

Table 1 Summary of through-culm wall fibre volume and modulus distributions. 456
ref1 method2 species
B
M
T3
gross section interior (x = 0) exterior (x = 1)
proposed relationship Vf
EL
(GPa) Vf
EL
(GPa) Vf
EL
(GPa)
1, 2 IA general nr 0.40 - 0.20 - 0.60 - Vf = 0.40x + 0.20
3 Vf: IA
EL: RoM P. edulis
B - 9.1 0.09 2.5 0.77 22.6 exponential Vf
EL = (EL,x=0)e2.2x T - 13.7 0.11 3.8 0.88 33.8
4 Vf: IA
EL: tens P. edulis
B 0.25 - 0.17 4 0.50 29
exponential Vf and EL M 0.28 - 0.18 6 0.56 30
T 0.34 - 0.10 6 0.60 32
5 IA P. edulis nr 0.28 - 0.12 - 0.62 - Vf = 0.49x2 + 0.0066x + 0.12
5 IA D. giganteus
B 0.42 - 0.29 - 0.53 - Vf = -0.09x2 + 0.33x + 0.29
M 0.43 - 0.21 - 0.62 - Vf = 0.07x2 + 0.29x + 0.26
T 0.43 - 0.19 - 0.60 - Vf = -0.12x2 + 0.51x + 0.21
6 Vf: SEM
EL: tens G. angustifolia
B 0.26 16.0 0.19 - 0.62 - Vf = 0.83x2 –0.41x + 0.19
M 0.26 14.6 - - 0.54 - Vf = -1.02x3 + 2.61x2– 1.38x + 0.33
T - 13.2 - - 0.54 - Vf = -4.13x4 + 9.68x3 – 6.68x2 + 1.71x – 0.04
7 tens P. edulis M - - 0.12 4.5 0.54 21 EL = 40.13Vf + 0.22
8 nano P. edulis nr - - - 6.5 - 13.8 none reported
9 SEM P. edulis
B 0.21 - 0.06 - 0.52 - Vf = (0.23x + 0.71)(0.09e1.83x)
M 0.23 - 0.06 - 0.58 - Vf = (0.23x + 0.71)(0.09e1.48x)
T 0.26 - 0.06 - 0.69 - Vf = (0.23x + 0.71)(0.09e2.11x)
10 Vf: SEM
EL: nano
P. edulis nr - 14.9 0.07 - 0.58 -
none reported G. angustifolia nr - 19.7 0.16 - 0.60 -
B. stenostachya nr - 13.8 0.05 - 0.42 -
11 flex P. edulis nr - 8.7 - 2.8 - 15.2 EL = 12.43x0.43 + 2.78
12 Vf: SEM
EL: tens
D. giganteus M - - 0.38 17.6 0.55 30.7 culm wall divided into thirds
at x = 0.5 - - 0.45 27.3 - -
this
study IA
P. edulis B 0.29 - 0.12 - 0.67 - Vf = 1.41x3 – 1.23x2 + 0.50x + 0.10
P. bambusoides B 0.32 - 0.14 - 0.65 - Vf = 0.96x3 – 0.91x2 + 0.57x + 0.10
P. nigra B 0.26 - 0.07 - 0.64 - Vf = 0.94x3 – 0.63x2 + 0.36x + 0.06
P. meyeri B 0.35 - 0.11 - 0.70 - Vf = 0.15x3 + 0.34x2 + 0.17x + 0.11
B. stenostachya B 0.35 - 0.24 - 0.64 - Vf = 1.75x3 – 1.98x2 + 0.75x + 0.20
all four
Phyllostachys B - - - - - - Vf = 0.86x3 – 0.61x2 + 0.40x + 0.09
x = normalized dimension through culm wall; Vf = fibre volume ratio; EL = longitudinal tensile modulus of elasticity 1references: 1 = Janssen 1981; 2 = Vaessen and Janssen 1997; 3 = Nogata and Takahasi 1995; 4 = Amada et al. 1996; 5 = Ghavami et al. 2003; 6 =
Ghavami and Marhinho 2005; 7 = Shao et al. 2010; 8 = Tan et al. 2011; 9 = Dixon and Gibson 2014; 10 = Dixon et al. 2015; 11 = Habibi et al. 2015;
12 = Krause et al. 2016 2 methods of determining data: IA = image analysis; SEM = scanning electron microscope; RoM = rule of mixtures; tens = tension tests; nano =
nanoindentation; flex = flexural tests 3 locational along height of culm: B = bottom; M = middle; T = top; nr = not reported
457
458

Table 2 Mechanical properties bamboo used in this study (COV in parentheses). 459
species
density at 12%
MC, ρ12
moisture content at
time of test
compressive
strength, fc
longitudinal shear
strength, fv
kg/m3 % MPa MPa
P. edulis 896 (0.01) 14.0 48.1 (0.20) 15.1 (0.11)
P. bambusoides 818 (0.04) 14.6 59.3 (0.26) 14.6 (0.22)
P. nigra 907 (0.02) 14.8 45.2 (0.13) 14.6 (0.16)
P. meyeri 840 (0.04) 13.7 55.8 (0.11) 16.4 (0.05)
B. stenostachya 616 (0.03) 13.0 46.0 (0.21) 9.9 (0.11)
460
461

Table 3 Summary of experimental results on clipped specimens (COV in parentheses). 462
species
full-culm control specimens clipped specimens
n D t frC
n D t
fr/frC ∫
𝑓𝑟𝑓𝑟𝐶
𝑑𝑥 mm mm MPa mm mm
P. edulis 33 117
(0.06)
10.1
(0.10)
17.3
(0.18) 13
112
(0.05)
9.5
(0.09)
4.0x2 – 4.9x + 2.3
(R2 = 0.82) 1.18
P. bambusoides 27 95.5
(0.05)
8.2
(0.22)
15.7
(0.21) 14
94.8
(0.06)
8.1
(0.24)
2.6x2 – 2.5x + 1.5
(R2 = 0.31) 1.12
P. nigra 31 93.5
(0.03)
6.7
(0.19)
15.6
(0.14) 16
92.4
(0.01)
6.5
(0.14)
0.7x2 – 0.8x + 1.4
(R2 = 0.08) 1.23
P. meyeri 49 65.3
(0.12)
6.6
(0.10)
20.0
(0.16) 20
65.2
(0.09)
6.4
(0.11)
2.4x2 – 1.8x + 1.1
(R2 = 0.59) 1.00
B. stenostachya 39 77.5
(0.06)
14.5
(0.32)
9.4
(0.13) 17
75.4
(0.06)
14.7
(0.28)
4.1x2 – 3.6x + 1.6
(R2 = 0.77) 1.17
463
464

Table 4 Summary of results from specimens having outer layer removed (COV in parentheses). 465
species n
D t modulus of
rupture, fr deflection, δ fr/δ
mm mm MPa p1 mm p1 MPa/mm p1
P. bambusoides 10 99.6
(0.01)
6.47
(0.09)
18.1
(0.08) 0.09
1.86
(0.13) 0.00
9.9
(0.14) 0.01
outer layer
removed 10
99.8
(0.01)
0.92t
(0.04)
19.7
(0.12)
2.30
(0.16)
8.4
(0.08)
P. nigra 10 96.0
(0.01)
8.44
(0.03)
26.4
(0.16) 0.75
2.10
(0.09) 0.59
12.6
(0.15) 0.99
outer layer
removed 9
95.8
(0.01)
0.95t
(0.02)
26.0
(0.06)
2.06
(0.06)
12.6
(0.06)
P. meyeri 4 62.8
(0.00)
6.58
(0.02)
22.5
(0.08) 0.22
0.95
(0.20) 0.06
25.0
(0.33) 0.09
outer layer
removed 5
62.9
(0.01)
0.95t
(0.02)
21.0
(0.07)
1.21
(0.14)
17.6
(0.14)
B. stenostachya 7 71.7
(0.02)
15.00
(0.03)
13.8
(0.10) 0.86
1.59
(0.22) 0.10
9.3
(0.30) 0.13
outer layer
removed 9
72.2
(0.02)
0.95t
(0.04)
14.0
(0.09)
1.91
(0.18)
7.6
(0.17) 1 p-values indicate the probability that there is no statistical difference between the compared samples
466 467

a) longitudinal section of bamboo
culm showing portions of internodes
to either side of node
b) cross section of
culm near node
diaphragm
c) section
through culm
wall
d) vascular
bundle
Figure 1 Anatomy of bamboo culm showing functionally graded distribution of fibre in culm wall 468 [adapted from Richard 2013]. 469
470
vessel
fiber
fiber
lignin
471
472
Figure 2 Distribution of fibres and modulus through culm wall based on rule of mixtures. 473
474
0.00
0.25
0.50
0.75
1.00
1.25
1.50
1.75
2.00
2.25
2.50
0.0 0.1 0.2 0.3 0.4 0.5 0.6 0.7 0.8 0.9 1.0
←inner normalised culm wall thickness, x outer →
fibre volume ratio, Vf
Vf /Vf,average
EL/EL,averageET/ET,average
Vf = (0.23x + 0.71)(0.09e1.83x) [Dixon and Gibson 2014]
Ef /Em = 19.4 [Janssen 1981, 2000]
EL = Vf Ef + (1-Vf )Em [rule of mixtures; Eq. 1]
ET = Em(1 + 2nVf)/(1-nVf) [Halpin-Tsai; Eq. 3]

a) test set-up schematic and dimensions b) test being conducted in universal test
machine (shown: 100 mm diameter culm tested
over 80 mm span with 25 mm shear span)
Figure 3 Flat ring flexure test. 475
476
477
478
D = culm diameter
0.18D L 0.22D≤ ≤
0.8D S 0.9D≤ ≤
a 0.33S≥a S - 2a

a) test specimen schematic and dimensions b) specimen machining (shown: β = 0, α
= 0.20t and therefore, γ = 0.80t)
Figure 4 Flat ring flexure specimen. 479
480
R = 19 mm
R = 9.5 mm
N
S
EW
a
b
g
approximate locationsof loads and reactions
D
S = 0.8D
a = 0.33S
t

a) image of culm wall b) MatLab pixel map of fibres
divided into ten layers
c) fibre volume distribution
for 28 P edulis samples, Black
line corresponds to image in
figures a) and b)
Figure 5 Example of digital image analysis of culm wall (P.edulis sample shown) 481
482
483
484
485
0.0
0.1
0.2
0.3
0.4
0.5
0.6
0.7
0.8
0.9
1.0
0.0 0.2 0.4 0.6 0.8
no
rmal
ised
cu
lm w
all
thic
kn
ess
fibre volume ratio, Vf

a) P. edulis b) P. bambusoides
c) P. nigra d) P. meyeri
e) B. stenostachya
Figure 6 Variation of modulus of normalised rupture through culm wall section. 486
487
0.0
0.2
0.4
0.6
0.8
1.0
1.2
1.4
1.6
1.8
2.0
0 0.1 0.2 0.3 0.4 0.5 0.6 0.7 0.8 0.9 1
inner wall normalised wall thickness outer wall
Vf
experimentally determined fr/frC
Halpin-Tsai predicted fr/frC
fr/frC = 4.0x2-4.9x+2.3
0.0
0.2
0.4
0.6
0.8
1.0
1.2
1.4
1.6
1.8
2.0
0 0.1 0.2 0.3 0.4 0.5 0.6 0.7 0.8 0.9 1
inner wall normalised wall thickness outer wall
Vf
experimentally determined fr/frC
Halpin-Tsai predicted fr/frC
fr/frC = 2.6x2-2.5x+1.5
0.0
0.2
0.4
0.6
0.8
1.0
1.2
1.4
1.6
1.8
2.0
0 0.1 0.2 0.3 0.4 0.5 0.6 0.7 0.8 0.9 1
inner wall normalised wall thickness outer wall
Vf
experimentally determined fr/frC
Halpin-Tsai predicted fr/frC
fr/frC = 0.7x2-0.8x+1.4
0.0
0.2
0.4
0.6
0.8
1.0
1.2
1.4
1.6
1.8
2.0
0 0.1 0.2 0.3 0.4 0.5 0.6 0.7 0.8 0.9 1
inner wall normalised wall thickness outer wall
Vf
experimentally determined fr/frC
Halpin-Tsai predicted fr/frC
fr/frC = 2.4x2-1.8x+1.1
0.0
0.2
0.4
0.6
0.8
1.0
1.2
1.4
1.6
1.8
2.0
0 0.1 0.2 0.3 0.4 0.5 0.6 0.7 0.8 0.9 1
inner wall normalised wall thickness outer wall
Vf
experimentally determined fr/frC
Halpin-Tsai predicted fr/frC
fr/frC = 4.1x2-3.6x+1.6

488
Figure 7 Comparison of full-culm specimens and those having only outer layer removed. 489
490
0
5
10
15
20
25
30
35
0.00 0.50 1.00 1.50 2.00 2.50 3.00
mo
du
lus
of
rup
ture
, f
r(M
Pa)
Deflection, d (mm)
full culm
outer layer removed
Linear (full culm)
Linear (outer layer removed)
P. bambusoides
P. nigra
P. meyeri
B. stenostachya

491 Figure 8 SEM image of P.edulis vascular bundle 492
493
0.2 mm
parenchyma
fibre bundle
vessel

494 495
Figure 9 Detail of culm wall images of P. edulis specimen 496 (note that images in parts b and c are not the same specimen as shown in a) 497
498
Lt
0.5 mm
0.5 mm
b
c
outer wall
inner wall
fibre
fibre
fibre
fibre
parenchyma(intact cell walls)
parenchyma(intact cell walls)
parenchyma(intact cell walls)
parenchyma(cell walls failed)
parenchyma(intact cell walls)
parenchyma(cell walls failed)
fibre
vessel (void)
vessel (void)
b)
a)
c)

499
a) parenchyma between two fibre bundles near outer culm wall
b) parenchyma near inner culm wall
Figure 10 SEM images of P. edulis parenchyma. 500 501
0.2 mm
fibre bundle
fibre bundle
sheets ofintact
parenchyma cells
0.2 mm

50 μm
10 μm
a) near inner culm wall b) middle of culm wall c) near outer culm wall
Figure 11 SEM images of parenchyma cell wall interstices (Zeng et al. 2019) 502 503


![Flexural creep behavior of bamboo culm (Phyllostachys ... · sorptive behavior were discussed. Gottron et al. [13] studied the effect of the orientation of bamboo specimens to creep](https://img.dokumen.tips/doc/110x75/5d0ca96488c9937a4f8b8588/flexural-creep-behavior-of-bamboo-culm-phyllostachys-sorptive-behavior.jpg)


