Embed Size (px)
Citation preview
Geometric and material effects on bamboo buckling behaviour Harries, K. A. , Bumstead, J. , Richard, M. and Trujillo, D. Author post-print (accepted) deposited by Coventry University’s Repository Original citation & hyperlink: Harries, K. A. , Bumstead, J. , Richard, M. and Trujillo, D. (2016) Geometric and material effects on bamboo buckling behaviour. Proceedings of the Institution of Civil Engineers - Structures and Buildings, volume (in press)
http://dx.doi.org/10.1680/jstbu.16.00018 DOI 10.1680/jstbu.16.00018 ISSN 0965-0911 ESSN 1751-7702 Publisher: Thomas Telford Copyright © and Moral Rights are retained by the author(s) and/ or other copyright owners. A copy can be downloaded for personal non-commercial research or study, without prior permission or charge. This item cannot be reproduced or quoted extensively from without first obtaining permission in writing from the copyright holder(s). The content must not be changed in any way or sold commercially in any format or medium without the formal permission of the copyright holders. This document is the author’s post-print version, incorporating any revisions agreed during the peer-review process. Some differences between the published version and this version may remain and you are advised to consult the published version if you wish to cite from it.
Geometric and Material Effects on Bamboo Buckling Behaviour
Kent A. Harries1, James Bumstead2, Michael Richard3 and David Trujillo4
Abstract
Bamboo is a functionally graded material that has evolved to resist its primary loading in nature. This
study focuses on the effects of geometric and material property variation along the culm length on the
capacity of an axially-loaded member. Conservatively, compression capacity may be calculated using the
smallest section of the member; however, this results in an inefficient use of the culm and may limit the
use of long compression members. A more realistic estimate of capacity is obtained by considering the
effects of culm taper on buckling capacity. Culm taper is experimentally investigated for three
representative bamboo species. The effects of culm section gradient on geometric properties is examined
followed by an assessment of geometric variation along the culm height. Following this, a series of
buckling analyses of tapered culms is conducted to illustrate the significant effects of taper on culm
compression capacity. This analysis is supplemented with comparisons to experimental culm buckling
data. Beyond compressive capacity, the implications of culm taper are discussed in terms of flexural
behaviour, design of gridshells (involving pre-bent axial load-carrying members), visual grading of
bamboo and ultimately classification of the many species of bamboo presently used in construction
worldwide.
Keywords: Columns, Developing Countries, Materials Technology
1 Bicentennial Board of Visitors Faculty Fellow and Associate Professor, University of Pittsburgh,
Department of Civil and Environmental Engineering, Pittsburgh, USA; [email protected] 2 Undergraduate Research Assistant, University of Pittsburgh, Department of Civil and Environmental
Engineering 3 Engineer, SGH, Boston; formerly PhD Researcher, University of Pittsburgh 4 Senior Lecturer, Coventry University, Faculty of Engineering and Computing, Coventry, UK
Introduction
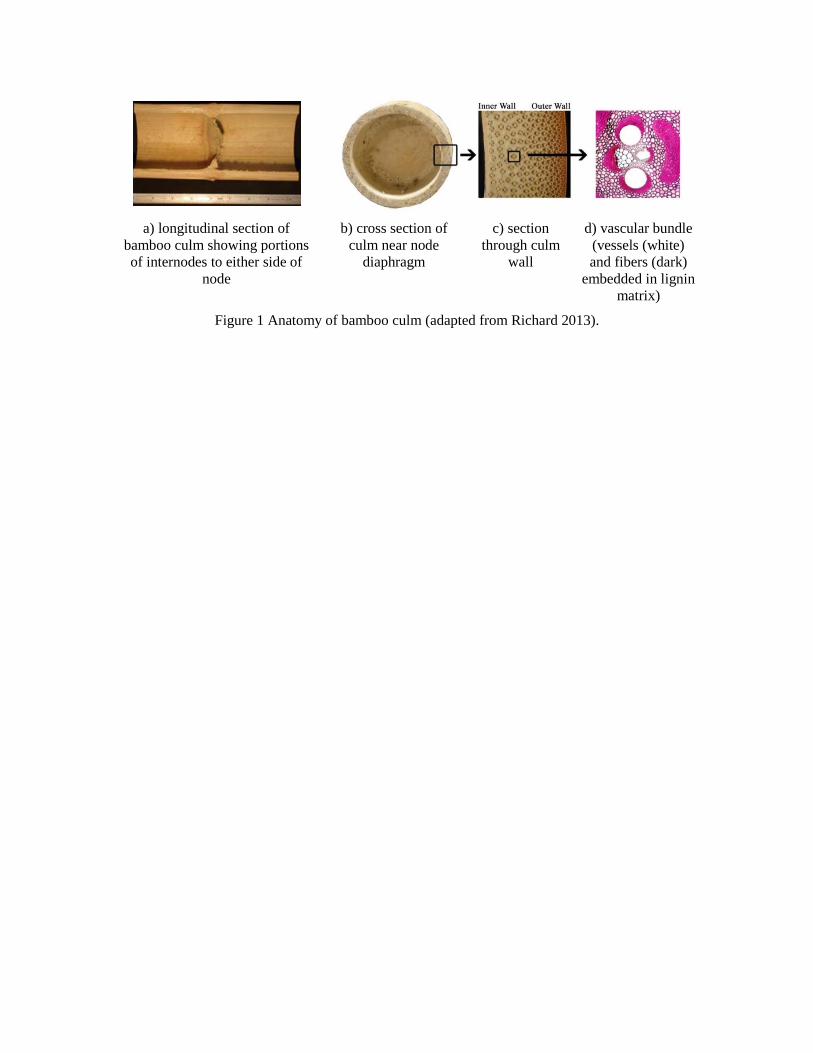
The structure of bamboo is composed of culms (poles) with solid transverse diaphragms or ‘nodes’
separating hollow inter-nodal regions along its height (Fig. 1a). The circular cross section (Figs 1b-d) is
composed of unidirectional cellulosic fibers (about 40% by volume) oriented parallel to the culm’s
longitudinal axis embedded in a parenchyma tissue matrix (50%; the remaining 10% being vessels for
fluid transport) (Janssen 2000). The parenchyma tissue matrix hardens or lignifies as the culm matures
leading to an increase in density and an improvement in mechanical properties. Lignin content in bamboo
is about 20 to 26%, similar to that of soft (24-37%) and hard (17-30%) wood species (Li et al. 2007).
Bamboo is a functionally graded material (FGM) that has evolved to resist its primary loading in nature:
its own self-weight and the lateral effects of wind. As seen in Fig. 1c, the density of fibers increases from
the culm’s inner wall to the outer wall. The wall thickness is largest at the base of the culm and decrease
with height up the culm. However, the size and quantity of vessels decrease with the height of the culm
(used for nutrient transport, their volume may be reduced with increased culm height) and are replaced
with cellulosic fibers. This addition of fibers compensates for loss in strength and stiffness due to
reductions in diameter and wall thickness near the top of the culm, resulting in relatively uniform
engineering properties along the entire culm height (Amada et al. 1996). Finally, the thin, dense, silica-
containing outer layer of the culm wall serves as protection for the plant but can dull tools when bamboo
is used in construction.
Material properties of bamboo are mostly comparable to conventional hard wood timber. Like any fiber-
reinforced material, mechanical properties are highly correlated to the proportion and distribution of
fibers in the cross section. Mechanical properties are influenced by density, which depends on fiber
content, fiber diameter, and cell wall thickness (Janssen 2000). The density of most bamboo is 600 – 800
kg/m3 but depends on species, growing conditions, and position along the culm. Fibers are approximately
60-70% by weight of the culm. The volume fraction of fibers ranges from approximately 60% at the
exterior face of the culm wall to 10-15% near the interior face (Fig. 1c). The variation in density through
the culm wall has been assumed by previous researchers to be linear (Duff 1941; Janssen 1981; Vaessen
and Janssen 1997), quadratic (Ghavami et al. 2003), exponential (Nogata and Takahashi 1995; Dixon and
Gibson 2014) or a power function (Habibi et al. 2015) and is known to be species-dependent (Amada et
al. 1996 and 1997). Regardless, due to the complex variation of the fibers and vascular bundles, the
variation of mechanical properties through the culm-wall thickness has been shown to be significant
(Richard and Harries 2015) and to have the effect of increasing gross culm stiffness by about 10% as
compared to a uniform distribution of the same volume of fibers (Janssen 2000). Density also increases
along the height of a culm (Amada et al. 1996; Janssen 2000; Correal and Arbelaez 2010). Additionally,
the variation of density through the culm wall thickness has also been observed to vary somewhat with
height as the fiber content becomes greater at the outer wall surface and less at the inner (Ghavami et al.
2003).
Why is Variation of Culm Section Geometry with Length of Interest?
An understanding of the variation of culm geometry along culm length may be relevant to the following
areas or study.
Compression Behaviour – Bamboo culms are used as both columns and compression elements in truss
structures. Due to their internode geometry, culm wall buckling is unlikely and most compression
elements will have their capacity controlled by their global, or Euler buckling behaviour. Conservatively,
this capacity may be calculated using the smallest section of the element; however, this results in an
inefficient use of the culm and may limit the use of long compression members. A more realistic estimate
of capacity is obtained by considering the effects of taper (Gere and Carter 1962; Williams and Aston,
1989) on culm buckling capacity (Yu et al. 2003).
Flexural Behaviour – Flexural tests are often used to assess suitability of bamboo culms for use in
structural applications and to obtain values used in design including modulus of rupture (ISO 2004) and
longitudinal shear capacity (Richard 2013). A tapered flexural element has a varying distribution of stress
along the span affecting the determination of these fundamental properties (Naresworo and Bahtiar 2013).
Gridshell Design – Bamboo gridshell structures have been proposed (Eells et al. 2013). Techniques for
form-finding for gridshells (Douthe et al. 2006) are based on uniform properties along the lengths of the
members of the gridshell. Accurate knowledge of the mechanical and geometric properties of individual elements
is essential in form-finding grid shells, determining their boundary conditions, and locating foundation elements
and determining the stresses these must carry. Therefore being able to model the variation of properties
along the length of a culm is critical if bamboo gridshells are to be developed. Without this, every
gridshell will be designed in an ad hoc fashion in which the final shape and boundary conditions are only
known after the shell has been formed; this is not practical for a gridshell of any practical size.
Visual Grading of Bamboo – Development of a standardised method of grading full-culm bamboo for
structural use has been proposed (Trujillo 2013). Easily measured geometric properties such as diameter
and internode length may be related to culm wall thickness, and therefore be used to estimate geometric
properties without resorting to more complex non-destructive techniques to obtain the wall thickness. The
present authors contend that internode spacing, culm diameter and culm wall thickness are related in order
to ensure that the culm wall does not buckle due to the effects of axial or lateral load. Indeed, establishing
relationships for the along-culm variation would require only dimensions at the top or bottom of the culm
to be known.
Classification of Structural Bamboo – Every species of bamboo has different geometric and physical
characteristics. While a handful of species dominate structural applications based on their regional
availability (Phyllostachys edulis (Moso) in China, Bambusa stenostachya (Tre Gai) and Dendrocalamus
giganteus in South East Asia, and Guadua angustifolia (Guadua) in South America, for instance), it is
estimated that as many as 100 species are suitable for load-bearing applications (Liese 1987). If
standardisation of full-culm bamboo is a goal, it will be practically necessary to classify species in some
manner relative to their structural characteristics. The National Building Code of India (2005), for
instance, classifies 16 species of Indian bamboo into three groups based on flexural behaviour (modulus
of rupture and flexural modulus of elasticity); this requires destructive testing of culms. Shigematsu
(1957) proposed grouping bamboo species by their geometric characteristics, proposing four groupings
based on observed D/t ratios (where D is the culm diameter and t is the wall thickness). Shigematsu
presents formulae for estimating D, t and D/t for 16 Japanese species of bamboo (including Moso) based
on culm length normalised by internode number, offering a potentially useful approach of visual
classification and grading. The present authors contend that classifying species as being either thin- or
thick-walled is a first step to structural classifications; this will be explored further in the present work.
Measured and Calculated Culm Geometric Parameters of a Bamboo Culm
The following measured culm geometric properties and notation are used in this paper (Figure 2).
n – internode number (base of culm : n = 1)
L – overall length of culm
Ln – length of internode n
Dn – diameter (average of two measurements) at middle of internode n
D0 – diameter at base of culm
tn – wall thickness (average of four measurements) at middle of internode n
From these, the following calculated geometric properties are obtained:
area of culm section: An = (π/4) [Dn2 – (Dn-2tn)
2] [1]
moment of inertia of culm section: In = (π/64)[Dn4 – (Dn-2tn)
4] [2]
radius of gyration of culm section: rn = (In/An)1/2 = 0.25[Dn
2 + (Dn-2tn)2]1/2 [3]
Material Properties through Culm Wall Thickness
Often bamboo is treated as a fibre-reinforced material in which the ‘rule of mixtures’ is used with the
fiber volume fraction, V, and gradation through the culm wall to determine modulus (e.g.: Ghavami et al.
2003; Amada et al. 1996; Ghavami 2008; Li and Shen 2011; Dixon and Gibson 2014). As shown
schematically in Figure 2, the longitudinal fibre volume ratio at internode Vn(t) is a function of wall
thickness t. The fibre volume ratios at the inner and outer regions of the culm wall (Fig. 1c) have been
shown to be relatively consistent across species approximately equal to Vinner = 0.10 and Vouter = 0.60 (e.g.:
Janssen 1981 and 2000; Nogata and Takahashi 1995; Ghavami et al. 2003; Dixon and Gibson 2014).
The longitudinal modulus of elasticity, En(t) is assumed to be a function of Vn(t) and determined using the
rule of mixtures:
E = VEf + (1-V)Em [4]
Janssen (1981, 2000) estimates the elastic modulus of a bamboo fibre to be Ef = 35000 MPa and the
elastic modulus of lignin as Em = 1800 MPa. These values will be adopted as the basis for the following
discussion.
As is typical when describing functionally graded materials, the modulus through the culm wall thickness
may be given by the following:
E(t) = (Eouter - Einner)(t/tn)k + Einner [5]
In which Eouter and Einner are the moduli determined at t = tn and t = 0, respectively (Figure 2). The
exponent k describes the fibre volume distribution; for instance, k = 1 for a linear distribution and k = 2
for quadratic. Habibi et al. (2015) report a value of k = 0.43 for samples of p. edulis (Moso); Dixon and
Gibson (2014) report values ranging from k = 1.64 to 2.11 dependent on the height along the Moso culm
and Nogata and Takahashi (1995) propose k ≈ 2.2, also for Moso. In order to reasonably bound the results
reported in the literature, in this discussion values of k= 0.5, 1.0 and 2.0 will be considered.
The variation of fibre volume and therefore modulus results in the ‘centroid’ of the wall cross section, tc
(see Figure 2) as measured by axial stiffness, EA, to shift outward from the geometric centroid of the wall
(i.e., tc = 0.5tn). This shift is a measure of the effect of the assumed variation when compared to the
section properties averaged over the gross culm cross section. The location of the ‘centroid’ of the
modulus distribution will also vary based on the ratio Ef/Em.
Variation of Material Properties Along Length of Culm
Extant studies of material property variation along the height of the culm typically break the culm into
thirds, reporting values for the bottom, middle and top third of the culm. Little definitive data is available
since researchers report different methods of obtaining modulus and variation clearly differs from species
to species (Kamruzzaman et al. 2008). Correal and Arbeldez report an increase in compressive modulus
along 15 m lengths of G. angustifolia from 16.3 to 17.9 GPa (10% increase) but no similar increase in
modulus obtained from bending tests of 5 m lengths of the 15 m culm (17.2 GPa at bottom, middle and
top locations). Amada et al (1996), on the other hand, report an increase in tensile modulus of about 50%
(from about 11.3 to 17.3 GPa) over 13 m lengths of Moso. Kamruzzaman et al. (2008) report increases in
flexural modulus averaging 29% for four Bangladeshi species of bamboo.
Based on Eq. 4, the fibre volume fraction, V, of a section may also stand surrogate for modulus. Qi et al
(2014) report an increase in fibre volume of about 8% over 10 m culms of Neosinocalamus affinis while
Amada et al. (1996) report an increase of almost 100% (from V = 20 to 40%). The latter result would
appear to explain the 50% increase in tension modulus reported. The increase in V will be greater than the
corresponding increase in modulus (Eq. 4).
Amada et al (1996) and Ghavami et al. (2003) report changes in the fibre volume distribution through the
culm wall with height. At higher locations in the culm, the fibre volume fraction increases at the outer
culm wall and decreases at the inner culm wall. While Amada et al. report a significant change in total
fibre volume fraction with height (above), Ghavami et al. reports a smaller increase in total fibre content –
about 12% – over approximately 11 m culms of D. giganteus.
Culm Section Stiffness
Due to the variation in fibre content and therefore modulus through the culm wall thickness, the effective
or apparent axial (EA) and flexural (EI) stiffnesses of the culm section also vary based on the assumed
fibre distribution.
In order to calculate the culm stiffness accounting for variation of modulus through the section, the culm
wall is divided into ten concentric rings (i = 1 to 10) having equal thickness tn/10 (Figure 3) and the
stiffness properties (EA and EI) of each are determined and summed as follows.
The outer diameter of each ring is Di:
Di = Dn-2tn+2i(tn/10) [6]
The geometric properties of the individual rings are:
Ai = (π/4)[Di2 – Di-1
2] [7]
Ii = (π/64)[Di4 – Di-1
4] [8]
The effective culm properties accounting for the variation of through thickness properties are therefore
found from:
Ieff = ∑EiIi/Eavg [9]
reff = ∑(EiIi/AiEi)1/2 [10]
In which Ei is calculated at the middle of each ring using Eq. 5 and Eavg is the average value Ei across the
entire culm wall.
A brief parametric study describing the impact of material variation in the culm section is presented in
Table 1. In all cases, Vinner = 0.10 and Vouter = 0.60 as reported in multiple studies (e.g.: Janssen 1981 and
2000; Nogata and Takahashi 1995; Ghavami et al. 2003; Dixon and Gibson 2014). The effective section
properties are affected by the ratio Ef/Em rather than the specific values of these parameters; here the cases
Ef/Em = 10, 19.4 and 30 are considered where Ef/Em = 19.4 corresponds to that reported by Janssen (1981,
2000). Similarly, the nature of the culm – be it thick- or thin-walled – impacts the effective properties; the
cases Dn/tn = 4 and 10 are shown. Three distributions of modulus (Eq. 5) through the culm wall are
considered: k = 0.5, 1 and 2. Finally, the effective section properties (Eqs 9 and 10) are compared to the
gross section properties (Eqs 2 and 3) in order to illustrate the impact of through culm wall material
variation.
If a single value of E is used across an entire section, Ieff = In, reff = rn and tc/tn = 0.50. Thus it is clearly
seen in Table 1 that the effect of material property variation is to increase the effective geometric
properties of a section. This is the functional gradation that has evolved from the natural loading on the
growing bamboo: lateral wind loads and self-weight of the culms. The increase in effective geometric
properties is seen to be a function of both Ef/Em and Dn/tn. For thin-walled bamboo (Dn/tn = 10), the
increases in effective moment of inertia and radius of gyration are nominal (approximately 6 and 2%,
respectively) regardless of Ef/Em or assumed material variation, k. For thick-walled bamboo (Dn/tn = 4),
the increases are naturally greater and proportional to both Ef/Em and k. Previously, Janssen (2000) reports
an increase in flexural stiffness of approximately 10% due to through-wall property gradation; this value
agrees relatively well with the calculations presented.
Geometric Variation over Length of Culm
Detailed geometric measurements of P. edulis (Moso), G. angustifolia (Guadua) and B. stenostachya (Tre
Gai) culms have been obtained for a variety of studies conducted by the authors’ research groups. Most
culms were used for concentric compression tests, in which case they were selected for their overall
straightness and having minimal defects; thus the culms selected are representative of those suitable for
structural use. Generally, overall culm length was about 2600 mm (Moso and Tre Gai) or 3600 mm
(Guadua) and each culm included from 9 to 18 nodes. Moso and Guadua are ‘thin-walled’ species having
a D/t ratios that average approximately 10 over the length of culms considered. Tre Gai is a ‘thick-wall’
species in which D/t averages approximately 5.5 over the culm length considered.
Culm diameter, Dn, internode lengths, Ln, and initial out-of-straightness were obtained using an apparatus
reported by Richard (2013). The wall thickness, tn, was measured following testing when the culm was
cut at each internode section. Section geometric properties: area, An, moment of inertia, In, and radius of
gyration, rn, were calculated using Equations 1 to 3.
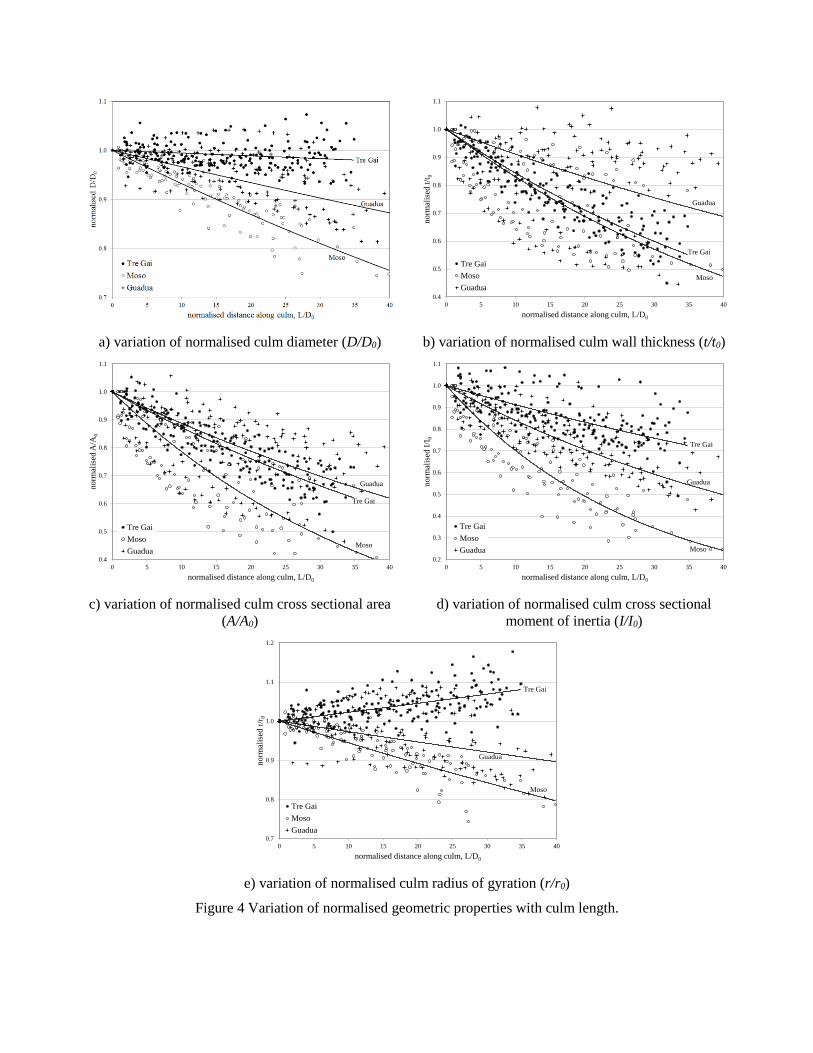
In order to analyse the geometric variation across all culms, section properties were normalized with
respect to the values at the base of the culm (i.e., typically the location of the largest value of diameter)
denoted with a subscript “0”. Furthermore, data is presented using the location along the culm length
normalised by the base diameter, L/D0. Table 2 summarises observed trends in measured (D/D0 and t/t0)
and calculated (A/A0, I/I0 and r/r0) geometric properties along the normalised culm length, L/D0. In all
cases an exponential fit in the form of 𝐷 𝐷0⁄ = 𝑒𝛼(𝐿 𝐷0)⁄ provides the ‘best fit’; the corresponding R2
values are also reported in Table 2. Figure 4 shows the normalised geometric properties for all three
species.
Thin-walled species P. pubescens (Moso)
Data for Moso was obtained from culms having diameters ranging from 60 to 120 mm and wall
thicknesses ranging from 6 to 17 mm. Diameter exhibited a noticeable taper resulting in a reduction in
diameter of about 20% over a typical 2500 mm long culm. Wall thickness taper was also observed to be
significant resulting in a decrease of wall thickness of 20-50% along the length of a 2500 mm culm.
Combining these observations, significant reductions in area and moment of inertia of up to 60% and
75%, respectively, are observed over typical 2500 mm long culms. The combined effect of this variation
results in a decrease in the radius of gyration along the length of the culm of approximately 10 – 20%
over a 2500 mm culm length.
Thin-walled species G. angustifolia (Guadua)
Data for Guadua was obtained from culms having diameters ranging from 50 to 130 mm and wall
thicknesses ranging from 4 to 19 mm. In general, the scatter of the measurements from the Guadua culms
was greater than that of the other two species. Diameter exhibited taper resulting in a reduction in
diameter of about 10% over a typical 3500 mm long culm. Wall thickness taper was observed to be
significant and to vary significantly (as low as 5% and as great as 50%) from culm to culm. Combining
these observations, reductions in area and moment of inertia of approximately 40% were observed over
typical 3500 mm long culms. The combined effect of this variation results in a decrease in the radius of
gyration along the length of the culm of approximately 10% although due to the large variation in
measurements obtained, a number of culms exhibited a marginal increase in the value of radius of
gyration over their length.
Thick-walled species B. stenostachya (Tre Gai)
Data for Tre Gai was obtained from culms having diameters ranging from 65 to 95 mm and wall
thicknesses ranging from 10 to 24 mm. Diameter variation over the culm length for this species was
negligible (hence the low R2 value); typically diameter varied less than 5% from the D0 value. Wall
thickness taper was, however, observed to be significant resulting in a decrease of wall thickness of 30-
50% along the length of a 2500 mm culm. Combining these observations, reductions in area and moment
of were not as significant as for the Moso but were apparent nonetheless. Over typical 2500 mm long
culms, reductions in area and moment of inertia were approximately 30%. Of particular interest is that in
combining these effects, an increase in radius of gyration along the length of the culm is indicated.
Effect of Geometric and Material Property Variation on Culm Buckling
In order to investigate the effect of geometric and material variation on culm buckling, a series of
analyses of pin-supported (i.e., effective length factor, K = 1.0) culms subject to axial load was
conducted. Because it is relatively easily programmed into a spreadsheet, an approach using successive
approximations of the deflected shape of the tapered column (Timoshenko and Gere 1961 Art. 2.15) was
used to determine the critical buckling load of representative bamboo culms. The procedure is
summarised as follows:
1. Assume an approximate deflected shape; a linear approximation was initially assumed between each
culm end and midheight.
2. Determine internal moments due to unit axial load applied to culm having assumed deflected shape.
3. Determine deflections of column having bending moment distribution determined in step 2.
4. Normalise the deflections and update the approximate deflected shape with normalised deflections.
5. Repeat steps 2 through 4 until difference between successive iterations is negligible.
6. The critical buckling load is the inverse of the unnormalised maximum deflection from the final
iteration.
To facilitate integration and modelling both geometric and material property variation, the culm height is
divided into 50 segments of equal length. Thus, from the point of view of analysis, the culm taper is
modelled as 50 steps rather than a continuous taper. The 50-segment solution approach adopted was
benchmarked for prismatic columns and columns having a linear taper (Timoshenko and Gere 1961) and
found to overestimate the ‘exact’ solutions by less than 0.2% and 1%, respectively. This degree of
precision was determined to be acceptable.
Representative pin-ended bamboo culms having an effective length KL = 2500 mm were considered. The
base diameter was D0 = 100 mm and base wall thickness was t0 = 10 mm (representing Moso having D0/to
= 10); 25 mm (Tre Gai having D0/to = 4) or 9 mm (Guadua having D0/to = 11). Nominal sectional
properties were used (Eqs. 1 and 2). The bamboo modulus used was 15080 MPa (using Eq. 4 with V =
0.4, Ef = 35,000 MPa and Em = 1800 MPa). Culm geometric taper was modelled as both linear and using
the relationships presented in Table 2. Culm modulus variation was assumed to be linear. Table 3
summarises the eight cases considered.
The results of the analyses are shown in Table 4. Values are normalised against Case II as this is the most
conservative estimate of culm buckling capacity and the one most likely to be used in the field – that
calculated with the smallest sectional geometry (top of culm) and nominal modulus. Similarly, the critical
stress is calculated using the smallest section area – that at the top of the culm. Due to the effect of taper,
the location of the greatest lateral deflection (hΔmax) shifts from mid-height toward the smaller end of the
culm in the Moso and Guadua analyses (Cases V to VIII). This shift is relatively small and is mitigated by
the increase in modulus from the larger to smaller end of the culm (Cases VII and VIII). No such shift is
seen in the relatively mildly tapered Tre Gai analyses (due to the discretisation of the culm, a resolution of
only 0.02L is available for locating hΔmax).

It is clear from Table 4 that considerable reserve axial capacity may be achieved over that calculated
conservatively assuming a prismatic column having the smallest culm dimension (Case II). Case VI,
while complicated to calculate, represents the most realistic estimate of behaviour if one assumes no
variation of modulus along the culm length. For each 10% in increase in modulus at the top of the culm
relative to that at the base, the buckling capacity increases about 5% (Cases VII and VIII). Simply using
the average geometric properties in a prismatic buckling analysis (Case III) may overestimate the
behaviour determined based on taper (Cases V and VI).
Case III is perhaps the simplest prismatic analysis to apply in practice – simply averaging measured
dimensions from the base and top of the culm. However, since culm taper is not linear, this approach may
overestimate the axial capacity. Case IV, in which a prismatic analysis is used having section properties
calculated at mid-height (L/D0 = 12.5 in this case) from the equations presented in Table 2 and a uniform
modulus appears to provide a reasonable lower bound approximation of Cases VI to VIII, without the
complexity of conducting a buckling analysis of a tapered column.
The difference between the prismatic cases III and IV is best described by the location along the culm
height of the average moment of inertia. In most cases, the moment of inertia at the midheight of the culm
is less than the average of the base and top moments of inertia. This results in the top of the culm being
proportionally more flexible and therefore ‘contributing’ more to the buckling behaviour. This behaviour
is manifest in the small shift of hΔmax, described above. Figure 5 shows the normalized moments of inertia
at midheight for the culms reported in the database. It is seen that in the majority of cases, the average
moment of inertia occurs closer to the base of the culm.
Comparison with Experimental Data
A summary of eight single culm buckling tests – four Moso specimens reported by Bumstead and Harries
(2016) and four Tre Gai reported by Richard (2013) is presented in Table 5. The experimental buckling
load is obtained from a Southwell (1932) analysis of experimental load versus lateral displacement.
Analysis Cases are the same as those reported in Table 3 with the following exceptions: Case IV:
measured values of properties at mid-height are used; and, Case VI: the culm is discretised into its
internodes (segments) and measured geometric properties are used; thus removing the averaging inherent
in using the equations reported in Table 2. Only average experimentally determined modulus values are
available, thus no modulus variation can be investigated (Cases VII and VIII).
The predictions are all consistent and conservative. Case VI may be considered the most realistic analysis
as it accounts for the measured geometric taper in each culm. The buckling capacity predicted using Case
VI is about 81% and 90% of the experimentally observed values for Moso and Tre Gai, respectively. Case
IV predictions are similar: about 76% and 91% of the experimentally observed values for Moso and Tre
Gai, respectively. The degree of conservativeness is perhaps appropriate in a design context. There are a
number of factors hypothesized to contribute to the conservative nature of the predictions using Cases IV
or VI:
1. The analyses do not account for the inherent stiffening effects described in Table 1.
2. As shown in Table 4, an increase in modulus with height along the culm has the effect of mitigating
some of the taper effect. Each 10% increase in modulus has the effect of increasing the buckling load
about 5%.
3. The end conditions in the experimental test set-up, while replicating pins, will necessarily have some
restraint associated with them resulting in a marginally shorter effective length and therefore larger
buckling load.
4. Experimental buckling tests are run in displacement control and, despite using the Southwell
approach, are inherently ‘upper bound’ estimates of theoretical capacity.
Classification of Section Behaviour – Thin- vs. Thick-walled Culms
Considering the theoretical analyses and validations using experimental data presented, this study begins
to suggest a method by which culms may be classified. Behaviour may be classified as being typical of
thin- or thick-walled behaviour. Table 6 provides some general characteristics of each behaviour. It is
proposed that the transition between behaviours be characterised by the variation of radius of gyration
since this captures both axial (A) and flexural (I) geometric properties. Figure 6 shows the data presented
in the present study. Using an increase (thick-walled) or decrease (thin-walled) of the radius of gyration,
r, with culm height as a metric, an easily measured D/t threshold of eight appears to divide the
behaviours. Thus as an initial proposal, bamboo having D/t > 8 have the characteristics of a thin-wall
species and those having D/t < 8 have the characteristics of a thick-walled species.
Discussion and Conclusions
Returning to the question why is variation of culm section geometry with length of interest?, this paper
has illustrated a number of effects of the variation of bamboo properties and provided some basis for
exploring others.
Classification of Structural Bamboo – As described in the previous section, an initial classification of
thin- or thick-walled species helps to describe both geometric properties of culm cross sections and
variation of properties along a culm. It is proposed that D/t = 8 is an appropriate threshold above which to
classify behaviour as being thin-walled and below which behaviour is thick-walled. Clearly, extending the
methodology presented in the present work to other species will permit this classification to be refined.
Compression Behaviour – It is shown that variation of bamboo properties both in a cross section and
along the culm length result in improvement of compressive capacity over that which may be assumed in
a simple analysis. The functionally-graded nature of bamboo in cross section has the effect of increasing
the effective moment of inertia and radius of gyration above that calculated using section geometry alone.
This effect is more pronounced in thick-wall sections in which the apparent moment of inertia may
exceed 1.20 times that calculated using section geometry alone. For thinner-wall members, an increase of
only about 1.05 is observed. Thus, while Janssen’s rule-of-thumb of a 10% increase is generally valid,
this may be better quantified as a 20% increase for thick-walled members and a 5% increase for thin-
walled members.
Longitudinal variation of culm geometry (taper) also affects compressive behaviour. While calculating
the bucking capacity of a tapered member is not practical in most instances, simply assuming prismatic
member geometry having the smallest cross section (Case II in Tables 3 and 4) is overly conservative and
may result in an inefficient use of the culm and/or limit the use of long compression members. This is
especially the case for thin-walled members in which the actual buckling capacity may by 50% or more
greater than this conservative estimate. However, due to the nature of the tapered geometric properties of
the culm it may be nonconservative to simply take an average value of section properties (Case III) to
assess buckling. The data presented indicates that buckling analysis of a prismatic member using
measured mid-height properties (Case IV) provides an appropriate estimate of capacity without the
complexity of analysing a tapered member. Neglecting the increase in effective section properties
resulting from the functionally-graded nature of bamboo should result in sufficient confidence in such an
estimate.
While there is very little data available to quantify the variation of modulus of elasticity with height along
a culm, it is shown that this variation also results in increased buckling capacity. Assuming a linear
variation of modulus, it is shown that for each 10% in increase in modulus at the top of the culm relative
to that at the base, the buckling capacity increases about 5%.
Flexural Behaviour – The effect of the functionally graded nature of bamboo and the taper along the
culm has not been adequately investigated with respect to flexural behaviour. Certainly the increase in
effective section properties is relevant although, at this time, there is very little available data on the
variation of shear properties with culm height (Correal and Arbeldez (2010) report no significant variation
of shear strength with height for Guadua). The interaction of flexure and shear will also be affected by the
geometry of the proposed flexural loading (i.e., the length of the shear span), making the discussion of
flexural behaviour considerably more complex and a topic for significant further study.
Other Applications requiring full culm-height data – Having a better understanding of the variation of
geometric and mechanical properties of bamboo may inform efforts underway (Trujillo 2013) to establish
methods for grading bamboo culms. It is hypothesized that due to the similarity of bamboo load demands
while growing, consistent relationships between sectional and longitudinal geometry should exist that
could be exploited in a grading protocol. Additionally, the inherent stiffening effect of the functionally-
graded nature of the bamboo (both in section and longitudinally) may be exploited to provide greater
confidence in a grading scheme based on geometry and minimal material property sampling. Similarly, a
method for better modelling bamboo structures – in particular the shape finding necessary for the
application of gridshells – requires an approach to modelling the tapered geometry of bamboo.
Both of these applications require geometric study of the entire culm height as it grows rather than from
the relatively short culms used as compression elements described in this work. The in situ growing loads
– predominantly from wind – are the environmental stressors under which the bamboo forms and the
eventual geometric relationships between culm diameter, wall thickness, length, taper and internode
length determined. Practical gridshells, too, will utilise the greatest length of the full culm as possible.
Thus the approach presented in this study may be extended from the investigation of ‘structural members’
presented here, to the study of the full culm as it grows. Finally, it must be acknowledged that there is a
great deal of variation between bamboo species in terms of geometry and material properties. A consistent
approach to these issues, applied to various species – perhaps with some broad classifications such as
thin- and thick-walled – is necessary to validate the trends illustrated in this work. Through such study,
bamboo may be may become established as a conventional structural material.

Acknowledgements
The authors would like to gratefully acknowledge Ms. Mutsuko Grant at the Natural Materials and
Structures research group at the University of Cambridge for her translation of Shigematsu (1958). The
second author was supported by a Swanson School of Engineering Summer Research Internship. The
third author was supported as an NSF IGERT Fellowship (NSF DGE 0504345). All work was supported
by and conducted in the Watkins Haggart Structural Engineering Laboratory at the University of
Pittsburgh.
References
Amada, S., Munekata, T., Nagase, Y., Ichikawa, Y., Kirigai, A. and Zhifei, Y. (1996) The mechanical
structures of bamboos in viewpoint of functionally gradient and composite materials, Journal of
Composite Materials, 30, 800-819.
Amada, S., Ichikawa, T., Munekata, T., Nagase, Y., and Shimizu, H., (1997) Fiber texture and mechanical
graded structure of bamboo, Composites: Part B, 28B, 13-20.
Bumstead, J. and Harries, K.A. (2016) Effect of Variation of Geometric Properties on Bamboo Culm
Buckling, Ingenium: Undergraduate Research at the Swanson School of Engineering, Spring 2016.
Correal, J.F. and Ardelaez, J. (2010) Influence of age and height position on Colombian guadua
angustifolia bamboo mechanical properties, Maderas Ciencia yTechnogia, 12(2), 105-113.
Dixon, P.G. and Gibson, L.J. (2014) The structure and mechanics of Moso bamboo material, Journal of
the Royal Society Interface 11: 20140321.
Douthe, C., Baverel, O., Caron, J.F.,(2006) Form-finding of a grid shell in composite materials, Journal
of the International Association for Shell and Spatial structures, 47(1), 53-62.
Duff, C.H. (1941) Bamboo and its structural uses, The Engineering Society of China, session 1940-41,
paper #ICE-1. Institution of Civil Engineers of Shanghai, 1-27.
Eells, P., Pagliassotti, M., Brown, K., Nites, M., Stein, A., Zimmerman, C., Richard, M., Sharma, B. and
Harries, K.A. (2013) Design of a Rapidly Deployable Bamboo Gridshell Structure, 14th International
Conference Non-conventional Materials and Technologies (IC-NOCMAT 2013), João Pessoa, Brazil.
March 2013.
Gere. J.M and Crater, W.O. (1962) Critical Buckling Loads for Tapered Columns, Journal of the
Structural Division, ST1, 3045, American Society of civil Engineers.
Ghavami, K., (2008) Bamboo: Low cost and energy saving construction materials. Modern Bamboo
Structures, Xiao, Y., Inoue, M., and Paudel S.K., eds., London, UK, 5-21.
Ghavami K, Rodriques CS, Paciornik S (2003) Bamboo: functionally graded composite material. Asian J.
Civ. Eng. (Build Hous.) 4(1),1–10
Habibi, M.K., Samaei, A.T., Gheshlaghi, B., Lu, J. and Lu, Y. (2015) Asymmetric flexural behaviour
from bamboo’s functionally graded hierarchical structure: Underlying mechanisms, Acta
Biomaterialia, 16, 178-186.
International Organization for Standardization (ISO) (2004), ISO 22157-1:2004(E), Bamboo –
Determination of Physical and Mechanical Properties – Part I: Requirements. Geneva, 2004.
Janssen, J., (1981). Bamboo in Building Structures. Doctoral Thesis. Eindhoven University of
Technology, Netherlands.
Janssen, J.J.A., (2000). Designing and Building with Bamboo: INBAR Technical Report 20. International
Network for Bamboo and Rattan, Beijing, China, 211pp.
Kamruzzaman, M., Saha, S.K., Bose, A.K. and Islam, M.N. (2008) Effects of Age and Height on Physical
and Mechanical Properties of Bamboo, Journal of Tropical Forests Science, 20(3), 211-217.
Nogata, F. and Takahashi, H. (1995) Intelligent functionally graded material: bamboo, Composites
Engineering, 5, 743-751.
Nugroho, N. and Bahtiar, E.T. (2013) Bamboo taper Effect on Third Point Loading Bending Test,
International Journal of Engineering and Technology, 5(3), 2379-2384.
Li, X.B., Shupe, T.F., Peter, G.F., Hse, C.Y., and Eberhardt, T.L., (2007). Chemical Changes with
Maturation of the Bamboo Species Phyllostachys Pubescens. Journal of Tropical Forest Science,
19(1), pp. 6-12.

Li, H. and Shen S., (2011). The mechanical properties of bamboo and vascular bundles. Journal of
Materials Research, 26(21), 2749-2756.
Liese, W., (1987). Research on Bamboo. Wood Science and Technology 21, 189-209.
Qi, J.Q., Xie, J.L., Huang, X.Y., Yu, W.J. and Chen, S.M. (2014) Influence of characteristic
inhomogeneity of bamboo culm on mechanical properties of bamboo plywood: effect of culm height,
Journal of Wood Science, 60, 396-402.
Richard M.J. (2013) Assessing the performance of bamboo structural components, PhD Dissertation,
University of Pittsburgh, p 288
Richard, M.J. and Harries, K.A. (2015) On Inherent Bending in Tension Tests of Bamboo, Wood Science
and Technology 49(1), 99-119.
Shigematsu, Y. (1958) Analytical Investigation of the Stem Form of the Important Species of Bamboo,
Bulletin of the Faculty of Agriculture, University of Miyazaki 3, 124-135. (in Japanese)
Southwell, E. V. (1932), On the analysis of experimental observations in problems of elastic stability,
Proceedings of Royal Society of London, 135, 601-616.
Trujillo, D. (2013) Prospects for a method to infer non-destructively the strength of bamboo: a research
proposal, Proceedings of the Third International Conference on Sustainable Construction Materials
and Technologies. 18-21 Aug 2013, Kyoto, Japan
Vaessen, M.J. and Janssen, J.A. (1997) Analysis of the critical length of culms of bamboo in four-point
bending tests, HERON, 42(2), 113-124.
Williams, F.W. and Aston, G. (1989) Exact or Lower Bound Tapered Column Buckling Loads, ASCE
Journal of Structural Engineering 115(5), 1088-1100.
Yu, W.K., Chung, K.F. and Chan, S.L. (2003) Column Buckling of Structural Bamboo, Engineering
Structures 25, 755-768.
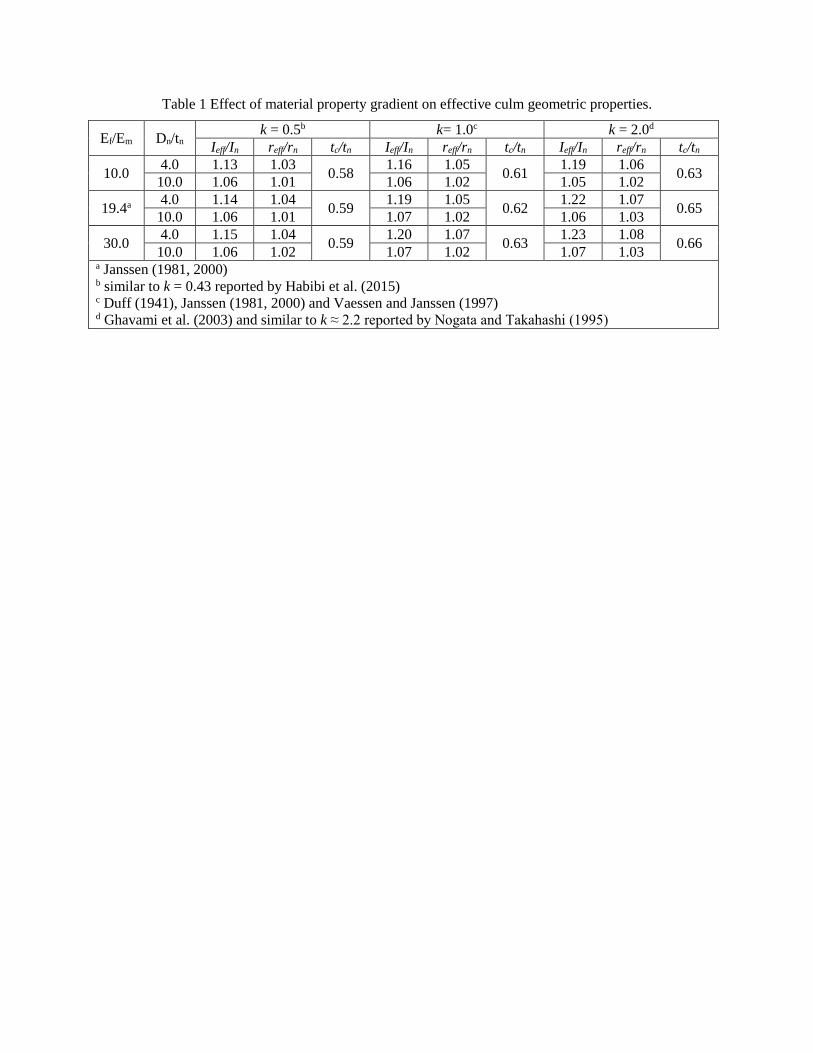
Table 1 Effect of material property gradient on effective culm geometric properties.
Ef/Em Dn/tn k = 0.5b k= 1.0c k = 2.0d
Ieff/In reff/rn tc/tn Ieff/In reff/rn tc/tn Ieff/In reff/rn tc/tn
10.0 4.0 1.13 1.03
0.58 1.16 1.05
0.61 1.19 1.06
0.63 10.0 1.06 1.01 1.06 1.02 1.05 1.02
19.4a 4.0 1.14 1.04 0.59
1.19 1.05 0.62
1.22 1.07 0.65
10.0 1.06 1.01 1.07 1.02 1.06 1.03
30.0 4.0 1.15 1.04
0.59 1.20 1.07
0.63 1.23 1.08
0.66 10.0 1.06 1.02 1.07 1.02 1.07 1.03
a Janssen (1981, 2000) b similar to k = 0.43 reported by Habibi et al. (2015) c Duff (1941), Janssen (1981, 2000) and Vaessen and Janssen (1997) d Ghavami et al. (2003) and similar to k ≈ 2.2 reported by Nogata and Takahashi (1995)
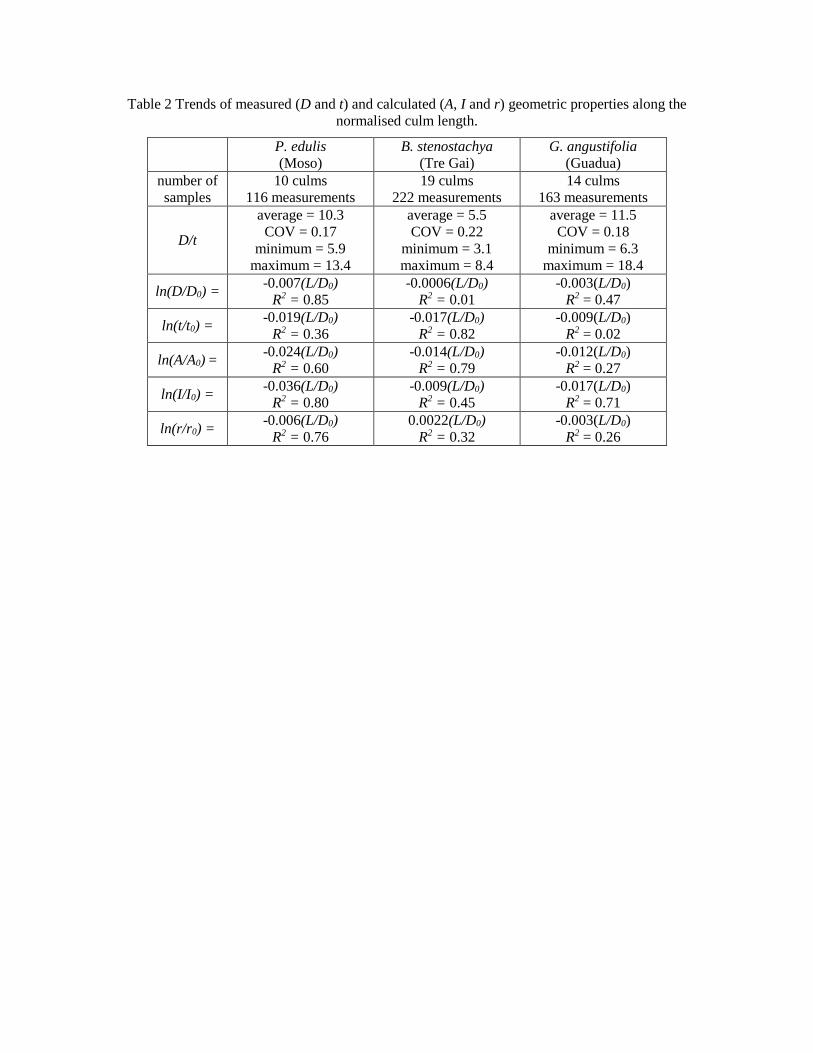
Table 2 Trends of measured (D and t) and calculated (A, I and r) geometric properties along the
normalised culm length.
P. edulis
(Moso)
B. stenostachya
(Tre Gai)
G. angustifolia
(Guadua)
number of
samples
10 culms
116 measurements
19 culms
222 measurements
14 culms
163 measurements
D/t
average = 10.3
COV = 0.17
minimum = 5.9
maximum = 13.4
average = 5.5
COV = 0.22
minimum = 3.1
maximum = 8.4
average = 11.5
COV = 0.18
minimum = 6.3
maximum = 18.4
ln(D/D0) = -0.007(L/D0)
R2 = 0.85
-0.0006(L/D0)
R2 = 0.01
-0.003(L/D0)
R2 = 0.47
ln(t/t0) = -0.019(L/D0)
R2 = 0.36
-0.017(L/D0)
R2 = 0.82
-0.009(L/D0)
R2 = 0.02
ln(A/A0) = -0.024(L/D0)
R2 = 0.60
-0.014(L/D0)
R2 = 0.79
-0.012(L/D0)
R2 = 0.27
ln(I/I0) = -0.036(L/D0)
R2 = 0.80
-0.009(L/D0)
R2 = 0.45
-0.017(L/D0)
R2 = 0.71
ln(r/r0) = -0.006(L/D0)
R2 = 0.76
0.0022(L/D0)
R2 = 0.32
-0.003(L/D0)
R2 = 0.26
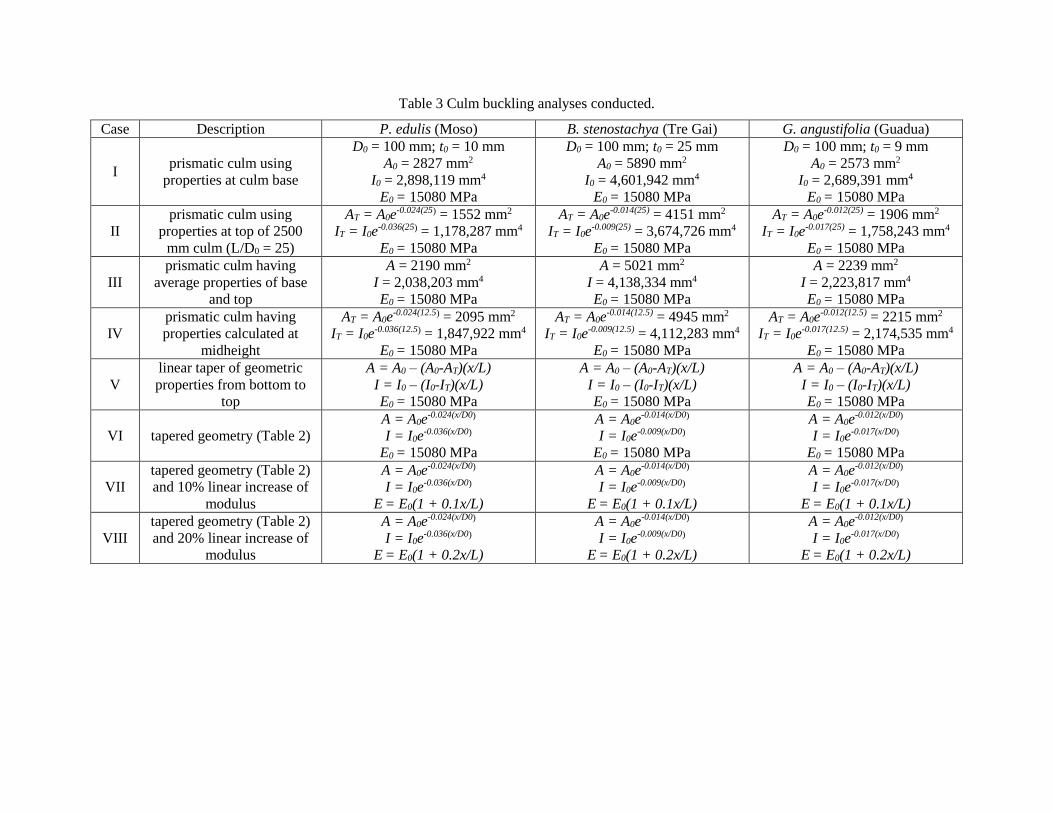
Table 3 Culm buckling analyses conducted.
Case Description P. edulis (Moso) B. stenostachya (Tre Gai) G. angustifolia (Guadua)
I prismatic culm using
properties at culm base
D0 = 100 mm; t0 = 10 mm
A0 = 2827 mm2
I0 = 2,898,119 mm4
E0 = 15080 MPa
D0 = 100 mm; t0 = 25 mm
A0 = 5890 mm2
I0 = 4,601,942 mm4
E0 = 15080 MPa
D0 = 100 mm; t0 = 9 mm
A0 = 2573 mm2
I0 = 2,689,391 mm4
E0 = 15080 MPa
II
prismatic culm using
properties at top of 2500
mm culm (L/D0 = 25)
AT = A0e-0.024(25) = 1552 mm2
IT = I0e-0.036(25) = 1,178,287 mm4
E0 = 15080 MPa
AT = A0e-0.014(25) = 4151 mm2
IT = I0e-0.009(25) = 3,674,726 mm4
E0 = 15080 MPa
AT = A0e-0.012(25) = 1906 mm2
IT = I0e-0.017(25) = 1,758,243 mm4
E0 = 15080 MPa
III
prismatic culm having
average properties of base
and top
A = 2190 mm2
I = 2,038,203 mm4
E0 = 15080 MPa
A = 5021 mm2
I = 4,138,334 mm4
E0 = 15080 MPa
A = 2239 mm2
I = 2,223,817 mm4
E0 = 15080 MPa
IV
prismatic culm having
properties calculated at
midheight
AT = A0e-0.024(12.5) = 2095 mm2
IT = I0e-0.036(12.5) = 1,847,922 mm4
E0 = 15080 MPa
AT = A0e-0.014(12.5) = 4945 mm2
IT = I0e-0.009(12.5) = 4,112,283 mm4
E0 = 15080 MPa
AT = A0e-0.012(12.5) = 2215 mm2
IT = I0e-0.017(12.5) = 2,174,535 mm4
E0 = 15080 MPa
V
linear taper of geometric
properties from bottom to
top
A = A0 – (A0-AT)(x/L)
I = I0 – (I0-IT)(x/L)
E0 = 15080 MPa
A = A0 – (A0-AT)(x/L)
I = I0 – (I0-IT)(x/L)
E0 = 15080 MPa
A = A0 – (A0-AT)(x/L)
I = I0 – (I0-IT)(x/L)
E0 = 15080 MPa
VI tapered geometry (Table 2)
A = A0e-0.024(x/D0)
I = I0e-0.036(x/D0)
E0 = 15080 MPa
A = A0e-0.014(x/D0)
I = I0e-0.009(x/D0)
E0 = 15080 MPa
A = A0e-0.012(x/D0)
I = I0e-0.017(x/D0)
E0 = 15080 MPa
VII
tapered geometry (Table 2)
and 10% linear increase of
modulus
A = A0e-0.024(x/D0)
I = I0e-0.036(x/D0)
E = E0(1 + 0.1x/L)
A = A0e-0.014(x/D0)
I = I0e-0.009(x/D0)
E = E0(1 + 0.1x/L)
A = A0e-0.012(x/D0)
I = I0e-0.017(x/D0)
E = E0(1 + 0.1x/L)
VIII
tapered geometry (Table 2)
and 20% linear increase of
modulus
A = A0e-0.024(x/D0)
I = I0e-0.036(x/D0)
E = E0(1 + 0.2x/L)
A = A0e-0.014(x/D0)
I = I0e-0.009(x/D0)
E = E0(1 + 0.2x/L)
A = A0e-0.012(x/D0)
I = I0e-0.017(x/D0)
E = E0(1 + 0.2x/L)

Table 4 Result of buckling analysis of pin-ended culms.
Case
P. edulis (Moso) B. stenostachya (Tre Gai) G. angustifolia (Guadua)
Pcr Pcr/Pcr,II fcr = Pcr/AT hΔmaxa Pcr Pcr/Pcr,II fcr = Pcr/AT hΔmax
a Pcr Pcr/Pcr,II fcr = Pcr/AT hΔmaxa
kN MPa 1/L kN MPa 1/L kN MPa 1/L
I 69.1 2.46 44.6 0.50 109.8 1.25 26.4 0.50 64.2 1.53 33.7 0.50
II 28.1 1.00 18.1 0.50 87.7 1.00 21.1 0.50 41.9 1.00 22.0 0.50
III 48.6 1.73 31.3 0.50 98.7 1.13 23.8 0.50 53.1 1.26 27.8 0.50
IV 44.1 1.57 28.4 0.50 98.1 1.12 23.6 0.50 51.9 1.24 27.2 0.50
V 46.6 1.66 30.1 0.54 98.3 1.12 23.7 0.50 52.4 1.25 27.5 0.52
VI 42.7 1.52 27.5 0.54 97.7 1.11 23.5 0.50 51.4 1.23 27.0 0.52
VII 45.1 1.61 29.1 0.52 102.8 1.17 24.8 0.50 54.1 1.29 28.4 0.52
VIII 47.4 1.69 30.6 0.52 107.8 1.23 26.0 0.50 56.8 1.35 29.8 0.50 a height along culm corresponding to maximum lateral displacement measured from base
Table 5 Buckling analyses of experimental test results.
P. edulis (Moso) B. stenostachya (Tre Gai)
Culm 1 Culm 2 Culm 3 Culm 4 Culm 5 Culm 6 Culm 7 Culm 8
E MPa 6645 (COV = 0.08) 13,450 (COV = 0.32)
KL mm 2410 2420 2410 2290 2600 2600 1942 2210
out-of-straightness L/172 L/100 L/142 L/208 L/113 L/200 L/235 L/153
internodes 11 10 8 9 12 15 12 13
D0 mm 111.1 106.7 75.4 89.5 86.1 88.0 89.2 85.3
t0 mm 11.0 13.2 6.5 7.9 18.4 20.2 22.0 21.1
A0 mm2 3456 3890 1410 2036 3920 4303 4641 4250
I0 mm4 4,384,070 4,334,547 843,942 1,710,633 2,413,455 2,696,455 2,903,574 2,428,630
Dtop mm 100.0 93.3 58.7 67.1 91.0 90.3 87.9 87.2
ttop mm 8.0 8.2 5.8 6.4 11.6 10.7 12.9 12.0
Atop mm2 2318 2193 964 1224 2889 2675 3043 2844
Itop mm4 2,471,053 2,005,633 341,845 569,169 2,324,157 2,157,478 2,203,771 2,061,868
average A mm2 2887 3041 1187 1630 3404 3489 3842 3547
average I mm4 3,427,561 3,170,090 592,893 1,139,901 2,368,806 2,426,966 2,553,672 2,245,249
A at L/2 mm2 2670 2616 1233 1610 3263 3082 3744 3500
I at L/2 mm4 3,152,014 2,638,391 631,183 1,057,774 2,433,920 2,049,207 2,550,298 2,240,170
critical buckling load (ratio of predicted/experimental)
experimental kN 44.6 38.8 9.3 18.8 52.3 49.9 95.7 62.6
Case I kN 49.6
(1.11)
48.7
(1.26)
9.5
(1.02)
21.4
(1.14)
47.4
(0.91)
53.0
(1.06)
102.4
(1.07)
66.1
(1.06)
Case II kN 28.0
(0.63)
22.5
(0.58)
3.9
(0.42)
7.1
(0.38)
45.7
(0.87)
42.4
(0.85)
77.7
(0.71)
56.1
(0.89)
Case III kN 38.8
(0.87)
35.6
(0.92)
6.7
(0.72)
14.3
(0.76)
46.5
(0.89)
47.7
(0.96)
90.1
(0.94)
61.1
(0.98)
Case IV kN 35.7
(0.80)
29.6
(0.76)
7.1
(0.76)
13.2
(0.70)
47.9
(0.92)
40.3
(0.81)
90.0
(0.94)
61.0
(0.97)
Case VI kN 37.8
(0.85)
30.7
(0.79)
8.5
(0.91)
13.0
(0.69)
47.5
(0.91)
42.0
(0.84)
85.2
(0.89)
59.6
(0.95)

Table 6 Characteristics of thin- and thick-walled bamboo species.
Thin-walled Thick-walled
represented by P. edulis (Moso)
G. angustifolia (Guadua) B. stenostachya (Tre Gai)
D/t > 8 < 8
radius of gyration, r decreases with height increased with height
effect of material property gradient on
effective culm geometric properties (see
Table 1)
marginal, less than 5%
increase 10-20% increase
increase in buckling capacity over that
calculated using minimal section (see
Table 4)
significant:
Moso greater than 50%
Guadua greater than 25%
marginal, less than 12%
a) longitudinal section of
bamboo culm showing portions
of internodes to either side of
node
b) cross section of
culm near node
diaphragm
c) section
through culm
wall
d) vascular bundle
(vessels (white)
and fibers (dark)
embedded in lignin
matrix)
Figure 1 Anatomy of bamboo culm (adapted from Richard 2013).
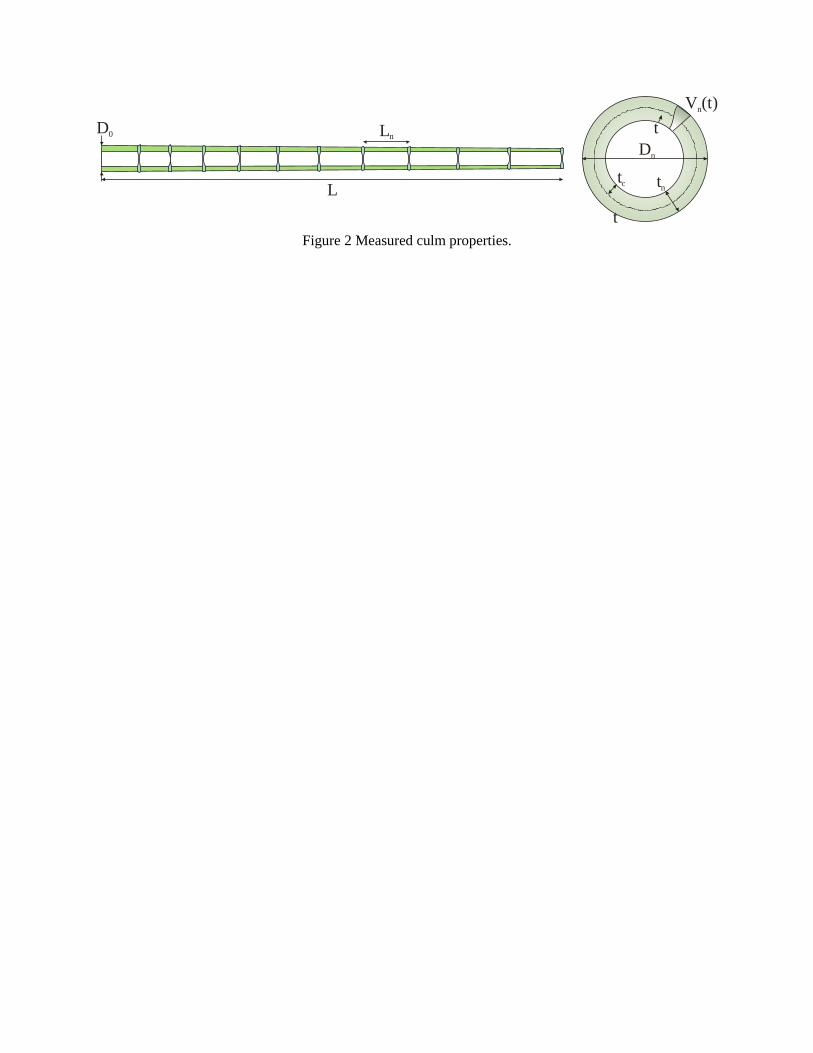
Figure 2 Measured culm properties.
Dn
tntc
L
Ln
V (t)n
t
t
D0

Figure 3 Discretisation of culm section.
Dn
tn
Di
t = t /10i n
section i
E(t)
Ei
E(t)
Ei
a) variation of normalised culm diameter (D/D0) b) variation of normalised culm wall thickness (t/t0)
c) variation of normalised culm cross sectional area
(A/A0)
d) variation of normalised culm cross sectional
moment of inertia (I/I0)
e) variation of normalised culm radius of gyration (r/r0)
Figure 4 Variation of normalised geometric properties with culm length.
0.4
0.5
0.6
0.7
0.8
0.9
1.0
1.1
0 5 10 15 20 25 30 35 40
norm
alis
ed t
/t0
normalised distance along culm, L/D0
Tre Gai
Moso
Guadua
Moso
Guadua
Tre Gai
0.4
0.5
0.6
0.7
0.8
0.9
1.0
1.1
0 5 10 15 20 25 30 35 40
norm
alis
ed A
/A0
normalised distance along culm, L/D0
Tre Gai
Moso
GuaduaMoso
Guadua
Tre Gai
0.2
0.3
0.4
0.5
0.6
0.7
0.8
0.9
1.0
1.1
0 5 10 15 20 25 30 35 40
norm
alis
ed I
/I0
normalised distance along culm, L/D0
Tre Gai
Moso
Guadua Moso
Guadua
Tre Gai
0.7
0.8
0.9
1.0
1.1
1.2
0 5 10 15 20 25 30 35 40
norm
alis
ed r
/r0
normalised distance along culm, L/D0
Tre Gai
Moso
Guadua
Moso
Guadua
Tre Gai
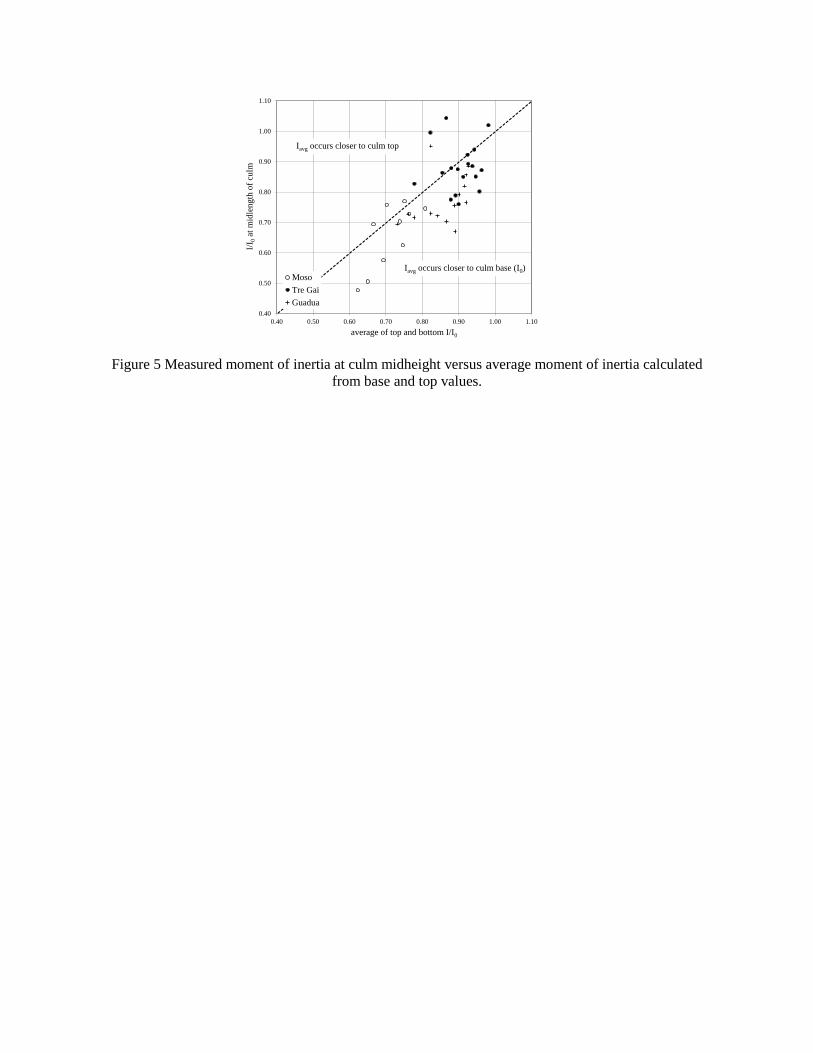
Figure 5 Measured moment of inertia at culm midheight versus average moment of inertia calculated
from base and top values.
0.40
0.50
0.60
0.70
0.80
0.90
1.00
1.10
0.40 0.50 0.60 0.70 0.80 0.90 1.00 1.10
I/I 0
at m
idle
ngth
of
culm
average of top and bottom I/I0
Moso
Tre Gai
Guadua
Iavg occurs closer to culm base (I0)
Iavg occurs closer to culm top
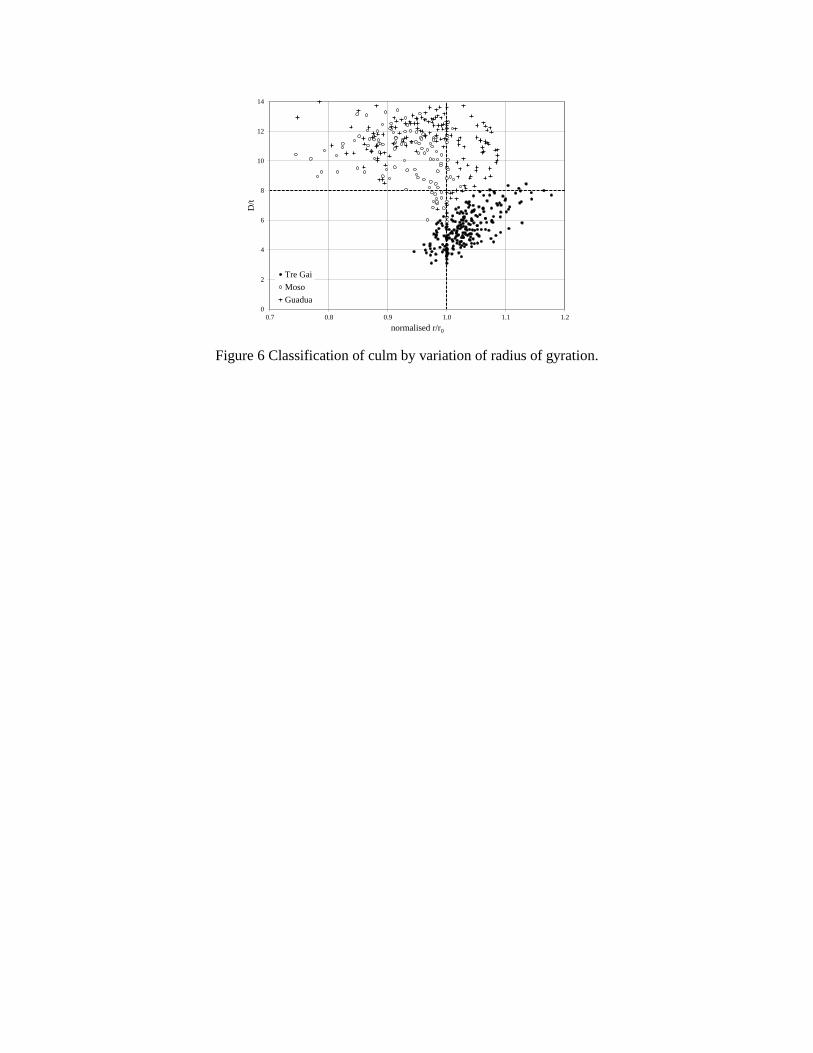
Figure 6 Classification of culm by variation of radius of gyration.
0
2
4
6
8
10
12
14
0.7 0.8 0.9 1.0 1.1 1.2
D/t
normalised r/r0
Tre Gai
Moso
Guadua


![Impact and Postbuckling Analyses - imechanicaPostbuckling Analyses Geometric Imperfections for Postbuckling Analyses • Using buckling modes for imperfections]..](https://img.dokumen.tips/doc/110x75/5e279cdbcab01659037bd7a7/impact-and-postbuckling-analyses-imechanica-postbuckling-analyses-geometric-imperfections.jpg)