Embed Size (px)
Citation preview
Three-Dimensional Structure Analysisand Percolation Properties of a BarrierMarine CoatingBo Chen1,7, Manuel Guizar-Sicairos2, Gang Xiong1, Laura Shemilt1, Ana Diaz2, John Nutter1,Nicolas Burdet1, Suguo Huo1, Joel Mancuso3, Alexander Monteith4, Frank Vergeer5,Andrew Burgess6 & Ian Robinson1,7
1London Centre for Nanotechnology, University College London, WC1H 0AH, UK, 2Paul Scherrer Institut, 5232 Villigen PSI,Switzerland, 3Gatan, Inc., Pleasanton, California 94588, USA, 4Gatan (UK) Ltd., Abingdon, Oxfordshire, OX14 1RL, UK,5AkzoNobel Co. Ltd., Sassenheim, 2171AJ, the Netherlands, 6AkzoNobel (UK) Co. Ltd., Felling, Gateshead, Tyne and Wear,NE10 0JY, UK, 7Research Complex at Harwell, Harwell Oxford, Didcot, Oxfordshire, OX11 0FA, UK.
Artificially structured coatings are widely employed to minimize materials deterioration and corrosion, theannual direct cost of which is over 3% of the gross domestic product (GDP) for industrial countries.Manufacturing higher performance anticorrosive coatings is one of the most efficient approaches to reducethis loss. However, three-dimensional (3D) structure of coatings, which determines their performance, hasnot been investigated in detail. Here we present a quantitative nano-scale analysis of the 3D spatial structureof an anticorrosive aluminium epoxy barrier marine coating obtained by serial block-face scanning electronmicroscopy (SBFSEM) and ptychographic X-ray computed tomography (PXCT). We then use finiteelement simulations to demonstrate how percolation through this actual 3D structure impedes ion diffusionin the composite materials. We found the aluminium flakes align within 156 of the coating surface in thematerial, causing the perpendicular diffusion resistance of the coating to be substantially higher than thepure epoxy.
Barrier coatings, an essential branch of the corrosion-resistant coating family, are deliberately structured tooperate in extremely aggressive environments such as seawater1–3 to prevent corrosion of substrate materi-als4,5. Among these coatings, the aluminium flake pigmented epoxy coatings are widely applied to protect
steel structures such as ocean-going vessels because of their excellent anticorrosive performance1, as determinedby their diffusion barrier properties2. The shape and spatial distribution of the aluminium flakes, usually severalmicrons wide and a few hundred nanometres thick, added to the materials significantly improve the barrierproperties by decreasing the transport rate of corrosive substances such as ions, water (vapour) and oxygenthrough coating films1,2,6. Additionally, the aluminium can react with the hydroxide ions produced at the cathodein the corrosion cell, reducing the pH at the coating-steel interface and decreasing the rate of cathodic disbond-ment7. Meanwhile, the epoxy resin gives the coating film abrasion resistance and functions as a corrosioninhibitor for the aluminium flakes8. However, the 3D structure of the coatings9,10 has not been accessed in detailbefore.
Here we studied an anticorrosive aluminium epoxy barrier marine coating composed of aluminium flakes, talcfragments, iron oxide particles and epoxy resin (matrix material). The measured coating samples were preparedby, firstly, introducing the pigment ingredients including aluminium flakes, talc fragments and iron oxideparticles into the epoxy resin using high shear mixing until the pigment particles are appropriately dispersed.The amine curing agent was then added into the pigmented epoxy resin at 151 stoichiometry. The epoxy resin andamine curing agent were mixed immediately prior to coating application. The coating material was then appliedon the substrate and used to prepare two types of samples. The non-degassed coating was obtained by directlycuring the applied material at 100uC for an hour and then curing at room temperature for one month. Thedegassed coating was treated by an extra degassing procedure in vacuum before experienced the same curingprocess as the non-degassed coating. The former procedure is the traditional method; the latter degassingprocedure could lead to potential improvements of coating technology.
Both aluminium flakes and talc fragments work as barriers when they align parallel to the coating surface. Incommercial products, talc fragments substitute for aluminium flakes to reduce cost as well as the risk of electrical
SCIENTIFIC REPORTS SREP-12-03210-T.3d 18/1/13 21:36:15
SUBJECT AREAS:STRUCTURE OF SOLIDS
AND LIQUIDS
CHARACTERIZATION ANDANALYTICAL
TECHNIQUES
IMAGING TECHNIQUES
PHASE-CONTRAST MICROSCOPY
Received15 October 2012
Accepted9 January 2013
Published30 January 2013
Correspondence andrequests for materials
should be addressed toB.C. (chenwillcon@
gmail.com) or I.R. ([email protected]).
SCIENTIFIC REPORTS | 3 : 1177 | DOI: 10.1038/srep01177 1
sparking. The iron oxide particles are added to produce the desiredcolour and to improve solvent and chemical resistance of the pro-ducts11. Serial block-face scanning electron microscopy (SBFSEM)12
and ptychographic X-ray computed tomography (PXCT)13,14 wereemployed for the purpose, after we found that full-field transmissionX-ray microscopy using both laboratory and synchrotron sourcescould not reveal the contrast between the various internal structuresof the material.
ResultsSBFSEM, a serial sectioning imaging method12,15,16, was used to imagea degassed sample. The technique was originally developed for 3Dspatial structure investigation of biological specimens17–19, fromultrathin section sample preparation for transmission electronmicroscopy (TEM)20. It acquires a continuous series of parallelimages of fresh surfaces created by mechanical cuts made by a dia-mond knife installed in an ultramicrotome12. Three-dimensional(3D) images of samples are then generated by stacking the corres-ponding series of images together.
A degassed and a non-degassed sample of the same material wereimaged by PXCT which combines scanning coherent X-ray diffract-ive imaging21,22 with computed tomography23,24. Both samples werefirst cut to size using a focused ion beam (FIB) tool. A tomographicprojection at each rotation angle was reconstructed from multiple X-ray diffraction patterns using a difference-map phase-retrieval algo-rithm22. PXCT produces quantitative 3D images of customised fieldof view with a representation of the average electron density pervoxel13,25. It avoids mechanical sample destruction and possible cut-ting artefacts which, in certain cases, can be detrimental to nano- andmicro-scale sciences.
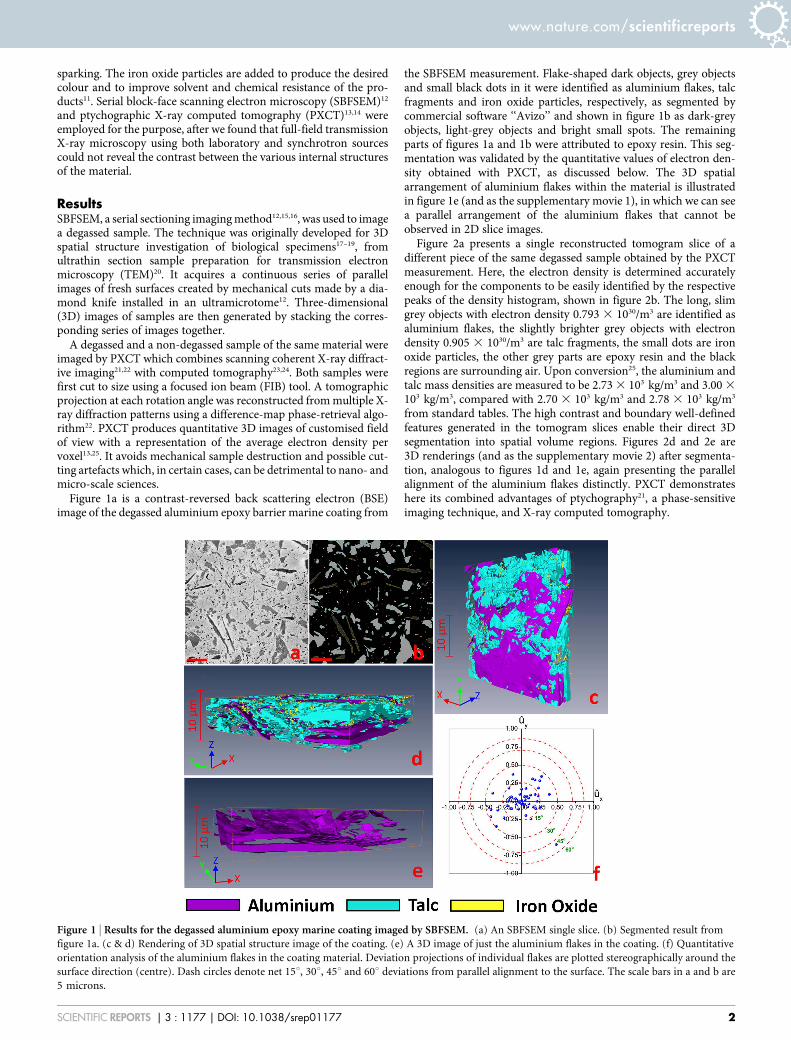
Figure 1a is a contrast-reversed back scattering electron (BSE)image of the degassed aluminium epoxy barrier marine coating from
the SBFSEM measurement. Flake-shaped dark objects, grey objectsand small black dots in it were identified as aluminium flakes, talcfragments and iron oxide particles, respectively, as segmented bycommercial software ‘‘Avizo’’ and shown in figure 1b as dark-greyobjects, light-grey objects and bright small spots. The remainingparts of figures 1a and 1b were attributed to epoxy resin. This seg-mentation was validated by the quantitative values of electron den-sity obtained with PXCT, as discussed below. The 3D spatialarrangement of aluminium flakes within the material is illustratedin figure 1e (and as the supplementary movie 1), in which we can seea parallel arrangement of the aluminium flakes that cannot beobserved in 2D slice images.
Figure 2a presents a single reconstructed tomogram slice of adifferent piece of the same degassed sample obtained by the PXCTmeasurement. Here, the electron density is determined accuratelyenough for the components to be easily identified by the respectivepeaks of the density histogram, shown in figure 2b. The long, slimgrey objects with electron density 0.793 3 1030/m3 are identified asaluminium flakes, the slightly brighter grey objects with electrondensity 0.905 3 1030/m3 are talc fragments, the small dots are ironoxide particles, the other grey parts are epoxy resin and the blackregions are surrounding air. Upon conversion25, the aluminium andtalc mass densities are measured to be 2.73 3 103 kg/m3 and 3.00 3
103 kg/m3, compared with 2.70 3 103 kg/m3 and 2.78 3 103 kg/m3
from standard tables. The high contrast and boundary well-definedfeatures generated in the tomogram slices enable their direct 3Dsegmentation into spatial volume regions. Figures 2d and 2e are3D renderings (and as the supplementary movie 2) after segmenta-tion, analogous to figures 1d and 1e, again presenting the parallelalignment of the aluminium flakes distinctly. PXCT demonstrateshere its combined advantages of ptychography21, a phase-sensitiveimaging technique, and X-ray computed tomography.
Figure 1 | Results for the degassed aluminium epoxy marine coating imaged by SBFSEM. (a) An SBFSEM single slice. (b) Segmented result from
figure 1a. (c & d) Rendering of 3D spatial structure image of the coating. (e) A 3D image of just the aluminium flakes in the coating. (f) Quantitative
orientation analysis of the aluminium flakes in the coating material. Deviation projections of individual flakes are plotted stereographically around the
surface direction (centre). Dash circles denote net 15u, 30u, 45u and 60u deviations from parallel alignment to the surface. The scale bars in a and b are
5 microns.
www.nature.com/scientificreports
SCIENTIFIC REPORTS | 3 : 1177 | DOI: 10.1038/srep01177 2
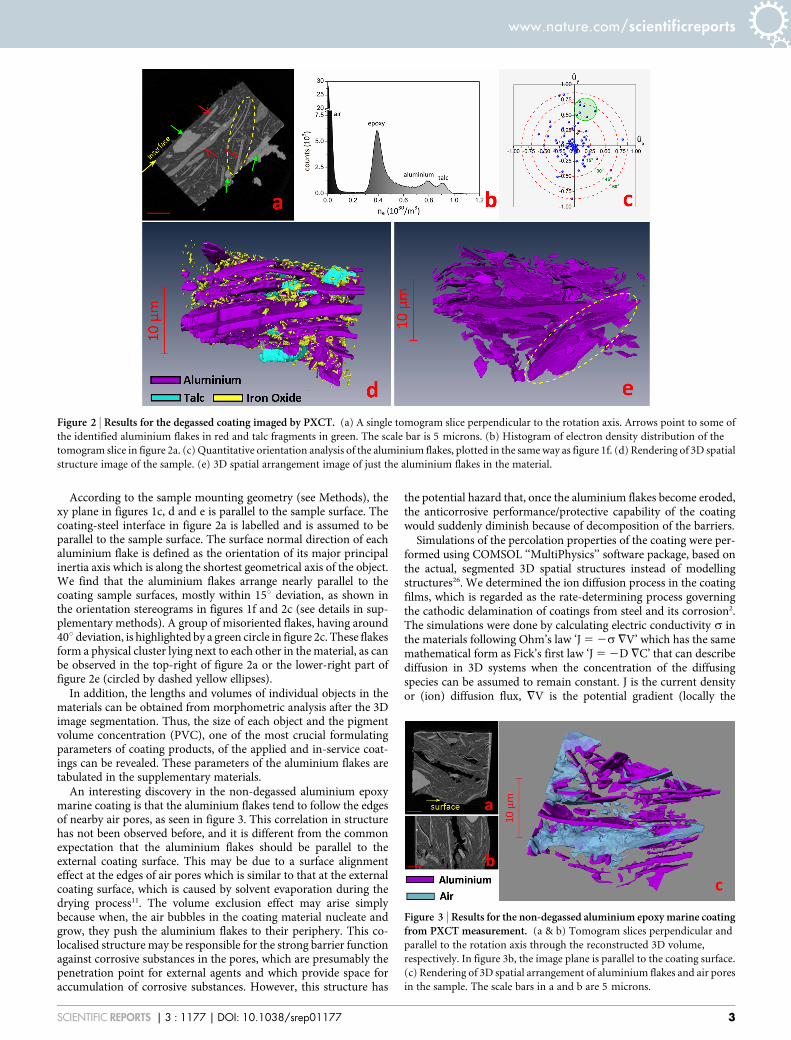
According to the sample mounting geometry (see Methods), thexy plane in figures 1c, d and e is parallel to the sample surface. Thecoating-steel interface in figure 2a is labelled and is assumed to beparallel to the sample surface. The surface normal direction of eachaluminium flake is defined as the orientation of its major principalinertia axis which is along the shortest geometrical axis of the object.We find that the aluminium flakes arrange nearly parallel to thecoating sample surfaces, mostly within 15u deviation, as shown inthe orientation stereograms in figures 1f and 2c (see details in sup-plementary methods). A group of misoriented flakes, having around40u deviation, is highlighted by a green circle in figure 2c. These flakesform a physical cluster lying next to each other in the material, as canbe observed in the top-right of figure 2a or the lower-right part offigure 2e (circled by dashed yellow ellipses).
In addition, the lengths and volumes of individual objects in thematerials can be obtained from morphometric analysis after the 3Dimage segmentation. Thus, the size of each object and the pigmentvolume concentration (PVC), one of the most crucial formulatingparameters of coating products, of the applied and in-service coat-ings can be revealed. These parameters of the aluminium flakes aretabulated in the supplementary materials.
An interesting discovery in the non-degassed aluminium epoxymarine coating is that the aluminium flakes tend to follow the edgesof nearby air pores, as seen in figure 3. This correlation in structurehas not been observed before, and it is different from the commonexpectation that the aluminium flakes should be parallel to theexternal coating surface. This may be due to a surface alignmenteffect at the edges of air pores which is similar to that at the externalcoating surface, which is caused by solvent evaporation during thedrying process11. The volume exclusion effect may arise simplybecause when, the air bubbles in the coating material nucleate andgrow, they push the aluminium flakes to their periphery. This co-localised structure may be responsible for the strong barrier functionagainst corrosive substances in the pores, which are presumably thepenetration point for external agents and which provide space foraccumulation of corrosive substances. However, this structure has
the potential hazard that, once the aluminium flakes become eroded,the anticorrosive performance/protective capability of the coatingwould suddenly diminish because of decomposition of the barriers.
Simulations of the percolation properties of the coating were per-formed using COMSOL ‘‘MultiPhysics’’ software package, based onthe actual, segmented 3D spatial structures instead of modellingstructures26. We determined the ion diffusion process in the coatingfilms, which is regarded as the rate-determining process governingthe cathodic delamination of coatings from steel and its corrosion2.The simulations were done by calculating electric conductivity s inthe materials following Ohm’s law ‘J 5 2s =V’ which has the samemathematical form as Fick’s first law ‘J 5 2D =C’ that can describediffusion in 3D systems when the concentration of the diffusingspecies can be assumed to remain constant. J is the current densityor (ion) diffusion flux, =V is the potential gradient (locally the
Figure 2 | Results for the degassed coating imaged by PXCT. (a) A single tomogram slice perpendicular to the rotation axis. Arrows point to some of
the identified aluminium flakes in red and talc fragments in green. The scale bar is 5 microns. (b) Histogram of electron density distribution of the
tomogram slice in figure 2a. (c) Quantitative orientation analysis of the aluminium flakes, plotted in the same way as figure 1f. (d) Rendering of 3D spatial
structure image of the sample. (e) 3D spatial arrangement image of just the aluminium flakes in the material.
Figure 3 | Results for the non-degassed aluminium epoxy marine coatingfrom PXCT measurement. (a & b) Tomogram slices perpendicular and
parallel to the rotation axis through the reconstructed 3D volume,
respectively. In figure 3b, the image plane is parallel to the coating surface.
(c) Rendering of 3D spatial arrangement of aluminium flakes and air pores
in the sample. The scale bars in a and b are 5 microns.
www.nature.com/scientificreports
SCIENTIFIC REPORTS | 3 : 1177 | DOI: 10.1038/srep01177 3
potential difference, V, divided by the conductor length), D is thediffusion coefficient and =C is the concentration gradient. The iondiffusion and electric conduction are also relevant because both ionsand electrons are charged particles and the potential difference is adriving force for ion transport during the electrochemical process ofsteel corrosion. The electric conductivities were calculated along thedirections perpendicular and parallel to the coating surface direc-tions to determine the material’s diffusion coefficient anisotropyR 5 sperpendicular/sparallel.
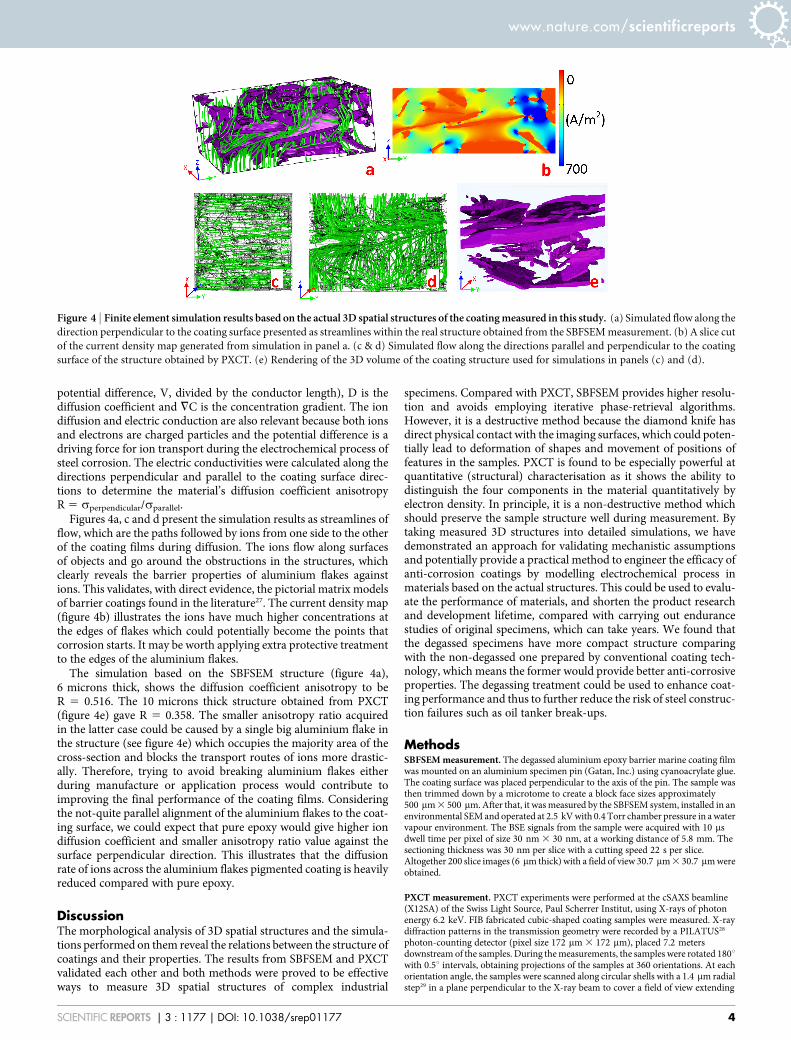
Figures 4a, c and d present the simulation results as streamlines offlow, which are the paths followed by ions from one side to the otherof the coating films during diffusion. The ions flow along surfacesof objects and go around the obstructions in the structures, whichclearly reveals the barrier properties of aluminium flakes againstions. This validates, with direct evidence, the pictorial matrix modelsof barrier coatings found in the literature27. The current density map(figure 4b) illustrates the ions have much higher concentrations atthe edges of flakes which could potentially become the points thatcorrosion starts. It may be worth applying extra protective treatmentto the edges of the aluminium flakes.
The simulation based on the SBFSEM structure (figure 4a),6 microns thick, shows the diffusion coefficient anisotropy to beR 5 0.516. The 10 microns thick structure obtained from PXCT(figure 4e) gave R 5 0.358. The smaller anisotropy ratio acquiredin the latter case could be caused by a single big aluminium flake inthe structure (see figure 4e) which occupies the majority area of thecross-section and blocks the transport routes of ions more drastic-ally. Therefore, trying to avoid breaking aluminium flakes eitherduring manufacture or application process would contribute toimproving the final performance of the coating films. Consideringthe not-quite parallel alignment of the aluminium flakes to the coat-ing surface, we could expect that pure epoxy would give higher iondiffusion coefficient and smaller anisotropy ratio value against thesurface perpendicular direction. This illustrates that the diffusionrate of ions across the aluminium flakes pigmented coating is heavilyreduced compared with pure epoxy.
DiscussionThe morphological analysis of 3D spatial structures and the simula-tions performed on them reveal the relations between the structure ofcoatings and their properties. The results from SBFSEM and PXCTvalidated each other and both methods were proved to be effectiveways to measure 3D spatial structures of complex industrial
specimens. Compared with PXCT, SBFSEM provides higher resolu-tion and avoids employing iterative phase-retrieval algorithms.However, it is a destructive method because the diamond knife hasdirect physical contact with the imaging surfaces, which could poten-tially lead to deformation of shapes and movement of positions offeatures in the samples. PXCT is found to be especially powerful atquantitative (structural) characterisation as it shows the ability todistinguish the four components in the material quantitatively byelectron density. In principle, it is a non-destructive method whichshould preserve the sample structure well during measurement. Bytaking measured 3D structures into detailed simulations, we havedemonstrated an approach for validating mechanistic assumptionsand potentially provide a practical method to engineer the efficacy ofanti-corrosion coatings by modelling electrochemical process inmaterials based on the actual structures. This could be used to evalu-ate the performance of materials, and shorten the product researchand development lifetime, compared with carrying out endurancestudies of original specimens, which can take years. We found thatthe degassed specimens have more compact structure comparingwith the non-degassed one prepared by conventional coating tech-nology, which means the former would provide better anti-corrosiveproperties. The degassing treatment could be used to enhance coat-ing performance and thus to further reduce the risk of steel construc-tion failures such as oil tanker break-ups.
MethodsSBFSEM measurement. The degassed aluminium epoxy barrier marine coating filmwas mounted on an aluminium specimen pin (Gatan, Inc.) using cyanoacrylate glue.The coating surface was placed perpendicular to the axis of the pin. The sample wasthen trimmed down by a microtome to create a block face sizes approximately500 mm 3 500 mm. After that, it was measured by the SBFSEM system, installed in anenvironmental SEM and operated at 2.5 kV with 0.4 Torr chamber pressure in a watervapour environment. The BSE signals from the sample were acquired with 10 msdwell time per pixel of size 30 nm 3 30 nm, at a working distance of 5.8 mm. Thesectioning thickness was 30 nm per slice with a cutting speed 22 s per slice.Altogether 200 slice images (6 mm thick) with a field of view 30.7 mm 3 30.7 mm wereobtained.
PXCT measurement. PXCT experiments were performed at the cSAXS beamline(X12SA) of the Swiss Light Source, Paul Scherrer Institut, using X-rays of photonenergy 6.2 keV. FIB fabricated cubic-shaped coating samples were measured. X-raydiffraction patterns in the transmission geometry were recorded by a PILATUS28
photon-counting detector (pixel size 172 mm 3 172 mm), placed 7.2 metersdownstream of the samples. During the measurements, the samples were rotated 180uwith 0.5u intervals, obtaining projections of the samples at 360 orientations. At eachorientation angle, the samples were scanned along circular shells with a 1.4 mm radialstep29 in a plane perpendicular to the X-ray beam to cover a field of view extending
Figure 4 | Finite element simulation results based on the actual 3D spatial structures of the coating measured in this study. (a) Simulated flow along the
direction perpendicular to the coating surface presented as streamlines within the real structure obtained from the SBFSEM measurement. (b) A slice cut
of the current density map generated from simulation in panel a. (c & d) Simulated flow along the directions parallel and perpendicular to the coating
surface of the structure obtained by PXCT. (e) Rendering of the 3D volume of the coating structure used for simulations in panels (c) and (d).
www.nature.com/scientificreports
SCIENTIFIC REPORTS | 3 : 1177 | DOI: 10.1038/srep01177 4

beyond the sample edges. The projections were reconstructed by the difference mapalgorithm22, then post-processed, aligned, combined and reconstructed to form a 3Dvolume according to the procedure described in reference 14.
1. Bieganska, B., Zubielewicz, M. & Smieszek, E. Influence of barrier pigments on theperformance of protective organic coatings. Prog. Org. Coat. 16, 219–229 (1988).
2. Thomas, N. L. The barrier properties of paint coatings. Prog. Org. Coat. 19,101–121 (1991).
3. Moggridge, G. D., Lape, N. K., Yang, C. & Cussler, E. L. Barrier films using flakesand reactive additives. Prog. Org. Coat. 46, 231–240 (2003).
4. Walter, G. W. A critical review of the protection of metals by paints. Corros. Sci.26, 27–38 (1986).
5. Shreir, L. L., Jarman, R. A. & Burstein, G. T. (Eds.) Corrosion (3rd ed.): Chap. 14(Butterworth-Heinemann Ltd., Oxford-London, 1994).
6. Yang, C., Smyrl, W. H. & Cussler, E. L. Flake alignment in composite coatings.J. Membrane Sci. 231, 1–12 (2004).
7. Leidheiser, H., Jr., Wang, W. & Igetoft, L. The mechanism for the cathodicdelamination of organic coatings from a metal surface. Prog. Org. Coat. 11,19–40 (1983).
8. Muller, B. & Fischer, S. Epoxy ester resins as corrosion inhibitors for aluminiumand zinc pigments. Corros. Sci. 48, 2406–2416 (2006).
9. Jaeggi, C., Mooser, R., Frauchiger, V. & Wyss, P. 3D characterization of openporous vacuum plasma sprayed titanium coatings by means of high resolutionmicro computer tomography. Mater. Lett. 63, 2643–2645 (2009).
10. Koller, D. M., Hannesschlager, G., Leitner, M. & Khinast, J. G. Non-destructiveanalysis of tablet coatings with optical coherence tomography. Eur. J. Pharm. Sci.44, 142–148 (2011).
11. Lambourne, R. & Strivens, T. A. Paint and Surface Coatings-Theory and Practice(2nd ed.): 91–165 (Woodhead Publishing Ltd., Cambridge, England, 1999).
12. Denk, W. & Horstmann, H. Serial block-face scanning electron microscopy toreconstruct three-dimensional tissue nanostructure. PLoS Biol. 2, e329 (2004).
13. Dierolf, M. et al. Ptychographic X-ray computed tomography at the nanoscale.Nature 467, 436–439 (2010).
14. Guizar-Sicairos, M. et al. Phase tomography from x-ray coherent diffractiveimaging projections. Opt. Express 19, 21345–21357 (2011).
15. Levinthal, C. & Ware, R. Three dimensional reconstruction from serial sections.Nature 236, 207–210 (1972).
16. Arenkiel, B. R. & Ehlers, M. D. Molecular genetics and imaging technologies forcircuit-based neuroanatomy. Nature 461, 900–907 (2009).
17. Rouquette, J. et al. Revealing the high-resolution three-dimensional network ofchromatin and interchromatin space: A novel electron-microscopic approach toreconstructing nuclear architecture. Chromosome Res. 17, 801–810 (2009).
18. Muller-Reichert, T., Mancuso, J., Lich, B. & McDonald, K. Three-dimensionalreconstruction methods for caenorhabditis elegans ultrastructure. Methods CellBiol. 96, 331–361 (2010).
19. Briggman, K. L., Helmstaedter, M. & Denk, W. Wiring specificity in the direction-selectivity circuit of the retina. Nature 471, 183–188 (2011).
20. O’Brien, H. C. & McKinley, G. M. New microtome and sectioning method forelectron microscopy. Science 98, 455–456 (1943).
21. Rodenburg, J. M. et al. Hard-X-Ray lensless imaging of extended objects. Phys.Rev. Lett. 98, 034801 (2007).
22. Thibault, P. et al. High-resolution scanning X-ray diffraction microscopy. Science321, 379–382 (2008).
23. Glenn, W. V., Jr., Johnston, R. J., Morton, P. E. & Dwyer, S. J. Image generationand display techniques for CT scan data-Thin transverse and reconstructedcoronal and sagittal planes. Invest. Radiol. 10, 403–416 (1975).
24. Kak, A. C. & Slaney, M. Principles of Computerized Tomographic Imaging (Societyof Industrial and Applied Mathematics, Philadelphia, PA, 2001).
25. Diaz, A. et al. Quantitative x-ray phase nanotomography. Phys. Rev. B 85,020104(R) (2012).
26. Alam, P., Byholm, T., Kniivila, J., Sinervo, L. & Toivakka, M. Calculating thepermeability of model paper coating structures comprising incongruent particleshapes and sizes. Micropor. Mesopor. Mat. 117, 685–688 (2009).
27. Zaarei, D., Sarabi, A. A., Sharif, F. & Kassiriha, S. M. Structure, properties andcorrosion resistivity of polymeric nanocomposite coatings based on layeredsilicates. J. Coat. Technol. Res. 5, 241–249 (2008).
28. Henrich, B. et al. PILATUS: A single photon counting pixel detector for X-rayapplications. Nucl. Instrum. Meth. A 607, 247–249 (2009).
29. Dierolf, M. et al. Ptychographic coherent diffractive imaging of weakly scatteringspecimens. N. J. Phys. 12, 035017 (2010).
AcknowledgementsThe work was supported by the Engineering and Physical Sciences Research Council(EPSRC, UK) through a Dorothy Hodgkin Postgraduate Award to B.C. Additional fundingcame from the European Resarch Council (ERC) Advanced Grant 227711 ‘‘nanosculpture’’.The PXCT experiments were carried out at the cSAXS beamline at the Swiss Light Source,Paul Scherrer Institut, Villigen PSI, Switzerland. The SBFSEM measurements wereperformed on the Gatan 3View system at Gatan Inc. B.C. acknowledges travel support fromthe European Community’s Seventh Framework Programme (FP7/2007–2013) throughgrant no. 226716. We acknowledge Dr. Paul Jackson at AkzoNobel (UK) for discussions.
Author contributionsI.R., B.C., F.V. and A.B. conceived the project. J.M. and A. M. carried out the SBFSEMmeasurements. B.C. analysed the SBFSEM result. B.C., S.H., F.V. and A.B. prepared samplesfor PXCT experiments. B.C., M.G., L.S., A.D. and N.B. carried out the PXCT experiments.B.C. and M.G. analysed the PXCT results. G.X., J.N. and B.C. carried out the COMSOLsimulation. All authors contributed to interpreting the results and writing the manuscript.
Additional informationSupplementary information accompanies this paper at http://www.nature.com/scientificreports
Competing financial interests: The authors declare no competing financial interests.
License: This work is licensed under a Creative CommonsAttribution-NonCommercial-NoDerivs 3.0 Unported License. To view a copy of thislicense, visit http://creativecommons.org/licenses/by-nc-nd/3.0/
How to cite this article: Chen, B. et al. Three-Dimensional Structure Analysis andPercolation Properties of a Barrier Marine Coating. Sci. Rep. 3, 1177; DOI:10.1038/srep01177 (2013).
www.nature.com/scientificreports
SCIENTIFIC REPORTS | 3 : 1177 | DOI: 10.1038/srep01177 5