Embed Size (px)
Citation preview
THOMSON REUTERS BASELINE RESEARCH, ANALYZE, PRESENT
FINANCIAL
Thomson Reuters Baseline pulls together all the equity information you need to make quick, insightful and reliable decisions. With our unique set of data and tools, you can make your choices by using fundamentals that match your investment style-then illustrate your strategy with high-end graphics, charts and reports. Thomson Reuters Baseline helps you to work more efficiently by combining in-depth, single security evaluation, portfolio analytics and client communication into a single application.
DATA COVERAGE• Equity fundamental data• Street research• Economic• Intraday data• Portfolio holdings• Proprietary data
POWERFUL TOOLSA powerful set of tools helps you to analyze data for maximum insight–and present it for maximum impact.
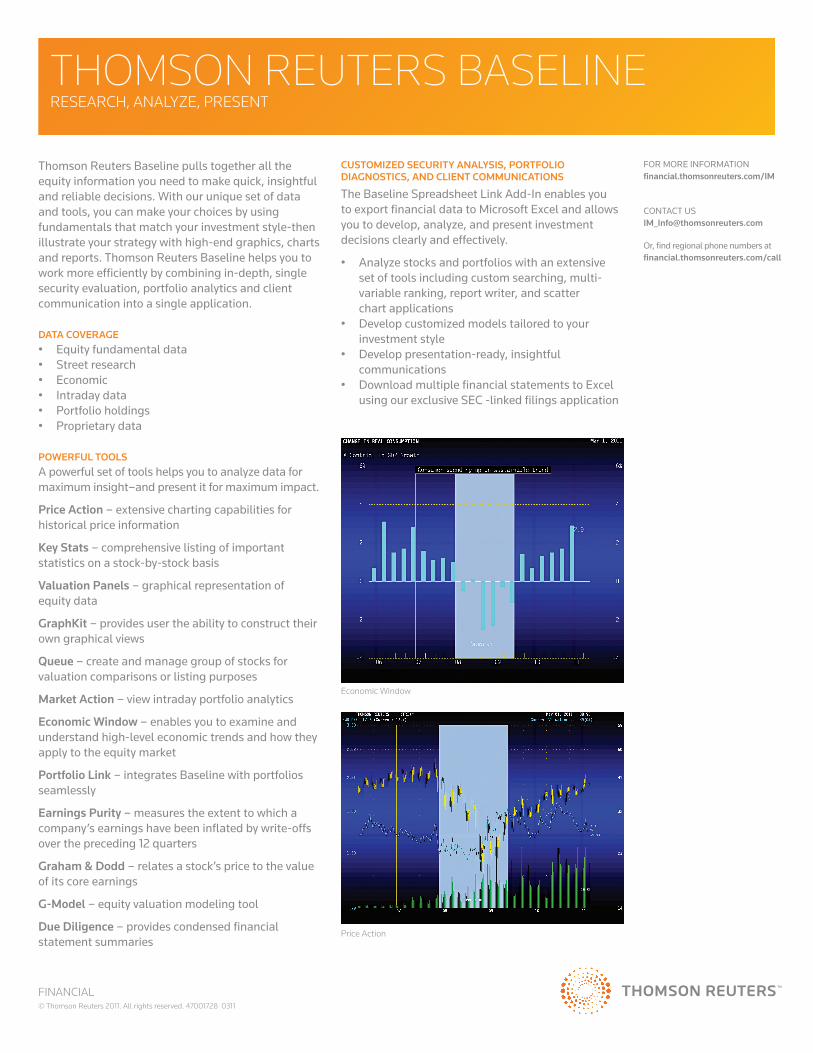
Price Action – extensive charting capabilities for historical price information
Key Stats – comprehensive listing of important statistics on a stock-by-stock basis
Valuation Panels – graphical representation of equity data
GraphKit – provides user the ability to construct their own graphical views
Queue – create and manage group of stocks for valuation comparisons or listing purposes
Market Action – view intraday portfolio analytics
Economic Window – enables you to examine and understand high-level economic trends and how they apply to the equity market
Portfolio Link – integrates Baseline with portfolios seamlessly
Earnings Purity – measures the extent to which a company’s earnings have been inflated by write-offs over the preceding 12 quarters
Graham & Dodd – relates a stock’s price to the value of its core earnings
G-Model – equity valuation modeling tool
Due Diligence – provides condensed financial statement summaries
CUSTOMIZED SECURITY ANALYSIS, PORTFOLIO DIAGNOSTICS, AND CLIENT COMMUNICATIONS
The Baseline Spreadsheet Link Add-In enables you to export financial data to Microsoft Excel and allows you to develop, analyze, and present investment decisions clearly and effectively.
• Analyze stocks and portfolios with an extensive set of tools including custom searching, multi-variable ranking, report writer, and scatter chart applications
• Develop customized models tailored to your investment style
• Develop presentation-ready, insightful communications
• Download multiple financial statements to Excel using our exclusive SEC -linked filings application
FOR MORE INFORMATION financial.thomsonreuters.com/IM
CONTACT US [email protected]
Or, find regional phone numbers at financial.thomsonreuters.com/call
© Thomson Reuters 2011. All rights reserved. 47001728 0311
Economic Window
Price Action