Embed Size (px)
Citation preview


This slide presentation is for informational purposes only. It should be read in conjunction with our Form 10-K for the year 2011, our Form 10-Qs and our Form 8-Ks filed with the Securities and Exchange Commission (SEC), all of which are available on the “Investor Relations” section of our website at www.employers.com. Non-GAAP Financial Measures In presenting Employers Holdings, Inc.’s (EMPLOYERS) results, management has included and discussed certain non-GAAP financial measures, as defined in Regulation G. Management believes these non-GAAP measures better explain EMPLOYERS results allowing for a more complete understanding of underlying trends in our business. These measures should not be viewed as a substitute for those determined in accordance with GAAP. The reconciliation of these measures to their most comparable GAAP financial measures is included in this presentation or in our Form 10-K for the year 2011, our Form 10-Qs and our Form 8-Ks filed with the Securities and Exchange Commission (SEC) and available in the “Investor Relations” section of our website at www.employers.com. Forward-looking Statements This presentation may contain certain forward looking statements within the meaning of the Private Securities Litigation Reform Act of 1995. Forward looking statements include statements regarding anticipated future results and can be identified by the fact that they do not relate strictly to historical or current facts. They often include words like "believe”, "expect”, "anticipate”, "estimate" and "intend" or future or conditional verbs such as "will”, "would”, "should”, "could" or "may”. All subsequent written and oral forward-looking statements attributable to us or individuals acting on our behalf are expressly qualified in their entirety by these cautionary statements. All forward looking statements made in this presentation reflect EMPLOYERS’ current views with respect to future events, business transactions and business performance and are made pursuant to the safe harbor provisions of the Private Securities Litigation Reform Act of 1995. Such statements involve risks and uncertainties, which may cause actual results to differ materially from those set forth in these statements. The business of EHI and those engaged in similar lines of business could be affected by, among other things, competition, pricing and policy term trends, the levels of new and renewal business achieved, market acceptance, changes in demand, the frequency and severity of catastrophic events, actual loss experience including observed levels of increased indemnity claims frequency and severity in California, uncertainties in the loss reserving and claims settlement process, new theories of liability, judicial, legislative, regulatory and other governmental developments, litigation tactics and developments, investigation developments, the amount and timing of reinsurance recoverables, credit developments among reinsurers, changes in the cost or availability of reinsurance, market developments (including adverse developments in financial markets as a result of, among other things, changes in local, regional or national economic conditions and volatility and deterioration of financial markets), credit and other risks associated with EHI's investment activities, significant changes in investment yield rates, rating agency action, possible terrorism or the outbreak and effects of war and economic, political, regulatory, insurance and reinsurance business conditions, relations with and performance of employees and agents, and other factors identified in EHI's filings with the SEC. Accordingly, readers are cautioned not to place undue reliance on these forward-looking statements, which speak only as of the date on which they are made. We undertake no obligation to publicly update or revise any forward-looking statements, whether as a result of new information, future events or otherwise. Copyright © 2012 EMPLOYERS. All rights reserved. EMPLOYERS® and America’s small business insurance specialist.® are registered trademarks of Employers Insurance Company of Nevada. Employers Holdings, Inc. is a holding company with subsidiaries that are specialty providers of workers’ compensation insurance and services focused on select, small businesses engaged in low to medium hazard industries. The company, through its subsidiaries, operates in 31 states and the District of Columbia. Insurance subsidiaries include Employers Insurance Company of Nevada, Employers Compensation Insurance Company, Employers Preferred Insurance Company, and Employers Assurance Company, all rated A- (Excellent) by A.M. Best Company. Additional information can be found at: http://www.employers.com.
1
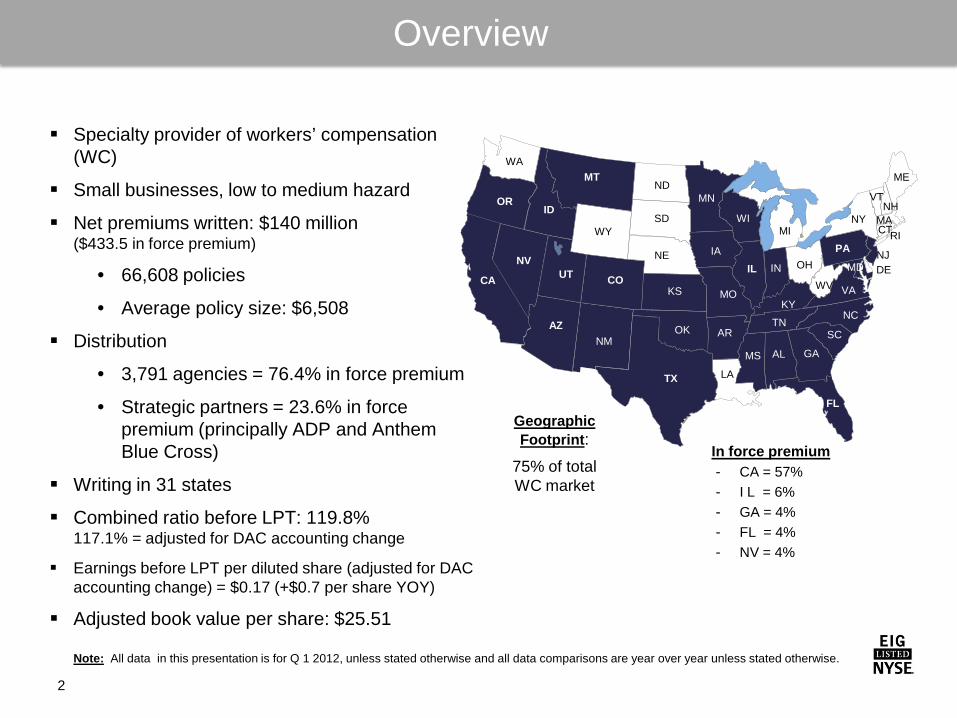
Specialty provider of workers’ compensation
(WC)
Small businesses, low to medium hazard
Net premiums written: $140 million ($433.5 in force premium)
• 66,608 policies
• Average policy size: $6,508
Distribution
• 3,791 agencies = 76.4% in force premium
• Strategic partners = 23.6% in force premium (principally ADP and Anthem Blue Cross)
Writing in 31 states
Combined ratio before LPT: 119.8% 117.1% = adjusted for DAC accounting change
Earnings before LPT per diluted share (adjusted for DAC accounting change) = $0.17 (+$0.7 per share YOY)
Adjusted book value per share: $25.51
Geographic Footprint:
75% of total WC market
In force premium - CA = 57% - I L = 6% - GA = 4% - FL = 4% - NV = 4%
FL
NM
MD
TX
OK
KS
NE
SD
ND MT
WY
CO UT
ID
AZ
NV
WA
CA
OR
KY
ME
NY
PA MI
NH MA CT
VA WV
OH IN IL
NC TN
SC
AL
AR
LA
MO
IA
MN
WI
MS
VT
NJ DE
RI
GA
Overview
2
Note: All data in this presentation is for Q 1 2012, unless stated otherwise and all data comparisons are year over year unless stated otherwise.
NY

2009 - 2011
Growth and technology initiatives
- Growth targets by mid-2012 to drive scale: Add over 20,000 policies Add over 900 agencies - Rapid quote technology implemented nationwide
YOY 39% increase in net written premiums; 27% increase in agencies; 39% increase in policy count
Strategy and Results
3
Strategies Q 1, 2012
Cost controls - Combined four regional operating units into two, consolidated offices and decreased staffing by 225 or 35% - Reduced underwriting expenses 5% at YE 2011
Expense ratio decline of 4.5 points YOY (excluding DAC accounting change)
Pricing
- Observed signs of a firming market in 2011 – drive profitability through improved pricing - Increased CA filed rates over 41% since 2009 - Total net rate change turned positive in Q 4 vs. Q 3, 2011 - Rating bureaus filed rate increases in 19 states nationally in 2011
Positive net rate YOY and YTD
6% average rate increase in CA effective 6/15/12; 8.9% in FL 1/1/12; 13.6% in IL 3/1/12
Capital and investments
- Q 4 2011, began repositioning portfolio to shorten duration, reduce exposure to tax exempt municipals, add high dividend equities - 3 uses of capital = deploy into business, strategic acquisitions, return to shareholders
Portfolio repositioning complete
$326.4 million cash/securities at holding company
1.1 million shares repurchased in Q 1; $74 million left in current $200 million program; $0.6 per share div declared
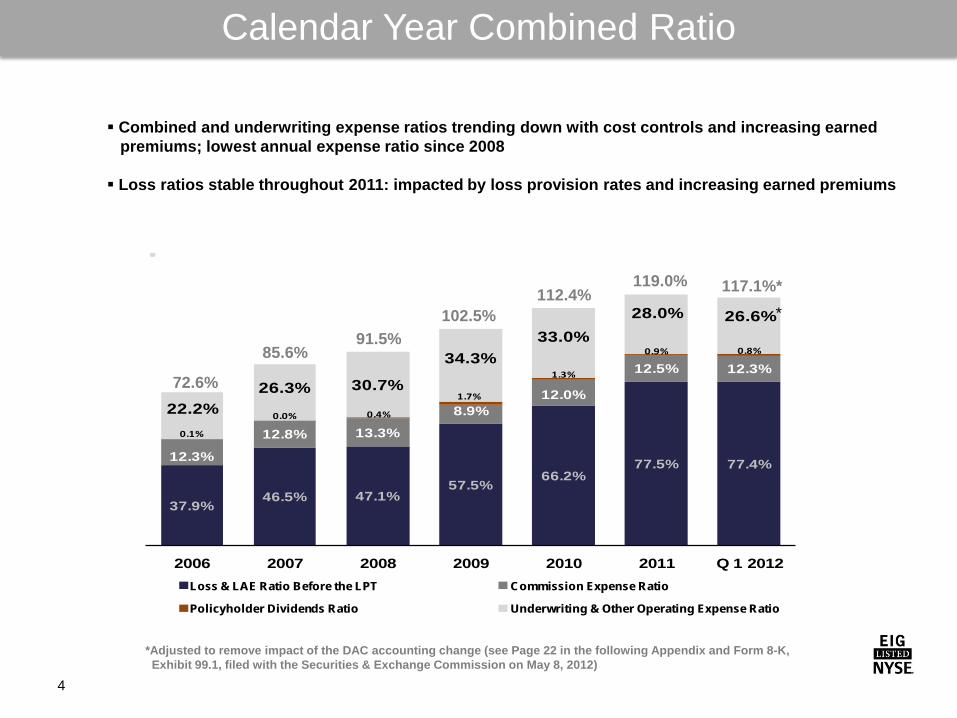
37.9%46.5% 47.1%
57.5%66.2%
77.5% 77.4%12.3%
12.8% 13.3%
8.9%12.0%
12.5% 12.3%
0.1%
0.0% 0.4%
1.7%
1.3%
0.9% 0.8%
22.2%26.3% 30.7%
34.3%33.0%
28.0% 26.6%
2006 2007 2008 2009 2010 2011 Q 1 2012Loss & LAE Ratio Before the LPT Commission Expense Ratio
Policyholder Dividends Ratio Underwriting & Other Operating Expense Ratio
72.6%
85.6% 91.5%
102.5% 112.4%
119.0% 117.1%*
Calendar Year Combined Ratio
4
Combined and underwriting expense ratios trending down with cost controls and increasing earned premiums; lowest annual expense ratio since 2008 Loss ratios stable throughout 2011: impacted by loss provision rates and increasing earned premiums
*Adjusted to remove impact of the DAC accounting change (see Page 22 in the following Appendix and Form 8-K, Exhibit 99.1, filed with the Securities & Exchange Commission on May 8, 2012)
*
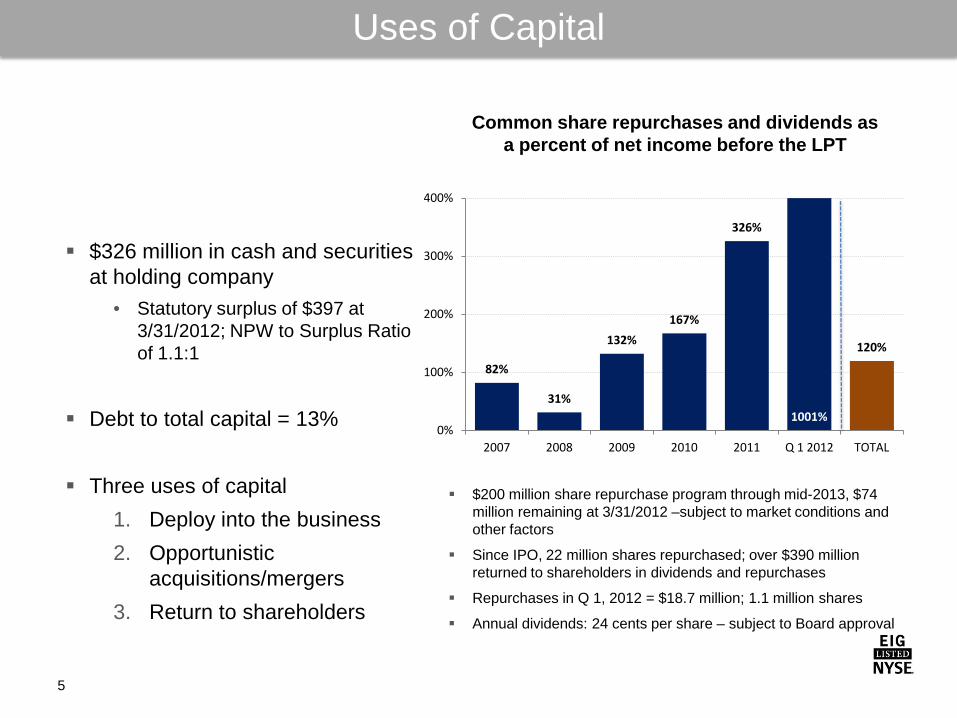
82%
31%
132%
167%
326%
1001%
120%
0%
100%
200%
300%
400%
2007 2008 2009 2010 2011 Q 1 2012 TOTAL
Common share repurchases and dividends as a percent of net income before the LPT
Uses of Capital
5
$200 million share repurchase program through mid-2013, $74
million remaining at 3/31/2012 –subject to market conditions and other factors
Since IPO, 22 million shares repurchased; over $390 million returned to shareholders in dividends and repurchases
Repurchases in Q 1, 2012 = $18.7 million; 1.1 million shares
Annual dividends: 24 cents per share – subject to Board approval
$326 million in cash and securities
at holding company • Statutory surplus of $397 at
3/31/2012; NPW to Surplus Ratio of 1.1:1
Debt to total capital = 13%
Three uses of capital
1. Deploy into the business 2. Opportunistic
acquisitions/mergers 3. Return to shareholders

Statutory Surplus
Net Rate
6
Net Rate per $100 of Payroll
CA net rate
Total net rate
Many variables impact net rate including rate changes, underwriting risk profiles, pricing, changes in business mix
OVERALL change in net rate up 0.6% YOY • (1.2% Q 1 2012 YTD)
CA net rate increase 13.6% YOY
• CA payroll exposure increase 22.9% • CA in force premium increase 39.6% • CA policy count increase 28.8% • Average policy size increase 8%
Net rate = total premium in force divided
by total insured payroll exposure
EMPLOYERS

Strong underwriting franchise with established presence in attractive markets; 99 year operating history
Realized growth; expense management; improving operating ratios
Unique, long-standing strategic distribution relationships
Conservative risk profile and prudent capital management
Strong financial position and strong balance sheet
Experienced management team with deep knowledge of workers’ compensation
Demonstrated ability to manage through challenging operating conditions
Key Strengths
7

Douglas D. Dirks President & Chief Executive Officer Employers Holdings, Inc. William E. (Ric) Yocke Executive Vice President and Chief Financial Officer Employers Holdings, Inc.
Analyst Contact: Vicki Erickson Mills Vice President, Investor Relations Employers Holdings, Inc. (775) 327-2794 [email protected]
10375 Professional Circle Reno, NV 89521 (775) 327-2700

The image part with relationship ID rId2 was not found in the file.
Appendix

As a reminder to investors, Employers Holdings, Inc. (EMPLOYERS) owns four insurance companies, domiciled in three different states. These wholly-owned insurers are regulated by insurance commissioners and are subject to the statutes and regulations of the various states where they are domiciled and authorized to transact insurance. As a result, EMPLOYERS has the following stock ownership limitations, which must be satisfied prior to certain stock transactions. As of February 5, 2012, the fifth anniversary of the effective date of the plan of conversion pursuant to which Employers Holdings, Inc. (the “Company”) converted from a mutual insurance holding company to a stock corporation, the provisions of Nevada Revised Statutes § 693A.500 and Article XI of the Amended and Restated Articles of Incorporation of the Company expire. These provisions generally provided that under Nevada law, until February 6, 2012, no person, other than the Company, any direct or indirect subsidiary of the Company and any employee compensation or benefit plan of the Company or any such direct or indirect subsidiary, could directly or indirectly offer to acquire or acquire in any manner the beneficial ownership of 5% or more of any class of voting security of the Company without the prior approval by the Commissioner of the Nevada Division of Insurance. The Company remains subject to the customary “acquisition of control” statutes in the states where it operates. The Company’s insurance subsidiaries are domiciled in Florida, California and Nevada. The insurance laws of these states generally require that any person seeking to acquire control of a domestic insurance company obtain the prior approval of the state’s insurance commissioner. In Florida, “control” is generally presumed to exist through the direct or indirect ownership of 5% or more of the voting securities of a domestic insurance company or of any entity, such as the Company, that controls a domestic insurance company. In California and Nevada, “control” is presumed to exist through the direct or indirect ownership of 10% or more of the voting securities of a domestic insurance company or of any entity, such as the Company, that controls a domestic insurance company. In addition, insurance laws in many states in which the Company is licensed require pre-notification to the state’s insurance commissioner of a change in control of a non-domestic insurance company licensed in those states. All of these approval and notification requirements continue to remain applicable to the direct or indirect acquisition of the Company’s common stock by any person and are not altered by the expiration of the above-described limitations.
Stock Ownership Limitations
10
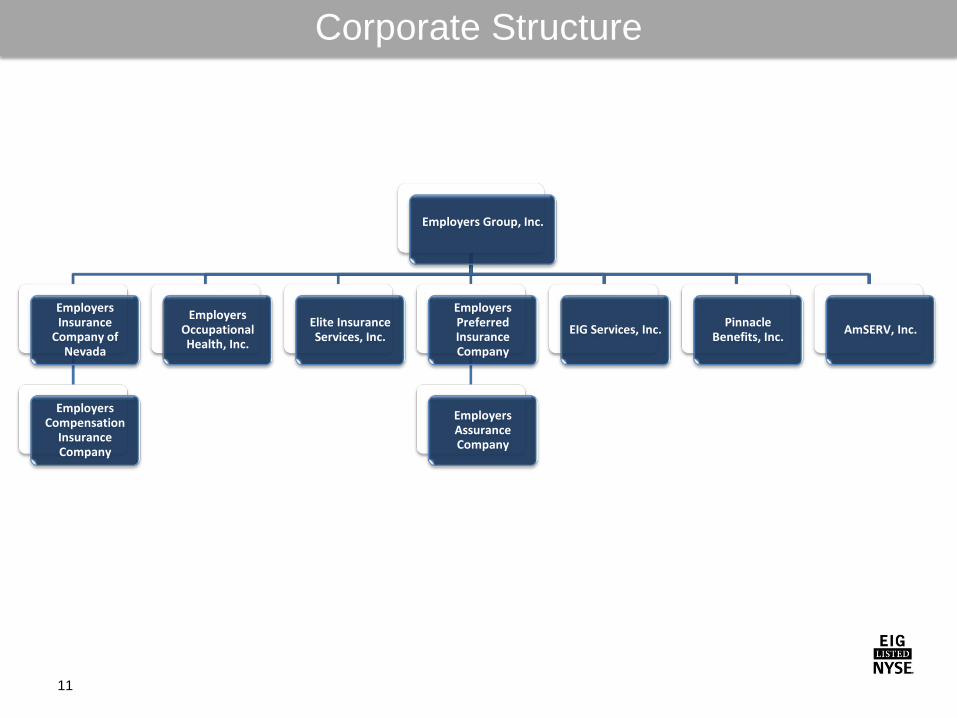
Corporate Structure
11
Employers Group, Inc.
Employers Insurance
Company of Nevada
Employers Compensation
Insurance Company
Employers Occupational Health, Inc.
Elite Insurance Services, Inc.
Employers Preferred Insurance Company
Employers Assurance Company
EIG Services, Inc. Pinnacle Benefits, Inc. AmSERV, Inc.
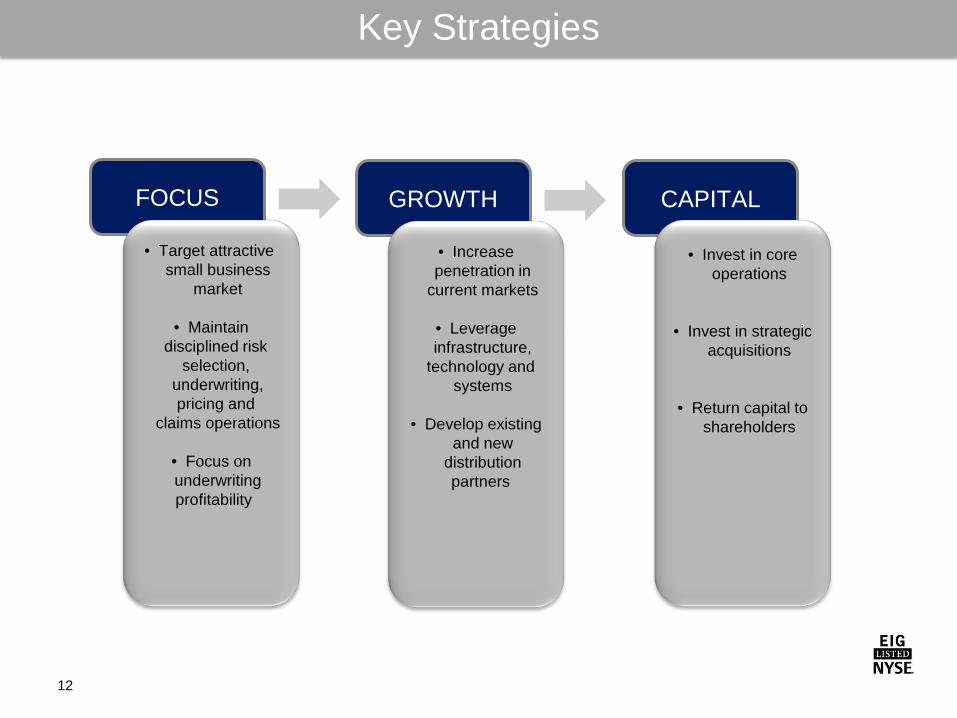
FOCUS GROWTH CAPITAL
• Target attractive small business
market
• Maintain disciplined risk
selection, underwriting, pricing and
claims operations
• Focus on underwriting profitability
• Increase penetration in
current markets
• Leverage infrastructure,
technology and systems
• Develop existing
and new distribution partners
• Invest in core operations
• Invest in strategic acquisitions
• Return capital to shareholders
Key Strategies
12

2000 2002 2006 2007 2008 1913 – 1999
State WC fund in NV
2000 Privatization
2007 Demutualization and IPO – entry into FL, IL and
OR
2002 Acquisition,
book of business in CA, UT, ID,
MT, CO
2005 Formation of
mutual hold co
2008 Acquisition of
AmCOMP Incorporated, entry into IA 2006 Entry
into TX, AZ
FL
NM
MD
TX
OK
KS
NE
SD
ND MT
WY
CO UT
ID
AZ
NV
WA
CA
OR
KY
ME
NY
PA
MI
NH MA CT
VA WV
OH IN IL
NC TN
SC
AL
AR
LA
MO
IA
MN
WI
MS
VT
NJ
DE
RI
GA
Selectively Expanding Footprint
13
HISTORY
2009–2011 2009 – 2011
Focus on growth in
existing states; entry into New
Jersey

Operating Conditions
14
Economic conditions •High unemployment and
underemployment, but improving
•Reduced work hours •Historically low investment
yields
Workers’ compensation market •High combined ratios •Signs of a firming market •Price increases in largest
markets – CA, FL, IL
P & C Segment • Over capitalization • Soft market conditions
Solid financial position • Significant capital • Stable investment portfolio

Unique Distribution Network
Strategic Partnerships Industry Focused
• 3,791 agencies • Strong relationships
with agents
• Two key partners ADP Anthem Blue Cross
Restaurants and physicians are our top two classes of
customers
• California and Nevada Restaurant Associations’ provider of choice
• California Medical Association sponsorship
• National Federation of Independent Business
Independent Agents and Brokers
15

Increasing Points of Access
Provide
Result
Contribute
Partnerships Largest payroll services company in the U.S. Partner since 2002 – business originates with ADP’s field sales staff and insurance agency with “Pay-by-Pay®” premium collection
Largest group health carrier in CA – exclusive relationship – use medical provider network Partner since 2002 – business originated by health agents with a single bill to customers
Specialty provider of payroll services / insurance broker Partner since Q4 2006, expanded alliance in 2008
Provider of insurance software services – partner since Q4 2007
Small business payroll services – partner since Q2 2008
Online payroll services and payment processing One of the largest independent payroll processors in Southern CA Partner since Q1 2009
First company in the U.S. to offer insurance coverage on-line or direct for professional service businesses with 10 employees or less Partner – Q4 2010
… a distribution advantage by
expanding market reach and providing
local knowledge
… in high persistency
… about 24% of in-force premiums
at 3/31/12
16
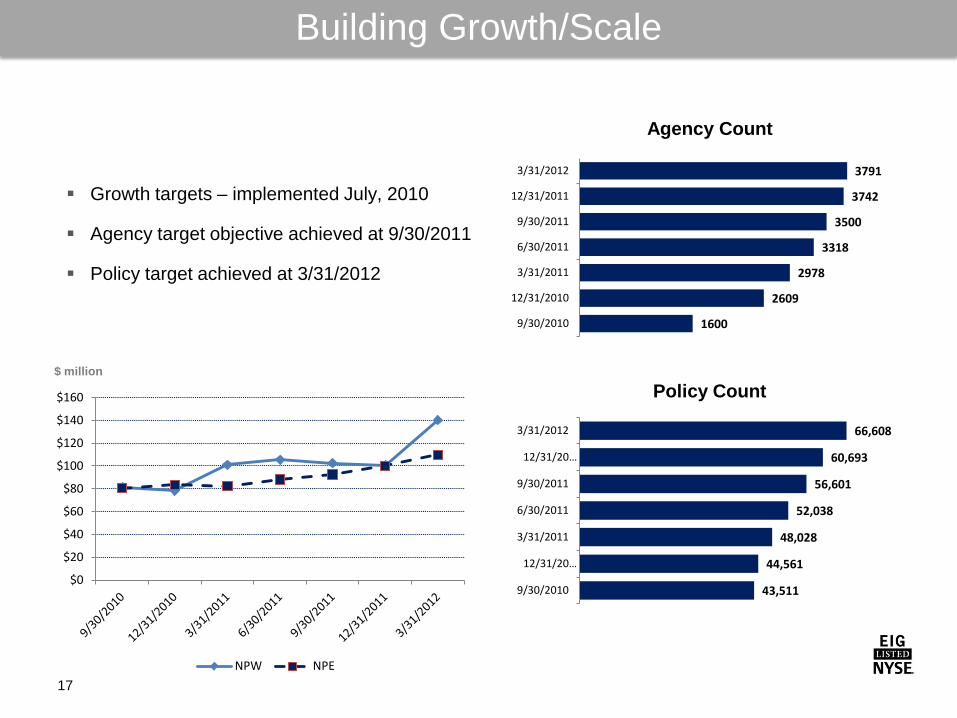
Building Growth/Scale
17
Growth targets – implemented July, 2010
Agency target objective achieved at 9/30/2011
Policy target achieved at 3/31/2012
Agency Count
Policy Count $ million
1600
2609
2978
3318
3500
3742
3791
9/30/2010
12/31/2010
3/31/2011
6/30/2011
9/30/2011
12/31/2011
3/31/2012
43,511
44,561
48,028
52,038
56,601
60,693
66,608
9/30/2010
12/31/20…
3/31/2011
6/30/2011
9/30/2011
12/31/20…
3/31/2012
$0
$20
$40
$60
$80
$100
$120
$140
$160
NPW NPE

19%
25%36%
15%4%
1%
15%
24%
37%
15%
7%
2%Hazard Group A Hazard Group B Hazard Group C Hazard Group D Hazard Group E Hazard Group F Hazard Group G
Lower Risk
Higher Risk
Hazard Group % at March 31, 2012 44% in Hazard Groups A – B 95% in Hazard Groups A – D
With growth, observable shift to lower risk hazard groups
Focus on Low Risk
18
Hazard Group % at March 31, 2011 39% in Hazard Groups A – B 91% in Hazard Groups A – D
(data shown as a % of in force premiums)
NCCI Hazard Groups
0%
10%
20%
30%
40%
A B C D E F G Q 1 2011 Q 1 2012
Hazard Group Allocation

Strategic partnerships result in consistently higher retention rates
90% 89% 85% 81%73%
87% 87%
93% 92%88% 88%
82%
90% 91%
0%
10%
20%
30%
40%
50%
60%
70%
80%
90%
100%
2006 2007 2008 2009 2010 2011 Q 1 2012
Overall retention Strategic Markets
Strong Retention Rates
19
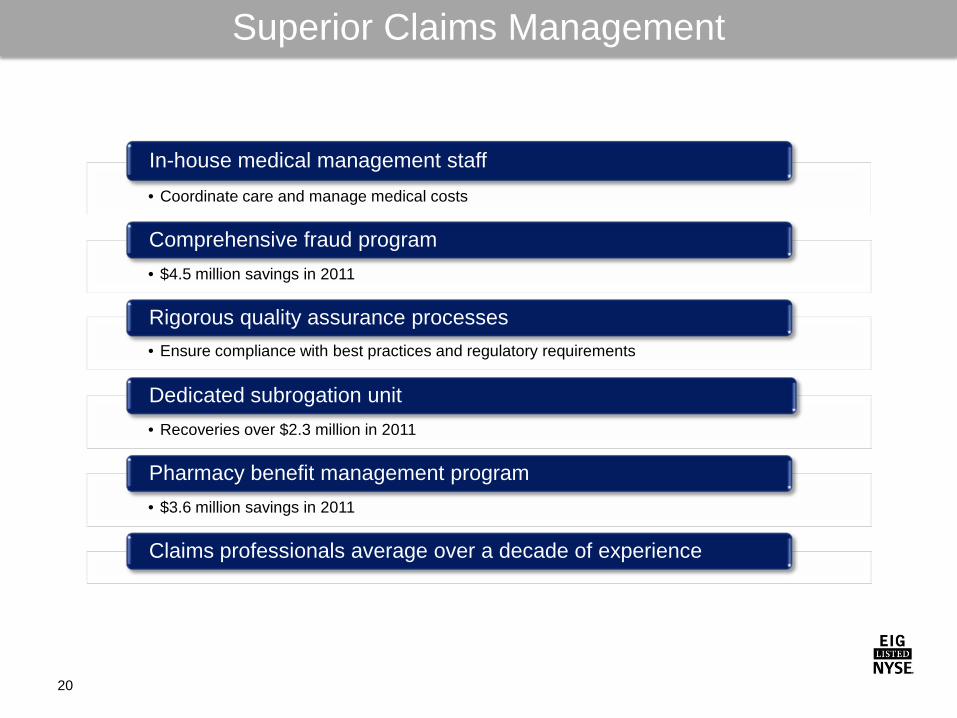
• Coordinate care and manage medical costs
In-house medical management staff
• $4.5 million savings in 2011
Comprehensive fraud program
• Ensure compliance with best practices and regulatory requirements
Rigorous quality assurance processes
• Recoveries over $2.3 million in 2011
Dedicated subrogation unit
• $3.6 million savings in 2011
Pharmacy benefit management program
Claims professionals average over a decade of experience
Superior Claims Management
20

Contract
($ million)
Total Coverage $2,000
Original Reserves (Liabilities) Transferred $1,525
Consideration $ 775
Gain at 1/1/2000 750
Subsequent Reserve Adjustments (147.5)
Gain at 3/31/12 $602.5
Accounting at 3/31/12 ($ million)
Statutory Surplus Created $602.5
Cumulative Amortization To Date (253.5)
GAAP: Deferred Reinsurance Gain – LPT Agreement $349.0
Retroactive 100% quota
share reinsurance
coverage for all losses 6/30/95
and prior
Gain on transaction booked as statutory
surplus; deferred and amortized under GAAP
Non-recurring transaction with no ongoing cash
benefits or charges to
current operations
Adjustments in LPT reserves do
not impact adjusted surplus
or equity
3 Reinsurers: ACE, Berkshire
(NICO), XL Collateralized
under agreement: largely cash/short-term securities, U. S. Treasuries, and Wells Fargo stock
Claims 6/30/1995 and prior – Approximately 3,180 claims open as of 3/31/12 with 4.5% closing each year Remaining liabilities at 3/31/12: $798 million
Loss Portfolio Transfer (LPT)
21

Estimated impact: 2012 increase of $7 million to underwriting and other operating costs and decrease to total assets We continue to expect the DAC accounting change to be recorded as follows: Q 1 = 47% (ACTUAL: $3 million) Q 2 = 31% Q 3 = 16% Q 4 = 6%
Deferred Acquisition Cost Accounting Change
22
*Deferred Policy Acquisition Costs (DAC) • Financial Accounting Standards Board (FASB) revised the definition of acquisition costs – costs associated with acquiring and renewing insurance policies – which we are capitalizing and deferring beginning January 1, 2012 (Accounting Standards Update Number 2010-26) • EHI adopted the guidance on a prospective basis
1. Adjustment to exclude the deferred acquisition accounting change which added $3 million to underwriting and other operating expense in the three months ended March 31, 2012. The $3 million was comprised of expenses related to acquiring new or renewal insurance contracts. 2. Adjustment to include the tax benefit related to the exclusion of the DAC accounting change in the three months ended March 31, 2012. 3. The LPT adjustment is also a non-GAAP measure which is explained/reconciled in our May 8, 2012 earnings press release. This calculation is normally included in the Company's reports on financial and operating results.
Three Months Ended March 31, ($ thousand except for percentages) 2012 2011
GAAP Results Adjustments(1) Non-GAAP
Results GAAP Results Underwriting & other operating expenses $ 32,142 $ 3,000 $ 29,142 $ 25,678 Underwriting & other operating expenses ratio 29.3 % 2.7 % 26.6 % 31.1 %
Total expenses $ 127,441 $ 3,000 $ 124,441 $ 96,392
Combined ratio 116.0 % 2.7 % 113.3 % 116.9 %
Total expenses before LPT(3) $ 131,597 $ 3,000 $ 128,597 $ 100,911
Combined ratio before LPT(3) 119.8 % 2.7 % 117.1 % 122.4 % Net premiums earned used in the ratio calculations $ 109,900 $ 109,900 $ 109,900 $ 82,427
Three Months Ended March 31, ($ thousand except per share) 2012 2011
GAAP Results Adjustments (1)(2) Non-GAAP Results GAAP Results Net income before taxes $ 1,801 $ 3,000 $ 4,801 $ 5,965 Income tax benefit (4,421 ) (508 ) (4,929 ) (2,380 ) Net income $ 6,222 $ 3,508 $ 9,730 $ 8,345 Less: Amortization of the LPT(3) 4,156 4,156 4,519 Net income before LPT(3) $ 2,066 $ 5,574 $ 3,826
Earnings per common diluted share 0.19 0.11 0.30 0.21 Earnings before the LPT per common diluted share(3) 0.06 0.11 0.17 0.10 Diluted shares used in per share calculations 32,826,091 32,826,091 32,826,091 38,877,124
Reconciliation of GAAP to Non-GAAP combined ratio
Reconciliation of GAAP to Non-GAAP net income, earnings per share

Statutory surplus provides a solid basis for underwriting
($ million)
215
339
431
531
640698
578
661
454388 397
2002 2003 2004 2005 2006 2007 2008 2009 2010 2011 Q 1 2012
$355 million extraordinary dividends to
parent in 2008
Strong Capital Position
23
$150 million extraordinary dividends to
parent in 2010
NPW to Surplus: 1.1 to 1
Financial strength rating of A- (Excellent) by A.M. Best
Statutory Surplus
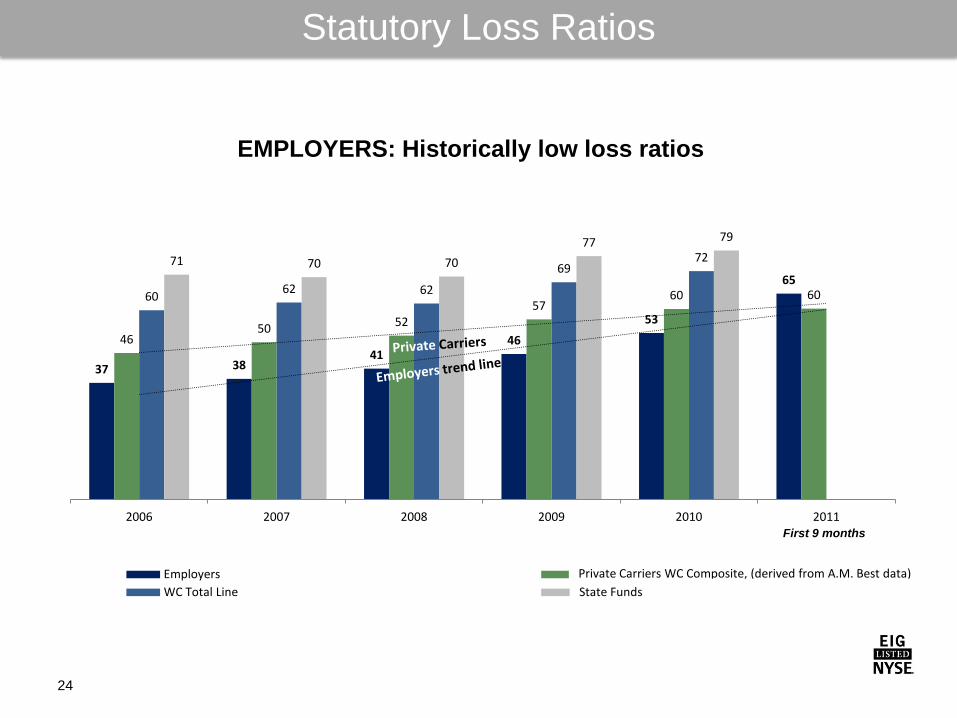
Statutory Loss Ratios
24
37 38 41
46
53
65
46 50 52
57 60 60 60
62 62
69 72 71 70 70
77 79
2006 2007 2008 2009 2010 2011
Employers AM Best Private Carriers WC Composite WC Total Line State Funds
EMPLOYERS: Historically low loss ratios
First 9 months
Private Carriers WC Composite, (derived from A.M. Best data) State Funds

Reserve Review Reserve Development
Net reserves for workers’ comp industry estimated to be deficient by $10 Billion at 12/31/10 (1)
(1) NCCI, “State of the Line” – June 2011 – an increase of over 50% from $6 billion in 2008
Net Calendar Year Reserve Releases for Prior Accident Years ($ million)
$69
$38
$78
$107
$60$72
$51
$11 $6
2003 2004 2005 2006 2007 2008 2009 Q 1 2010
Q 2 2010
Quarterly evaluation of prior year reserves and current year loss
picks
Consider point estimate of
independent consulting actuary
bi-annually
Results from senior management to
Board Audit Committee
No favorable or unfavorable prior period development for voluntary business since the
second quarter of 2010
History of Reserve Strength
25

Q 1 2012: $2 billion fair market value • Increase equity securities with focus on higher dividend
rates • 96% fixed maturities with an average weighted rating, AA • 4.3% average book yield • 5.3% tax equivalent book yield • Effective duration: 4.9
High Quality Investment Portfolio
26
Q 1 2011: $2 billion fair market value
Investment Portfolio Allocation
• Complete portfolio repositioning to reduce tax exempt municipals, shorten duration and increase high dividend equity securities
• 94% fixed maturities, average weighted rating of AA • 4.1% average book yield • 4.9% tax equivalent book yield • Effective duration of 4.3
0.0%
10.0%
20.0%
30.0%
40.0%
50.0% 3/31/2011 3/31/2012
U.S. Treasuries, 7.5%
U.S. Agencies, 5.1%
States and municipalities,
37.8% Corporate securities, 27.3%
Residential mortgage-
backed securities, 13.9%
Commercial mortgaged-back
securities 1.2%
Asset-backed securities, 0.6%
Equity securities, 6.2%
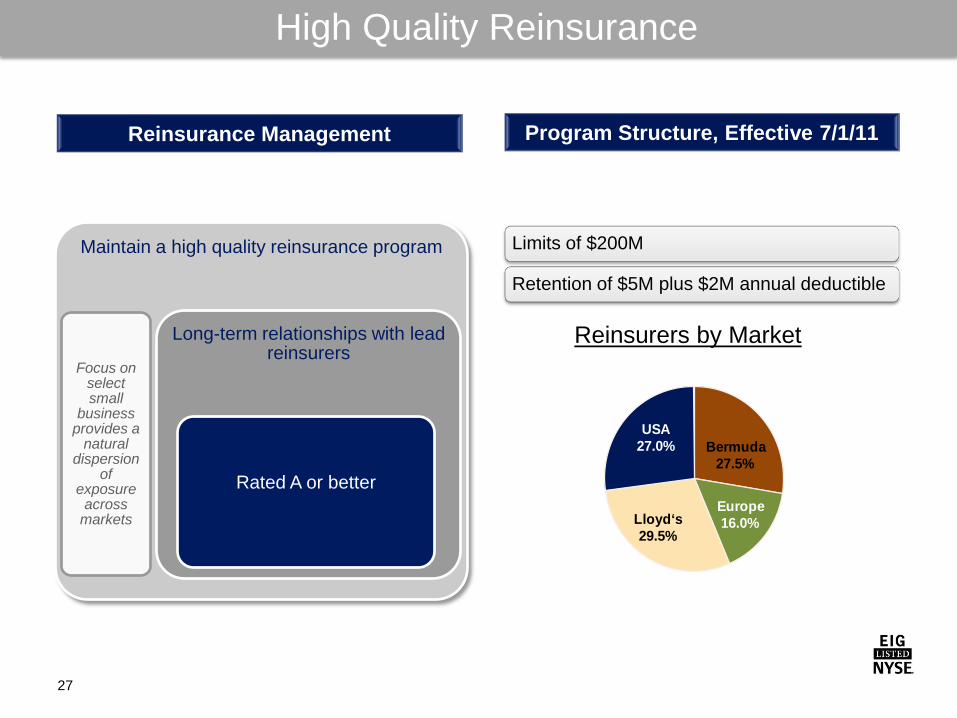
Maintain a high quality reinsurance program
Focus on select small
business provides a
natural dispersion
of exposure
across markets
Long-term relationships with lead reinsurers
Rated A or better
Limits of $200M
Retention of $5M plus $2M annual deductible
Program Structure, Effective 7/1/11 Reinsurance Management
Reinsurers by Market
Bermuda27.5%
Europe 16.0%Lloyd‘s
29.5%
USA 27.0%
High Quality Reinsurance
27
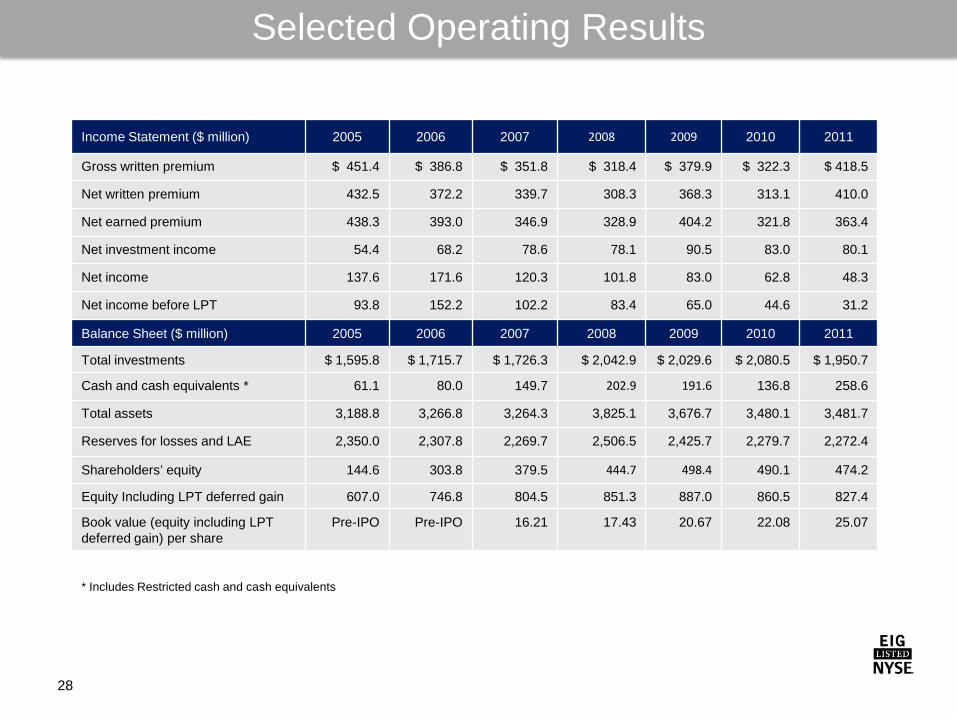
Income Statement ($ million) 2005 2006 2007 2008 2009 2010 2011
Gross written premium $ 451.4 $ 386.8 $ 351.8 $ 318.4 $ 379.9 $ 322.3 $ 418.5
Net written premium 432.5 372.2 339.7 308.3 368.3 313.1 410.0
Net earned premium 438.3 393.0 346.9 328.9 404.2 321.8 363.4
Net investment income 54.4 68.2 78.6 78.1 90.5 83.0 80.1
Net income 137.6 171.6 120.3 101.8 83.0 62.8 48.3
Net income before LPT 93.8 152.2 102.2 83.4 65.0 44.6 31.2
Balance Sheet ($ million) 2005 2006 2007 2008 2009 2010 2011
Total investments $ 1,595.8 $ 1,715.7 $ 1,726.3 $ 2,042.9 $ 2,029.6 $ 2,080.5 $ 1,950.7
Cash and cash equivalents * 61.1 80.0 149.7 202.9 191.6 136.8 258.6
Total assets 3,188.8 3,266.8 3,264.3 3,825.1 3,676.7 3,480.1 3,481.7
Reserves for losses and LAE 2,350.0 2,307.8 2,269.7 2,506.5 2,425.7 2,279.7 2,272.4
Shareholders’ equity 144.6 303.8 379.5 444.7 498.4 490.1 474.2
Equity Including LPT deferred gain 607.0 746.8 804.5 851.3 887.0 860.5 827.4
Book value (equity including LPT deferred gain) per share
Pre-IPO Pre-IPO 16.21 17.43 20.67 22.08 25.07
* Includes Restricted cash and cash equivalents
Selected Operating Results
28
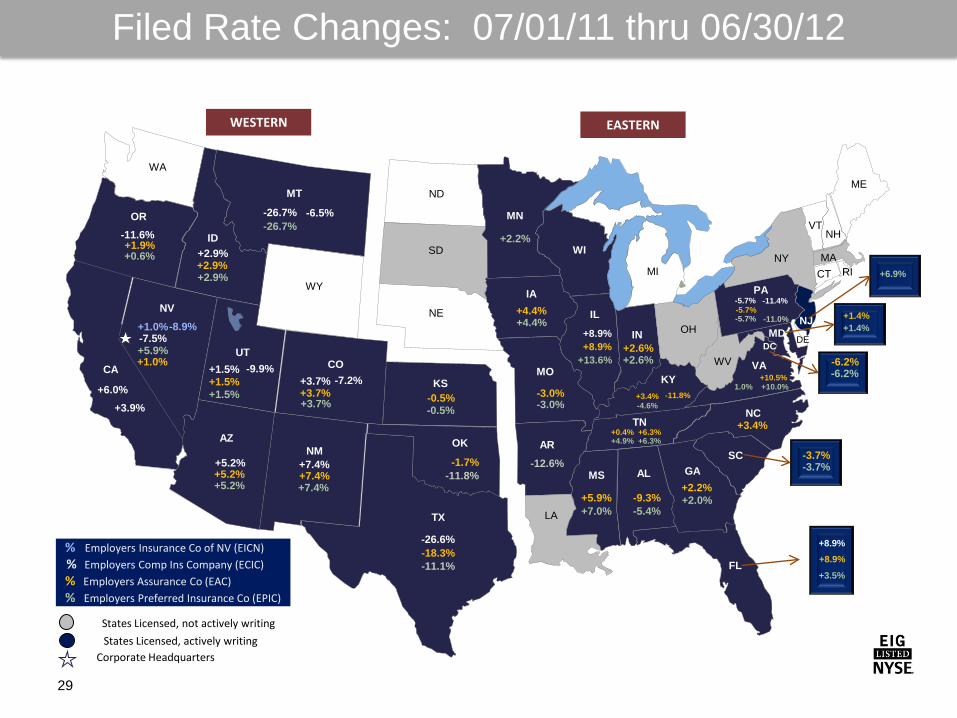
FL
NM
MD
TX
OK
KS
NE
SD
ND MT
WY
CO UT
ID
AZ
NV
WA
CA
OR
KY
NY
PA
MI MA
CT
VA WV
OH IN
IL
NC TN
SC AL
AR
LA
MO
IA
MN
WI
MS
VT
NJ DE
RI
GA
Corporate Headquarters States Licensed, actively writing
States Licensed, not actively writing
% Employers Insurance Co of NV (EICN) % Employers Comp Ins Company (ECIC) % Employers Assurance Co (EAC) % Employers Preferred Insurance Co (EPIC)
+6.0%
-11.6%
+5.2%
+2.9%
+8.9% +8.9%
+13.6%
+1.0%
+7.4%
+4.4%
+2.6% +2.6%
-0.5% -0.5%
+2.2%
-3.0% -3.0%
+1.4% +1.4%
+3.4%
+1.5%
+5.2%
-7.5%
-26.7%
-12.6% -3.7% -3.7%
+8.9% +8.9%
+3.5%
ME
NH
WESTERN EASTERN
-6.2% -6.2%
DC
+3.7%
+2.9%
-1.7% -11.8%
+0.6%
-26.6% -18.3% -11.1%
-9.3% -5.4%
+5.9% +7.0%
-5.7%
-5.7%
+0.4% +6.3% +4.9% +6.3%
+10.5% 1.0% +10.0%
+3.9% -11.8%
-11.4%
-11.0%
Filed Rate Changes: 07/01/11 thru 06/30/12
29
-26.7%
+1.5% +1.5%
+5.2%
+3.7% +3.7%
-7.2%
+2.9%
+5.9%
-6.5%
-8.9%
+1.0%
+7.4%
+7.4%
+1.9%
-9.9%
+2.2% +2.0%
+4.4%
+3.4% -4.6%
+6.9%
-5.7%