Embed Size (px)
Citation preview

Knowledge. Experience. Integrity.
Broad Market Quarterly Returns
Third Quarter 2012
Cash (90-Day T-Bills)
U.S. Equity (Russell 3000)Non-U.S. Equity (MSCI EAFE)
U.S. Fixed (Barclays Aggregate)Non-U.S. Fixed (Citi Non-U.S.)
Real Estate (NCREIF Property Index)Hedge Funds (DJCS HFI)
Sources: Barclays, Citigroup, Credit Suisse Hedge Index LLC, Merrill Lynch, MSCI Inc., NCREIF, Russell Investment Group, Standard & Poor’s
1.58%3.98%
2.34%3.34%
0.03%
6.23%6.92%
Oiling the Stimulus MachineU.S. EQUITY
Coordinated stimulus propelled a “risk-on” en-vironment, resulting in a
global rally for most assets. Domes-tic equity was propelled by historic corporate profits. The Russell 3000 Index gained 6.23%, while the S&P 500 Index came within 100 points of its 2007 high.
2P A G E
To Your HealthPRIVATE EQUITY
If “moderation in all things” is the key to good health, the third quarter
was a paragon of vitality. Private equity held steady, with only mild declines (mostly in fundraising) from the second quarter. Liquidity proceeded at sustainable levels.
15P A G E
Lower for Longer (and Longer, and Longer…) U.S. FIXED INCOME
The Barclays Aggregate Index rose 1.58% on news of a third round of
quantitative easing by the Federal Reserve. Gains were driven by investors snapping up bonds with attractive spreads to Treasuries. The Barclays Corporate High Yield Index advanced 4.53%.
5P A G E
Whatever It TakesNON-U.S. FIXED INCOME
The Citi Non-U.S. World Government Bond Index (+3.98%) got a positive
boost, even as Germany decried actions taken by the European Central Bank. The J.P. Morgan GBI Emerging Market Composite (+4.57%) rebounded strongly as emerging market currencies appre-ciated against the dollar.
11P A G E
Debt Crisis Takes a HolidayNON-U.S. EQUITY
Aggressive policy mea-sures worldwide lifted investors’ spirits in near-
ly every market. The debt crisis took a much-needed vacation, as the MSCI Europe Index (+8.70%) took flight. The MSCI EM Index (+7.89%) outperformed EAFE Value (+7.46%) and matched EAFE Small Cap (+7.89%).
8P A G E
Risk-on AgainHEDGE FUNDS
Stimulus-inspired equity markets ripped ahead, as the MSCI ACWI
(+6.97%) leapt. Hedge funds partic-ipated as well, drafting behind mar-ket tailwinds. The unmanaged Dow Jones Credit Suisse Hedge Fund Index (+3.34%) advanced.
16P A G E
Renewed Appetite for RiskDC INDEX & FUND SPONSOR
Public (+4.69%) and cor-porate funds (+4.66%) were neck-and-neck while
endowments/foundations (+4.20%) lagged other fund types. Taft-Hartley funds landed in between, rising 4.56%. Year-to-date, the me-dian domestic balanced manager topped institutional peers, adding 11.72%.
19P A G E
17P A G E
Properties Continue Their AdvanceREAL ESTATE
The NCREIF Property Index advanced 2.34% during the third quar-
ter, while domestic REITs gained 0.16%. On an international level, publicly traded real estate exhibited strong performance, as Asia/Pacific REITs advanced 12.63% and Eu-rope REITs jumped ahead 7.29%
13P A G E
CALLAn InvEsTmEnTs InsTITuTE Capital
Market Review
Exceeding Lowered ExpectationsU.S. ECONOMY
u.s. GDP growth surpassed projections in the third quarter by reaching 2%, which was up from 1.3% in the second quarter. The surprise came courtesy of
federal spending, as for the first time in eight quarters, gov-ernment austerity did not drag down the economy.

2
Oiling the Stimulus Machine U.S. EQUITY | James Danforth, CFA
Adding to the market rally that started in June, third quarter equity returns more than made up for the losses of the second. While macro fears relating to European debt, a hard landing in China, and Iran’s nuclear capabilities persisted, the equity markets had plenty to cheer for this quarter as G3 policy mak-ers announced further monetary stimulus. Europe unveiled an unlimited government bond-buying program, the Bank of Japan added ¥10 trillion ($129 billion) to its asset purchase program, and the Federal Reserve announced another round of quantitative easing that is being chided as “QE-infinity” due to the open-ended nature of the bond purchases. Despite the declining efficacy of quantitative easing, the stimulus led to a strong risk appetite in which the bulls refused to be scared off by economic uncertainty, the forthcoming presidential election, or a potential fiscal cliff.
Robust corporate profits and margins also helped propel eq-uities. Strong earnings validated current prices, as valuations stayed at reasonable levels that were slightly below their long-term averages. While investors have not entirely forgotten loss-es that occurred in the wake of the 2008 financial crisis, in sep-
Utilities
Industrials
Consumer Staples
Financials
Health Care
Information Technology
Materials
Consumer Discretionary
Telecommunications
Energy 10.02%
8.07%
7.97%
6.71%
6.64%
6.41%
6.16%
3.78%
3.64%
0.44%
Telecommunications 2.9%
Energy 10.2% Financials 16.0%
Information Technology 19.1%
Consumer Staples 9.5%
Consumer Discretionary 12.2%
Utilities 3.5%Materials 3.9%
Industrials 10.8%
Chart may not sum to 100% due to rounding.Source: Russell Investment Group
Health Care 11.9%
tember the S&P 500 Index came within 100 points of its 2007 high. Despite net asset flows departing domestic equity funds, the broad market, as measured by the Russell 3000 Index, earned a cool 6.23% in the third quarter.
The third period rally was broad-based, evidenced by the relatively small dispersion between the highest-re-turning market segment, mega caps (Russell Top 50: +7.21%) and the worst-performing segment, small cap growth (represented by the Russell 2000 Growth: +4.84%). Continu-ing a trend that began last quarter, Value stocks outperformed Growth as the Russell 3000 Value Index (+6.44%) edged out its Growth counterpart (+6.01%).
Economically sensitive sectors fared best in a “risk-on” envi-ronment. Within the Russell 3000, Energy (+10.02%), Telecom (+8.07%), and Consumer Discretionary (+7.97%) sectors set the pace. After slumping in the second quarter, Oil rebounded strongly, helping push returns in Energy stocks, while hurting Transportation (-5.41%). Truckers and consumers were not the only ones feeling pain at the pump, as Airlines lost 11.79%.
Economic Sector Exposure (Russell 3000) Economic Sector Quarterly Returns (Russell 3000)

3Knowledge. Experience. Integrity.
U.S. EQUITY (Continued)
Exxon mobil benefited to the tune of +7.56%. Given the com-pany’s 2.70% weight in the Russell 3000, it had the second larg-est impact of any individual stock in the Index. meanwhile, uPs was the most significant detractor from the Index, losing 8.45% of its value.
The Oil and Gas Refining sub-industry jumped an impressive 27.77%, only to be outdone by a 45.92% return in Precious metals and minerals. A weakening u.s. dollar not only helped foreign stocks outperform domestic, but also led to an 11% in-crease in the price of gold.
Technology, the biggest sector in the Russell 3000 (representing 19%), had the greatest impact on the Index, gaining 6.64% in the quarter. Once again, Apple was the most influential stock in the Index at a weight of 3.94%. It appreciated 14.72% to lift the benchmark by more than half a percent. The Computer Hard-ware sub-industry also held two of the three most significant detractors from the Index, Dell (-20.06%) and HP (-14.52%). Fortunately, the Technology sector was also home to the Index’s two best-performing industries, wireless telecommunications (+26.09%) and internet software and services (+18.89%).
02 0393 94 95 96 97 98 99 00 01-30%
-20%
-10%
0%
10%
20%
30%
04 05 06 07 08 09 10 11 12
Russell 1000 Growth Russell 1000Russell 1000 Value
Source: Russell Investment Group
Large Cap Large Cap Small Cap Small Cap Growth Style Value Style Growth Style Value Style 10th Percentile 7.87 8.12 7.89 7.43 25th Percentile 6.75 7.15 6.74 6.37 Median 6.18 6.45 5.57 5.25 75th Percentile 5.82 5.56 3.36 4.38 90th Percentile 5.21 4.95 2.15 2.78 R1000 Growth R1000 Value R2000 Growth R2000 Value Benchmark 6.11 6.51 4.84 5.67
Sources: Callan Associates Inc., Russell Investment Group
0%
2%
4%
6%
8%
10%
Rolling One-Year Relative Returns (vs. Russell 1000) Callan Style Group Quarterly Returns
U.S. Equity Index Characteristics as of September 30, 2012
S&P 1500 S&P 500 S&P 400 S&P 600 Rus 3000 Rus 1000 Rus Midcap Rus 2000Cap Range min ($mm) 26 943 237 26 12 206 206 12
Cap Range max ($B) 625.49 625.49 12.07 3.31 623.93 623.93 22.00 3.51
number of Issues 1500 500 400 600 2961 986 795 1975
% of S&P 1500 100% 89% 8% 3% 100% 92% 27% 8%
Wtd Avg mkt Cap ($B) 105.87 119.13 4.06 1.33 97.92 105.84 8.56 1.28
Price/Book Ratio 2.1 2.2 2 1.8 2.1 2.2 2 1.7
P/E Ratio (forecasted) 13.1 12.8 15.0 15.9 13.2 13.1 14.4 15.9
Dividend Yield 2.1% 2.2% 1.5% 1.3% 2.1% 2.1% 1.7% 1.4%
5-Yr Earnings (forecasted) 10.8% 10.8% 11.1% 10.6% 11.0% 10.9% 11.4% 11.7%
Sources: Russell Investment Group, Standard & Poor’s.

4
Style Median and Index Returns* for Periods ended September 30, 2012
Large Cap Equity Quarter 3 Quarters Year 3 Years 5 Years 10 YearsLarge Cap–Broad Style 6.38 15.98 29.78 12.40 0.95 8.48Large Cap–Growth Style 6.18 16.99 28.50 13.54 2.46 8.40Large Cap–Value Style 6.45 15.16 30.12 11.52 -0.56 8.60Aggressive Growth Style 4.37 12.54 24.38 13.74 2.31 10.68Contrarian Style 5.92 14.21 28.89 11.90 0.40 8.86Core Style 6.74 16.11 30.42 12.61 1.44 8.44Yield-Oriented Style 5.48 12.83 27.17 12.30 1.39 9.10Russell 3000 6.23 16.13 30.20 13.26 1.30 8.49
Russell 1000 6.31 16.28 30.06 13.27 1.22 8.35
Russell 1000 Growth 6.11 16.80 29.19 14.73 3.24 8.41
Russell 1000 Value 6.51 15.75 30.92 11.84 -0.90 8.17
S&P Composite 1500 6.25 16.13 30.18 13.37 1.36 8.34
S&P 500 6.35 16.44 30.20 13.20 1.05 8.01
nYSE 6.45 21.35 34.46 11.58 0.28 9.14
Dow Jones Industrials 5.02 12.19 26.52 14.45 2.16 8.60
Mid Cap Equity Quarter 3 Quarters Year 3 Years 5 Years 10 YearsMid Cap–Broad Style 5.04 14.22 27.71 13.98 2.77 11.15Mid Cap–Growth Style 4.37 14.77 26.19 15.04 2.90 11.21Mid Cap–Value Style 5.88 13.59 29.87 13.42 2.70 11.21Russell midcap 5.59 14.00 28.03 14.26 2.24 11.18
s&P midCap 400 5.44 13.77 28.54 14.33 3.83 10.77
Small Cap Equity Quarter 3 Quarters Year 3 Years 5 Years 10 YearsSmall Cap–Broad Style 5.56 14.27 31.70 14.67 3.04 11.41Small Cap–Growth Style 5.57 15.51 31.15 15.77 2.22 11.55Small Cap–Value Style 5.25 13.37 32.21 13.20 3.19 11.33Small Cap–Core Style 5.78 14.14 33.10 15.15 3.45 11.29Russell 2000 5.25 14.23 31.91 12.99 2.21 10.17
S&P SmallCap 600 5.40 13.80 33.35 15.14 3.29 10.74
nASDAQ 6.53 20.71 30.62 14.90 3.96 11.20
Russell 3000 Sectors Quarter 3 Quarters Year 3 Years 5 Years 10 YearsConsumer Staples 3.78 12.49 23.34 15.45 7.92 9.45
Consumer Discretionary 7.97 21.19 36.39 20.73 5.61 8.82
Industrials 3.64 11.22 30.35 13.48 -0.44 8.72
Energy 10.02 6.61 26.57 12.38 0.86 14.32
materials 6.71 13.50 31.90 11.72 1.22 11.60
Information Technology 6.64 19.56 30.26 14.36 4.49 11.67
utilities 0.44 4.60 13.73 12.57 2.74 11.19
Financials 6.16 20.37 34.42 4.84 -10.08 1.30
Telecommunications 8.07 25.78 35.41 18.62 1.70 11.43
Health Care 6.41 20.09 31.88 15.05 5.59 7.85
*Returns less than one year are not annualized.
Sources: Callan Associates Inc., Dow Jones & Company Inc., Russell Investment Group, Standard & Poor’s, The NASDAQ Stock Market Inc.
U.S. EQUITY (Continued)

5Knowledge. Experience. Integrity.
Lower for Longer (and Longer, and Longer…)U.S. FIXED INCOME | Steven Center, CFA
The third quarter of 2012 was marked by renewed action by Federal Reserve Chairman Ben Bernanke that resulted in a sell-off of u.s. Treasuries. Additionally, European policy mak-ers enacted a potentially unlimited government bond purchase program to prop up their troubled market. Both actions resulted in a “risk-on” bond market in which spread sectors performed well. The Barclays Aggregate Index increased 1.58%, driven by investors snapping up any bond with an attractive spread to Treasuries.
After months of speculation, the Federal Open market Commit-tee finally announced a third round of quantitative easing (QE3) in September. QE3 will include the ongoing, monthly purchase of $40 billion of mortgage-backed securities. Additionally, the Fed committed to keeping interest rates low through 2015. As such, they continued their low-rate policies, holding down both the federal funds rate (0.00% to 0.25%) and the discount rate (0.75%). The yield curve steepened modestly during the quar-ter, as the spread between two-year and 30-year Treasuries increased 14 bps to 259 bps. The short end of the curve re-mained fairly consistent, but two-year yields dropped 7 bps; five-year yields dipped 9 bps; and 10-year yields inched lower
by 1 bps. However, 30-year yields climbed slightly by 7 bps. The breakeven rate (the difference between nominal and real yields) on the 10-year Treasury rose 29 bps to 2.42% for the quarter. Ten-year TIPs extended their year-long streak of offer-ing a negative real yield (-0.78%).
The second quarter’s flight to quality reversed during the third period, as all spread sectors outperformed like-duration
U.S. Treasury Yield Curves
-1%
0%
1%
2%
3%
4%
5%
6%
U.S. 10-Year Treasury Yield 10-Year TIPS Yield Breakeven Inflation Rate
07 08 09 10 11 1206050403
Source: Bloomberg
Historic 10-Year Yields
Interm Core Bond Core Plus Ext Maturity High Yld Style Style Style Style Style 10th Percentile 2.22 2.78 3.96 4.93 5.16 25th Percentile 1.97 2.53 3.18 4.52 4.80 Median 1.81 2.22 2.88 3.69 4.47 75th Percentile 1.45 1.95 2.56 3.27 4.25 90th Percentile 1.25 1.71 2.23 1.61 3.95 Barclays Barclays Barclays Barclays Barclays Intm Agg Agg Agg G/C Long High Yld Benchmark 1.36 1.58 1.58 3.10 4.53
Sources: Barclays, Callan Associates Inc.
0%
2%
4%
6%
0%
1%
2%
3%
4%
5%
Maturity (Years)Source: Bloomberg
September 30, 2012 June 30, 2012 September 30, 2011
302520151050
Callan Style Group Quarterly Returns

6
U.S. FIXED INCOME (Continued)
Treasuries. securitized assets led the charge, with commercial mortgage-backed securities surpassing like-duration Treasur-ies by 3.32%. Asset-backed securities exceeded like-duration Treasuries by 0.77%. Finally, the Fed’s QE3 announcement pushed mortgage-backed securities to a 0.71% advantage over like-duration Treasuries.
Investment-grade credit rallied as risk came back into favor, gaining 2.96% relative to like-duration Treasuries. Financials were again the bright spot, as investors viewed housing trends and the continued banking system recovery positively. Finan-cials surged past like-duration Treasuries by 4.45%, while In-dustrials and utilities issues surpassed like-duration Treasuries by 2.67% and 2.69%, respectively.
The Barclays Corporate High Yield Index climbed 4.53% dur-ing the quarter as risk regained favor. new-issue activity picked up during the quarter, with 141 issues totaling approximately $84
0% 1% 2% 3% 4% 5%
Absolute Return Excess Return versus Like-Duration Treasuries
0% 1% 2% 3% 4% 5%
0.57% 0.00%
1.58% 1.07%
1.11% 0.66%
3.83% 3.32%
1.23% 0.77%1.13% 0.71%
3.54% 2.96%
4.53% 3.94%
Barclays Treasury
Barclays Aggregate
Barclays Agencies
Barclays MBS
Barclays CMBS
Barclays ABS
Barclays Credit
Barclays Corp. High Yield
Source: Barclays.
-5%
0%
5%
10%
15%
20%
U.S. Credit Bellwether 10-Year SwapBarclays High YieldMBS
ABSCMBS ERISA
07 08 09 10 11 1206050403
Source: Barclays.
Fixed Income Index Quarterly Returns
Effective Yield Over Treasuries
U.S. Fixed Income Index Characteristics as of September 30, 2012
Barclays Indices Yield to Worst Mod Adj Duration Avg Maturity % of Barclays G/C % of Barclays Agg
Barclays Aggregate 1.61 4.85 6.73 0.00% 100.00%
Barclays Govt/Credit 1.53 6.01 8.13 100.00% 67.75%
Intermediate 1.04 3.92 4.30 80.81% 54.74%
Long-Term 3.61 14.79 24.25 19.19% 13.00%
Barclays Govt 0.82 5.32 6.54 60.75% 41.15%
Barclays Credit 2.64 7.07 10.59 39.25% 26.59%
Barclays mortgage 1.77 2.34 3.80 - 30.04%
Barclays Asset-Backed 0.90 3.22 3.63 - 0.32%
Barclays Comm mortgage 1.97 3.16 3.53 - 1.88%
Barclays Corp High Yield 6.51 4.04 6.65 - 6.43%
Source: Barclays
billion coming to market. strong ETF and retail mutual fund in-flows continued to drive the High Yield sector.

7Knowledge. Experience. Integrity.
Style Median and Index Returns* for Periods ended September 30, 2012
Broad Fixed Income Quarter 3 Quarters Year 3 Years 5 Years 10 YearsCore Bond Style 2.22 5.47 7.06 7.17 7.18 5.85Core Bond Plus Style 2.88 7.21 9.33 8.64 7.78 6.81Barclays Aggregate 1.58 3.99 5.16 6.19 6.53 5.32
Barclays Govt/Credit 1.73 4.43 5.66 6.50 6.63 5.39
Barclays Govt 0.59 2.08 2.95 5.15 6.01 4.74
Barclays Credit 3.54 8.25 10.09 8.73 7.89 6.45
Citi Broad Investment Grade 1.61 3.97 5.10 6.05 6.70 5.46
Long-Term Quarter 3 Quarters Year 3 Years 5 Years 10 YearsExtended Maturity Style 3.69 9.36 12.98 13.22 11.72 8.41Barclays Gov/Credit Long 3.10 8.30 11.08 12.47 10.90 8.11
Barclays Gov Long 0.34 4.52 6.41 11.93 10.94 7.72
Barclays Credit Long 5.22 11.34 14.91 12.74 10.61 8.57
Intermediate-Term Quarter 3 Quarters Year 3 Years 5 Years 10 YearsIntermediate Style 1.81 4.47 5.44 5.83 6.41 5.24Barclays Intermediate Aggregate 1.36 3.37 4.31 5.34 5.96 4.94
Barclays Gov/Credit Intermediate 1.40 3.53 4.40 5.18 5.71 4.76
Barclays Gov Intermediate 0.62 1.70 2.39 4.09 5.20 4.20
Barclays Credit Intermediate 2.90 7.09 8.30 7.30 6.97 5.77
Short-Term Quarter 3 Quarters Year 3 Years 5 Years 10 YearsDefensive Style 0.75 1.63 2.15 2.47 3.65 3.44Active Cash Style 1.75 4.61 5.86 6.03 6.75 5.49money market Funds (net of fees) 0.00 0.01 0.01 0.01 0.68 1.59
mL Treasury 1–3-Year 0.26 0.37 0.56 1.43 2.79 2.80
90-Day Treasury Bills 0.03 0.07 0.07 0.11 0.72 1.82
High Yield Quarter 3 Quarters Year 3 Years 5 Years 10 YearsHigh Yield Style 4.47 12.01 18.82 12.61 8.91 10.34Barclays Corporate High Yield 4.53 12.13 19.37 12.90 9.34 10.98
mL High Yield master 4.58 11.91 18.82 12.57 8.97 10.61
Mortgage/Asset-Backed Quarter 3 Quarters Year 3 Years 5 Years 10 YearsMortgages Style 1.48 3.87 4.86 6.19 6.78 5.50
Barclays mBs 1.13 2.80 3.71 4.99 6.35 5.24
Barclays ABS 1.23 3.43 3.67 5.27 4.46 3.97
Barclays CmBs 3.83 8.35 11.71 12.62 7.62 5.79
Municipal Quarter 3 Quarters Year 3 Years 5 Years 10 YearsBarclays muni 2.32 6.06 8.32 5.99 6.06 5.03
Barclays muni 1–10-Year 1.41 3.25 5.14 4.61 5.44 4.30
Barclays muni 3-Year 0.59 1.88 2.19 2.65 4.04 3.26
*Returns less than one year are not annualized.
Sources: Barclays, Callan Associates Inc., Citigroup, Merrill Lynch
U.S. FIXED INCOME (Continued)

8
Debt Crisis Takes a HolidayNON-U.S. EQUITY | matthew Lai
Shaking off an unsteady second quarter, international markets saw robust gains heading into the final period of 2012. Aggres-sive policy measures across the globe lifted investors’ spirits in nearly every market. such confidence powered Financials (+11.28%) to the top of the pack in developed markets, followed by Health Care (+8.89%).
Emerging markets sectors similarly enjoyed an uplifting third quarter, led by the triumvirate of Health Care (+11.07%), Infor-mation Technology (+11.05%), and Energy (+10.89%). Even as geopolitical tensions erupted in Asia and recessionary flags con-tinued to wave in Europe, the MSCI EAFE Index managed to end up 6.92% after a slow start in July. EAFE Value (+7.46%) handily bested EAFE Growth (+6.38%), continuing a trend from the previous quarter. Growth’s year-to-date lead shrank to just 89 bps, down about 100 bps from the end of June. The euro, yen, and pound gained against the u.s. dollar. The MSCI EM Index (+7.89%) beat EAFE Value, and matched EAFE Small Cap (+7.89%).
EuropeThe debt crisis took a much-needed vacation in the third quar-ter (MSCI Europe Index: +8.70%), thanks in no small part to mario Draghi’s Euro rescue efforts, which boosted market con-fidence in the euro zone. Representing the low end of the Eu-ropean spectrum, Ireland (-1.62%) and Greece (+0.32%) were more than offset by Germany (+13.93%) and Spain (+11.12%). Ahead of the broader market, European Financials (+13.01%) and Information Technology (+11.74%) saw considerable gains. Telecommunication services, one of the top sectors in a dismal second quarter, wrapped up the third quarter at +3.78%.
PacificThe world’s third-largest economy continued to drag on devel-oped Pacific regions, as Japan (-0.84%) was the lone nega-tive country in the MSCI Pacific Index: (+3.73%). (The MSCI
Global Eq Non-U.S. Eq Emg Mkts Small Cap Style Style Style Style 10th Percentile 8.79 8.84 8.86 10.89 25th Percentile 7.66 8.28 8.47 9.62 Median 6.98 7.31 7.95 8.70 75th Percentile 6.31 6.54 7.19 7.58 90th Percentile 5.47 5.91 5.93 5.78 MSCI MSCI MSCI MSCI World EAFE Emg Mkts Small Cap Benchmark 6.71 6.92 7.89 7.89
Sources: Callan Associates Inc., MSCI Inc.
4%
6%
8%
10%
12%
Callan Style Group Quarterly Returns
-40%-30%-20%-10%
0%10%20%30%40%50%60%70%80%
02 0392 93 94 95 96 97 98 99 00 01 04 05 06 07 08 09 10 11 12
*euro returns from 1Q99Source: MSCI Inc.
German markJapanese yen U.K. sterling euro*
Major Currencies’ Cumulative Returns (vs. u.s. Dollar)
Pacific ex-Japan Index logged in at +10.99%.) Disputes with China over an island chain in the East China Sea incited protests in both nations. This ongoing tension has chilled Japanese ex-ports, as China is one of Japan’s largest trading partners. new

9Knowledge. Experience. Integrity.
NON-U.S. EQUITY (Continued)
Zealand (+15.36%) reigned supreme in the Pacific. markets in Australia (+10.47%) did well despite commodity fluctuations.
Developing EconomiesWith Egypt (+22.63%) leading the charge, emerging markets (msCI Em: +7.89%) beat EAFE by 97 bps for the third quar-ter. Emerging markets manufacturing and exports largely slid, though Russia (+9.40%) saw strong demand. Policy makers in India (+15.43%) elected to open up foreign investment in the retail, broadcasting, and airline industries, sending Consumer Discretionary (+22.90%) and Consumer Staples (+22.28%) skyrocketing. China (+4.73%) faltered slightly off its typical performance, as the state-owned Industrial Bank predicted low GDP growth (just +7.4%) and the waning of trade ; exports
were predicted to grow a meager 4.5% and imports to con-tract 1.2%. Despite China and Brazil (+4.77%) promising large infrastructure spending packages, markets remained tepid going into October. Regionally, MSCI EM Latin America In-dex (+4.71%) was the largest drag, while the MSCI Frontier Markets Index (+7.42%) underperformed slightly.
-9%
-6%
-3%
0%
3%
6%
9%
12%
15%
EAFE EM ACWI ex-U.S.
3Q12 YTD
1Q12 2Q12 3Q12 YTD
0% 10% 20% 30% 40% 50% 60% 70% 80%
Poland
India
Egypt
Norway
Germany
NewZealand
Source: MSCI Inc.
Source: MSCI Inc.
15.36%23.52%
13.93%20.64%
13.63%17.40%
22.63%64.88%
15.43%25.36%
25.15%13.19%
10.86%
-7.13%
6.92%
10.08%
14.14%
-8.78%
7.89%
12.33% 11.34%
-7.38%
7.49%
10.86%
EAFE
EM
Macro Market Performance
Top 3 Countries - EAFE and EM
Quarterly Return Attribution for EAFE (u.s. Dollar)
Country Total Local Currency WtgAustralia 10.47% 8.89% 1.45% 8.92%
Austria 7.13% 5.68% 1.38% 0.26%
Belgium 10.04% 8.55% 1.38% 1.15%
Denmark 11.29% 10.08% 1.38% 1.19%
Finland 10.62% 9.12% 1.38% 0.75%
France 7.19% 5.73% 1.38% 9.20%
Germany 13.93% 12.39% 1.38% 8.57%
Greece 0.32% -1.04% 1.38% 0.05%
Hong Kong 12.54% 12.48% 0.05% 3.14%
Ireland -1.62% -2.95% 1.38% 0.27%
Israel 6.15% 6.58% -0.40% 0.60%
Italy 7.48% 6.02% 1.38% 2.21%
Japan -0.84% -3.32% 2.56% 20.06%
netherlands 9.15% 7.67% 1.38% 2.47%
new Zealand 15.36% 11.62% 3.35% 0.13%
norway 13.63% 9.43% 3.84% 0.98%
Portugal 13.01% 11.48% 1.38% 0.17%
Singapore 10.60% 7.17% 3.27% 1.92%
Spain 11.12% 9.62% 1.38% 2.89%
Sweden 10.63% 5.09% 5.27% 3.23%
switzerland 7.77% 7.01% 0.71% 8.61%
u.K. 7.05% 3.98% 2.96% 23.24%
Sources: Russell Investment Group, Standard & Poor’s.

10
Style Median and Index Returns* for Periods ended September 30, 2012
International Equity Quarter 3 Quarters Year 3 Years 5 Years 10 YearsGlobal Style 6.98 13.76 22.51 7.91 -1.91 9.34Non-U.S. Style 7.31 11.78 17.10 4.45 -3.57 9.55Core Style 7.48 11.65 17.29 3.69 -3.80 9.09msCI EAFE–unhedged 6.92 10.08 13.75 2.12 -5.24 8.20
msCI EAFE–Local 4.67 9.10 13.54 1.25 -6.21 4.89msCI EAFE Growth–unhedged 6.38 10.48 14.81 4.32 -4.23 7.82
msCI EAFE value–unhedged 7.46 9.59 12.59 -0.11 -6.33 8.49msCI World–unhedged 6.71 13.01 21.59 7.48 -2.15 8.04
msCI World–Local 5.60 12.41 21.16 6.89 -2.67 6.39msCI AC World ex u.s.–unhedged 7.49 10.86 15.04 3.63 -3.67 10.32
msCI AC World–unhedged 6.97 13.39 21.67 7.78 -1.54 9.16
Pacific Equity Quarter 3 Quarters Year 3 Years 5 Years 10 YearsPacific Basin Style 6.04 13.85 16.04 7.05 -2.55 10.91Japan Style -0.86 1.86 -2.04 0.84 -5.70 4.80Pacific Rim style 10.30 15.60 19.73 7.83 -1.19 15.81
msCI Pacific–unhedged 3.73 8.05 7.73 2.64 -4.04 7.02
msCI Pacific–Local 1.59 8.06 6.15 -2.07 -9.92 2.24
msCI Japan–unhedged -0.84 2.27 -1.68 -0.56 -6.50 3.73
msCI Japan–Local -3.32 3.41 -0.76 -5.11 -13.53 -0.81
Europe Equity Quarter 3 Quarters Year 3 Years 5 Years 10 YearsEurope Style 9.22 14.96 19.68 3.34 -4.25 10.32msCI Europe–unhedged 8.70 11.31 17.31 2.02 -5.72 8.76
msCI Europe–Local 6.46 9.96 18.17 3.45 -3.92 6.43
Emerging Markets Quarter 3 Quarters Year 3 Years 5 Years 10 YearsEmerging Markets Style 7.95 12.15 17.65 6.17 -1.42 18.01msCI Em–unhedged 7.89 12.33 17.33 5.96 -0.98 17.37
msCI Em–Local 6.05 11.41 16.83 6.15 0.27 15.27
International Small Cap Equity Quarter 3 Quarters Year 3 Years 5 Years 10 YearsSmall Cap Style 8.70 16.30 17.73 8.72 -2.55 13.46msCI EAFE small Cap–unhedged 7.89 13.20 12.56 4.75 -2.98 11.24*Returns less than one year are not annualized.Sources: Callan Associates Inc., MSCI Inc.
NON-U.S. EQUITY (Continued)
MSCI Japan
MSCI EAFE Index
MSCI ACWI ex U.S.
MSCI Emer Markets
MSCI Europe Index
MSCI Pacific ex Japan 10.99%
6.92%
8.70%
7.89%
7.49%
-0.84%
Source: MSCI Inc.
Regional Quarterly Performance (u.s. Dollar)Rolling One-year Relative Returns (vs. msCI EAFE u.s. Dollar)
02 0393 94 95 96 97 98 99 00 01-50%-40%-30%
-20%-10%
0%10%20%30%40%50%
04 05 06 07 08 09 10 11 12
MSCI Pacific MSCI EAFEMSCI Europe
Source: MSCI Inc.

11Knowledge. Experience. Integrity.
Whatever It TakesNON-U.S. FIXED INCOME | matthew Routh, CFA
European Central Bank (ECB) President mario Draghi began the third quarter with the bold claim that the bank stood ready to do “whatever it takes” to calm a European debt crisis that had raged for two years. Taking the announcement as a sign the bank would soon begin unlimited purchases of troubled sovereign issues, markets quickly seized upon this apparent lifeline.
Subsequent strong recoveries in peripheral European yields seemingly forced Draghi’s hand, and a bond purchase plan was announced Sept. 6. Global debt markets cheered the news, despite criticism by German Bundesbank President Jens Weidmann, who said that unlimited purchases amount to “state financing via the money press.” For now, though, it seems that global bond investors will gravitate toward whatever measures Europe enacts in an effort to contain the crisis.
0%
1%
2%
3%
4%
5%
6%
7%
8%GermanyU.S. Treasury U.K. Canada Japan
07 08 09 10 11 1206050403
Change in 10-Year Yields from 2Q12 to 3Q12 (bps)
Japan
Canada
U.K.
Germany
U.S. Treasury-1
-14
-1
-1
-6
Source: Citigroup.
10-Year Global Government Bond Yields
Quarterly Return Attribution for Non-U.S. Gov’t Indices (u.s. Dollar)
Country Total Local Currency WtgAustralia 2.57% 1.11% 1.45% 1.50%
Austria 4.78% 3.36% 1.38% 1.69%
Belgium 6.32% 4.88% 1.38% 2.42%
Canada 4.01% 0.39% 3.61% 2.71%
Denmark 2.27% 1.16% 1.10% 0.84%
Finland 3.62% 2.21% 1.38% 0.57%
France 5.03% 3.61% 1.38% 9.30%
Germany 2.68% 1.29% 1.38% 8.47%
Ireland 10.10% 8.61% 1.38% 0.72%
Italy 7.12% 5.67% 1.38% 8.36%
Japan 3.09% 0.52% 2.56% 44.94%
malaysia 4.53% 0.62% 3.89% 0.50%
mexico 6.65% 2.13% 4.42% 0.95%
netherlands 3.86% 2.46% 1.38% 2.51%
norway 3.95% 0.11% 3.84% 0.24%
Poland 7.40% 3.10% 4.18% 0.74%
Singapore 4.00% 0.71% 3.27% 0.38%
Spain 5.20% 3.78% 1.38% 3.88%
Sweden 6.82% 1.47% 5.27% 0.60%
switzerland 1.44% 0.72% 0.71% 0.38%
u.K. 4.10% 1.11% 2.96% 7.70%
Greece was removed in 2Q10. Portugal was removed in 1Q12.
Weights do not sum to 100% because of the Oct. 1, 2012 addition to the Index of South Africa, which comprised 0.46% of the WGBI.
Source: Citigroup
The Citi Non-U.S. World Government Bond Index (+3.98%) was lifted over the course of the third quarter, thanks mostly to positive developments in Europe. Spanish government bonds (+5.20%) were one of the Index’s best performing constituents, as markets rewarded Draghi’s efforts to force down yields. His announcement became a self-fulfilling prophecy for both spain and Italy (+7.12%), despite the fact that none of their bonds will be purchased by the ECB unless they submit to the full bailout package given to other troubled countries like Greece and Portugal.
Global flows sought the safety of German bonds (+2.68%), even as their yields continued to fall. On the opposite side of the globe,

12
NON-U.S. FIXED INCOME (Continued)
Japan rose strongly on a total return basis (+3.09%), due mostly to a yen that keeps appreciating. Flows also lifted Japan’s re-turns, as domestic investors sought shelter from the nation’s worsening economic performance. Australian government is-sues (+2.57%) similarly appreciated as the country’s economy cooled.
Rebounding from a disappointing loss in the second quarter, the J.P. Morgan GBI Emerging Market Composite Index
achieved a 4.57% mark in the third quarter. Emerging markets debt certainly benefited from the developed world’s announce-ment of measures aimed at averting a global economic slow-down. Eastern Europe was rewarded in particular, as hopes rose that their neighbors to the west would be combating their debt crises. Issues of emerging market corporations also ap-preciated during the third quarter, as did the currencies of many emerging countries versus the dollar, which assisted total re-turns for u.s. investors.
Global Fixed Style Non-U.S. Fixed Style 10th Percentile 4.95 6.65 25th Percentile 3.97 4.97 Median 3.54 4.73 75th Percentile 3.20 3.98 90th Percentile 2.55 3.67 Citi World Citi Non-U.S. World Govt Unhedged Govt Unhedged Benchmark 2.99 3.98
Sources: Callan Associates Inc., Citigroup
0%
2%
4%
6%
8%
Callan Style Group Quarterly ReturnsEmerging Spreads Over Developed (By Region)
Style Median and Index Returns* for Periods ended September 30, 2012
Global Fixed Quarter 3 Quarters Year 3 Years 5 Years 10 YearsGlobal Style 3.54 5.70 6.04 5.78 7.25 7.43Citi World Govt–unhedged 2.99 3.41 3.29 4.29 6.45 6.71
Citi World Govt–Local 1.42 3.62 4.32 4.16 4.89 3.89
Non-U.S. Fixed Quarter 3 Quarters Year 3 Years 5 Years 10 YearsNon-U.S. Style 4.73 5.81 5.56 5.4 7.54 8.01Citi non-u.s. World Govt–unhedged 3.98 3.96 3.46 4.02 6.56 7.27
Citi non-u.s. World Govt–Local 1.77 4.50 5.16 3.82 4.55 3.65
European Fixed Quarter 3 Quarters Year 3 Years 5 Years 10 YearsCiti Euro Govt Bond–unhedged 5.03 6.46 2.56 -0.41 3.20 7.36
Citi Euro Govt Bond–Local 3.60 7.42 6.96 3.93 5.30 4.57
Emerging Markets Fixed Quarter 3 Quarters Year 3 Years 5 Years 10 YearsJPm Emerging mkts Bond Plus 6.94 14.33 20.34 12.27 10.27 13.17
JPm Emerging Local mkts Plus 3.14 6.26 5.19 2.46 3.60 8.04
JPm GBI Em Global Composite 4.57 11.22 12.17 9.13 7.73 12.56*Returns less than one year are not annualized. Sources: Callan Associates Inc., Citigroup, JPMorgan Chase & Co.
0 bps
200 bps
400 bps
600 bps
800 bps
1000 bps
1200 bps
08 09 10 11 12
Emerging Americas Emerging EMEA (Europe, Middle East, Africa)
Source: Barclays.
Emerging Asia

13Knowledge. Experience. Integrity.
Properties Continue Their AdvanceREAL ESTATE | Jay nayak
The NCREIF Property Index advanced 2.34% during the third quarter. Income contributed 1.42% and apprecia-tion 0.92%. Leveraged properties within nCREIF advanced 3.20% as income added 1.57% and appreciation 1.63% to the total return. Apartments led property type performance, generating a 2.43% quarterly return. Hotels marginally lagged all other property types after earning 2.14%. Regionally, the West (+2.65%) led and the East (+2.06%) trailed.
On a preliminary basis, nCREIF recorded $5.6 billion in trans-action volume, represented by 139 transactions. The quarterly transaction capitalization rate was 5.48% during the third quar-ter. Official NCREIF Open-End Diversified Core Equity Index returns were unavailable at press time; however, a preliminary query revealed a 2.70% second quarter total return comprised of a 1.39% income return and a 1.31% appreciation return.
Domestic real estate securities, as measured by the FTSE NAREIT Equity REITs Index, remained relatively flat for the quarter, advancing just 0.16%. The Index saw a 0.71% decline in price returns and traded at a 3.53% dividend yield at quar-ter-end. For the three quarters of the year, the Index advanced 15.09%. By property sector Industrial (+5.45%) led, followed by
Residential
Self Storage
Health Care
Retail
Diversified
Industrial/Office
Infrastructure
Lodging/Resorts
Timber 4.58%
2.95%
1.73%
0.71%
-1.65%
-2.68%
-2.69%
-2.82%
-3.66%
*Timber replaced Specialty in 4Q10. Infrastructure was added in 1Q12.Source: NAREIT
NAREIT All Equity Sector Quarterly Performance
Overall Capitalization Rates
Sector 3Q12 2Q12 3Q11Apartment 2.43% 5.10% 5.04%
Industrial 2.32% 5.87% 5.98%
Office 2.32% 5.37% 5.46%
Retail 2.31% 5.86% 6.05%
Rates based on unleveraged, value-weighted, appraisal capitalization data.Source: NCREIF
Shopping Centers (+4.52%). Lodging/Resorts and Apartments lagged, recording -0.21% and -3.94% returns, respectively.
Over $20.7 billion was raised by domestic REITs during the quar-ter, including $11.0 billion of secondary equity offerings, $4.1 bil-lion of preferred equity offerings, and $5.1 billion of unsecured debt offerings. Two primary offerings raised $559 million. Year-to-date totals have eclipsed the $51.3 billion raised in 2011.
Global real estate securities, as measured by the FTSE EPRA/NAREIT Developed REITs Index, advanced 5.51% during the third quarter. Both Europe (+7.29%) and Asia (+12.63%) out-performed their north American counterparts. In China, residen-tial sales activity came in above expectations with an emphasis
Rolling One-Year Returns
-60%
-40%
-20%
0%
20%
40%
60%
80%
100%
120%
REIT Database Global REIT Database*Real Estate Database
02 039594 96 97 98 99 00 01 04 05 06 07 08 09 10 11 12
*Global REIT returns from 2Q04Source: Callan Associates Inc.

14
REAL ESTATE (Continued)
on end-user demand. While some firms have lowered pricing to drive volume, those with higher quality portfolios in better loca-tions have benefited from relatively strong volume and pricing. While leasing demand remains weak in Hong Kong, supply constraints have offered stability.
In London, prior emphasis on office assets has transitioned in favor of residential uses due to strong international demand. Estimates of discounts to net-asset value in continental Europe declined during the quarter as high quality stocks raised capi-tal with favorable economics; however, significant international demand for high quality assets has increased competition to acquire them.
Issues of domestic commercial mortgage-backed securities totaled $12.5 billion during the quarter. Totals reached $30.9 billion year-to-date.
Real Estate REIT Global REIT Database Database Database 10th Percentile 4.43 2.03 8.38 25th Percentile 3.11 1.13 6.15 Median 2.35 0.22 5.74 75th Percentile 1.90 -0.20 5.21 90th Percentile 1.47 -0.47 4.78 NCREIF FTSE NAREIT EPRA/NAREIT Property Equity Developed Benchmark 2.34 0.16 5.51
Sources: Callan Associates Inc., NAREIT, NCREIF, The FTSE Group
-2%
0%
2%
4%
6%
8%
10%
Callan Style Group Quarterly Returns
Style Median and Index Returns* for Periods ended September 30, 2012
Private Real Estate Quarter 3 Quarters Year 3 Years 5 Years 10 YearsReal Estate Database (net of fees) 2.35 7.76 11.08 11.45 -1.00 6.93nCREIF Property** 2.34 7.81 11.00 10.90 2.26 8.35
Public Real Estate Quarter 3 Quarters Year 3 Years 5 Years 10 YearsREIT Database 0.22 15.01 33.35 21.42 3.35 12.79FTsE nAREIT Equity 0.16 15.09 32.61 20.38 2.11 11.39
Global Real Estate Quarter 3 Quarters Year 3 Years 5 Years 10 YearsREIT Global Database 5.74 21.75 31.18 13.35 -1.07 12.96FTsE EPRA/nAREIT Developed 5.51 21.64 30.59 12.92 -2.20 11.77
*Returns less than one year are not annualized.**Represents data available as of publication date.All REIT returns are reported gross in USD. Sources: Callan Associates Inc., NAREIT, NCREIF, The FTSE Group
Quarterly Returns by Property Type
Hotel
Retail
Office
Industrial
Apartments
2.14%
2.31%
2.32%
2.32%
2.43%
Quarterly Returns by Region
2.06%
2.27%
2.31%
2.65%
Source: NCREIF
East
Midwest
South
West
NCREIF All Equity Sector Quarterly Performance

15Knowledge. Experience. Integrity.
Private Equity Performance Database (Pooled Horizon IRRs Through march 31, 2012)
Strategy 3 Months Year 3 Years 5 Years 10 Years 20 YearsAll Venture 3.3 6.4 6.0 1.9 2.7 15.0
All Buyouts 5.0 9.7 13.0 4.2 9.6 10.1
mezzanine 15.1 11.2 7.5 4.7 6.9 8.2
All Private Equity 5.1 9.8 11.7 4.1 8.0 11.0 S&P 500 12.6 8.5 23.4 2.1 4.1 8.6
Private equity returns are net of fees. Source: Thomson ONE
To Your Health PRIVATE EQUITY | Gary Robertson
If “moderation in all things” is the key to good health, the third quarter was a picture of vitality. In fundraising, Private Equity Analyst reported that new third quarter commitments totaled $42.5 billion with 84 new partnerships formed. Dollar volume fell by 24% compared to the second quarter’s $55.8 billion, and the number of funds decreased by 40 (32%) from the second quarter’s 124. Overall, 2012 is 34% ahead in commitments year-over-year. In fact, the third quarter’s dip in fundraising can be viewed as healthy from a supply/demand perspective, as it indicates that discipline and selectivity continue on the part of plan sponsors.
According to Buyouts newsletter, the investment pace by funds into companies totaled 296 control transactions, up from the second quarter’s 218. However, announced dollar volume dropped from $22.2 billion in the second quarter to $14.6 billion in the third, a decline of 34%. Only six deals with announced values of $1 billion or more closed in the third quarter, with the largest being the $1.8 billion acquisition of Party City Holdings by Thomas H. Lee Partners.
According to the national Venture Capital Association, new investments in venture capital companies declined in the third quarter, with $6.5 billion in 890 investments failing to match the levels achieved in the second period ($7.0 billion in 898 investments).
Funds Closed 1/1/12 to 9/30/12
Strategy No. of Funds Amt ($MM) PercentVenture Capital 116 17,453 14%
Buyouts 135 88,391 69%
Subordinated Debt 20 7,919 6%
Distressed Debt 13 6,408 5%
Other 14 5,407 4%
Fund-of-funds 21 2,968 2%
Totals 319 128,546 100%
Source: Private Equity Analyst
Regarding exits, Buyouts reports that 85 private m&A exits of buyout-backed companies occurred in the third quarter, with 34 announcing values totaling $10.3 billion. The number of exits decreased from the second quarter, which had 101 transac-tions. Only two m&A exits topped $1 billion in the third quarter, with the largest being $1.6 billion. The third quarter produced eight buyout-backed IPOs, totaling $1.1 billion. This count was down from nine IPOs in the second quarter.
venture-backed m&A exits in the third quarter totaled 96, of which 30 announced values of $7.6 billion. The figures were up from the second quarter, which saw 29 announced values totaling $5.8 billion.
Please see our upcoming issue of Private Markets Trends for more in-depth coverage.

16
Risk-on AgainHEDGE FUNDS | Jim mcKee
Key central banks pledged to inject low-cost liquidity into uncer-tain markets in the third quarter. To suppress Europe’s nagging sovereign risks, ECB’s mario Draghi promised to defend the euro with “whatever it takes.” The Fed then surprised markets with an uncapped, mortgage-focused version of its quantitative easing. Inspired by this seemingly endless stimulus, equity mar-kets ripped ahead, as the MSCI ACWI gained 6.97%.
Hedge funds participated well in the third quarter drafting behind market tailwinds. The unmanaged Dow Jones Credit Suisse Hedge Fund Index advanced 3.34%. Representing live hedge fund portfolios (net of all fees), the median manager in the Callan Hedge Fund-of-Funds Database gained 2.48%. Fixed Income Arbitrage (+3.95%) was among the best performing strategies within the DJCS HFI. It is heavily invested in the illiquid non-agen-cy RmBs markets, and benefited from the Fed’s support of u.s. housing stock. Propelled by the market surge, the long-biased Emerging Markets manager gained 4.07%, while Distressed ad-vanced 3.65%. Peer group laggards during the quarter were be-ta-hedged strategies, including Equity Market Neutral (+1.41%), Convertible Arbitrage (+1.71%), and Risk Arbitrage (+0.42%).
market exposure notably affected performance within Callan’s Hedge Fund-of-Funds Database. The median Callan Long/Short Equity FoF added 2.85%, while the Callan Absolute Return FoF inched ahead only 2.10%. With diversifying exposures to both non-directional and directional styles, the Core Diversified FoF gained 2.72%.
Style Median and Index Returns* for Periods ended September 30, 2012
Diversified Hedge Fund Strategies Quarter 3 Quarters Year 3 Years 5 Years 10 YearsHedge Fund-of-Funds Database 2.48 4.72 5.00 3.75 0.61 4.88DJCS Hedge Fund Index 3.34 5.61 6.36 5.62 2.33 6.93
DJCS Investable Blue Chip Index 3.07 3.83 3.76 8.52 0.63 3.95
DJCS Subindices Quarter 3 Quarters Year 3 Years 5 Years 10 YearsEquity market neutral 1.41 0.02 2.37 0.81 -7.97 -0.40Convertible Arb 1.71 5.86 7.13 7.73 3.72 5.39
Fixed Income Arb 3.95 8.82 9.93 10.22 3.28 4.14
multi-strategy 3.48 8.23 9.61 7.55 3.09 7.11
Distressed 3.65 8.28 9.05 6.41 1.95 8.80
Risk Arb 0.42 1.01 2.27 2.19 2.76 4.85
Event Driven multi 3.64 6.70 7.37 3.98 2.00 8.04
Long-Short Equity 3.67 5.97 8.09 3.20 1.05 6.89
Short Bias -8.27 -17.56 -24.37 -13.76 -9.38 -8.80
Global macro 3.14 3.28 3.88 8.45 6.68 9.78
managed Futures 1.64 0.12 -4.03 1.64 4.24 4.91
*Returns less than one year are not annualized.Sources: Callan Associates Inc., Credit Suisse Hedge Index LLC
Absolute Return Core Diversified Long-Short Eq FoF Style FoF Style FoF Style 10th Percentile 2.97 3.77 4.53 25th Percentile 2.46 3.17 3.54 Median 2.10 2.72 2.85 75th Percentile 1.35 1.87 2.36 90th Percentile 0.60 1.12 1.66
T-Bills + 5% 1.26 1.26 1.26
Sources: Callan Associates Inc., Merrill Lynch
0%
1%
2%
3%
4%
5%
Callan Style Group Quarterly Returns

17Knowledge. Experience. Integrity.
Exceeding Lowered Expectations U.S. ECONOMY | Jay Kloepfer
Aim low and then exceed expectations. Then all anyone re-members is that you beat your target.
u.s. GDP growth surpassed projections in the third quarter by reaching 2%, which was up from 1.3% in the second quarter. This performance seemed highly unlikely early in the period. First, second quarter GDP figures were revised downward. It became apparent soon after that Business Equipment and Soft-ware, which had been star sectors the last several years, would not make significant contributions in the third quarter. many ob-servers said they expected the economy to deteriorate.
The third-quarter surprise came courtesy of government spending. While 2% growth represents modest (if not subpar) expansion, it can at least be said that for the first time since 2010, government austerity did not drag down the economy. Federal government spending had decreased for eight straight quarters leading up to June 2012—the longest period of decline since the mid-1950s. Federal spending finally jumped (+9.6%) in the third quarter of 2012, fueled by a 13% increase in de-fense spending and a 3% escalation in nondefense outlays.
-15%
-10%
-5%
0%
5%
10%
15%
20%PPI (All Commodities)CPI (All Urban Consumers)
02 0392 93 94 95 96 97 98 99 00 01 04 05 06 07 08 09 10 11 12
Source: Bureau of Labor Statistics
Defense spending is notoriously capricious from one quarter to the next. The third quarter bounce may signify a “catching up” after multiple quarters of decline. As the u.s. approaches a year-end “fiscal cliff,” we may in fact see more front-loading of defense spending before automatic sequestration kicks in. The rise in non-defense outlays may also represent the pulling forward of expenditures in anticipation of mandatory spending reductions in 2013.
Consumer sentiment also shifted in a positive direction. Fueled largely by purchases of durable goods, consumer spending climbed 2% in the third quarter. A significant ongoing survey of American buyers also suggested there is substance be-hind this upturn. The Consumer Sentiment Index is a gauge of consumer confidence published monthly by the university of michigan and Thomson Reuters. since the economic collapse of 2008, the Index has consistently sat in the low 70s, suggest-ing consumers felt America was in a recession. According to the survey, consumer confidence reached a 30-year low in the summer of 2011. This trend finally began to reverse in early 2012, and by September, the Index was headed toward 80.
The job market continues to improve in fits and starts, generat-ing solid gains in the third quarter after greatly disappointing in the second. The unemployment rate finally dropped below 8% in September, though concerns remain that the rate is sup-pressed by a large number of discouraged workers who have simply given up looking for work.
Investments in residential structures were positive once again, rising 14.4% on the heels of an 8.5% gain in the second quar-ter, providing evidence that we may finally be seeing a floor in the housing market. new home sales in September 2012 grew 27% year-over-year, and stand 42% above the record low set in February 2011. The Housing sector is poised to contribute to overall economic growth for the first year since 2005.
Inflation Year-Over-Year

18
U.S. ECONOMY (Continued)
The third-quarter GDP report was not entirely positive, as ex-ports actually fell for the first time since the first quarter of 2009. Exports of Goods fell by 3.5%, which was a sharp reversal of the 7% gain the sector produced in the second quarter. Equip-ment Spending and Software, which led growth for the past several years, generated no growth over the previous quarter.
The improving measures of consumer sentiment stand in con-trast to mounting anxiety in the business sector, where weak global economic growth and confusion over u.s. financial policy amid a tight presidential heat weigh heavily. Sentiment measures and factory orders suggest companies are battening down the hatches in anticipation of a year-end ride over the “fiscal cliff.”
“Fiscal cliff” is the popular shorthand term used to describe the challenge the u.s. government will face at the end of 2012, when terms of the Budget Control Act of 2011 are scheduled to go into effect. Among the laws set to change at midnight on December 31, 2012, are the end of last year’s temporary payroll tax cuts (resulting in a 2% tax increase for workers), the end of certain tax breaks for businesses, the end of the Bush Era tax cuts from 2001-2003, and the beginning of taxes related to President Obama’s health care law. It also refers to
the imposition of automatic spending cuts, which were put into effect in the wake of the failure of the Congressional budget “super committee” to develop a spending plan back in 2011.
unless lawmakers find a solution, it is estimated the impact of going over the fiscal cliff could be a 4-5% drop in GDP over several quarters in 2013. This would certainly derail the cur-rent economic expansion and spur substantial reversals in con-sumer and business sentiment. Observers expect some sort of compromise to be attempted upon completion of the presiden-tial and Congressional elections.
02 0393 94 95 96 97 98 99 00 01 04 05 06 07 08 09 10 11 12-10%
-8%
-6%
-4%
-2%
0%
2%
4%
6%
8%
Source: U.S. Department of Labor
Quarterly Real GDP Growth* (20 Years)
Recent Quarterly Indicators
Economic Indicators (seasonally adjusted) 4Q10 1Q11 2Q11 3Q11 4Q11 1Q12 2Q12 3Q12CPI–All urban Consumers (year-over-year) 1.5% 2.7% 3.6% 3.9% 3.0% 2.7% 1.7% 2.0%
PPI–All Commodities (year-over-year) 6.6% 8.6% 11.1% 10.2% 5.5% 2.5% -1.7% 0.4%
Employment Cost–Total Compensation Growth 2.2% 2.1% 3.2% 1.4% 2.1% 1.7% 2.1% 1.9%
nonfarm Business–Productivity Growth 2.9% -0.6% -0.1% 1.8% 1.2% -0.5% 2.2% 0.6%
GDP Growth* 2.4% 0.1% 2.5% 1.3% 4.1% 2.0% 1.3% 2.0%
manufacturing Capacity utilization (level %) 73.3 74.5 74.4 75.2 76.1 77.6 77.5 77.2
Consumer Sentiment Index (1966=1.000) 0.713 0.731 0.719 0.597 0.648 0.755 0.763 0.750
*The GDP estimates released on October 26, 2012 reflect the results of the comprehensive (or benchmark) revision of the national income and product accounts, according to the Bureau of Economic Analysis (BEA) Web site. More information on the revision is available at www.bea.gov/national/an1.htm.
Sources: Bureau of Economic Analysis, Bureau of Labor Statistics, Federal Reserve, Reuters/University of Michigan
19Knowledge. Experience. Integrity.
Investors Show Renewed Appetite for RiskFUND SPONSOR | Connie Lee, CFA
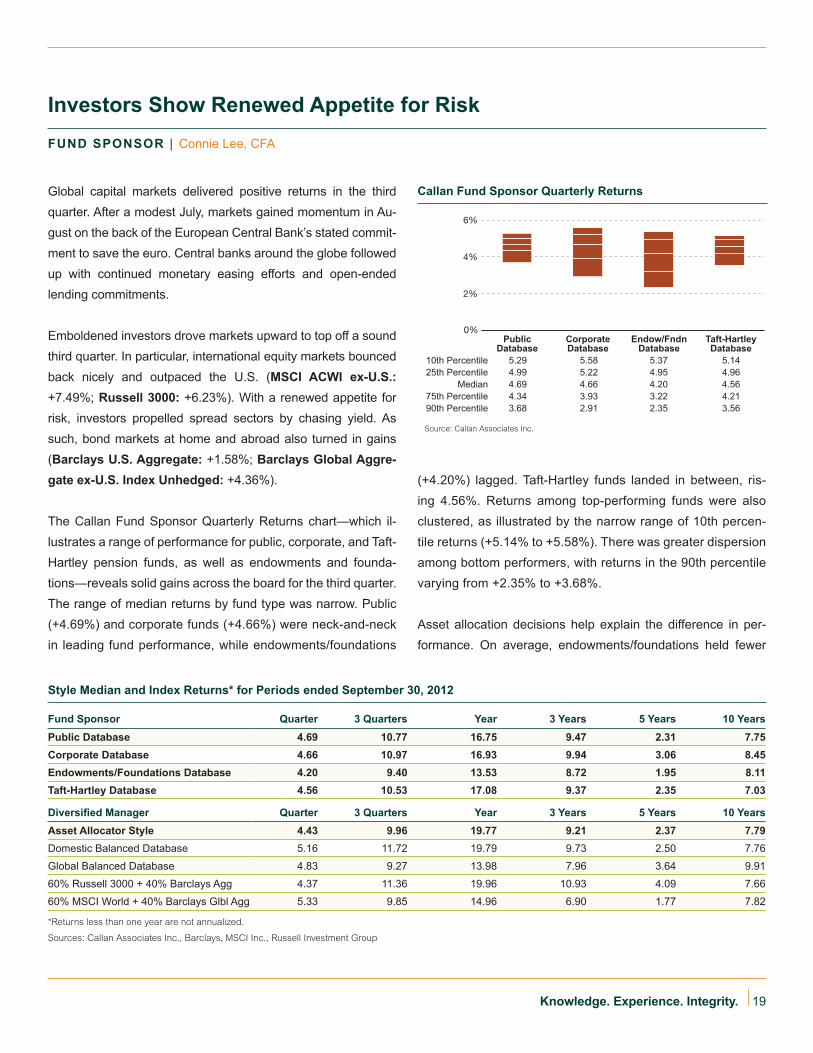
Global capital markets delivered positive returns in the third quarter. After a modest July, markets gained momentum in Au-gust on the back of the European Central Bank’s stated commit-ment to save the euro. Central banks around the globe followed up with continued monetary easing efforts and open-ended lending commitments.
Emboldened investors drove markets upward to top off a sound third quarter. In particular, international equity markets bounced back nicely and outpaced the u.s. (MSCI ACWI ex-U.S.: +7.49%; Russell 3000: +6.23%). With a renewed appetite for risk, investors propelled spread sectors by chasing yield. As such, bond markets at home and abroad also turned in gains (Barclays U.S. Aggregate: +1.58%; Barclays Global Aggre-gate ex-U.S. Index Unhedged: +4.36%).
The Callan Fund sponsor Quarterly Returns chart—which il-lustrates a range of performance for public, corporate, and Taft-Hartley pension funds, as well as endowments and founda-tions—reveals solid gains across the board for the third quarter. The range of median returns by fund type was narrow. Public (+4.69%) and corporate funds (+4.66%) were neck-and-neck in leading fund performance, while endowments/foundations
(+4.20%) lagged. Taft-Hartley funds landed in between, ris-ing 4.56%. Returns among top-performing funds were also clustered, as illustrated by the narrow range of 10th percen-tile returns (+5.14% to +5.58%). There was greater dispersion among bottom performers, with returns in the 90th percentile varying from +2.35% to +3.68%.
Asset allocation decisions help explain the difference in per-formance. On average, endowments/foundations held fewer
Style Median and Index Returns* for Periods ended September 30, 2012
Fund Sponsor Quarter 3 Quarters Year 3 Years 5 Years 10 YearsPublic Database 4.69 10.77 16.75 9.47 2.31 7.75Corporate Database 4.66 10.97 16.93 9.94 3.06 8.45Endowments/Foundations Database 4.20 9.40 13.53 8.72 1.95 8.11Taft-Hartley Database 4.56 10.53 17.08 9.37 2.35 7.03
Diversified Manager Quarter 3 Quarters Year 3 Years 5 Years 10 YearsAsset Allocator Style 4.43 9.96 19.77 9.21 2.37 7.79Domestic Balanced Database 5.16 11.72 19.79 9.73 2.50 7.76
Global Balanced Database 4.83 9.27 13.98 7.96 3.64 9.91
60% Russell 3000 + 40% Barclays Agg 4.37 11.36 19.96 10.93 4.09 7.66
60% msCI World + 40% Barclays Glbl Agg 5.33 9.85 14.96 6.90 1.77 7.82
*Returns less than one year are not annualized.
Sources: Callan Associates Inc., Barclays, MSCI Inc., Russell Investment Group
0%
2%
4%
6%
Public Corporate Endow/Fndn Taft-Hartley Database Database Database Database 10th Percentile 5.29 5.58 5.37 5.14 25th Percentile 4.99 5.22 4.95 4.96 Median 4.69 4.66 4.20 4.56 75th Percentile 4.34 3.93 3.22 4.21 90th Percentile 3.68 2.91 2.35 3.56
Source: Callan Associates Inc.
Callan Fund Sponsor Quarterly Returns

20
FUND SPONSOR (Continued)
assets in public equities (roughly 45%), while the remaining fund types had closer to half of their assets in the stronger-performing asset classes.
In the third quarter, fund sponsors more than recouped sec-ond-quarter losses to post year-to-date results in the 10% range. All fund types boasted double-digit gains for the trailing one-year period, with endowments/foundations notably lag-ging their institutional peers (+13.53%). Looking at a longer time horizon, trailing 10-year returns are also impressive, up between 7% and 8.5%.
Callan’s balanced manager groups generally maintain well-di-versified portfolios and attempt to add value by underweighting or overweighting asset classes, as well as through stock selec-tion. Although foreign equity and bond markets exceeded u.s. results, the median global balanced manager (+4.83%) did not keep pace with its domestic counterpart (+5.16%). Year-to-date, domestic balanced managers landed on top, adding 11.72%. They outpaced their blended 60% Russell 3000/40% Barclays Aggregate benchmark, as well as institutional peers. On the bottom were global balanced managers, who were still able to boast a healthy 9.27% rise for the last three quarters.
*Latest median quarter returnSource: Callan Associates Inc.
U.S. EquityNon-U.S. Equity
U.S. FixedNon-U.S. Fixed
Real EstateAlternative InvestmentsCash
Endowment/Foundation
4.20*
32.0%
13.3%21.6%
0.8%1.4%
29.1%
1.8%
Taft-Hartley4.59*
41.8%
11.4%
35.2%
2.2%5.4%
2.3% 1.6%
Public4.69*
14.8%
1.8%4.0%
6.3% 2.4%
36.4%
34.3%Corporate
4.66*
0.9%1.2%
6.6% 3.0%
35.0%
39.7%
13.7%
Callan Fund Sponsor Average Asset Allocation (as of June 30, 2012)
The size of DC participant balances declined in the second quarter of 20121 by more than 2%, according to the Callan DC Index™. The contraction reflected an average 2.56% market loss, which was marginally offset by 0.47% of contribution in-flows from participants and plan sponsors. Because of a strong first quarter, however, DC participant balances still experienced positive growth (+7.65%) over the first half of the year. notably,
Callan DC IndexDEFINED CONTRIBUTION | Jimmy Veneruso
*Latest quarterly data available.**Performance is gross of fees.
-4%
-2%
0%
2%
4%
6%
Annualized Since Inception (Jan. 2006) 2nd Quarter 2012*
Total DCIndex
Average2030 Fund
Average CorporateDB Plan**
-3.05%
3.14% 2.66%
5.00%
-1.02%
-2.56%
Investment Performance
1 Latest quarterly data available.
21Knowledge. Experience. Integrity.
CALLAN DC INDEX (Continued)
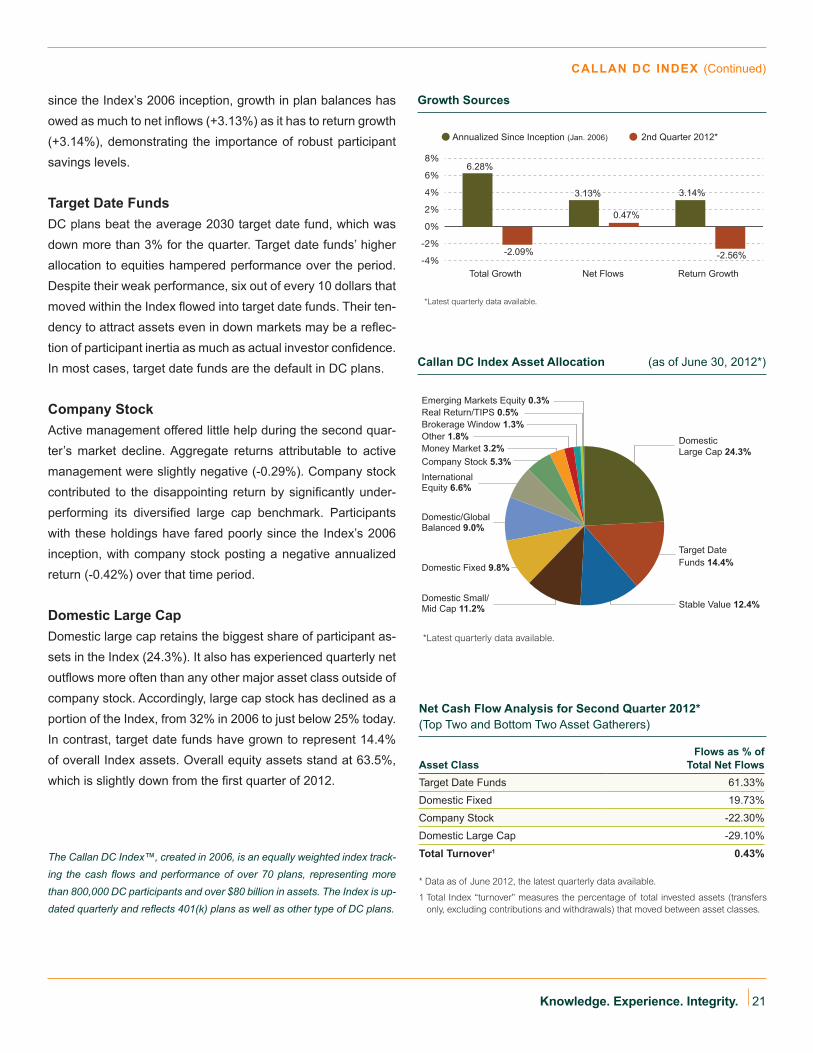
since the Index’s 2006 inception, growth in plan balances has owed as much to net inflows (+3.13%) as it has to return growth (+3.14%), demonstrating the importance of robust participant savings levels.
Target Date FundsDC plans beat the average 2030 target date fund, which was down more than 3% for the quarter. Target date funds’ higher allocation to equities hampered performance over the period. Despite their weak performance, six out of every 10 dollars that moved within the Index flowed into target date funds. Their ten-dency to attract assets even in down markets may be a reflec-tion of participant inertia as much as actual investor confidence. In most cases, target date funds are the default in DC plans.
Company StockActive management offered little help during the second quar-ter’s market decline. Aggregate returns attributable to active management were slightly negative (-0.29%). Company stock contributed to the disappointing return by significantly under-performing its diversified large cap benchmark. Participants with these holdings have fared poorly since the Index’s 2006 inception, with company stock posting a negative annualized return (-0.42%) over that time period.
Domestic Large CapDomestic large cap retains the biggest share of participant as-sets in the Index (24.3%). It also has experienced quarterly net outflows more often than any other major asset class outside of company stock. Accordingly, large cap stock has declined as a portion of the Index, from 32% in 2006 to just below 25% today. In contrast, target date funds have grown to represent 14.4% of overall Index assets. Overall equity assets stand at 63.5%, which is slightly down from the first quarter of 2012.
*Latest quarterly data available.
-4%
-2%
0%
2%
4%
6%
8%
Total Growth Net Flows Return Growth
Annualized Since Inception (Jan. 2006) 2nd Quarter 2012*
6.28%
3.13% 3.14%
-2.56%-2.09%
0.47%
*Latest quarterly data available.
Other 1.8%
Domestic/Global Balanced 9.0%
Target DateFunds 14.4%
DomesticLarge Cap 24.3%
International Equity 6.6%
Stable Value 12.4%
Money Market 3.2%Company Stock 5.3%
Domestic Fixed 9.8%
Domestic Small/ Mid Cap 11.2%
Brokerage Window 1.3%
Emerging Markets Equity 0.3%Real Return/TIPS 0.5%
Growth Sources
Callan DC Index Asset Allocation (as of June 30, 2012*)
Net Cash Flow Analysis for Second Quarter 2012* (Top Two and Bottom Two Asset Gatherers)
Asset ClassFlows as % of
Total Net FlowsTarget Date Funds 61.33%
Domestic Fixed 19.73%
Company Stock -22.30%
Domestic Large Cap -29.10%
Total Turnover1 0.43%
* Data as of June 2012, the latest quarterly data available.
1 Total Index “turnover” measures the percentage of total invested assets (transfers only, excluding contributions and withdrawals) that moved between asset classes.
The Callan DC Index™, created in 2006, is an equally weighted index track-ing the cash flows and performance of over 70 plans, representing more than 800,000 DC participants and over $80 billion in assets. The Index is up-dated quarterly and reflects 401(k) plans as well as other type of DC plans.

22
Steven J. Center, CFA, is a vice president and fixed income investment consultant in Callan’s Global manager Research group. He is respon-sible for research and analysis of fixed income investment managers and assists plan sponsor clients with manager searches.
James Danforth, CFA, is an assistant vice president and a domestic equity investment consultant in Callan’s Global manager Re-search group. He is responsible for research and analysis of domestic equity investment
managers, with whom he regularly meets to better understand their strategies, products, and organizational structures.
Jay Kloepfer is an executive vice president and Director of Capital markets and Alterna-tives Research at Callan. He oversees Callan’s Capital markets, Hedge Fund and Private mar-kets research groups. Jay is author of the “Cal-lan Periodic Table of Investment Returns.”
Matthew Lai is an analyst in Callan’s Global manager Research group. matt’s role within GmR includes the quantitative and qualitative analysis of investment managers, as well as the compilation of detailed research reports for clients and the manager search Committee.
Connie Lee, CFA, is an assistant vice presi-dent and an associate consultant in Callan’s Fund Sponsor Consulting group. She supports consultants in the areas of client service, in-vestment manager reviews, performance mea-
surement, business development, and other special projects.
Authors
Jim McKee is a senior vice president and Director of Callan’s Hedge Fund Research group. Jim specializes in hedge fund research addressing related issues of asset allocation, manager structure, manager search, and
performance evaluation for Callan’s institutional clients.
Jay Nayak is a vice president and consultant in Callan’s Real Assets Consulting group. His role includes the evaluation of managers and their respective real estate products for plan sponsor clients. He also heads research cov-
erage for global real estate securities and commercial real estate debt strategies.
Gary Robertson is a senior vice president and manager of Callan’s Private Equity Research group. Gary is responsible for the firm’s Alter-native Investments consulting services. He is currently secretary of Callan’s Client Policy Review Committee.
Matthew Routh, CFA, is an assistant vice president and a fixed income investment con-sultant in Callan’s Global manager Research group. He is responsible for the research and analysis of fixed income managers. Prior to this
role, matt served as an investment analyst in GmR.
James Veneruso, CFA, is a vice president and defined contribution consultant in Callan’s Fund Sponsor Consulting group. He is respon-sible for providing analytical support to Callan’s defined contribution clients, as well as to con-
sultants, including DC record keeping searches, fee analyses, and the implementation of the record keeping database.

23Knowledge. Experience. Integrity.
Certain information herein has been compiled by Callan and is based on information provided by a variety of sources believed to be reliable for which Callan has not necessarily verified the accuracy or completeness of or updated. This report is for informational pur-poses only and should not be construed as legal or tax advice on any matter. Any investment decision you make on the basis of this report is your sole responsibility. You should consult with legal and tax advisers before applying any of this information to your particular situation. Reference in this report to any product, service or entity should not be construed as a recommendation, approval, affiliation or endorsement of such product, service or entity by Callan. Past performance is no guarantee of future results. This report may consist of statements of opinion, which are made as of the date they are expressed and are not statements of fact. The Callan Investments Institute (the “Institute”) is, and will be, the sole owner and copyright holder of all material prepared or developed by the Institute. No party has the right to reproduce, revise, resell, disseminate externally, disseminate to subsidiaries or parents, or post on internal web sites any part of any material prepared or developed by the Institute, without the Institute’s permission. Institute clients only have the right to utilize such material internally in their business.
The Capital market Review is a quarterly macroeconomic indicator newsletter that provides thoughtful
insights on the economy and recent performance in the equity, fixed income, alternatives, international,
real estate and other capital markets.
Authored by Callan Associates Inc.
If you have any questions or comments, please email [email protected].
Editor-in-Chief – Scott Brown
Performance Data – Alpay Soyoguz, CFA; Adam Mills
Publication Layout – Nicole Silva
About Callan AssociatesFounded in 1973, Callan Associates Inc. is one of the largest independently owned investment consulting
firms in the country. Headquartered in san Francisco, California, the firm provides research, education,
decision support and advice to a broad array of institutional investors through four distinct lines of business:
Fund sponsor Consulting, Independent Adviser Group, Institutional Consulting Group and the Trust Advi-
sory Group. Callan employs more than 170 people and maintains four regional offices located in Denver,
Chicago, Atlanta and Summit, n.J. For more information, visit www.callan.com.
About the Callan Investments InstituteThe Callan Investments Institute, established in 1980, is a source of continuing education for those in
the institutional investment community. The Institute conducts conferences and workshops and provides
published research, surveys and newsletters. The Institute strives to present the most timely and relevant
research and education available so our clients and our associates stay abreast of important trends in the
investments industry.

Corporate Headquarters
Callan Associates101 California Street Suite 3500San Francisco, CA 94111800.227.3288415.974.5060
www.callan.com
Regional Offices
Atlanta800.522.9782
Chicago800.999.3536
Denver855.864.3377
new Jersey800.274.5878