Embed Size (px)
Citation preview

AQR Capital Management, LLC | Two Greenwich Plaza, Third Floor | Greenwich, CT 06830 | T: 203.742.3600 | F: 203.742.3100 | www.aqr.com
AQR C A P I T A L
M A N A G E M E N T
AQR Capital Management, LLC | Two Greenwich Plaza, Third Floor | Greenwich, CT 06830 | T: 203.742.3600 | F: 203.742.3100 | www.aqr.com
AQR C A P I T A L
M A N A G E M E N T
The information set forth herein has been obtained or derived from sources believed by AQR Capital Management, LLC (“AQR”) to be reliable. However, AQR does not make any representation or warranty,
express or implied, as to the information’s accuracy or completeness, nor does AQR recommend that the attached information serve as the basis of any investment decision. This document has been provided to
you solely for information purposes and does not constitute an offer or solicitation of an offer, or any advice or recommendation, to purchase any securities or other financial instruments, and may not be
construed as such. This document is intended exclusively for the use of the person to whom it has been delivered by AQR Capital Management, LLC, and it is not to be reproduced or redistributed to any other
person. This document is subject to further review and revision. AQR hereby disclaims any duty to provide any updates or changes to the analyses contained in this presentation.
Thinking Outside Asset Classes: Style Premia
Antti Ilmanen
AQR Capital Management
Fiduciary Investors Symposium
22 October 2012

AQR C A P I T A L
M A N A G E M E N TAQR C A P I T A L
M A N A G E M E N T2
Most Portfolio Allocations Are Highly Directional... C
orr
ela
tio
n t
o M
SC
I W
orld
Rolling 36-Month Correlation to Global Equities
*For illustration purposes only and based on AQR backtest. Please see important risk disclosures in the Appendix.
The Global 60/40 portfolio consists of the MSCI World Index and the Barclays Global Aggregate Index (Hedged to USD). The Endowment Proxy consists of S&P 500 (8%), MSCI ACWI ex-US (7%), MSCI
EMG (5%), BarCap Global Agg hedged to USD (11%) , BarCap Global HY hedged to USD (4%), HFR (26%) as absolute return proxy, Russell 2500 Value as PE proxy (17%) and FTSE EPRA/NAREIT and
S&P GSCI (11% each) as two real asset proxies. The Hedge Fund Index is the HFR fund-weighted index. Chart above shows 36-month rolling correlations.
GET ME
OUTTA
HERE!
Concentrated risk makes many portfolios inefficient: One return source – equity
market direction – often explains >90% of portfolio fluctuations
0.0
0.1
0.2
0.3
0.4
0.5
0.6
0.7
0.8
0.9
1.0
1992 1994 1996 1998 2000 2002 2004 2006 2008 2010
Global 60/40
Endowment Proxy
Hedge Fund Index

AQR C A P I T A L
M A N A G E M E N TAQR C A P I T A L
M A N A G E M E N T
...And Typical Diversification Has Not Worked Well
Alternative assets have not helped much to diversify away the directionality of 60/40
3
Sources: The 60/40 portfolio consists of 60% MSCI World (developed equity markets) index, 40% Barclays Global Aggregate fixed-income index, currency-hedged to USD.
The Alternatives-4 is a composite of hedge funds (DJ CS index), commodity futures (SP GSCI index), direct real estate (NCREIF transaction-based index), and private equity
(Cambridge Associates private equity index). Diversification does not eliminate the risk of experiencing investment losses.
Quarterly Returns of 60/40 and Alternative Assets, 1997-2012

AQR C A P I T A L
M A N A G E M E N TAQR C A P I T A L
M A N A G E M E N T4
Looking Beyond Asset Classes: Complementary Perspectives
The Cube: Asset Class, Strategy Style and
Risk Factor Perspectives to Investing
Many Institutional Portfolios
Imply a Lopsided Cube

AQR C A P I T A L
M A N A G E M E N TAQR C A P I T A L
M A N A G E M E N T
Alpha
Alternative Beta Premia
(Hedge fund risk premia
and style premia)
Market Risk Premia
(long-only asset class exposures)
5
AQR Pyramid of Return Sources: Harvest All !
• Highest Cost (“2 and 20”)
• Lowest Capacity
• Moderate Cost
• Medium Capacity
• Lowest Cost (Index Funds)
• Highest Capacity

AQR C A P I T A L
M A N A G E M E N TAQR C A P I T A L
M A N A G E M E N T
Focus on Alternative Beta Premia
Alternative beta premia (or alternative risk premia, exotic betas, smart betas,...) are
systematic returns harvested through dynamic long-short strategies in liquid asset classes
• Potential to enhance returns and diversify portfolios
• Enables very low correlations with equity market direction and across strategy premia
Can be classified in different ways:

AQR C A P I T A L
M A N A G E M E N TAQR C A P I T A L
M A N A G E M E N T
* Strategies are subject to change at any time without notice. Please see important disclosures in Appendix.
Hedge Fund Risk Premia Universe
Equity Oriented Strategies
Seek to take advantage of market inefficiencies
that cause specific stocks to be under- or over-
priced.
Arbitrage Strategies
Seek to capture relative mispricing between
two related assets.
Macro Strategies
Profit from dislocations in global equity, bond,
currency and commodity markets, including
those driven by investors’ behavioral biases.
EQUITY STRATEGIESMACRO STRATEGIES
ARBITRAGE STRATEGIES
- Dedicated Short Bias
- Equity Market Neutral
- Long/Short Equity
- Emerging Markets (Equity)
- Global Macro
- Managed Futures
- Emerging Markets (Macro)
- Convertible Arbitrage
- Event Driven
- Fixed Income Relative Value
EQUITY STRATEGIESMACRO STRATEGIES
ARBITRAGE STRATEGIES
- Dedicated Short Bias
- Equity Market Neutral
- Long/Short Equity
- Emerging Markets (Equity)
- Global Macro
- Managed Futures
- Emerging Markets (Macro)
- Convertible Arbitrage
- Event Driven
- Fixed Income Relative Value
Event
Driven
Fixed Income
Relative Value
Equity
Market
Neutral
Dedicated
Short Bias
Global
Macro
Emerging
Markets
Convertible
Arbitrage
Long/Short
Equity
Managed
Futures
7

AQR C A P I T A L
M A N A G E M E N TAQR C A P I T A L
M A N A G E M E N T8
Is Alpha Just Beta Waiting To Be Discovered?
ALPHA
ALPHA
HEDGE FUND
RISK PREMIA
OTHER MARKET
RISK PREMIA
EQUITY
RISK PREMIUM
ALPHA
EQUITY
RISK PREMIUM
Time
ALPHA
OTHER MARKET
RISK PREMIA
EQUITY
RISK PREMIUM
Prior to Cap-Weighted
Equity Indices
– Returns viewed as alpha
Equity Risk
Premium introduced
Examples:
– S&P 500 Index
– MSCI World
Other Market Risk
Premia introduced
Examples:
– BarCap Aggregate
– Commodity Indices
– Real Estate
Hedge Fund Risk
Premia introduced
Examples:
– Merger Arbitrage
– Convertible Arbitrage
- Trend Following
Hedge Fund Risk Premia capture the fundamental insights of a class of hedge fund strategies – along with a
meaningful portion of the expected returns those strategies earn – using a dynamic but clearly-defined trading process

AQR C A P I T A L
M A N A G E M E N TAQR C A P I T A L
M A N A G E M E N T
HF indices suggest that the industry has earned significantly positive alpha, despite the large
market directional exposure. For example, the DJCS HF index outperformed cash by 0.44%
per month (5.3% p.a.) since 1994 and earned equity market alpha of 0.32% (3.9% p.a.).
Hedge Funds Contain Much Beta Exposure
Source: AQR, Dow Jones Credit Suisse. Data from January 1994 through June 2012.
Equity
exc. return
80%
60%
50%
40%
30%
20%
10%
0%
R˄
2
Explanatory Power (R˄2) of Factor Models on DJCS HF Index
1994-2012H1
Equity
exc. return
+ 3 other
market premia
+ 3 other
market premia
+ 9 hedge fund
risk premia
+ 9 hedge fund
risk premia
5.0%
4.0%
3.0%
2.0%
1.0%
0.0%
-1.0%
-2.0%
Alp
ha
(p
.a.)
Annualized Alpha in Factor Models on DJCS HF Index
1994-2012H1
+ 2 lags of EQ + 2 lags of EQ
The main risk by far is equity market beta, but looking beyond the one-factor alpha, one
can explain HF index returns further and reduce the measured alpha.
The broadest regression shows significant exposures to market factors, lagged equity
returns and several HF risk premia. Negative alpha may reflect fees (as factors do not
include fees).
9
Broadest regress ion Coefficient t Stat
ALPHA -0.13% 1.32-
EQUITY 0.30 4.74
EQ lag1 0.14 3.91
EQ lag2 0.08 2.13
CREDIT 0.08 1.71
INFLATION 0.10 3.00
NOM GOVT 0.11 2.89
Convertible Arb 0.10 3.32
Eq Mkt Neutral 0.04- 1.02-
L/S Equity 0.23 5.60
Ded Short Bias 0.03 1.15
Event Driven 0.00 0.00
Managed Futures 0.09 2.52
Emg Markets 0.06 1.39
FI Rel Val 0.08 1.99
Global Macro 0.03 0.61
70%

AQR C A P I T A L
M A N A G E M E N TAQR C A P I T A L
M A N A G E M E N T10
Style Premia – Sorting the Wheat From the Chaff
Introducing “The Big-4“ styles with the most consistent long-run rewards:
• Value – long cheap assets / short expensive ones
• Carry – long high-yielding assets / short low-yielders
• Momentum/Trend – long recent winners / short laggards
• Defensive – long low-risk assets / short high-risk ones
Diversification does not eliminate the risk of investment losses.
In long-only context, styles are deviations from market-weighted benchmarks based on
certain characteristics or risk exposures.
Long-short style factors are one useful perspective on alternative beta premia. To be
most effective, style/factor diversification requires leverage and shorting.
But which styles?

AQR C A P I T A L
M A N A G E M E N TAQR C A P I T A L
M A N A G E M E N T11
Styles With the Most Pervasive Success
ffffffff
ffffffff
ffffffff
ffffffff
ffffffff
ffffffff
ffffffff
ffffffff
ffffffff
ffffffff
ffffffff
ffffffff
ffffffff
ffffffff
ffffffff
ffffffff
fffff
Sources: Asness etal. (2011), Frazzini-Pedersen (2011), Ilmanen (2011), Moskowitz etal. (2011). Sample periods from 1972/75 to 2009/11.
For Each of These Styles, Assets with ‘High’ Characteristics Have
Outperformed Peers With ‘Low’ Charactersitics in Diverse Contexts
ffffffff
ffffffff
ffffffff
ffffffff
ffffffff
ffffffff
ffffffff
ffffffff
ffffffff
ffffffff
ffffffff
ffffffff
ffffffff
ffffffff
ffffffff
ffffffff
fffff
0.0
0.2
0.4
0.6
0.8
1.0
1.2
1.4
Value Momentum Defensive Carry
Sh
arp
e R
ati
o (
19
72
/75-2
00
9/1
1)
Top Assets by Style Bottom Assets by Style
Across Stocks
Value Momentum Defensive Carry Trend
Across Asset Classes

AQR C A P I T A L
M A N A G E M E N TAQR C A P I T A L
M A N A G E M E N T12
Value Style: Buy Cheap Assets
Historically, value stocks (with low multiples) have outperformed the market and
growth stocks (with high multiples) over decades in all markets studied
Value also works in country/sector selection and in other asset classes
Both behavioral and risk-based explanations; both may contribute
100
1,000
10,000
Log scale
(Jan '7
5=
1000)
US Non-US
Value-vs-Growth Cumulative Outperformance
1926-2009 (US) / 1975-2009 (non-US)
Source: Kenneth French’s website. For U.S. stocks (blue line since 1926, “US”), value (growth) stocks are defined by high (low)
book-to-market ratios. For the international stocks (green line since 1975, “nonUS” or 20 other countries), value and growth stocks
are defined by a composite of four valuation ratios (book-to-market, earnings-to-price, dividend-to-price, cash flow-to-price).

AQR C A P I T A L
M A N A G E M E N TAQR C A P I T A L
M A N A G E M E N T
Carry Style: Buy High-Yielders
In the long run, carry-seeking works in virtually every asset class or context studied
Below FX&FI; also works for stocks (dividend yields), commodities (backwardation), etc.
Certain carry strategies are highly risky; rare large losses concentrate in “bad times”
13
Cumulative Excess Returns of Carry-Seeking
Strategies in Four Asset Contexts, 1993-2009
Sources: Ilmanen (2011), Bloomberg, Barclays Capital, Citigroup, J.P.Morgan
0
100
200
300
400
500
600
700
FX G10 FX Emg FI G10 Credits
AQR C A P I T A L
M A N A G E M E N TAQR C A P I T A L
M A N A G E M E N T
Trend/Momentum Style: Buy Recent Winners
Trend following has delivered positive long-run returns in most assets simulated
• Chasing past-year returns has added value, while chasing multi-year returns hurts
• Trend strategies are directional while ‘cousin‘ momentum strategies are cross-sectional
14
Source: Ilmanen (2011), Bloomberg.
0
100
200
300
400
500
600
Cmdty Futures Equity Indices Bond/Rate Futures Foreign Exchange
Cumulative Excess Returns of 12-Month Trend-Following
Strategies in Four Asset Contexts, 1993-2009

AQR C A P I T A L
M A N A G E M E N TAQR C A P I T A L
M A N A G E M E N T
Detour: Trend-Following As Empirical Safe Haven ?
15
Net Returns of a Trend-Following Composite
Source: Hurst-Ooi-Pedersen (2012). Composite strategy is based on a simple average of 1/3/12-month trends and diversification
across a large number of liquid investments weighted by volatility. (Returns on cash proxies are used before futures were available.)
The main puzzle is not the strong paper returns of trend-following strategies but reconciling them
with the surprisingly consistent risk-reducing characteristics.
Ilmanen (2011) showed that a trend-following composite was profitable in 13 of the 15 worst
months for global equities over 25 years.
A new study by Hurst-Ooi-Pedersen (2012) shows below that a trend-following composite made
money in 9 of the 10 worst drawdowns for the U.S. 60/40 portfolio over 110 years.
-80%
-60%
-40%
-20%
0%
20%
40%
60%
80%
100%
120%
Total Returns of a U.S. 60/40 Portfolio and a Trend-Following Composite in the Ten Worst Drawdowns for 60/40, Simulated Data 1903-2012
60/40 Portfolio Returns
AQR C A P I T A L
M A N A G E M E N TAQR C A P I T A L
M A N A G E M E N T
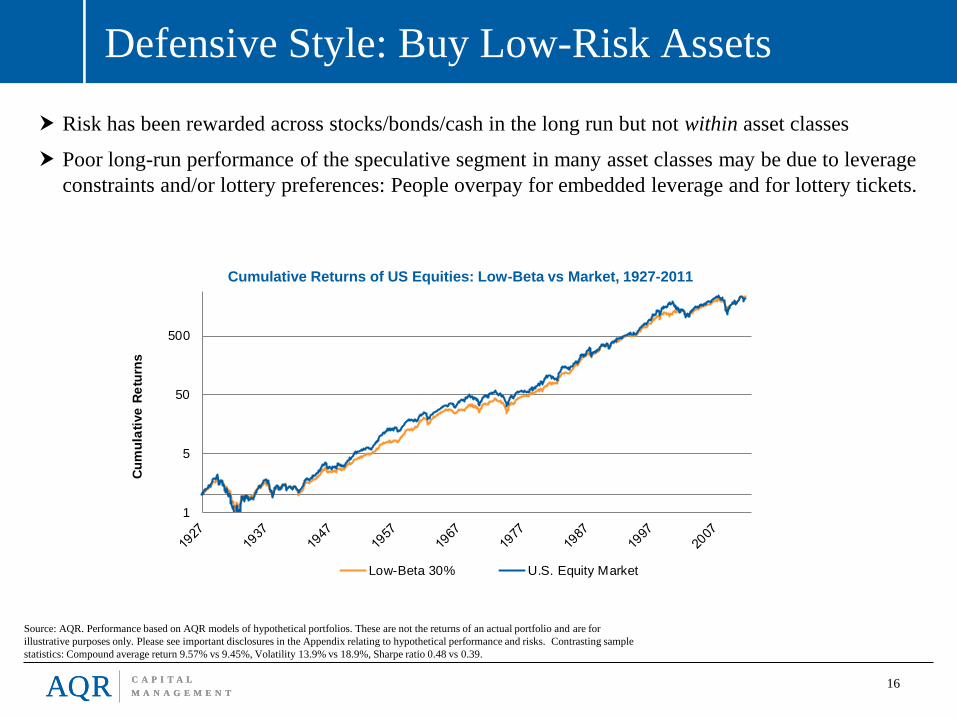
Defensive Style: Buy Low-Risk Assets
16
Risk has been rewarded across stocks/bonds/cash in the long run but not within asset classes
Poor long-run performance of the speculative segment in many asset classes may be due to leverage
constraints and/or lottery preferences: People overpay for embedded leverage and for lottery tickets.
Cumulative Returns of US Equities: Low-Beta vs Market, 1927-2011
Source: AQR. Performance based on AQR models of hypothetical portfolios. These are not the returns of an actual portfolio and are for
illustrative purposes only. Please see important disclosures in the Appendix relating to hypothetical performance and risks. Contrasting sample
statistics: Compound average return 9.57% vs 9.45%, Volatility 13.9% vs 18.9%, Sharpe ratio 0.48 vs 0.39.
1
5
50
500
Cu
mu
lati
ve
Re
turn
s
Low-Beta 30% U.S. Equity Market

AQR C A P I T A L
M A N A G E M E N TAQR C A P I T A L
M A N A G E M E N T
‘Big-4’ Long-Short Style Premia: Ubiquitous
17
Source: AQR Capital Management. Simulated trading strategies gross of trading costs
and fees. For illustrative purposes only. The returns above do not represent the return of
an actual fund or AQR product.
Bet Against Beta Style: Sharpe Ratio Across Contexts, 1960s/90s-2009
Source: Frazzini-Pedersen (2010) BAB Factor SRs – All Asset Classes 1964-2009. Annualized Sharpe
ratios of BAB factors, where BAB is a portfolio short (de-leveraged) high beta assets and long (levered)
low beta assets.
Sh
arp
e R
ati
os
Sh
arp
e R
ati
os
Sh
arp
e R
ati
os
Sh
arp
e R
ati
os

AQR C A P I T A L
M A N A G E M E N TAQR C A P I T A L
M A N A G E M E N T
Multi-Strategy Approach Is More Robust
18
We prefer a multi-strategy approach over single-strategy approaches. The former provides better
diversification (higher Sharpe ratio), reduces trading costs via netting, and induces less return chasing
(which often hurts investors)
Craftmanship in implementation (cost-effective harvesting) is essential when rely heavily on breadth
Temptation To Chase Returns: Rolling 3-Year Excess Return of a Simple Stock
Selection Portfolio in the U.S. (Simulated Value and Momentum), 1956-2011
Source: AQR.
-10%
-5%
0%
5%
10%
15%
20%
1956 1959 1962 1965 1968 1971 1974 1977 1980 1983 1986 1989 1992 1995 1998 2001 2004 2007 2010
Hyp
oth
eti
ca
l A
nn
ua
l R
etu
rn
(Ro
llin
g 3
-ye
ar)
Add More!
Add More! Add More!
Add More!
Add More!
I'm Out!
I'm Out! I'm Out!
I'm Out! I'm Out!

AQR C A P I T A L
M A N A G E M E N TAQR C A P I T A L
M A N A G E M E N T19
Style Diversification: Exceptionally Effective
Style diversification can be more effective than asset class diversification – as long as shorting is
allowed to avoid concentrated market-directional risk (and leverage to monetize volatility reduction)
In long-short, can fully benefit from low/negative correlations between styles and vs equity markets,
resulting in significant volatility reduction and Sharpe ratio boost
0.0
0.2
0.4
0.6
0.8
1.0
1.2
1.4
1.6
Mkt, Value, Momentum (Long-only) Mkt, Value, Momentum (Long-Short)
Sharp
e R
atio
Average SR among 3 constituents Portfolio SR (Equal-vol-wtd composite)
Source: Monthly data 1973-2010 from Asness-Moskowitz-Pedersen (2011). Diversification does not eliminate the risk of experiencing investment losses.
Diversification Benefits From Combining Global Market, Value, and
Momentum Portfolios – More Effective Long-Short Than Long-Only
1973-2010

AQR C A P I T A L
M A N A G E M E N TAQR C A P I T A L
M A N A G E M E N T20
Why Are Alternative Betas Underutilized?
Style investing may help in both return enhancement and portfolio diversification, yet it
is only modestly utilized in most institutional portfolios. Why?
• Uncertainty: lack of conviction about sustainability
• Unconventionality – recall Keynes
• Aversion to the three dirty words in finance: Leverage, Shorting, Derivatives
• Capacity concerns – especially for ‘Giants‘
On the flipside, the same reasons explain why most investors continue to accept the
risk concentration implied in their over-reliance on the equity premium: best
conviction from theory and history; embedded leverage; high capacity; and
conventionality.
CAPM 2:1
Debt : Equity
Capacity
Everyone‘s
Doing It...

AQR C A P I T A L
M A N A G E M E N TAQR C A P I T A L
M A N A G E M E N T
Buffett: A Successful Investor in Several Risk Premia
Extraordinary track record
What risk premia does Buffett exploit?
• Market risk premium
• Value
• Betting against beta:
• Buying low risk / high quality
• Using leverage
• Shorting options
Decomposing Buffett:
• Can the Buffett strategy be done in a systematic way?
Lessons from Buffett
• Systematic harvesting of these premia can even explain this great investor (with hindsight)
• Careful use of leverage
• Importance of the ability to stick with it
21
AQR C A P I T A L
M A N A G E M E N TAQR C A P I T A L
M A N A G E M E N T
Summary on Style Investing
Long-short style investing can enhance portfolio returns and diversification.
Long-only style tilts mainly boost returns, with less impact on diversification.
Four styles with the most consistent long-run performance across contexts:
Value
Momentum
Carry
Defensive
Diversifying across styles and volatility targeting improve style portfolios.
Further, a multi-strategy approach promotes patience over return chasing.
Implementation efficiency is essential when harvesting style premia
Underutilized. Why? Uncertainty, unconventionality, ‘LSD‘ aversion, capacity
22

AQR C A P I T A L
M A N A G E M E N TAQR C A P I T A L
M A N A G E M E N T23
Disclosures
The information set forth herein has been obtained or derived from sources believed by AQR Capital Management, LLC (“AQR”) to be reliable. However,
AQR does not make any representation or warranty, express or implied, as to the information’s accuracy or completeness, nor does AQR recommend that the
attached information serve as the basis of any investment decision. This document has been provided to you in response to an unsolicited specific request and
does not constitute an offer or solicitation of an offer, or any advice or recommendation, to purchase any securities or other financial instruments, and may not
be construed as such. This document is intended exclusively for the use of the person to whom it has been delivered by AQR Capital Management, LLC, and
it is not to be reproduced or redistributed to any other person. This document is subject to further review and revision. For one-on-one presentation use
only.
Hypothetical performance results (e.g., quantitative backtests) have many inherent limitations, some of which, but not all, are described herein. No
representation is being made that any fund or account will or is likely to achieve profits or losses similar to those shown herein. In fact, there are frequently
sharp differences between hypothetical performance results and the actual results subsequently realized by any particular trading program. One of the
limitations of hypothetical performance results is that they are generally prepared with the benefit of hindsight. In addition, hypothetical trading does not
involve financial risk, and no hypothetical trading record can completely account for the impact of financial risk in actual trading. For example, the ability to
withstand losses or adhere to a particular trading program in spite of trading losses are material points which can adversely affect actual trading results. The
hypothetical performance results contained herein represent the application of the quantitative models as currently in effect on the date first written above and
there can be no assurance that the models will remain the same in the future or that an application of the current models in the future will produce similar
results because the relevant market and economic conditions that prevailed during the hypothetical performance period will not necessarily recur. There are
numerous other factors related to the markets in general or to the implementation of any specific trading program which cannot be fully accounted for in the
preparation of hypothetical performance results, all of which can adversely affect actual trading results. Discounting factors may be applied to reduce
suspected anomalies. This backtest’s return, for this period, may vary depending on the date it is run.
There is a risk of substantial loss associated with trading commodities, futures, options, derivatives and other financial instruments. Before trading, investors
should carefully consider their financial position and risk tolerance to determine if the proposed trading style is appropriate. Investors should realize that when
trading futures, commodities, options, derivatives and other financial instruments one could lose the full balance of their account. It is also possible to lose
more than the initial deposit when trading derivatives or using leverage. All funds committed to such a trading strategy should be purely risk capital.