Embed Size (px)
Citation preview
Thinking Critically With Psychological Science
Research
Everyday Sources of Knowledge
• Common sense• Authority• Reasoning• Unsystematic observation• Scientific method
Scientific Method
• Set of orderly steps used to analyze and solve problems
• Objectively collected information• Empirical evidence – observations of publicly
(confirmable) observable behavior• Operational definitions – use operations of
measurement to describe observations
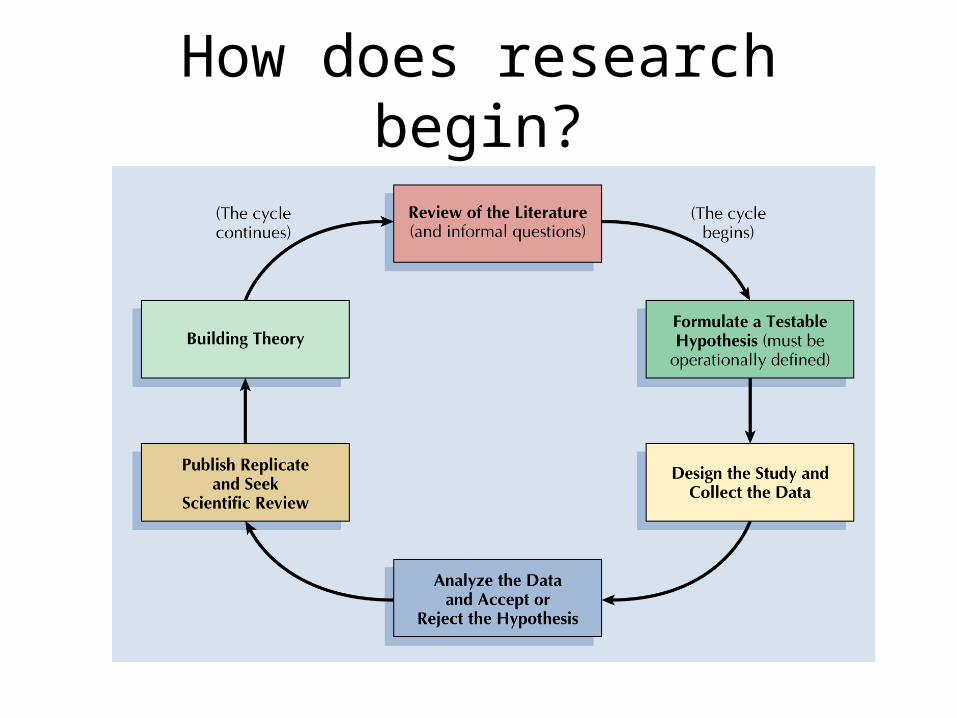
How does research begin?
Research Steps
• Steps– Identify questions of interest– Formulating an explanation
• Theory: broad explanation• Hypothesis: prediction stated in a way that it can be
tested
– Carrying out research designed to support or refute
Who participates in the study?
• Sample
– Representative of larger group or population of interest
– Small group of humans or animals
– Unrepresentative sample – misleading or biased test of hypothesis
• Replication of research removes most doubt
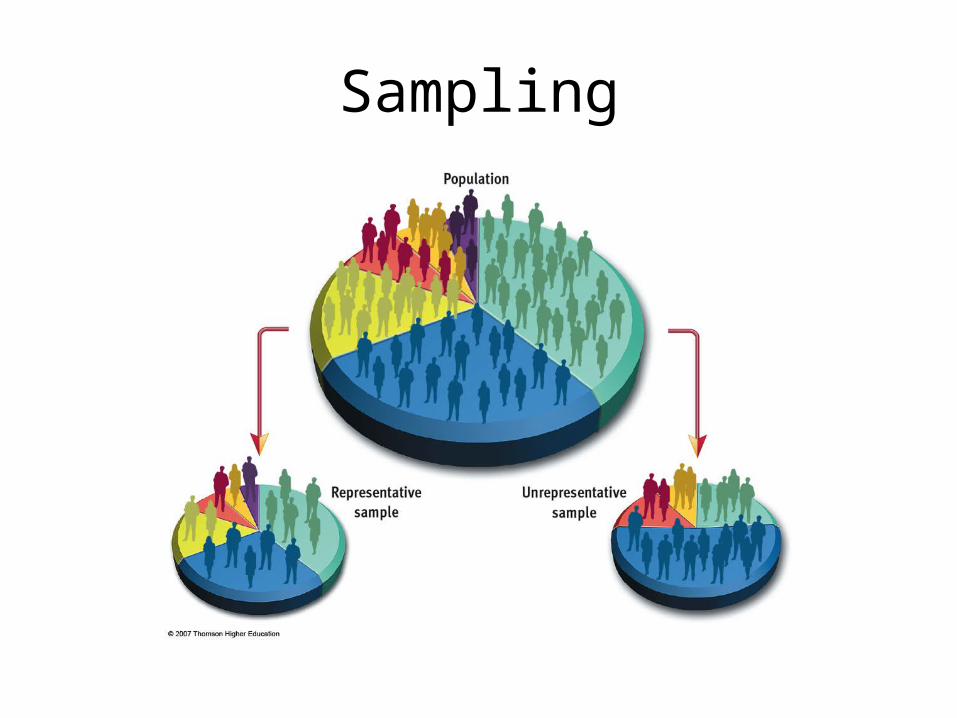
Sampling
How do psychologists observe and describe behavior?
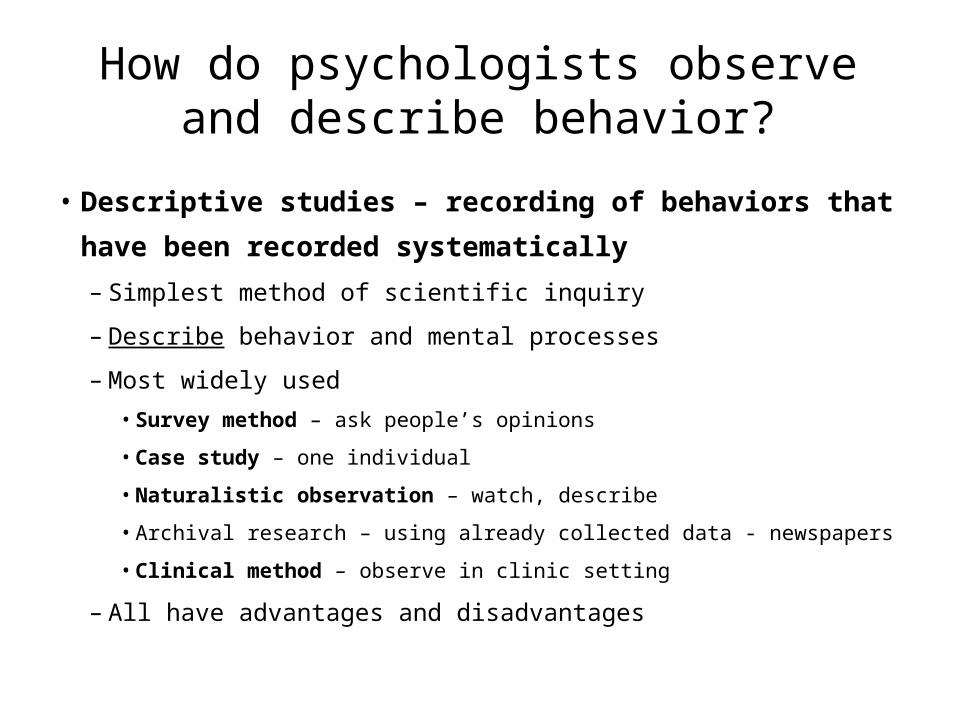
• Descriptive studies – recording of behaviors that have been
recorded systematically
– Simplest method of scientific inquiry
– Describe behavior and mental processes
– Most widely used
• Survey method – ask people’s opinions
• Case study – one individual
• Naturalistic observation – watch, describe
• Archival research – using already collected data - newspapers
• Clinical method – observe in clinic setting
– All have advantages and disadvantages
What type of research study?
How do psychologists observe and describe behavior?
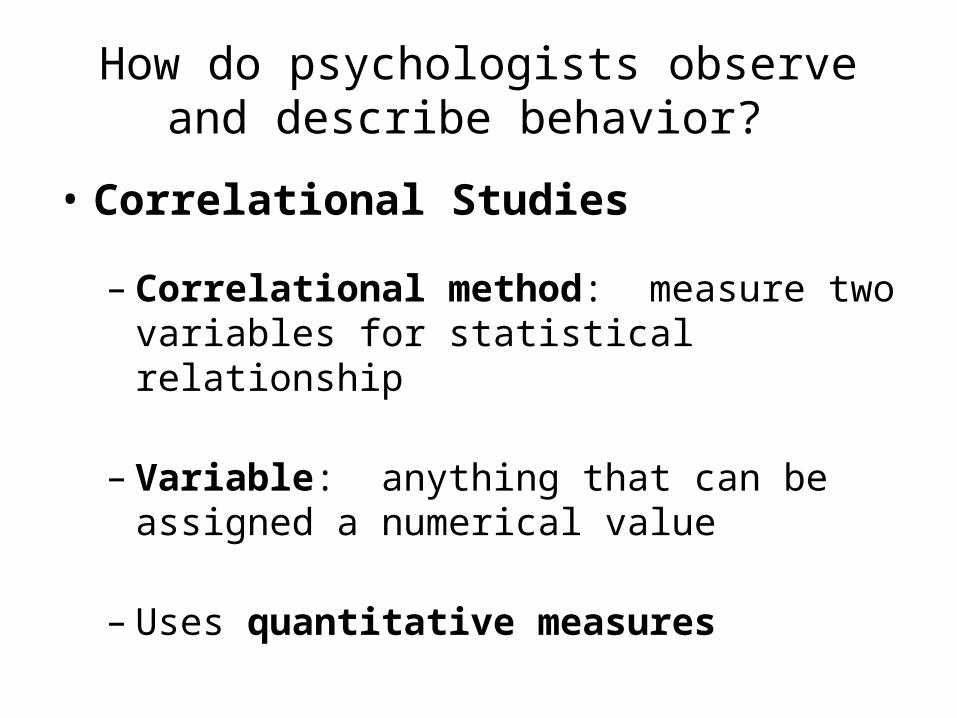
• Correlational Studies
– Correlational method: measure two variables for statistical relationship
– Variable: anything that can be assigned a numerical value
– Uses quantitative measures
Correlational Research• Correlational Studies
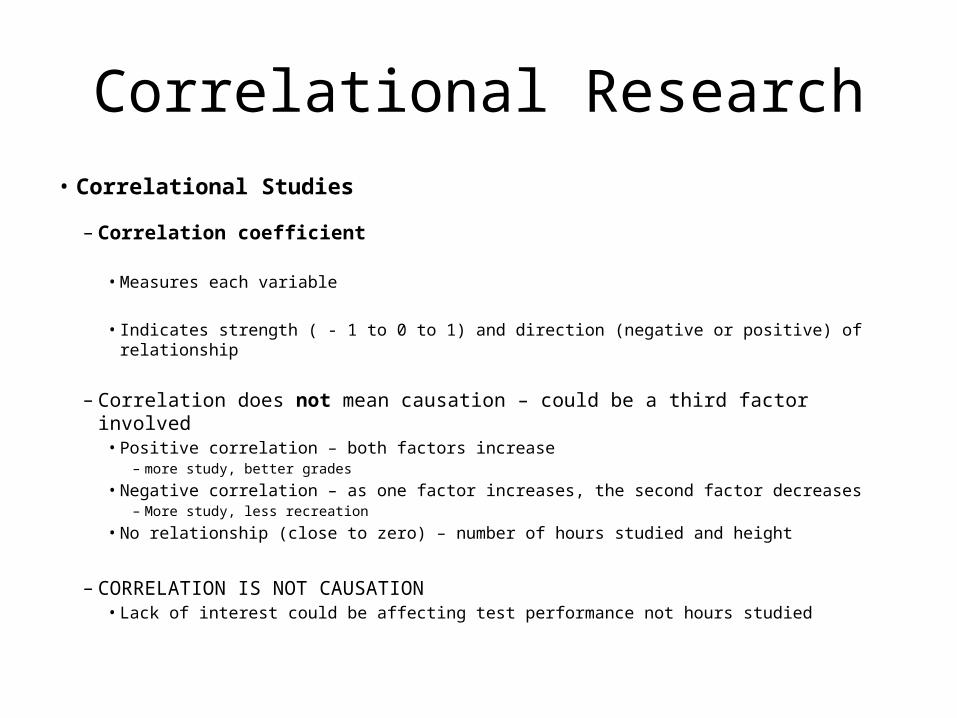
– Correlation coefficient
• Measures each variable
• Indicates strength ( - 1 to 0 to 1) and direction (negative or positive) of relationship
– Correlation does not mean causation – could be a third factor involved• Positive correlation – both factors increase
– more study, better grades
• Negative correlation – as one factor increases, the second factor decreases– More study, less recreation
• No relationship (close to zero) – number of hours studied and height
– CORRELATION IS NOT CAUSATION• Lack of interest could be affecting test performance not hours studied
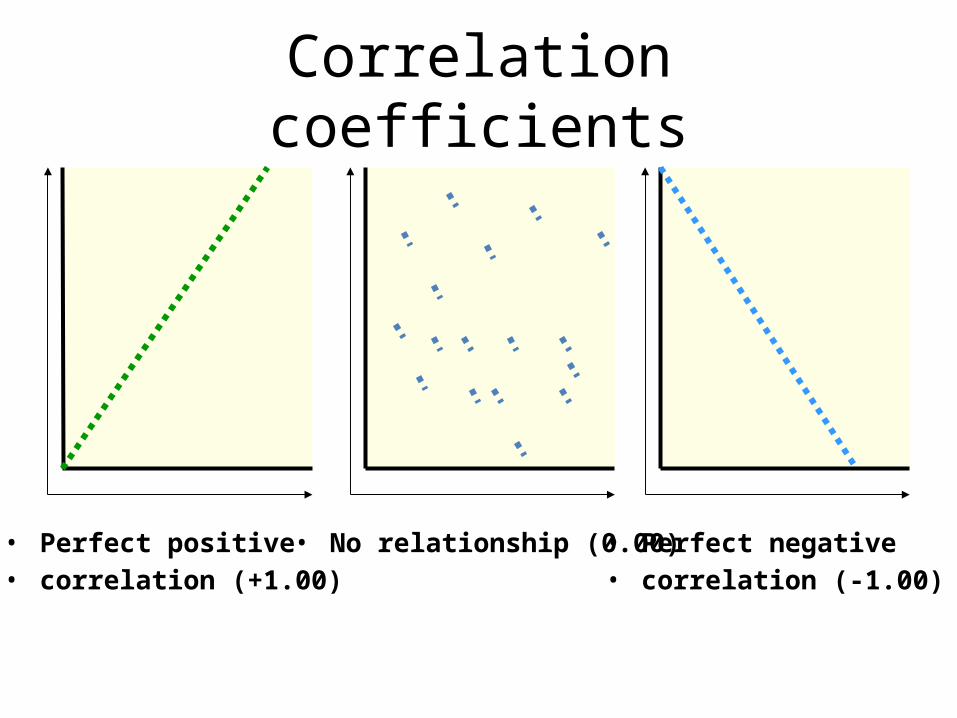
Correlation coefficients
• Perfect positive• correlation (+1.00)
• No relationship (0.00) • Perfect negative• correlation (-1.00)
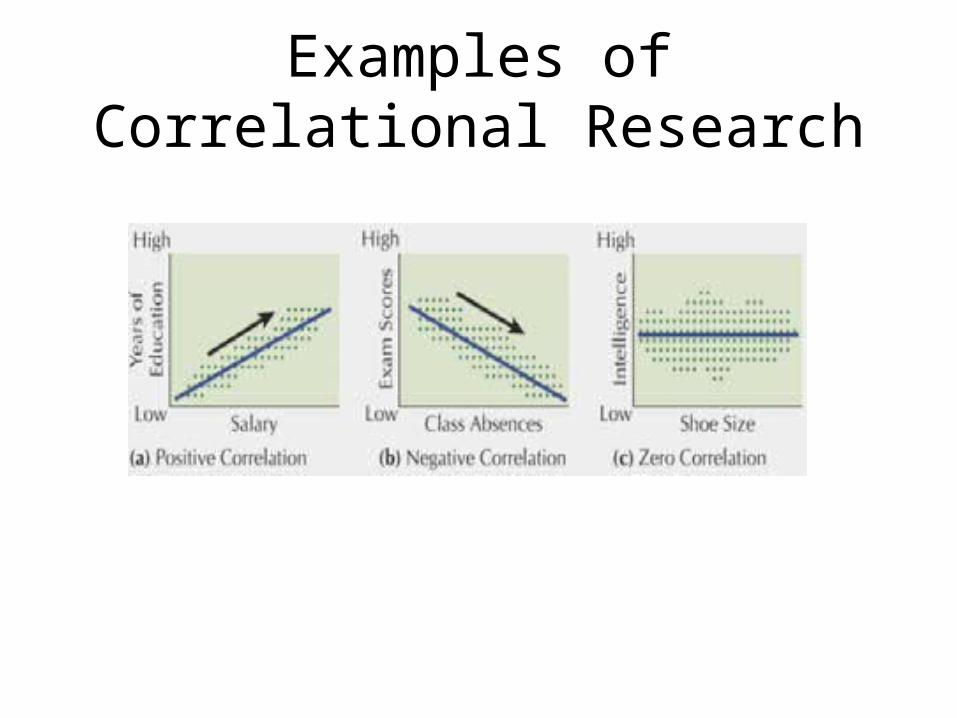
Examples of Correlational Research
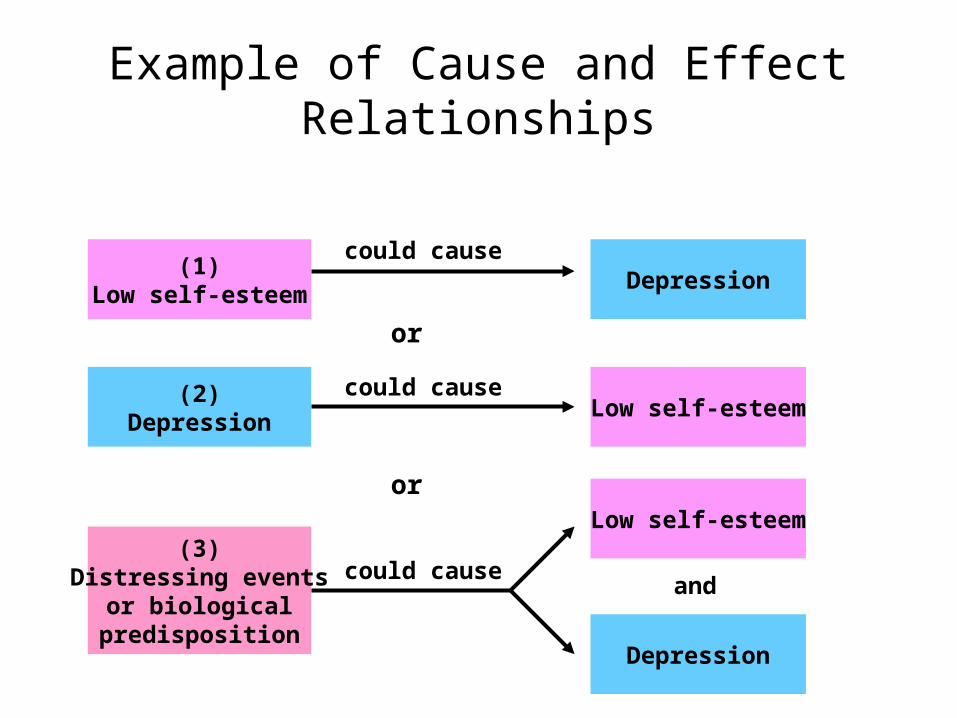
Example of Cause and Effect Relationships
(1)Low self-esteem
Depression
(2)Depression
Low self-esteem
Low self-esteem
Depression
(3)Distressing events
or biologicalpredisposition
could cause
could cause
could cause
or
or
and
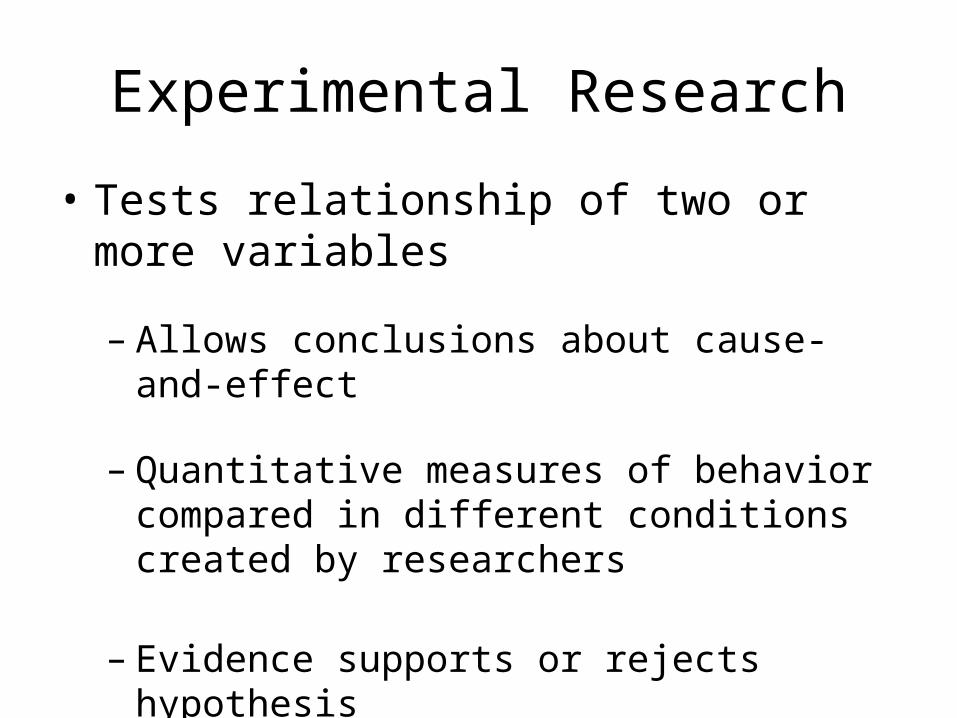
Experimental Research
• Tests relationship of two or more variables
– Allows conclusions about cause-and-effect
– Quantitative measures of behavior compared in different conditions created by researchers
– Evidence supports or rejects hypothesis
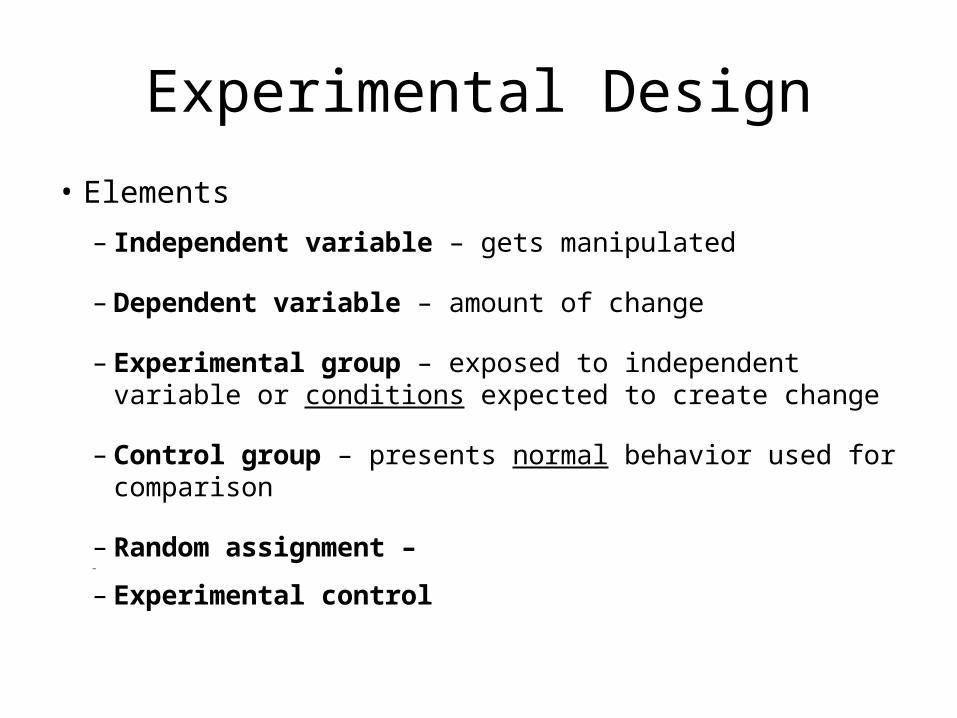
Experimental Design
• Elements
– Independent variable – gets manipulated
– Dependent variable – amount of change
– Experimental group – exposed to independent variable or conditions expected to create change
– Control group – presents normal behavior used for comparison
– Random assignment – –
– Experimental control
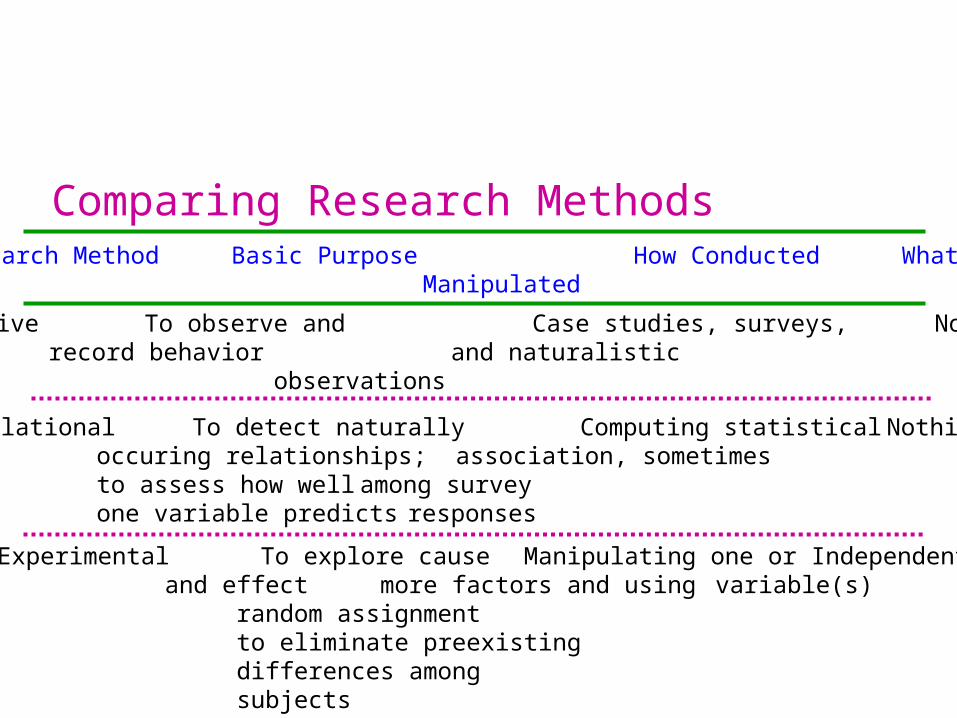
Comparing Research MethodsResearch Method Basic Purpose How Conducted What is
Manipulated
Descriptive To observe and Case studies, surveys, Nothing record behavior and naturalistic
observations
Correlational To detect naturally Computing statistical Nothing occuring relationships; association, sometimes to assess how well among survey one variable predicts responses
Experimental To explore cause Manipulating one or Independent and effect more factors and using variable(s)
random assignmentto eliminate preexistingdifferences among subjects
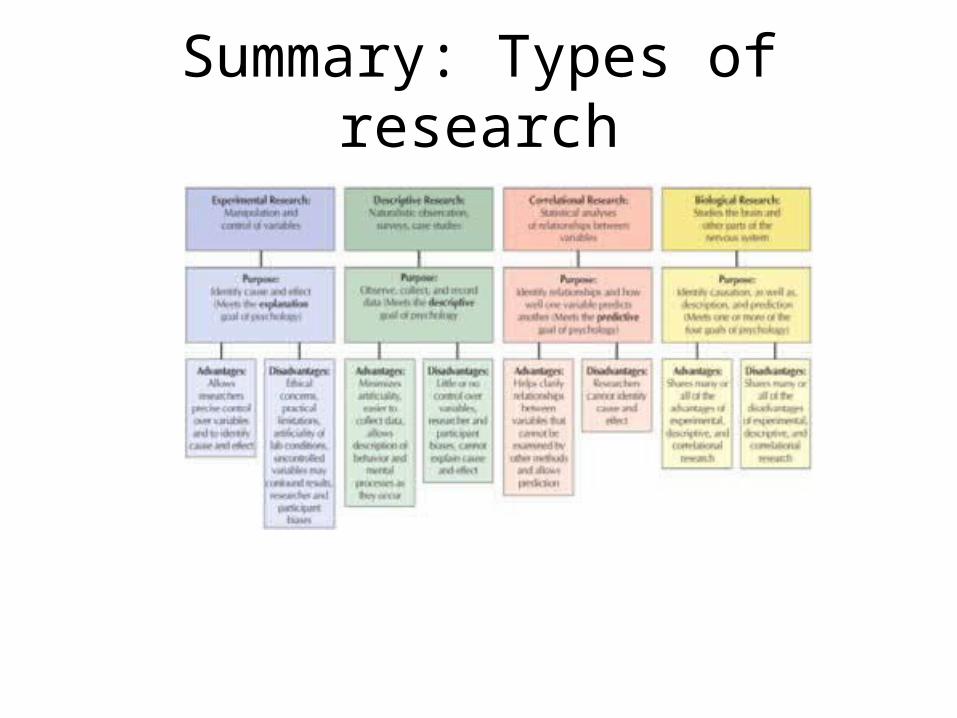
Summary: Types of research
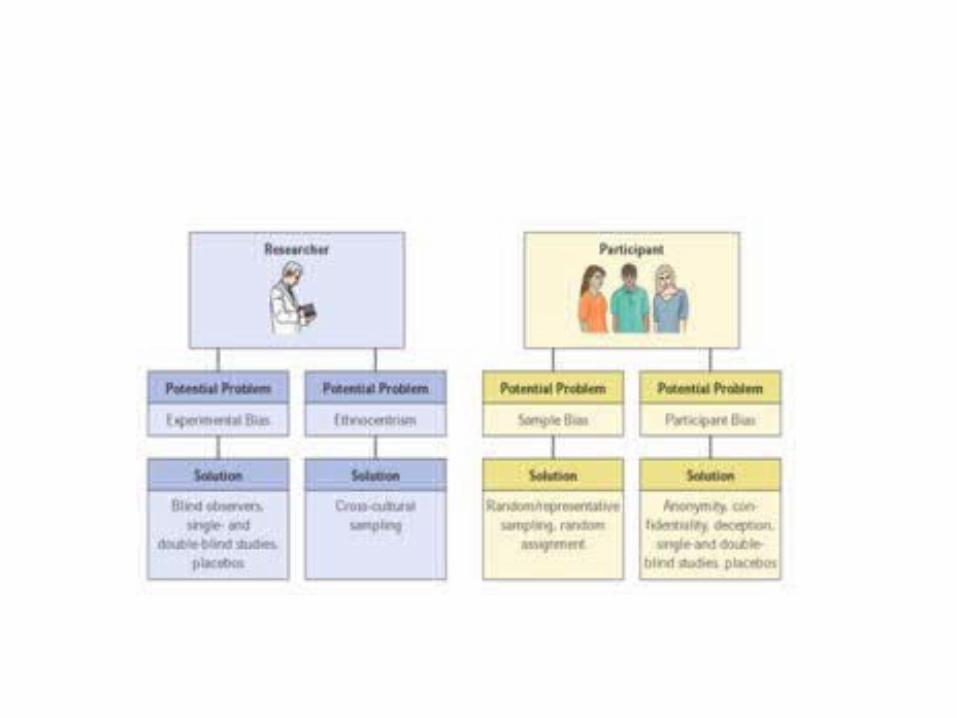
Issues that come up in research
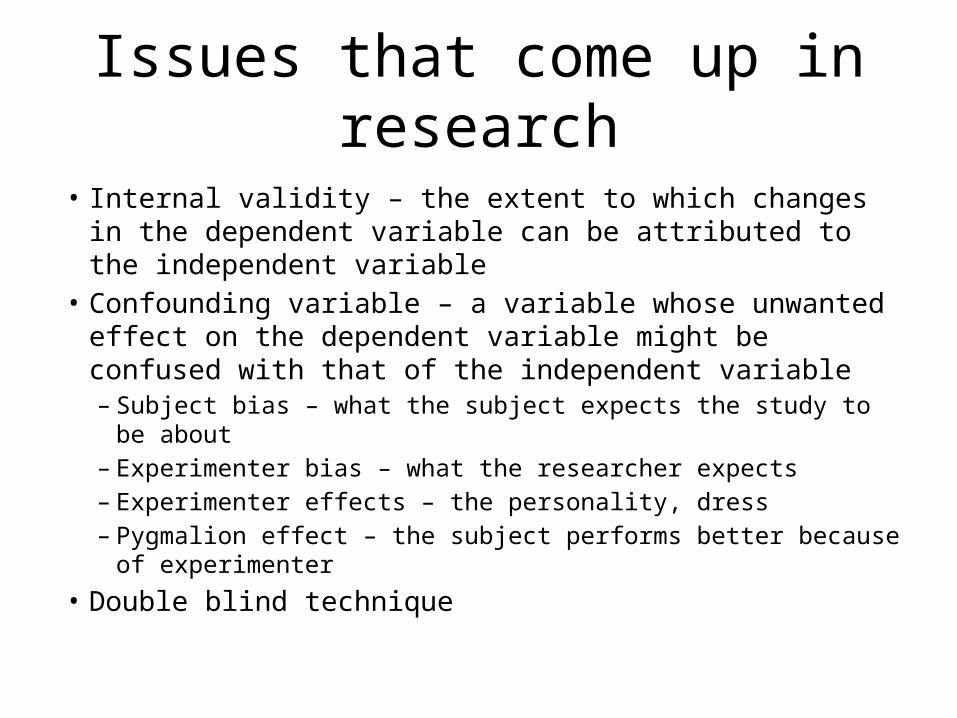
• Internal validity – the extent to which changes in the dependent variable can be attributed to the independent variable
• Confounding variable – a variable whose unwanted effect on the dependent variable might be confused with that of the independent variable– Subject bias – what the subject expects the study to be about– Experimenter bias – what the researcher expects– Experimenter effects – the personality, dress – Pygmalion effect – the subject performs better because of
experimenter• Double blind technique
Types of Random Assignment
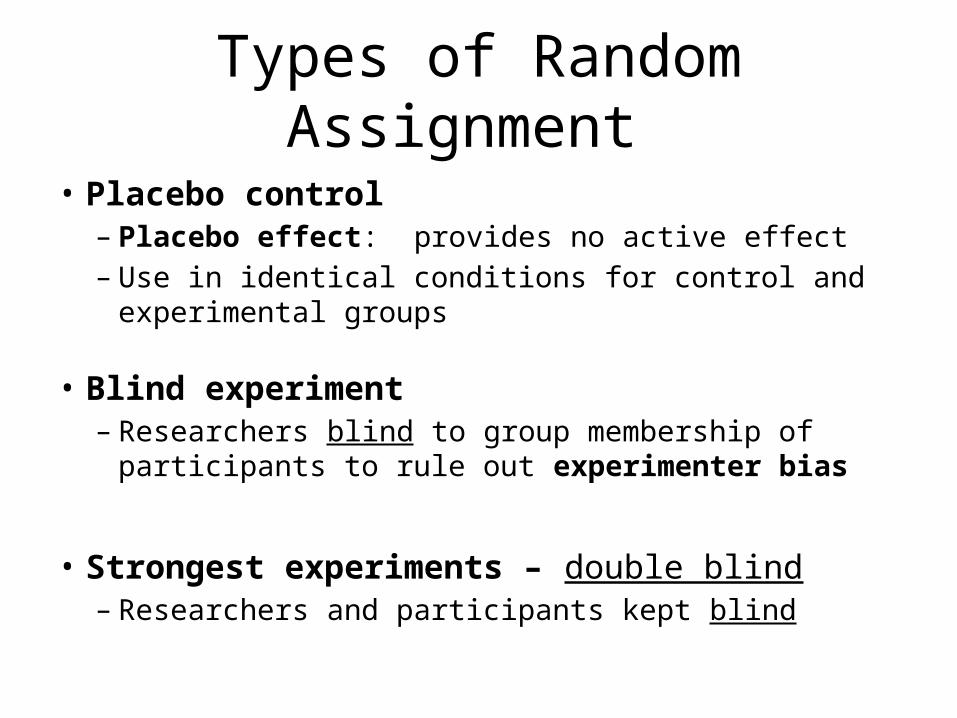
• Placebo control– Placebo effect: provides no active effect– Use in identical conditions for control and experimental
groups
• Blind experiment– Researchers blind to group membership of participants
to rule out experimenter bias
• Strongest experiments – double blind– Researchers and participants kept blind
Descriptive Statistics: summarized data for large groups of
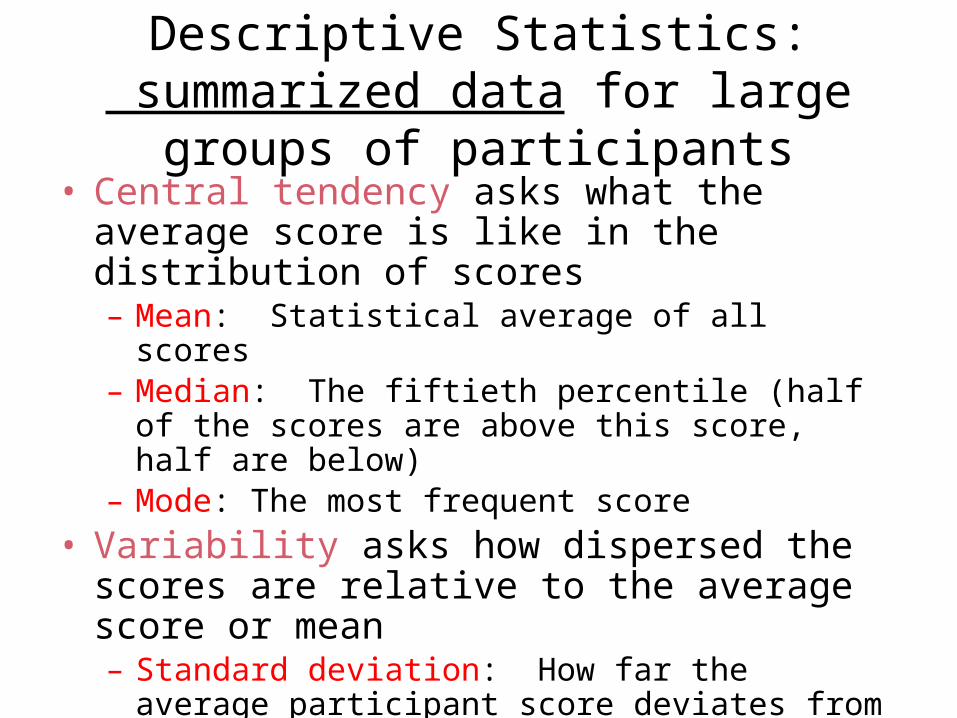
participants• Central tendency asks what the average score is like
in the distribution of scores– Mean: Statistical average of all scores– Median: The fiftieth percentile (half of the scores are
above this score, half are below)– Mode: The most frequent score
• Variability asks how dispersed the scores are relative to the average score or mean– Standard deviation: How far the average participant score
deviates from the average (square root of the variance)
Bell Curve and Beyond
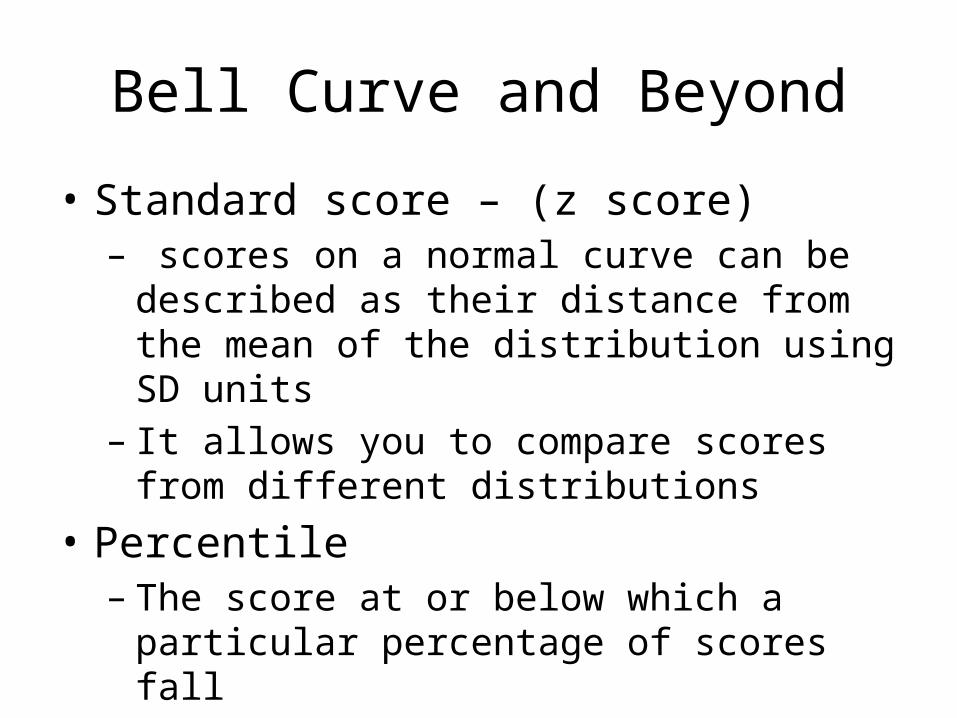
• Standard score – (z score)– scores on a normal curve can be described as
their distance from the mean of the distribution using SD units
– It allows you to compare scores from different distributions
• Percentile– The score at or below which a particular
percentage of scores fall
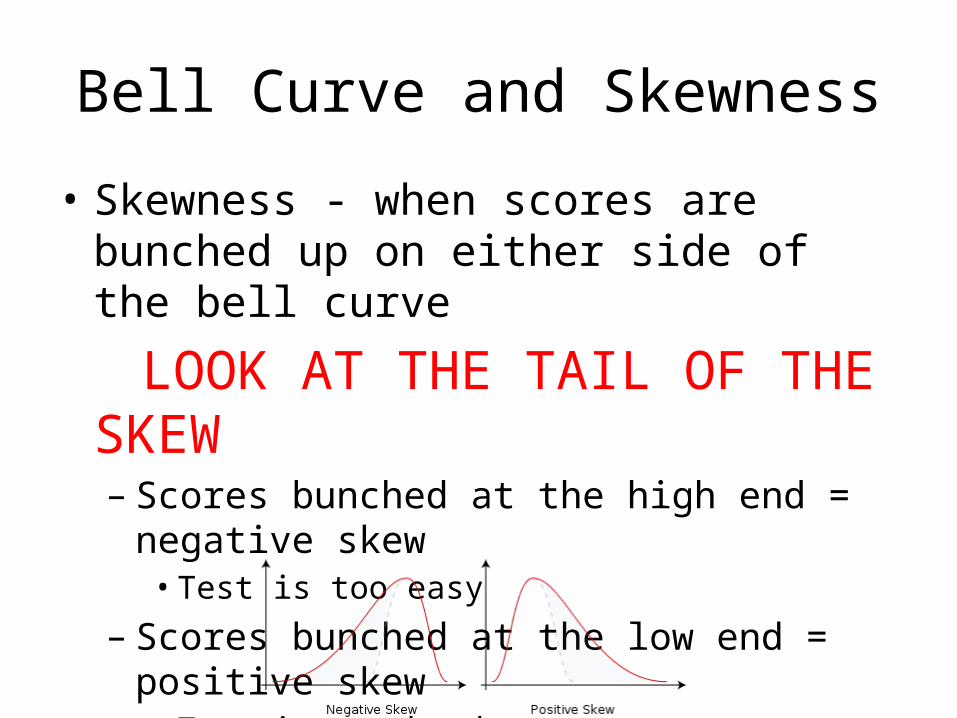
Bell Curve and Skewness
• Skewness - when scores are bunched up on either side of the bell curve
LOOK AT THE TAIL OF THE SKEW– Scores bunched at the high end = negative skew
• Test is too easy
– Scores bunched at the low end = positive skew• Test is too hard
Inferential Statistics
Is the difference between the two groups caused by our manipulation or by chance?
• We test the null hypothesis – we predict that there will be no effect of the independent variable– No difference btw the groups – fail to reject the null
hypothesis– Difference between the two groups – reject the null
hypothesis
BUT IS THIS BY CHANCE OR FOR REAL?
Statistical SignificanceWe are looking for true difference between groups – a statement of
probability– the larger the difference between the groups, ______ likely it
is by chance.– Psychologists accept .05 as being statistically significant
• A probability of less than 5% that the results occurred by chance
• The results are more likely to be statistically significant if:– Samples are large– The differences between the two means is large– The variability within the groups is small
Inferences
• Internal validity – the extent to which changes in the dependent variable can be attributed to the independent variable rather than a confounding variable
• External validity – the extent to which the results of a research study can be generalized
• Reliable – safe to generalize from a sample– Representative sample– More cases are better than fewer
Issues with Experimental Research
• Complex real-world issues are not easily studied in the laboratory
• Lab studies may have problems in external validity
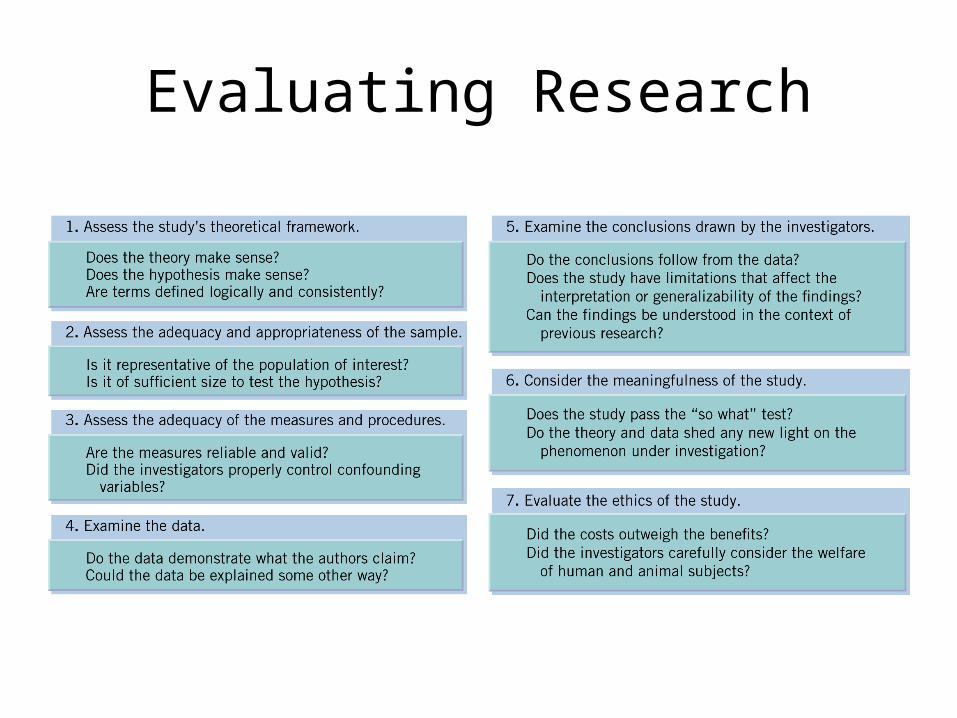
Evaluating Research
APA Ethical Guidelines for Research
• IRB- Internal Review Board
• Both for humans and animals.
Animal Research
• Clear purpose• Treated in a
humane way• Acquire animals
legally• Least amount of
suffering possible.
Human Research
• No Coercion- must be voluntary
• Informed consent• Anonymity• No significant risk• Must debrief
Ethics of Research
• Respecting the rights of human research participants involves:– Informed consent is an explanation of a study and the
responsibilities of experimenter and participant– Deception involving the subjects must be justified– Confidentiality of study information must be maintained– Debriefing refers to explaining the research process to the
subjects at the end of the study
• Animal research must be justified and must minimize discomfort to participants
Chapter 2 Quiz
The Research Enterprise in Psychology
Don’t forget to write your answers on a separate piece of paper to grade when you’re done!
1. Organized sets of concepts that explain phenomena are
a) independent variablesb) dependent variablesc) hypothesesd) theories

2. “Students will be able to read a statement printed in the Comic Sans font faster than the same statement written in the Lucida Calligraphy font.”The previous statement is a(n)
a) hypothesisb) theoryc) replicationd) operational definition
3. A theory isa) a tentative statement about the relationship between two or more variablesb) a system of interrelated ideas used to
explain a set of observationsc) a statement of research results that have
been proven to be correctd) a preliminary proposal that has yet to be
tested
4. Theoretically, random assignment should eliminate
a) sampling errorb) the need to use statisticsc) concerns over validityd) many confounding variables
5. When subjects in the experimental group put a puzzle piece in the wrong place, the experimenter unconsciously winced. The experimenter did not wince when subjects in the control group put a piece in the wrong place.The wincing of the experimenter must be eliminated because it is
a) fraudulentb) a demand characteristicc) a confabulationd) a confounding variable
6. The two basic types of statistics area) descriptive and inferentialb) central tendency and variabilityc) sampling and correlatived) parametric and nonparametric
7. Of the following, which research method is most effective for studying unusually complex or rare phenomena?
a) controlled experimentb) surveysc) naturalistic observationd) case study
8. Of the following, which research method would be most appropriate for investigating the relationship between political party membership and attitude toward the death penalty?
a) controlled experimentb) naturalistic observationc) testd) survey
9. Of the following, the strongest positive correlation would most likely be shown between
a) an adult’s weight and running speedb) close friendships and happinessc) sense of humor and years of
educationd) visual acuity and salary
10. John wants to study the effects of alcohol on the behavior of college students. For his study, he spends 5 hours every night for 2 weeks at a bar near a college watching how the patrons act before and after drinking alcoholic beverages. The research method John is employing is a
a) controlled experimentb) surveyc) testd) naturalistic observation
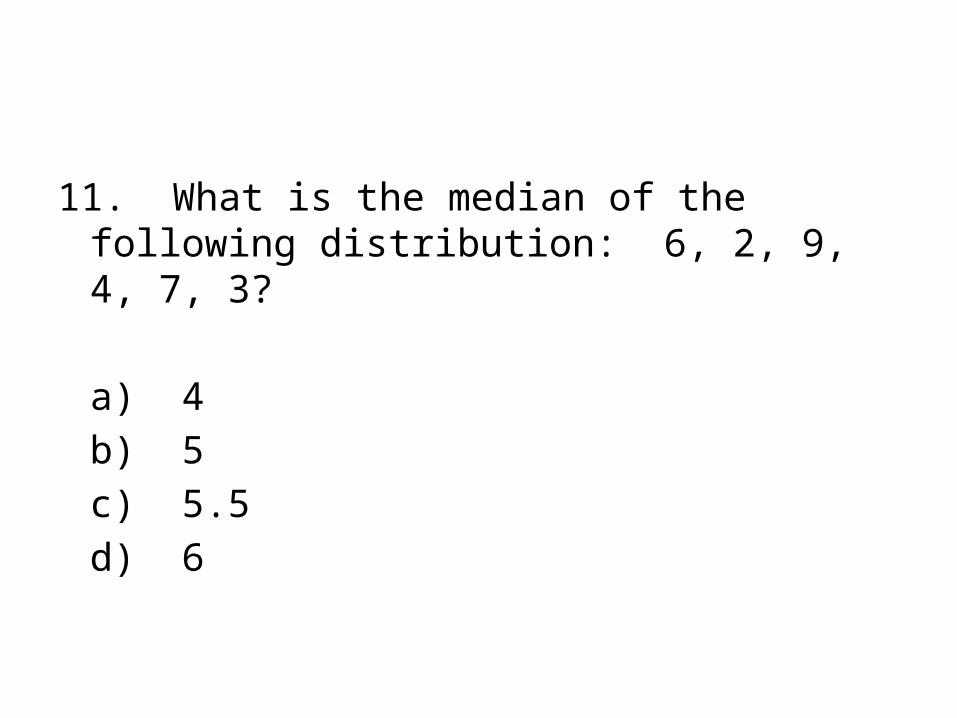
11. What is the median of the following distribution: 6, 2, 9, 4, 7, 3?
a) 4b) 5c) 5.5d) 6
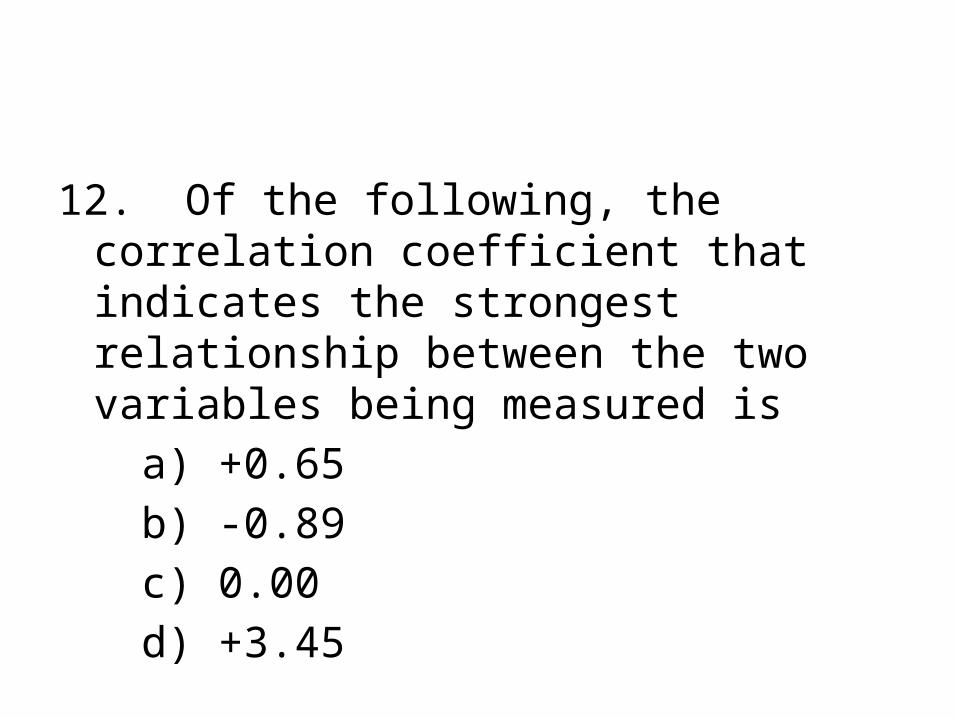
12. Of the following, the correlation coefficient that indicates the strongest relationship between the two variables being measured is
a) +0.65b) -0.89c) 0.00d) +3.45
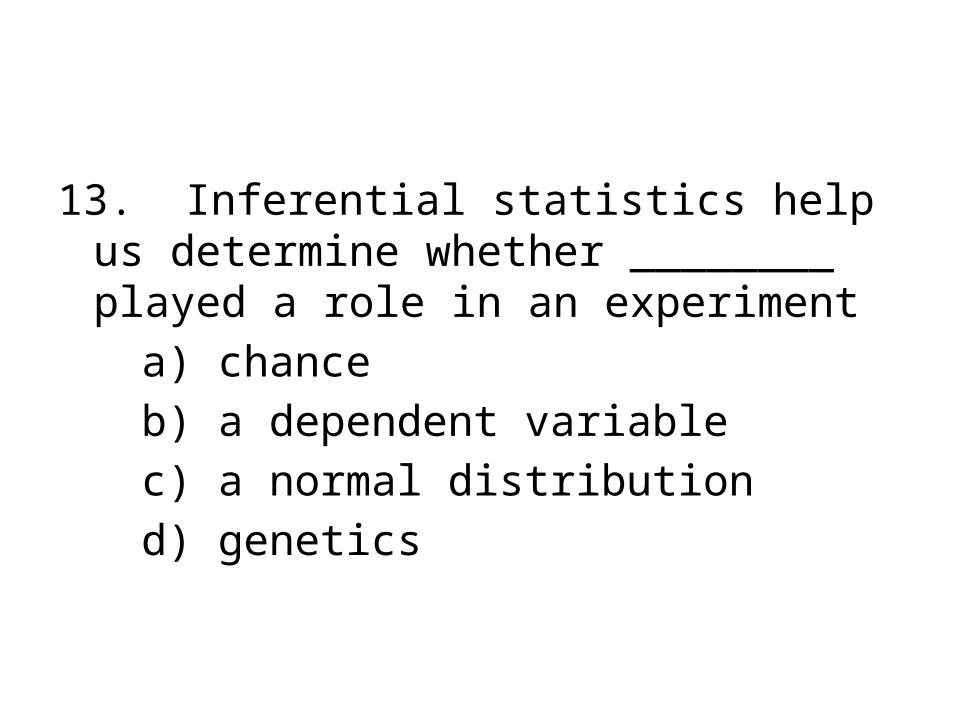
13. Inferential statistics help us determine whether ________ played a role in an experiment
a) chanceb) a dependent variablec) a normal distributiond) genetics
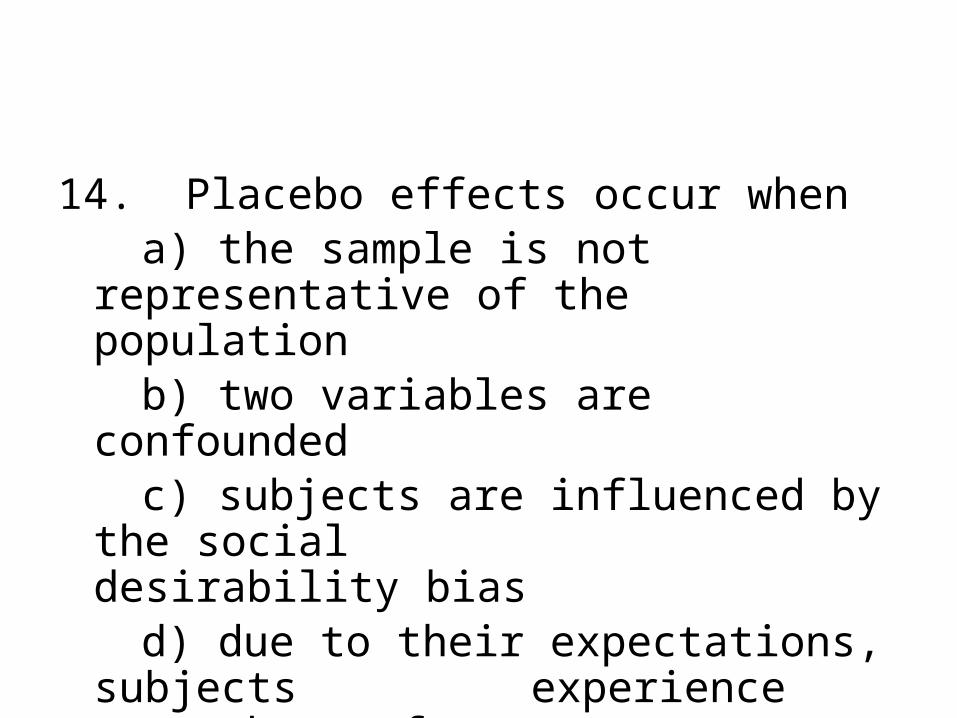
14. Placebo effects occur whena) the sample is not representative of
the populationb) two variables are confoundedc) subjects are influenced by the social desirability biasd) due to their expectations, subjects experience some change from a nonexistent or ineffective treatment
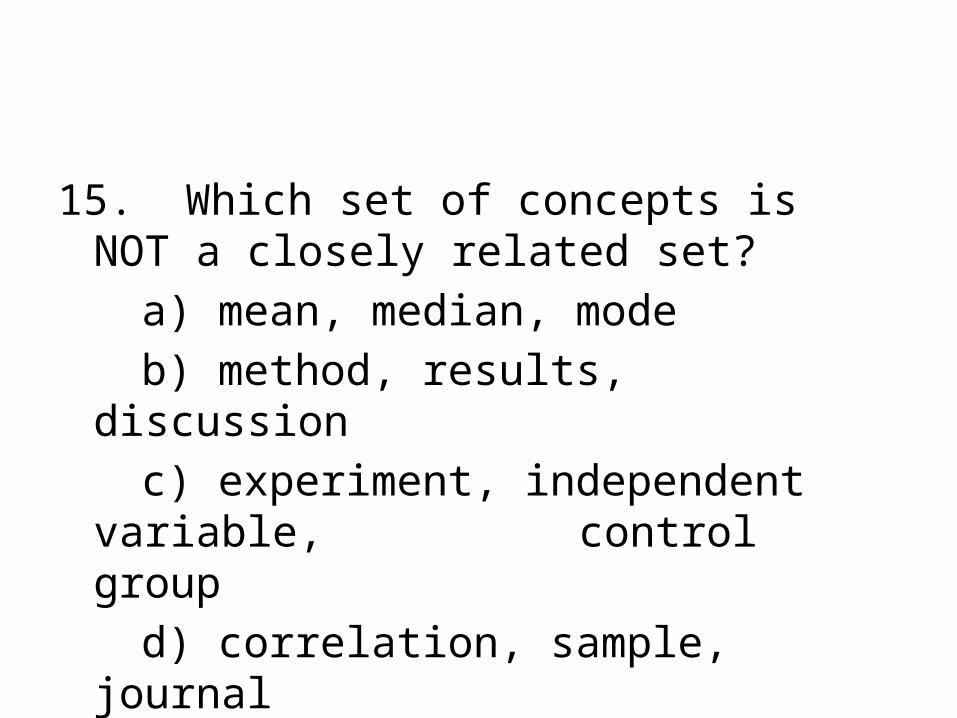
15. Which set of concepts is NOT a closely related set?
a) mean, median, modeb) method, results, discussionc) experiment, independent variable, control groupd) correlation, sample, journal
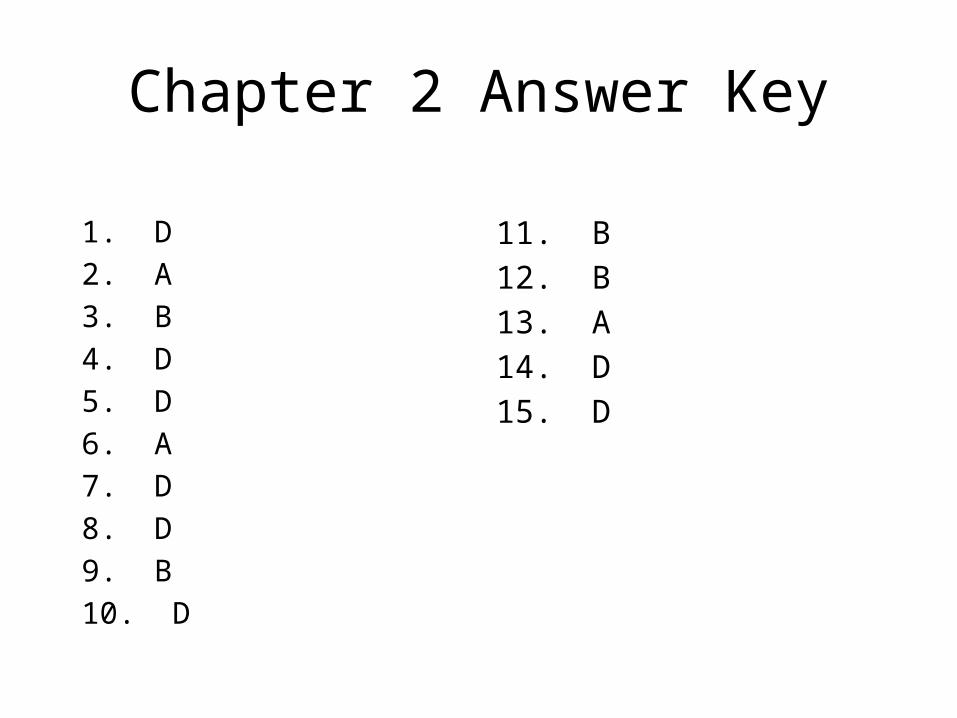
Chapter 2 Answer Key
1. D2. A3. B4. D5. D6. A7. D8. D9. B10. D
11. B12. B13. A14. D15. D
http://appsychology.com/HowPass/MC%20quizes/Research
%20Methods/research_methods.htm