Embed Size (px)
Citation preview
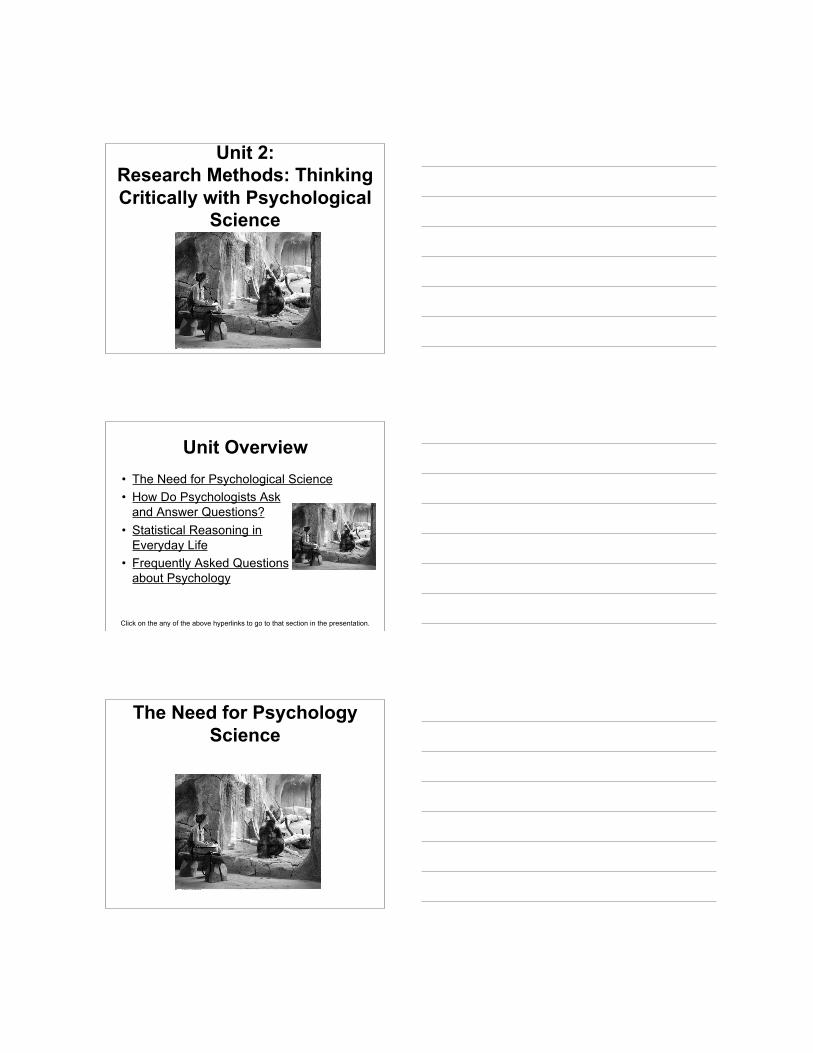
Unit 2:Research Methods: ThinkingCritically with Psychological
Science
Unit Overview• The Need for Psychological Science• How Do Psychologists Ask
and Answer Questions?• Statistical Reasoning in
Everyday Life• Frequently Asked Questions
about Psychology
Click on the any of the above hyperlinks to go to that section in the presentation.
The Need for PsychologyScience
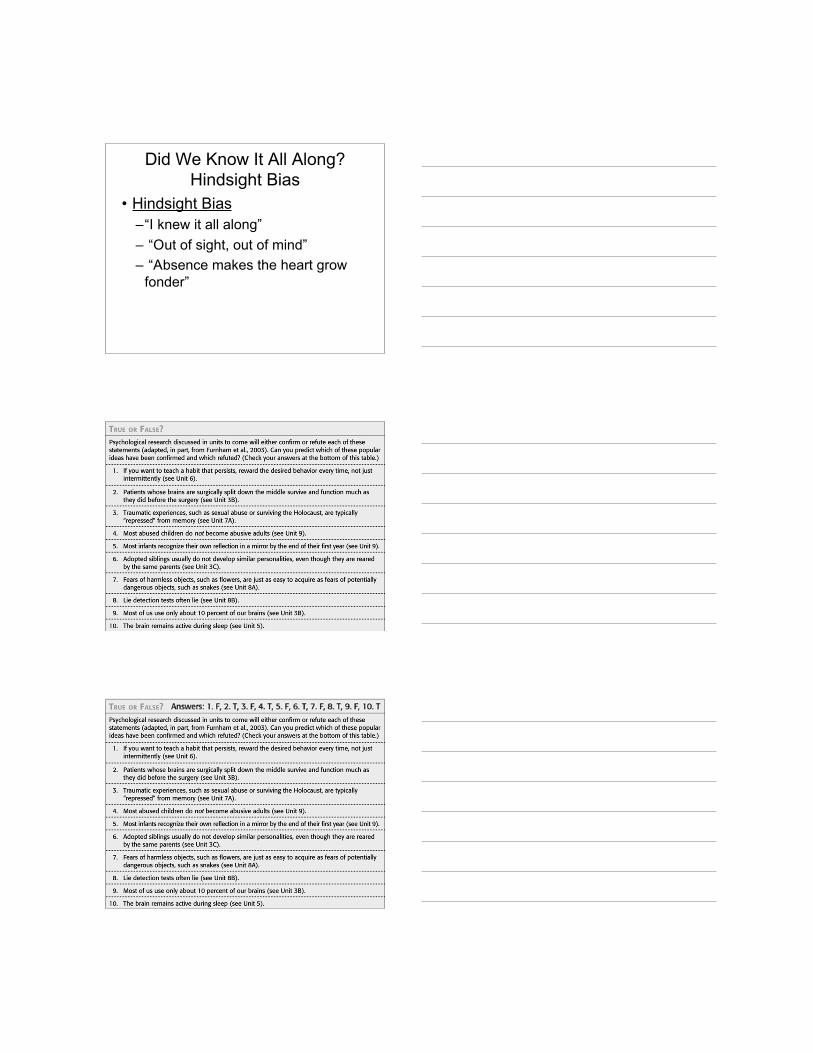
Did We Know It All Along?Hindsight Bias
• Hindsight Bias–“I knew it all along”– “Out of sight, out of mind”– “Absence makes the heart grow
fonder”
Overconfidence
• Overconfidence–Together with hindsight bias, can
lead to overestimate our intuition
The Scientific Attitude
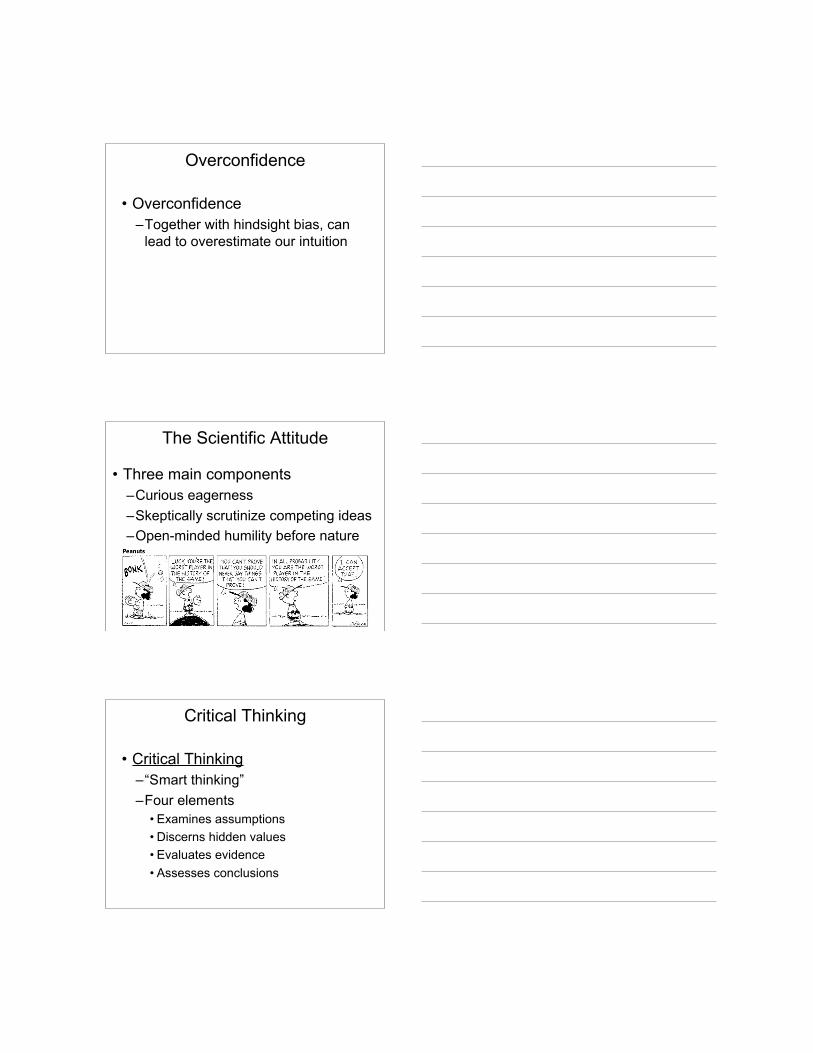
• Three main components–Curious eagerness–Skeptically scrutinize competing ideas–Open-minded humility before nature
Critical Thinking
• Critical Thinking–“Smart thinking”–Four elements
• Examines assumptions• Discerns hidden values• Evaluates evidence• Assesses conclusions
How Do Psychologists Askand Answer Questions?
The Scientific Method
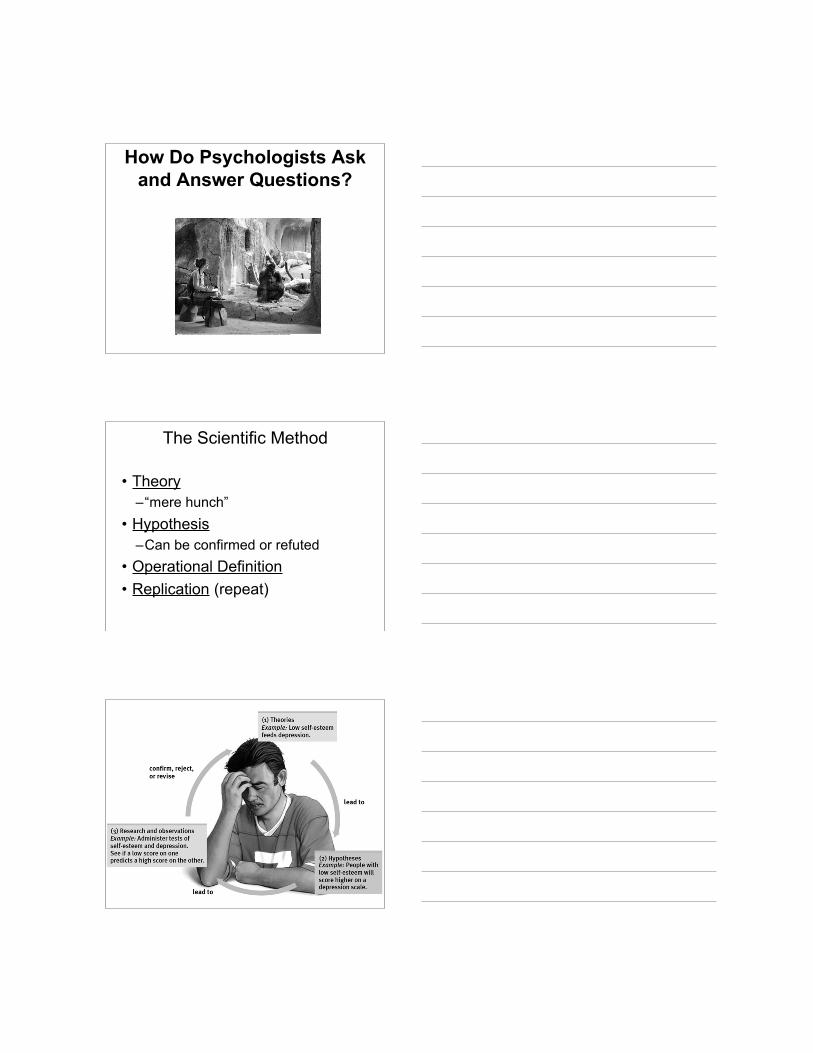
• Theory–“mere hunch”
• Hypothesis–Can be confirmed or refuted
• Operational Definition• Replication (repeat)
The Scientific Method
• A good theory is useful if it:–Effectively organizes a range of
self-reports and observations–Implies clear predictions that
anyone can use to check the theory
DescriptionThe Case Study
• Case Study–Suggest further study–Cannot discern general truths
DescriptionThe Survey
• Survey–Looks at many cases at once
• Word effects• Random sampling
–Representative sample
DescriptionThe Survey
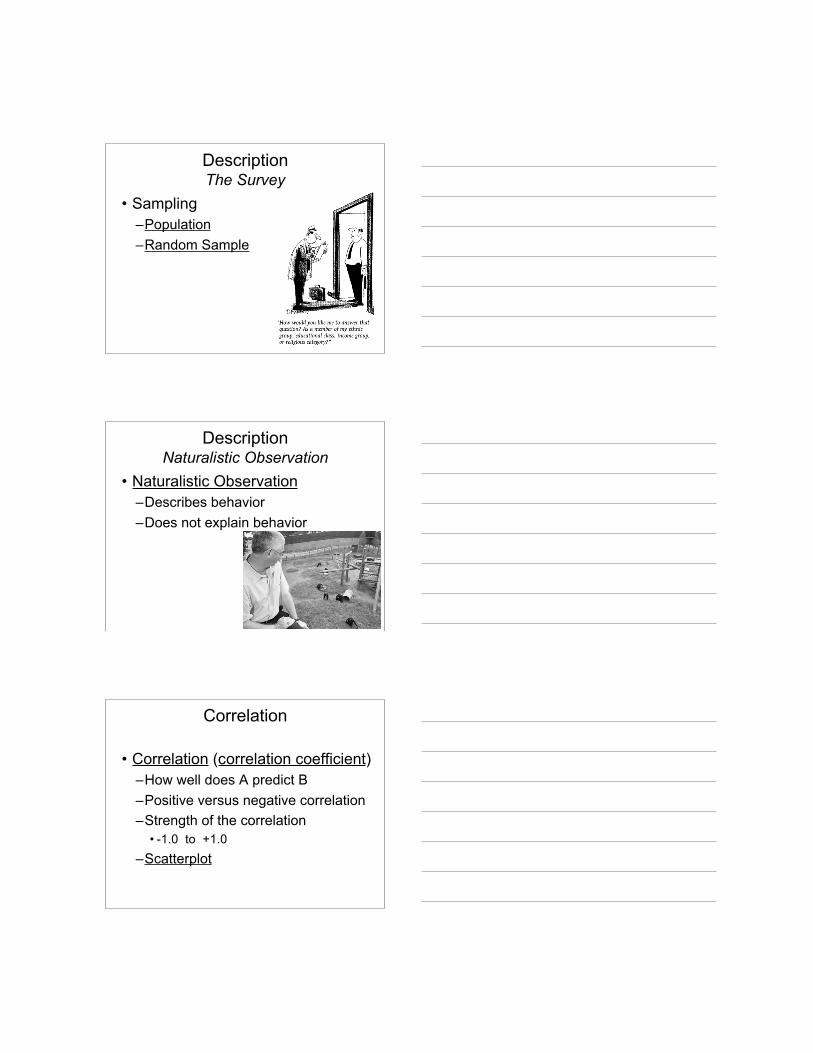
• Sampling–Population–Random Sample
DescriptionNaturalistic Observation
• Naturalistic Observation–Describes behavior–Does not explain behavior
Correlation
• Correlation (correlation coefficient)–How well does A predict B–Positive versus negative correlation–Strength of the correlation
• -1.0 to +1.0–Scatterplot
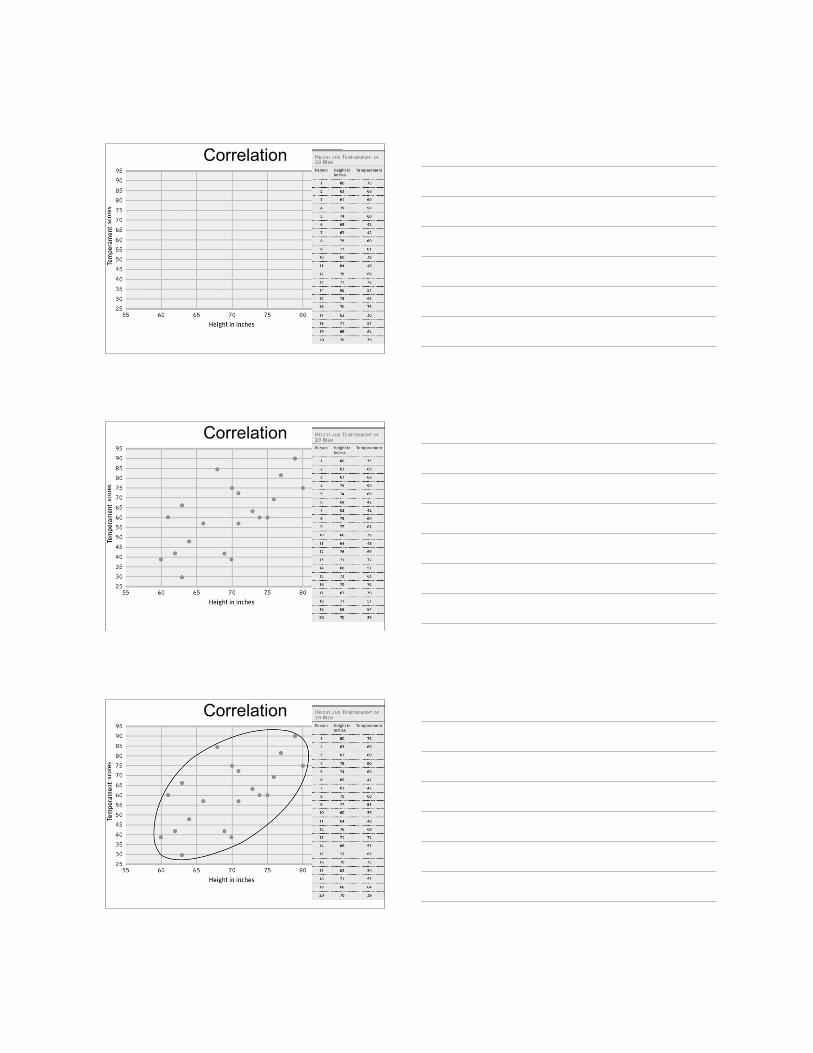
Correlation
Correlation
Correlation
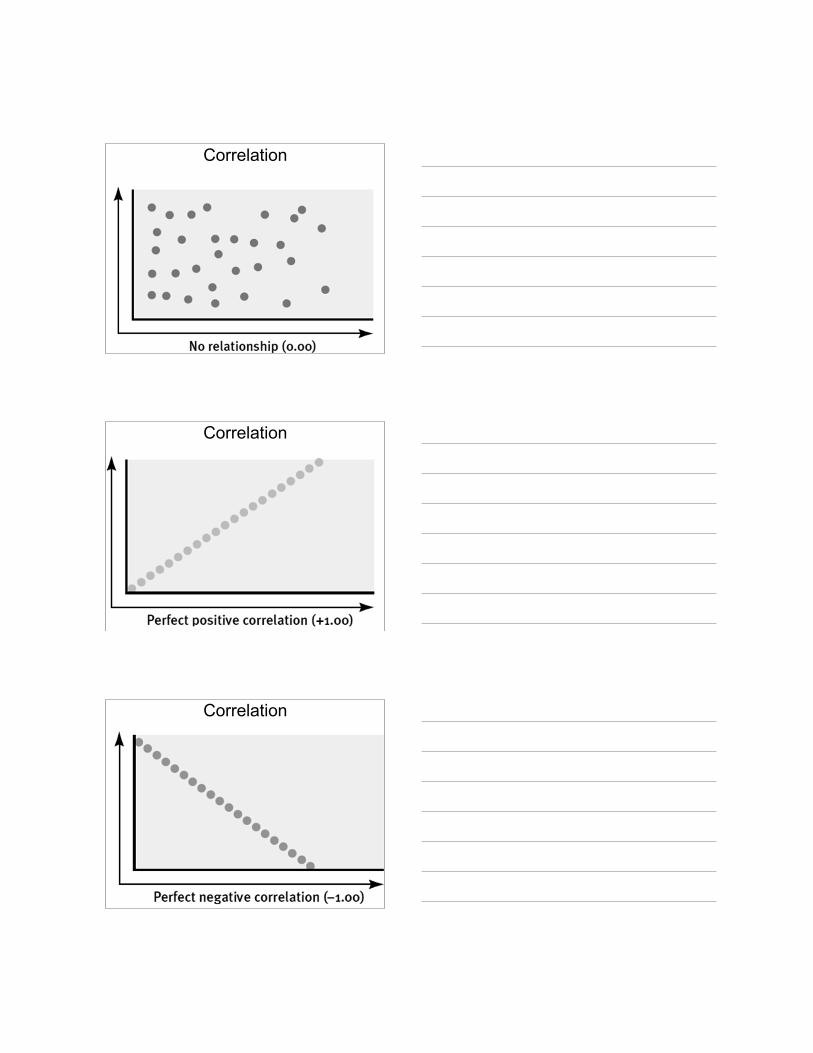
Correlation
Correlation
Correlation
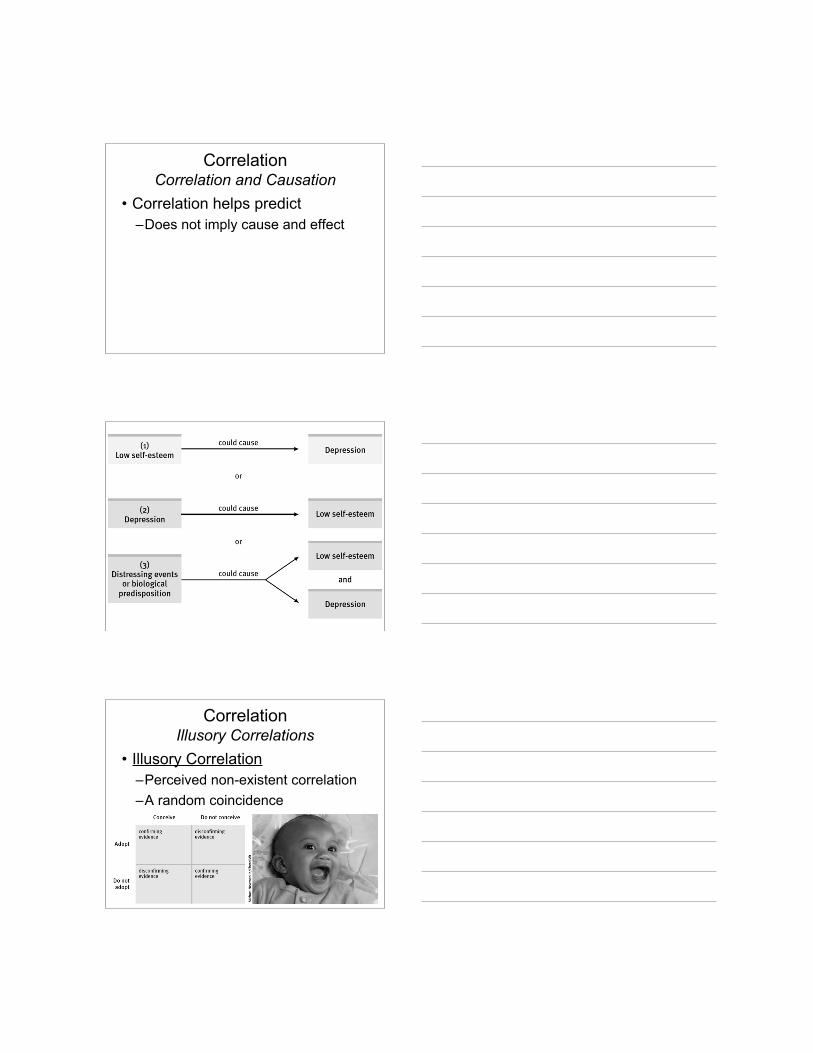
CorrelationCorrelation and Causation
• Correlation helps predict–Does not imply cause and effect
CorrelationIllusory Correlations
• Illusory Correlation–Perceived non-existent correlation–A random coincidence
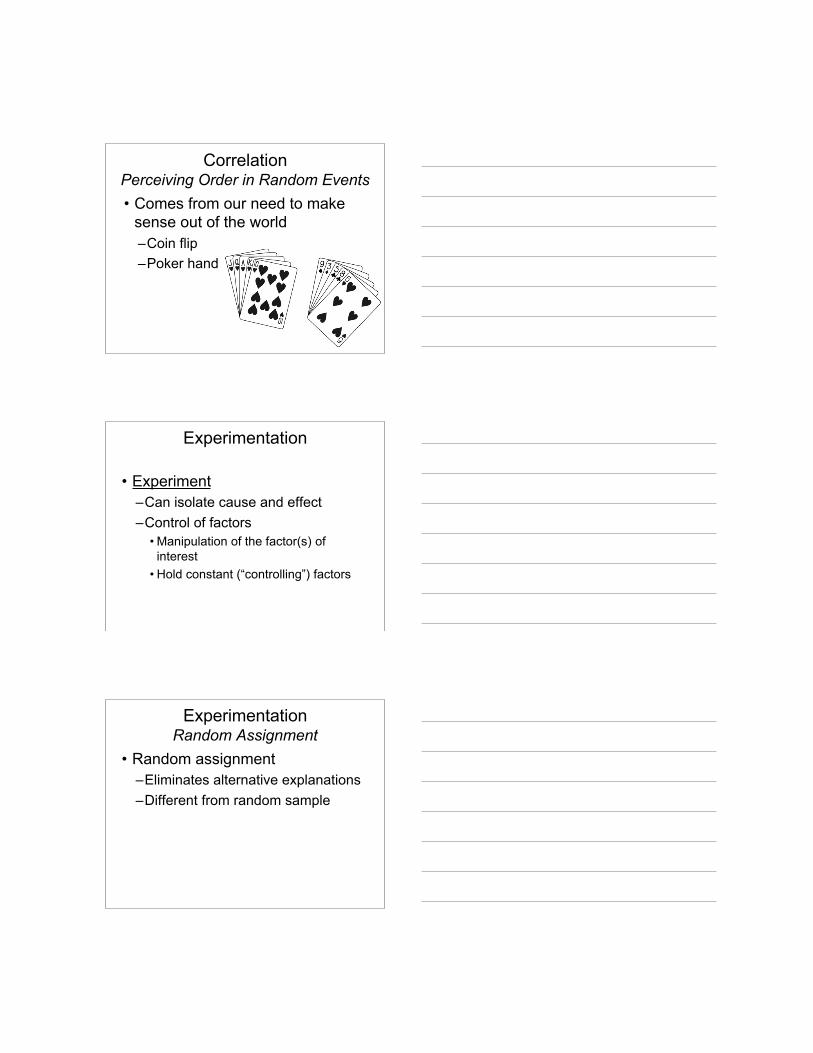
CorrelationPerceiving Order in Random Events• Comes from our need to make
sense out of the world–Coin flip–Poker hand
Experimentation
• Experiment–Can isolate cause and effect–Control of factors
• Manipulation of the factor(s) ofinterest
• Hold constant (“controlling”) factors
ExperimentationRandom Assignment
• Random assignment–Eliminates alternative explanations–Different from random sample
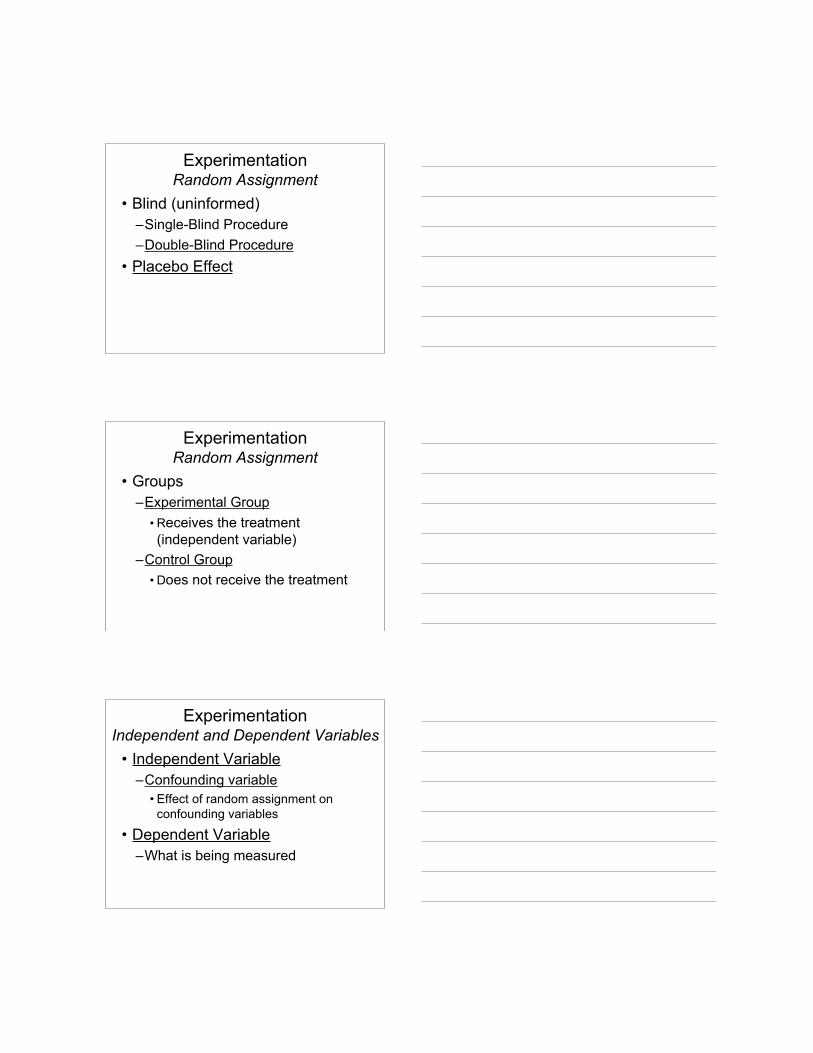
ExperimentationRandom Assignment
• Blind (uninformed)–Single-Blind Procedure–Double-Blind Procedure
• Placebo Effect
ExperimentationRandom Assignment
• Groups–Experimental Group
• Receives the treatment(independent variable)
–Control Group• Does not receive the treatment
ExperimentationIndependent and Dependent Variables
• Independent Variable–Confounding variable
• Effect of random assignment onconfounding variables
• Dependent Variable–What is being measured
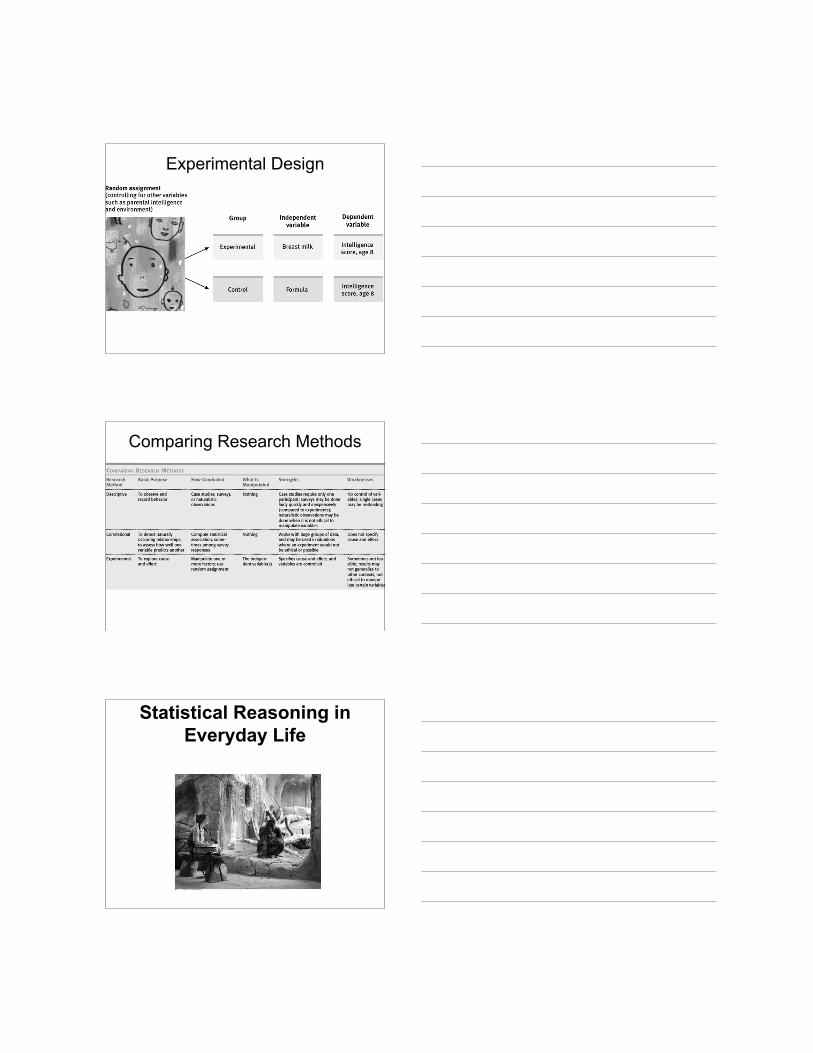
Experimental Design
Comparing Research Methods
Statistical Reasoning inEveryday Life
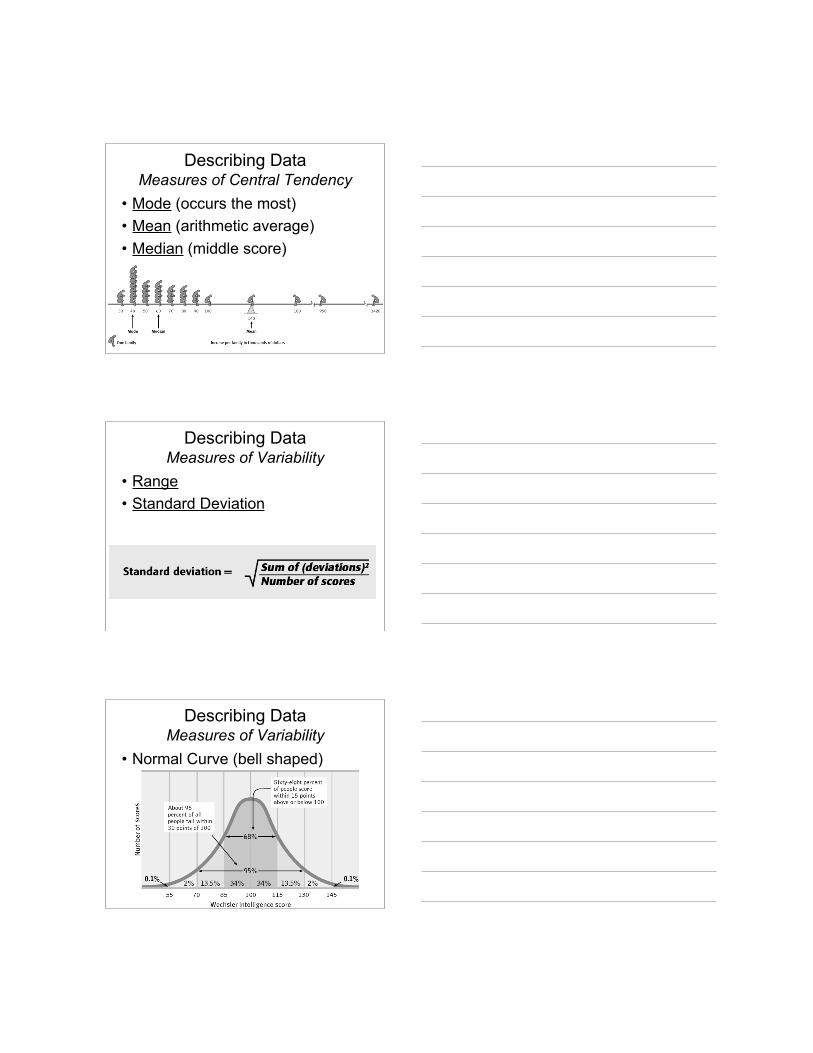
Describing DataMeasures of Central Tendency
• Mode (occurs the most)• Mean (arithmetic average)• Median (middle score)
Describing DataMeasures of Variability
• Range• Standard Deviation
Describing DataMeasures of Variability
• Normal Curve (bell shaped)
Making InferencesWhen Is an Observed Difference Reliable?
• Representative samples arebetter than biased samples
• Less-variable observations aremore reliable than those that aremore variable
• More cases are better than fewer
Making InferencesWhen Is a Difference Significant?
• Statistical significance–The averages are reliable–The differences between averages
is relatively large–Does imply the importance of the
results
Frequently Asked Questionsabout Psychology
Psychology Applied
• Can laboratory experimentsilluminate everyday life?–The principles, not the research
findings, help explain behavior
Psychology Applied
• Does behavior depend on one’sculture and gender?–Culture
• Influence of culture on behavior–Gender
• More similarities than differences
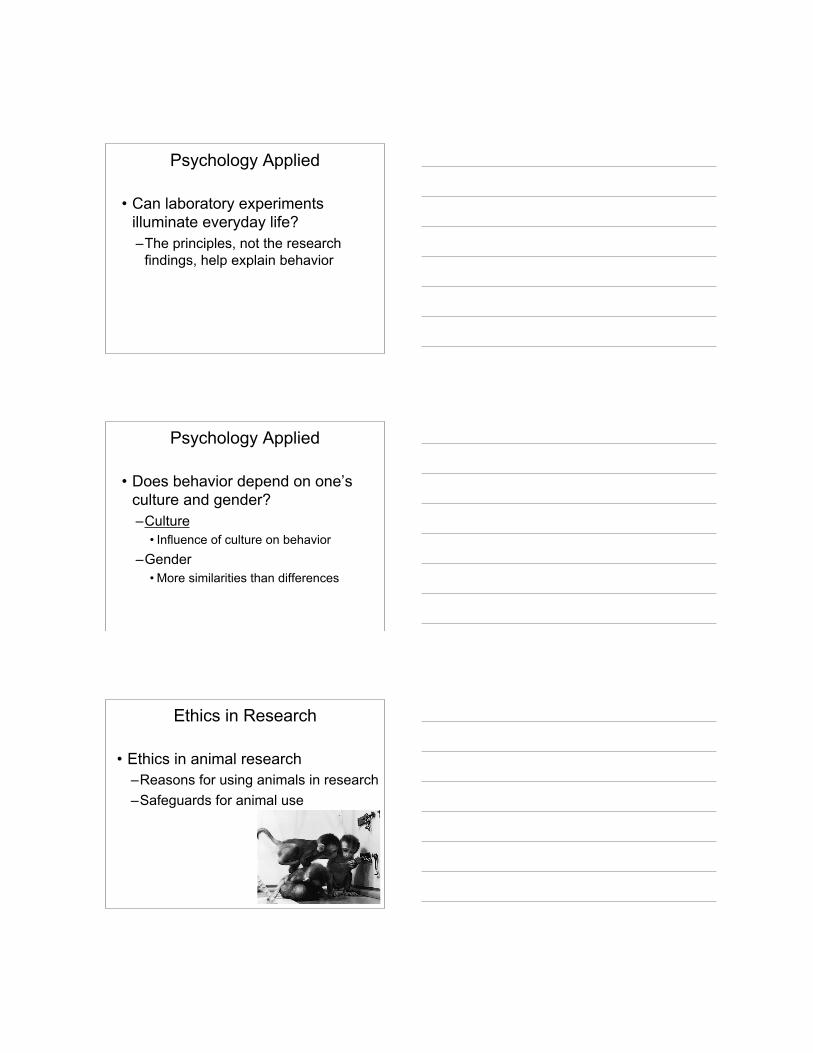
Ethics in Research
• Ethics in animal research–Reasons for using animals in research–Safeguards for animal use
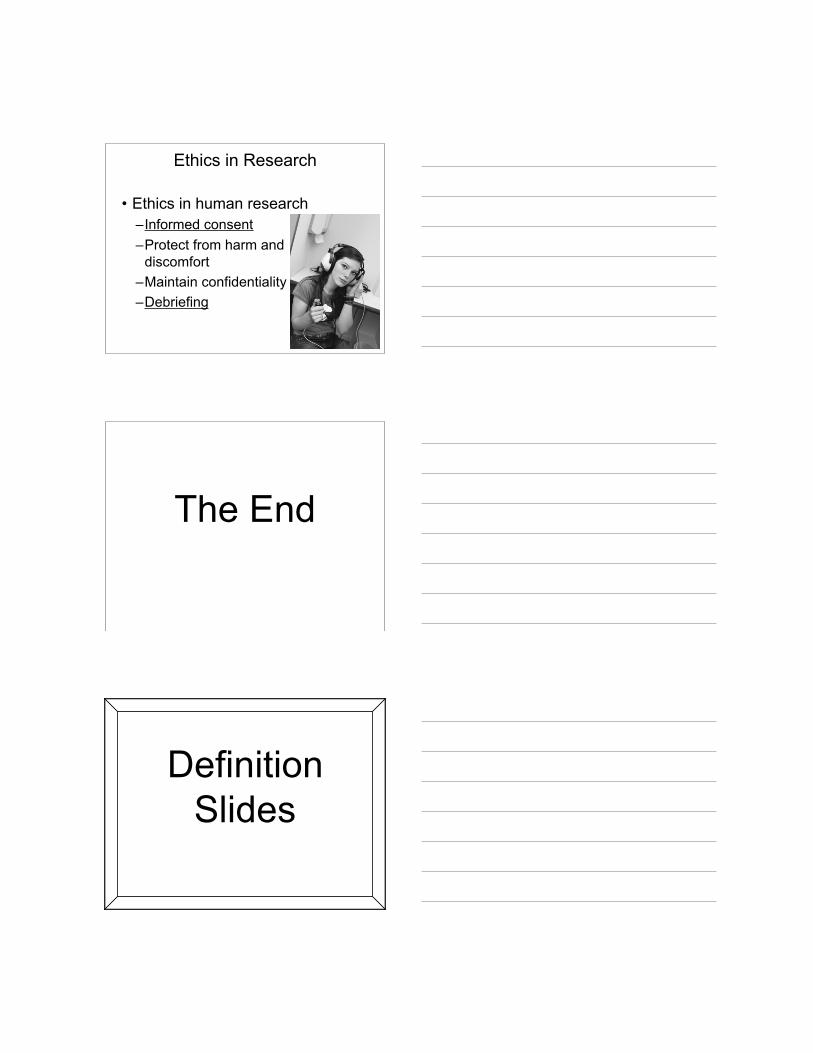
Ethics in Research
• Ethics in human research–Informed consent–Protect from harm and
discomfort–Maintain confidentiality–Debriefing
The End
DefinitionSlides
Hindsight Bias
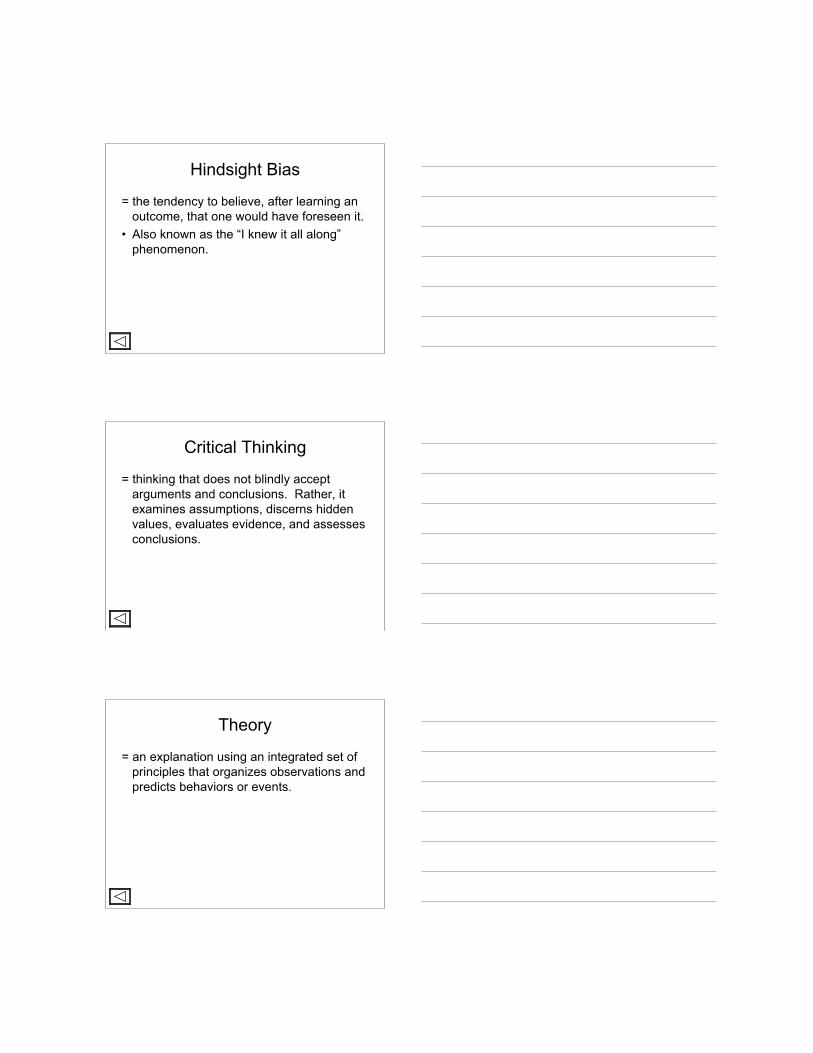
= the tendency to believe, after learning anoutcome, that one would have foreseen it.
• Also known as the “I knew it all along”phenomenon.
Critical Thinking
= thinking that does not blindly acceptarguments and conclusions. Rather, itexamines assumptions, discerns hiddenvalues, evaluates evidence, and assessesconclusions.
Theory
= an explanation using an integrated set ofprinciples that organizes observations andpredicts behaviors or events.
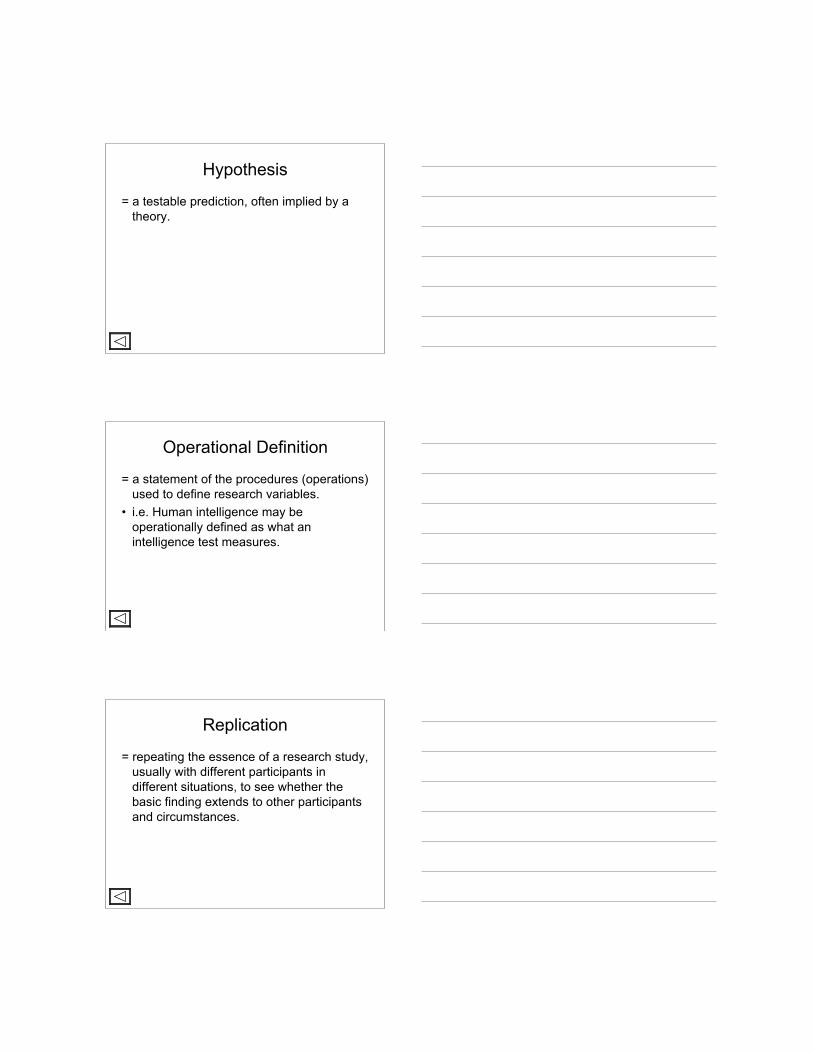
Hypothesis
= a testable prediction, often implied by atheory.
Operational Definition
= a statement of the procedures (operations)used to define research variables.
• i.e. Human intelligence may beoperationally defined as what anintelligence test measures.
Replication
= repeating the essence of a research study,usually with different participants indifferent situations, to see whether thebasic finding extends to other participantsand circumstances.
Case Study
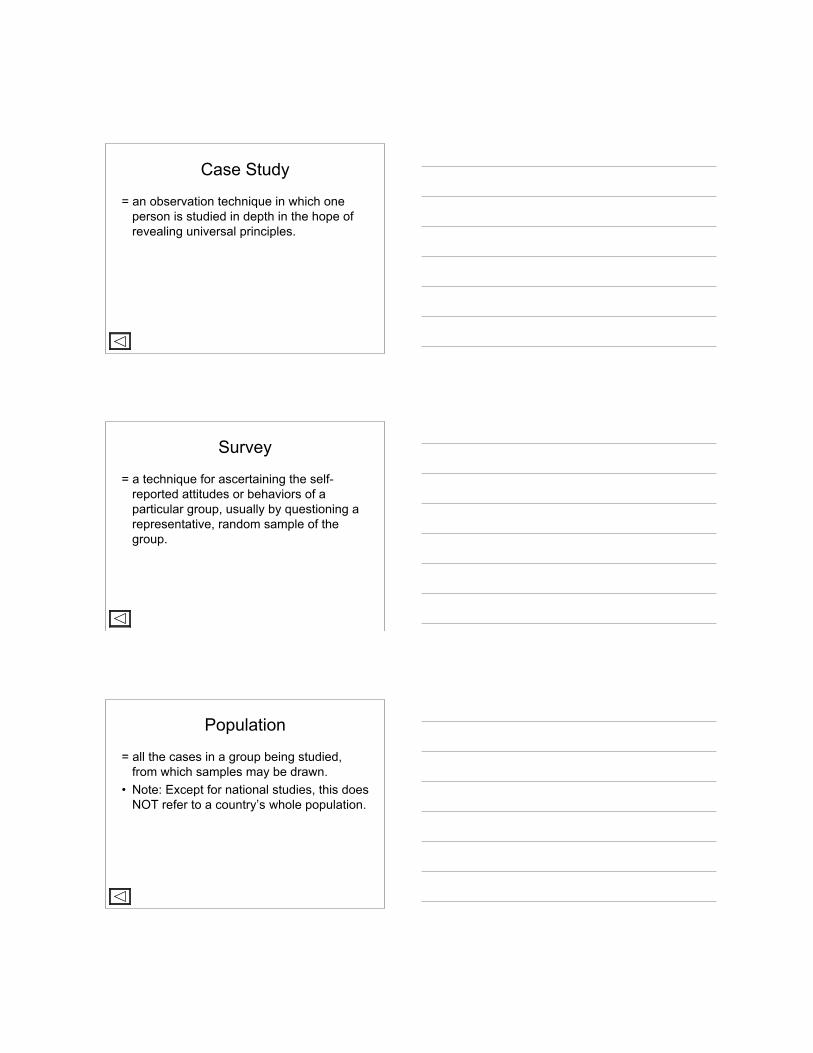
= an observation technique in which oneperson is studied in depth in the hope ofrevealing universal principles.
Survey
= a technique for ascertaining the self-reported attitudes or behaviors of aparticular group, usually by questioning arepresentative, random sample of thegroup.
Population
= all the cases in a group being studied,from which samples may be drawn.
• Note: Except for national studies, this doesNOT refer to a country’s whole population.
Random Sample
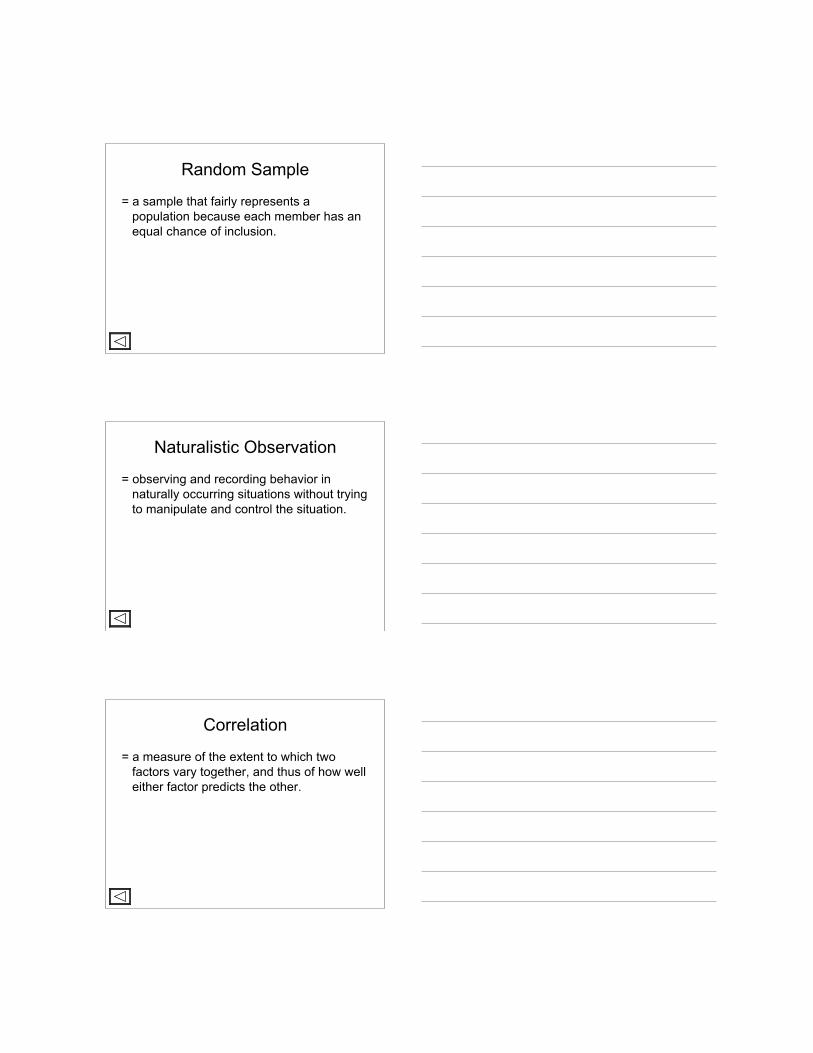
= a sample that fairly represents apopulation because each member has anequal chance of inclusion.
Naturalistic Observation
= observing and recording behavior innaturally occurring situations without tryingto manipulate and control the situation.
Correlation
= a measure of the extent to which twofactors vary together, and thus of how welleither factor predicts the other.
Correlation Coefficient
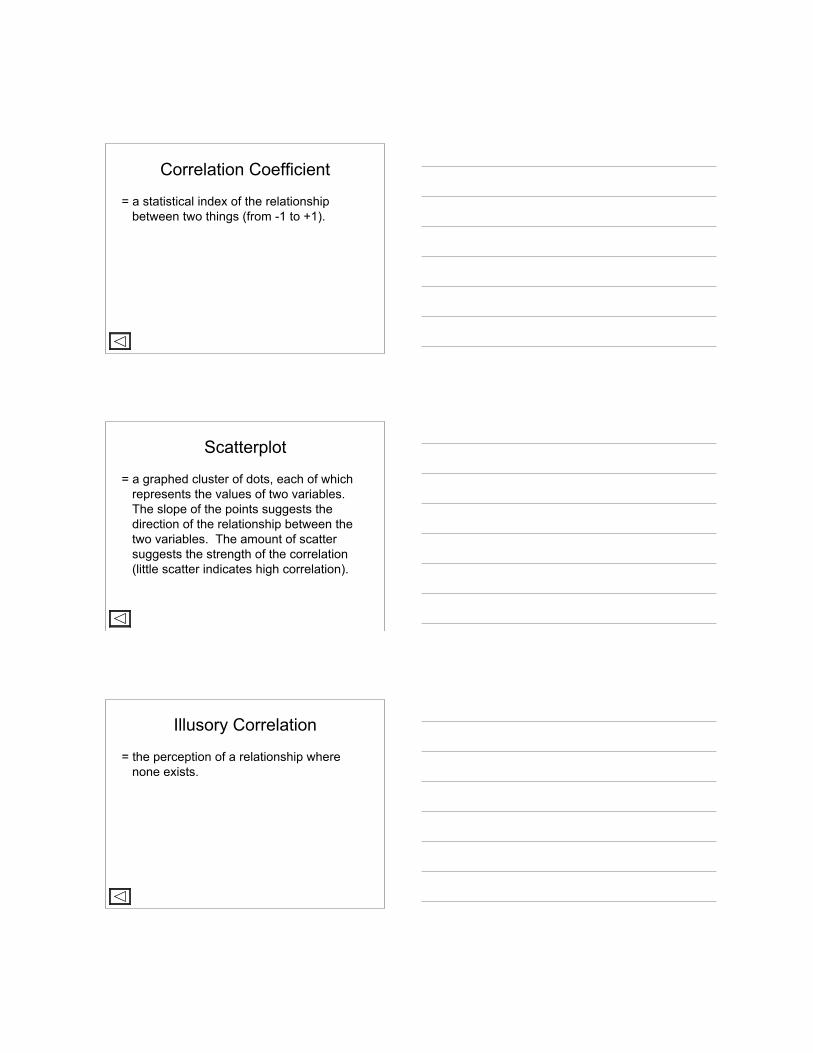
= a statistical index of the relationshipbetween two things (from -1 to +1).
Scatterplot
= a graphed cluster of dots, each of whichrepresents the values of two variables.The slope of the points suggests thedirection of the relationship between thetwo variables. The amount of scattersuggests the strength of the correlation(little scatter indicates high correlation).
Illusory Correlation
= the perception of a relationship wherenone exists.
Experiment
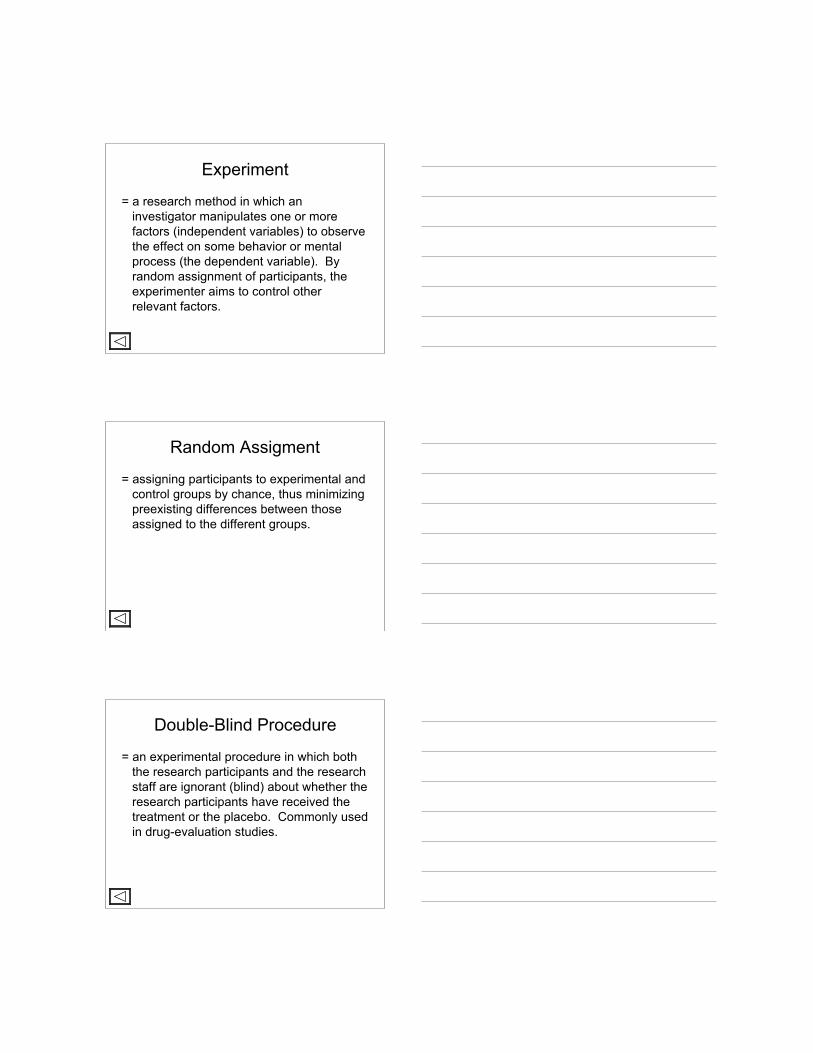
= a research method in which aninvestigator manipulates one or morefactors (independent variables) to observethe effect on some behavior or mentalprocess (the dependent variable). Byrandom assignment of participants, theexperimenter aims to control otherrelevant factors.
Random Assigment
= assigning participants to experimental andcontrol groups by chance, thus minimizingpreexisting differences between thoseassigned to the different groups.
Double-Blind Procedure
= an experimental procedure in which boththe research participants and the researchstaff are ignorant (blind) about whether theresearch participants have received thetreatment or the placebo. Commonly usedin drug-evaluation studies.
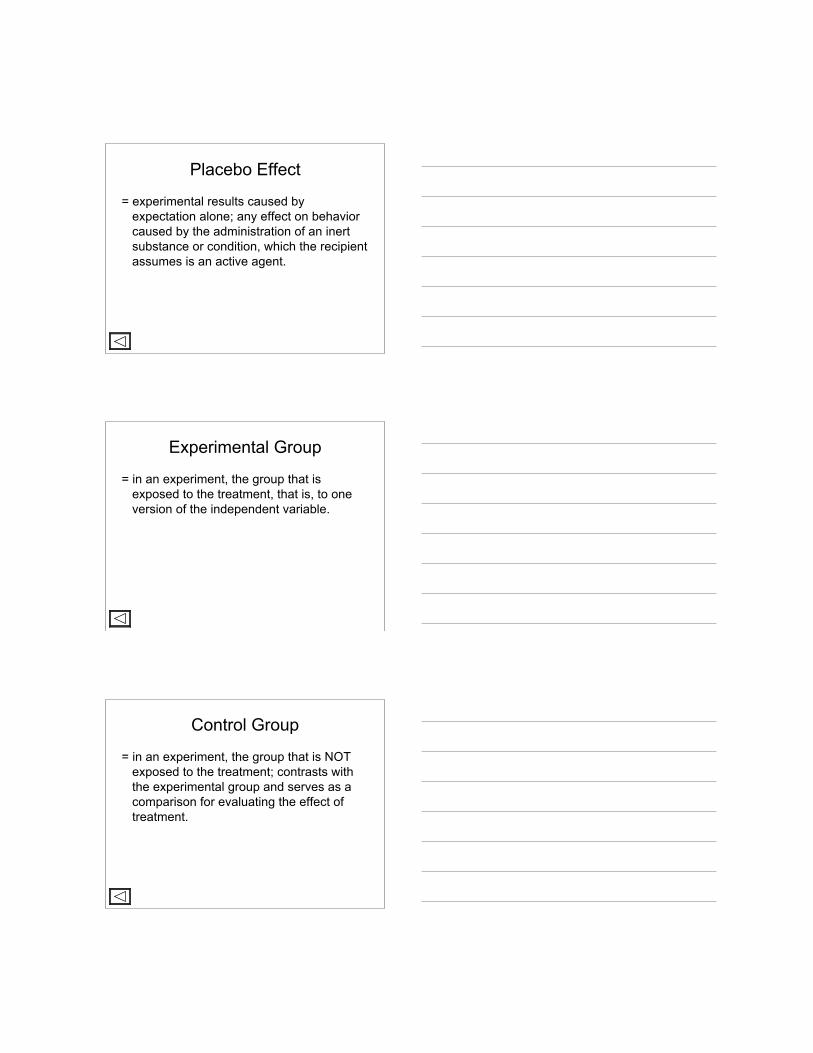
Placebo Effect
= experimental results caused byexpectation alone; any effect on behaviorcaused by the administration of an inertsubstance or condition, which the recipientassumes is an active agent.
Experimental Group
= in an experiment, the group that isexposed to the treatment, that is, to oneversion of the independent variable.
Control Group
= in an experiment, the group that is NOTexposed to the treatment; contrasts withthe experimental group and serves as acomparison for evaluating the effect oftreatment.
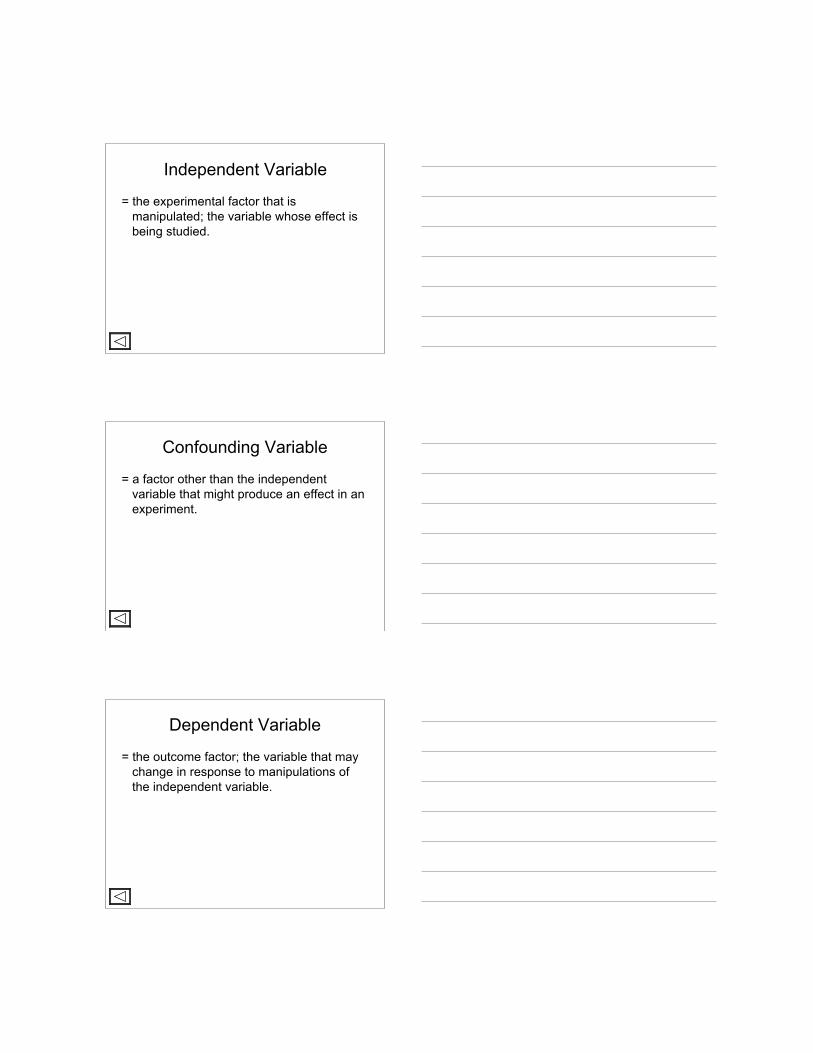
Independent Variable
= the experimental factor that ismanipulated; the variable whose effect isbeing studied.
Confounding Variable
= a factor other than the independentvariable that might produce an effect in anexperiment.
Dependent Variable
= the outcome factor; the variable that maychange in response to manipulations ofthe independent variable.
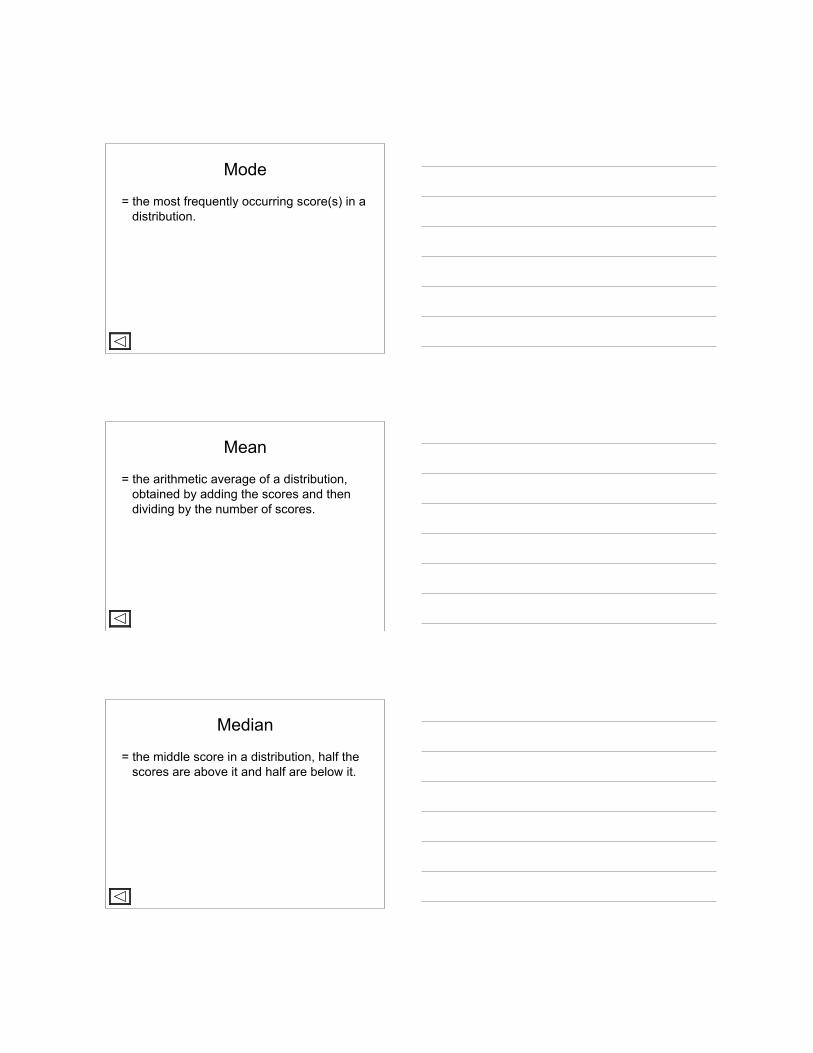
Mode
= the most frequently occurring score(s) in adistribution.
Mean
= the arithmetic average of a distribution,obtained by adding the scores and thendividing by the number of scores.
Median
= the middle score in a distribution, half thescores are above it and half are below it.
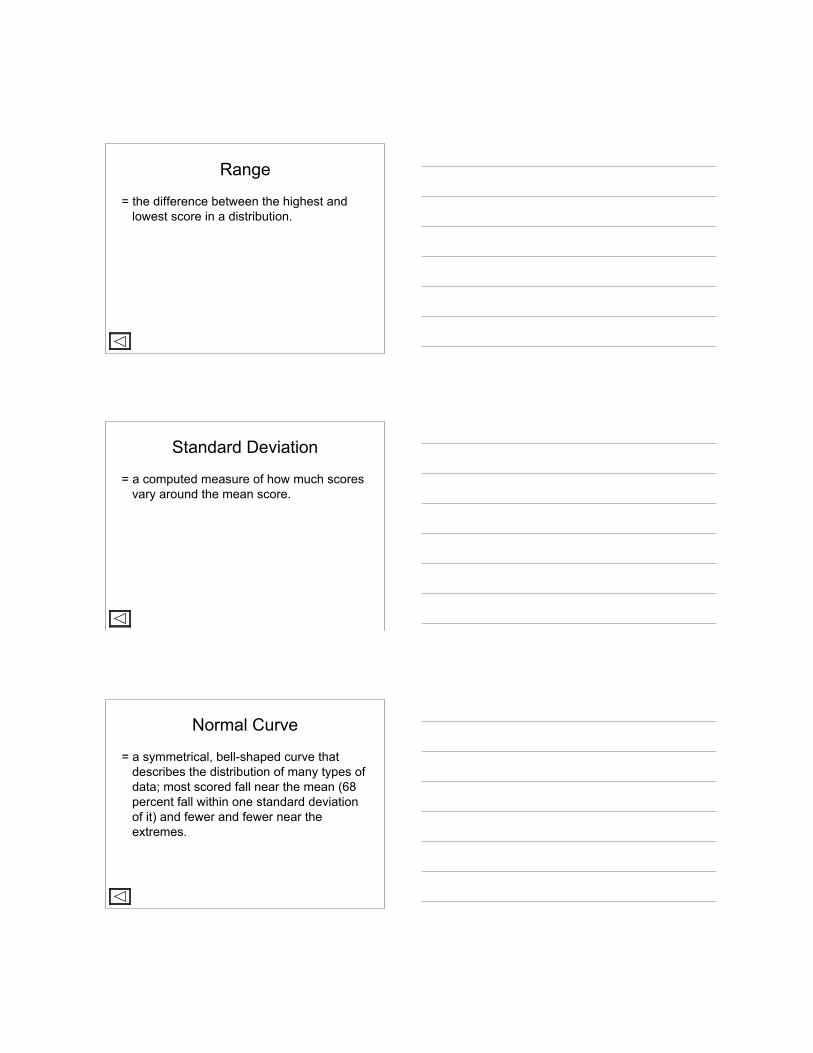
Range
= the difference between the highest andlowest score in a distribution.
Standard Deviation
= a computed measure of how much scoresvary around the mean score.
Normal Curve
= a symmetrical, bell-shaped curve thatdescribes the distribution of many types ofdata; most scored fall near the mean (68percent fall within one standard deviationof it) and fewer and fewer near theextremes.
Statistical Significance
= a statistical statement of how likely it isthat an obtained result occurred bychance.
Culture
= the enduring behavior, ideas, attitudes,and traditions shared by a group of peopleand transmitted from one generation to thenext.
Informed Consent
= an ethical principle that researchparticipants be told enough to enable themto choose whether they wish to participate.
Debriefing
= the postexperimental explanation of astudy, including its purpose and anydeceptions, to its participants.