Embed Size (px)
Citation preview

THINKING ABOUTCYPRESS STOCKby T.J. RodgersPresident and CEOCypress Semiconductor Corporation
Our Computer, HAL, Trades Cypress Stock
We named our computer HAL, and told him to buy Cypress when the price was low and to sell Cypress when the price was high. Thekey is a model for what “high” and “low” mean.
5937.FC.pg8.BC 12/18/02 7:15 AM Page 1

CYPRESS SEMICONDUCTOR 1
THINKING ABOUT CYPRESSSTOCK
by T. J. Rodgers
THE PROBLEM FOR SMALL INVESTORS
This is an analysis of the historical valuation ofCypress stock. It is not a recommended strategyfor trading shares, although the method used tostudy stock valuation entails the use ofhypothetical trading strategies carried out onactual Cypress historical stock price trends.
We have recently had an unprecedentednumber of calls from individual investors whobought Cypress shares near the all-time-highprice of $27.38 per share. Many of the investorsask, “The stock is down 50%; what’s wrong withthe company?” Since Cypress met or exceededWall Street expectations for earnings per share inevery quarter of 1995, the answer relates more toa stock market situation than to a performanceproblem. The intent of this analysis is to providedata and analytical methods to helpshareholders better answer the followingquestions:
� Did I pay too high a price for Cypress when Ipurchased its shares at $20-plus?
� If I choose to hold my shares, how long will Ihave to wait to break even?
� If I trade Cypress shares in the future, howwill I know if the shares are high priced—ora bargain?
No analysis can provide answers toquestions that require a prediction of the future.However, we can analyze data for Cypress’s2,515 trading days over the last ten years, andshow typical trends for the pricing of Cypressstock, and for the time required historically foran investment to produce a capital gain.Shareholders should not expect that an historicalanalysis of share price data can be extendedaccurately into the future (the data itself shows
just that), but this ten-year analysis shouldprovide useful added information for makingtrading decisions.
Semiconductor stock prices declined at theend of 1995 after analysts’ reports on softness inthe semiconductor market. Cypress’s share pricefell following a series of reports detailing the“crash” in prices of our highest volume product,the 256K-bit static RAM. Despite 47% revenuegrowth and 82% earnings growth in 1995, ourP/E ratio fell to 8.3 at year-end. We believed thatour shares had become undervalued, anddecided to buy back $70 million of stock withthe express intent of reselling those shares at ahigher price in the future to raise money forexpansion. At year-end, many analysts advisedinvestors to “hold” (usually a euphemism tosell) our shares—while Cypress was buying.Some of the pessimistic news about thesemiconductor market was carried on financiallyoriented cable TV programs which are literallydisplayed in windows on the computer screensof some stock traders. The problem: How can asmall investor who may always be late inreacting to the latest news on the spot-marketprice for the 256K static RAM hope to competeagainst institutional investors and stock traderswith real-time television hook-ups?
SEMICONDUCTOR ECONOMICS DEFIES COMMON SENSE
The prices for 256K static RAMs are currentlyfalling—but static RAM price “crashes” havebeen a constant in our business since the staticRAM’s invention in 1970. During this period ofdramatic price reductions, the semiconductorindustry has grown from $2.6 billion in 1970 to$144 billion in 1995. We can all appreciate howindustry sales might grow during a period ofdramatic price reductions, but what problemmight that present to a company like Cypress,whose price for a 256K-bit static RAM mightdrop as much as 50% in 1996? (Consider theeffect of an equivalent drop in car prices from$20,000 to $10,000 in one year.) The answer isthat semiconductor companies routinely absorb

2 CYPRESS SEMICONDUCTOR
$0
$5
$10
$15
$20
84 85 86
Cypress Static RAM Average Selling Prices
16K 64K 256KLow volume,high price
87 88 89 90 91 92 93 94 95
High volume,medium price Medium volume,
low price
Although Static RAM prices are unpredictable over periods of a few quarters, over a multi-year timeframe, they have followed verypredictable price reduction curves. Historically, after a period of high pricing, static RAM (SRAM) prices fall over a period ofapproximately four years to $2. We expect the 256K SRAM price to follow this trend and fall from its current $3 price to about $2 in1996. When a new static SRAM is first introduced, low volumes are initially shipped at high prices. After the price drops to approxi-mately $5, and there is not yet competition for the next-generation product, the SRAM peaks in revenue with high volumes ship-ping at medium prices. At the end of the product life cycle, when the bit-price of larger SRAMs is cheaper, the volume on a SRAMdrops, and prices generally drop to the $2 level. A change in the price of a given RAM in a given quarter may mislead an investormaking a trading decision. For example, in the second quarter of 1991, analysts could have submitted conflicting reports that theprice of 16K SRAMs was “in the mud,” the price of 64K RAMs was “a new all-time low,” but the price of 256K SRAMs was “highand rising.” Should an investor buy or sell on that news?
significant price reductions with no long-termnegative impact.
Price reductions measured in percent peryear imply that exponential equations describeour industry’s economics. Exponential equationsare notoriously difficult to comprehend. Evenslow exponential growth rates like that ofpopulation create counter-intuitive results, likethis fact caused by exponential growth: “Morepeople are living on earth today than the totalnumber of people who have lived and died in allhistory.” In an industry that is governed by theimplausible outcomes of exponentialmathematics, how should an investor makequick, rational decisions—especially if thatinvestor’s position is “under water” and theanalysts are strapping on their life jackets?
These data points show the price Cypress has charged fora bit of fast static RAM over time. During the 12 years from1984 to 1996, Cypress cut SRAM bit pricing by over 99%!The price of 256K bits of static RAM dropped from $262 in1984 to $3 in the fourth quarter of 1995 and will probablydrop to about $2 this year. Seemingly large changes, likethe 33% price reduction from $3 to $2, are ordinary eventsin a business based on exponential “learning curves.”
Static RAM Bit Pricing99% Price Reduction
.001
.0001
.00001
.000001
84 86 88 90 92 94 96 98
256K @ $262.00
256K @ $2.00
256K @ $3.00
34%/yr price reduction
Cents/Bit
0.1%
1%
10%
100%

CYPRESS SEMICONDUCTOR 3
DATA-DRIVEN DECISIONS: BUY LOWAND SELL HIGH
Cypress’s share price has behaved like that ofmany good technology companies: up anddown, but up over the long haul. Nonetheless,investors sometimes buy Cypress at aninopportune time, just before the share pricedrops—in many cases, exactly at a time whenmany analysts are pushing the “strong funda-mentals” of Cypress and the semiconductorindustry at large. So-called momentum investors“buy high” and hope for the stock to go higher.In some cases, that strategy traps investors intohaving to hold their shares for years beforerealizing a profit. Or, if the investor’s patience orcourage runs out, the momentum strategy mayend up as a “buy high, sell low” strategy—aloser.
The strategy to buy low and sell high is, touse a phrase from GE’s Jack Welch, “simple, butdifficult.” “Buying low” often means goingagainst analysts’ warnings, and “selling high”often means selling into a bull market; in otherwords “buy low, sell high” often translates into“overcome fear, resist greed”—a very difficulttask for investors or analysts.
VALUATION METHOD
In the semiconductor business, our processyield—the number of chips we ship divided bythe number of chips we start on our lines—canvary from 5% for a new product to 90% for amature product. Our “learning curve,” therapidity with which we move from 5% yield to90% yield, separates winners and losers in ourbusiness. In the semiconductor struggle, wehave learned to act more on what the datapresents, and less on our instincts. This analysisof Cypress share price is based solely on data.The data is available to all investors: daily shareprice and Cypress’s sales for the prior quarter.The analysis eschews the analysis du jour infavor of a statistical look at ten years of dailyCypress trading data. I use this model to helpmake Cypress’s buy-back decisions, and mypersonal trading decisions.
The most common stock valuation methodis the P/E ratio: the price per share, divided byanalysts’ forward-looking earnings per shareestimates. The P/E ratio tends to fluctuatedramatically because it not only depends onpredictions, but also on fluctuations inprofitability. To reduce the volatility inherent in
Cypress Share Price(Adjusted for 2:1 split)
$0
$5
$10
$15
$20
$25
$30
86 87 88 89 90 91 92 93 94 95 96
IPO5/29/86
976 days
$3.13 Low10/26/87
High $27.388/18/95
1/24/96
$4.50
This graph shows Cypress’s daily closing price from its IPO at $4.50 on 5/29/86 throughout the 2,515 trading days through1/24/96. The low price was $3.13 on 10/26/87 and the high price was $27.38 on 8/18/95. Investors who entered the market at aninopportune time sometimes faced long periods with their shares “under water,” as long as 976 trading days (3.8 calendar years at260 trading days per year). This analysis quantifies the conditions that can lead to a long time before a capital gain, or a long “timeto money” (TTM), defined as the time newly purchased shares are “under water” before they turn to profitability. The TTM for somebuys at recent high prices is not yet known.
time to money (TTM)
TTM
?

4 CYPRESS SEMICONDUCTOR
the P/E ratio, I have chosen for a valuationindex the “P/S” ratio, the ratio of our price pershare, divided by our annualized sales per share,where “annualized sales” equals four times therevenue of the last reported quarter. The P/Sratio also equals Cypress’s market capitalizationdivided by its sales. As defined, the P/S rationeeds no predictions, and can be calculated andtrended by any investor.
PS�
price�shareannualized sales�share
�market capitalization
annualized sales
Cypress’s daily P/S ratio for ten yearsappears below. Our P/S ratio droppeddramatically the week of “black Tuesday” inOctober 1987. Since that time, the P/S ratio hasbeen relatively stable with a median value of2.23, and 10th and 90th percentile points of 1.43and 3.46, respectively. One can then sayquantitatively, for example, that Cypress shareswere relatively “low” whenever the P/S ratiowas below 1.43, because on 90% of the 2148trading days between 10/26/87 and 1/24/96,the share price was relatively more highlyvalued.
BUYING LOW
The portion of the P/S curve from 1992 to 1993highlights the period during which Cypressbought back about 10 million shares of its stockbecause—as we said to investors consistently atthe time—we felt our shares were undervalued.We had just restructured after our only loss yearin 1992, and we had a plan to improve in everyquarter of 1993 and 1994. Analysts and investorsdid not believe in that plan, and our stockremained a great investment opportunity for usat less than $5 per share. The dot on the P/Schart highlights the point at which we sold mostof the buy-back shares at a substantial gain inour $110 million convertible subordinateddebenture offering. The proceeds were neededto fund Fab IV in Minnesota. In that sale, we didnot follow the practice to “sell high,” based onthe P/S ratio; we needed the funds for growthand simply took the gain presented to us at thetime. The final highlighted section on the P/Sgraph in late 1995 represents our current $70million buy-back program—again at “buy low”prices. We are committed to the current
Cypress P/S Ratio
Cypress’s “P/S” ratio is the price per share of Cypress stock divided by the sales per share of Cypress stock, based on the annual-ized sales of the last reported quarter. Since October 1987, Cypress’s P/S ratio has been relatively stable, with a median value of2.23, and 10th and 90th percentile points of 1.43 and 3.46, respectively. Cypress has bought back its own shares on two occa-sions when this P/S ratio was well below the median. The shares from the first buy-back were sold back into the market at a sub-stantial capital gain to build Fab IV without added dilution to shareholders. Note that the P/S ratio before October 1987 was higherthan it is now, and that an analysis made during that time would have been a poor predictor of the future. Big, unexpected changeslike Black Tuesday can render historical analyses useless for prediction.
86 87 88 89 90 91 92 93 94 95 961
2
3
4
5
6
7
8
9
1.43
2.23
3.46
Buy $46,0849,546 @ $4.83
Sell $92,3037,940 @ $11.63
Buy $62,1654,826 @ $12.88
LOW
MEDIAN
HIGH
10/26/87 1/24/96

CYPRESS SEMICONDUCTOR 5
buy-back program because we believe in ourfuture.
We believe:
� Total semiconductor sales will grow more inabsolute dollars in the next 5 years than theyhave in all of the last 35 years (as do themajority of semiconductor analysts).
� Cypress can continue to meet its plan to growfaster than the market, as we have in nine ofthe last eleven years.
� Our buy-back program will therefore provideus with the funds for plant and equipmentwith less dilution.
Of course, the challenge for us is to turn ourbeliefs into reality.
The analysts generally believe:
� The slow PC market at Christmas, and theproblems it caused semiconductorcompanies, should be a sign of caution.
� There may be over-capacity in our staticRAM market, and in the semiconductormarket in general.
� Despite pervasive bullish five-year forecastsfor the total semiconductor market, theworries and rumors surrounding the currentmarket make investment unwise.
Consequently, many analysts haverecommended to “hold” our shares recently,which means, we believe, to “sell low.” Cypressis acting on the reverse strategy to “buy low,”based on our plans for the future and an analysisof our share price history.
SELLING HIGH: HAL, THE INVESTOR
The time it takes to make the first incrementalgain on an investment in Cypress’s shares maybe referred to as the “time to money,” or TTM.The time to money for every Cypress tradingday is graphed below as a function of the P/Sratio. The insert explains the graph: for buyerswho bought Cypress on one of the 8 days in thelast eight years when the P/S ratio was 2.23, 3
1.10 1.30 1.50 1.70 1.90 2.10 2.30 2.50 2.70 2.90 3.10 3.30 3.50 3.70 3.90 4.10 4.30 4.50 4.70 4.90 5.10
Historical Time to Money
This graph shows the time to money for purchases for 2122 trading days in the analysis as a function of the P/S ratio on the day ofpurchase. (The time to money for the other 26 days is not yet known.) The inset shows graphically the time to money for all pur-chases made on trading days when the P/S ratio was 2.23. The complete graph shows that although most trades yielded a shorttime to money, there was a significant possibility of a very long time to money for purchases made above the median P/S value of2.23. The longest time to money of 976 days occurred for buyers who bought Cypress shares at a very high P/S ratio of 3.40.
2.230
2
4
6
8
10
0
100
200
300
400
500
600
700
800
900
1000976 days
Trading Days
P/S Ratio
19
MomentumInvestors
ValueInvestors
2.23 (50%) 2.72 (75%)

6 CYPRESS SEMICONDUCTOR
saw the stock go up the next day, 1 saw the stockgo up in two days, and the least fortunateinvestor waited for 19 days until the stock closedabove its purchase price. The complete graph,therefore, represents the time to money for everytrading day, sorted by P/S ratio. The time tomoney has consistently been below 30 days, butwaits of hundreds of days for a capital gain haveoccurred. Long TTM times were more likely tohappen to investors who bought at a high P/Sratio; i.e., for momentum investors.
On the other hand, buyers who bought low,as defined by a P/S ratio equal to or less thanthe median of 2.23 or less, achieved a time tomoney of 130 trading days or less with a 99.2%probability, as shown below. The future cannotalways be predicted from history. For example,using the P/S ratio trends from May 1986 toOctober 1987 (before the steep decline on theP/S ratio graph) would not have been goodinvestment predictors after October 1987. Butafter that point and through January 1996, theP/S ratio was reasonably stable, and simpleinvestment rules would have been effective in
making trading decisions. The algorithmictrading rules outlined below probably wouldhave been preferable to momentum investingduring the period of the study for the smallinvestor who was unable to react quickly tosemiconductor news and rumors on “the street.”
We named our computer HAL, andprogrammed him to make trades in Cypressshares according to our predetermined rulesover an 8.3-year period from 10/26/87 to themost recent trading day in this analysis,1/24/96. For the first simulation, we gave HALthese instructions:
� Start with $100,
� invest the cash at 5% money market,
� buy low: put all cash into the market for P/S < 1.43 (10th percentile),
� sell high: put all cash back into the moneymarket for P/S > 3.46 (90th percentile),
� pay $0.10 for each share traded,
� calculate annual return based on combinedtrading gains and money market returns,
1.10 1.20 1.30 1.40 1.50 1.60 1.70 1.80 1.90 2.00 2.10 2.20
For those investors who bought low, when the share price was below the median P/S ratio of 2.23, there was 95.4% chance overthe eight-year period analyzed that profit could be achieved in one quarter or less (65 trading days). There was a 99.2% probabilityof achieving a gain within two quarters. Only 0.65% of the buys resulted in a time to money of over one year, and in no case wasthe time greater than 18 months.
Historical Time to MoneyValue Investors
P/S Ratio
95.4%
99.2%
0.65%
Trading Days
65
130
195
260
325
390361 days

CYPRESS SEMICONDUCTOR 7
� but do not count the last trade if a selltransaction is pending. (This rule gaveroughly equivalent results to a forced sell onthe last day of the study.)
With these instructions, HAL made onlytwo trades in eight years:
Action DateSharePrice
#Shares Value
Deposit 10/26/87 $ 3.13 — $100.00
Withdraw 4/13/92 $ 5.19 — $124.25
Buy 4/13/92 $ 5.19 23.5 $121.91
Sell 5/23/95 $18.250 23.5 $426.53
Deposit 5/23/95 $18.250 — $426.53
Withdraw 1/24/96 $14.375 — $440.29
That trade provided a 49.7% per yearcapital gain over the holding period, and a19.7% annualized capital gain over theeight-year period, when blended with the 5%money market rate. The capital gain was great,but few investors would want to follow astrategy that required watching a stock for more
than four years before investing for the firsttime. The computer then ran approximately1,000 scenarios for rules-based investmentidentical to the one above, but with differentbuy/sell criteria.
One successful rules-based strategy was to“buy below average” and “sell above average.”That strategy was designed to buy any time theshares were below the 50th percentile point ofP/S = 2.23, and to sell at some higher P/S ratio.The graph below shows HAL’s actual trades forthe Buy P/S=2.25, Sell P/S=2.75 strategy, whichyielded a 26.4% per year gain by making fivehigh-gain trades in eight years. The table on thenext page shows that the average “buybelow/sell above average” strategy worked fora wide variety of cases to produce an annualreturn of approximately 25%. During the same10/26/87 – 1/24/96 time frame, the mostfavorable “buy and hold” strategy, whichallowed for purchasing shares at the all-time lowprice of $3.13, yielded 19.7% per year, while theS & P 500 index appreciated 12.9% per year.
HAL’s TradesBuy P/S=2.25, Sell P/S=2.75
$0
$5
$10
$15
$20
$25
$30
86 87 88 89 90 91 92 93 94 95 96
Share Price
Key:Buy$100
Sell$125
$102
$125
$125
$167
$168
$231
$233
$384
$397
$657
HAL made five buy-sell transactions when instructed to buy at a P/S < 2.25 and sell at a P/S > 2.75. He waited for a year before hestarted to invest, then consummated four relatively quick trades to take his bank from $102 to $384. His final investment took over 3years to pay off, and was “under water” for 11/2 years. The bank on 1/24/96 was $689.23, netting a 26.4% annual gain over 8.3 years.Simply buying $100 of Cypress stock on 10/26/87 and holding it continuously to the end of the simulation would have yielded a bankof only $442.64 and an annual gain of 19.7%. The trading strategy would have been superior to the buy-and-hold strategy, even forinvestors who bought on 10/26/87, Cypress’s all-time low. During the same 10/26/87–1/24/96 period, the S&P 500 index increasedfrom 227.67 to 619.96, or 12.9% per year.
$689
$100
Enter money market
Exit money market
10/26/87
1/24/96

8 CYPRESS SEMICONDUCTOR
Statistics for the “Buy Below Average/Sell Above Average” Trading Strategy
Buy P/S Sell P/S # Trades $ @ EndAnnualReturn
Days in Market
TTMBuy P/S Sell P/S # Trades $ @ EndAnnualReturn Average Longest TTM
2.25 2.75 10 $689.23 26.4% 274 828 361
2.25 2.65 12 $655.86 25.7% 221 825 361
2.25 2.55 14 $653.28 25.6% 177 737 307
2.25 2.45 22 $692.51 26.5% 107 728 307
2.25 2.35 34 $539.79 22.7% 66 682 360
Five simulations were performed on Cypress's historical share price data in which HAL bought Cypress shares any time they were pricedbelow a P/S ratio of 2.25 (near the median of 2.23). In the simulations, HAL sold the shares at various Sell P/S ratios higher than the BuyP/S ratio by 0.5, 0.4, 0.3, 0.2 and 0.1. The 2.25/2.75 strategy represented a “large capital gain” strategy demanding a 22.2% gain or moreper trade. The 2.25/2.35 strategy called for a quick profit—to sell when the capital gain on a trade was as low as only 4.4%. As the requiredcapital gain increased: 1) the annual return remained roughly constant at about 25%, 2) the number of trades went down dramatically,3) the average time in the market for each trade increased dramatically, but 4) the time to money (TTM, the longest period for which thestock was “under water”) remained almost constant. In these simulations, the hypothetical investors had to wait for the TTM time indicatedin order to achieve the annual return indicated. Any hypothetical investor who was not willing to wait for the TTM time would have soldshares at a loss in at least one of the trades in the simulation. In the simulations above, investors who would not have been preparedto hold as long as 361 trading days should not have invested in Cypress stock.
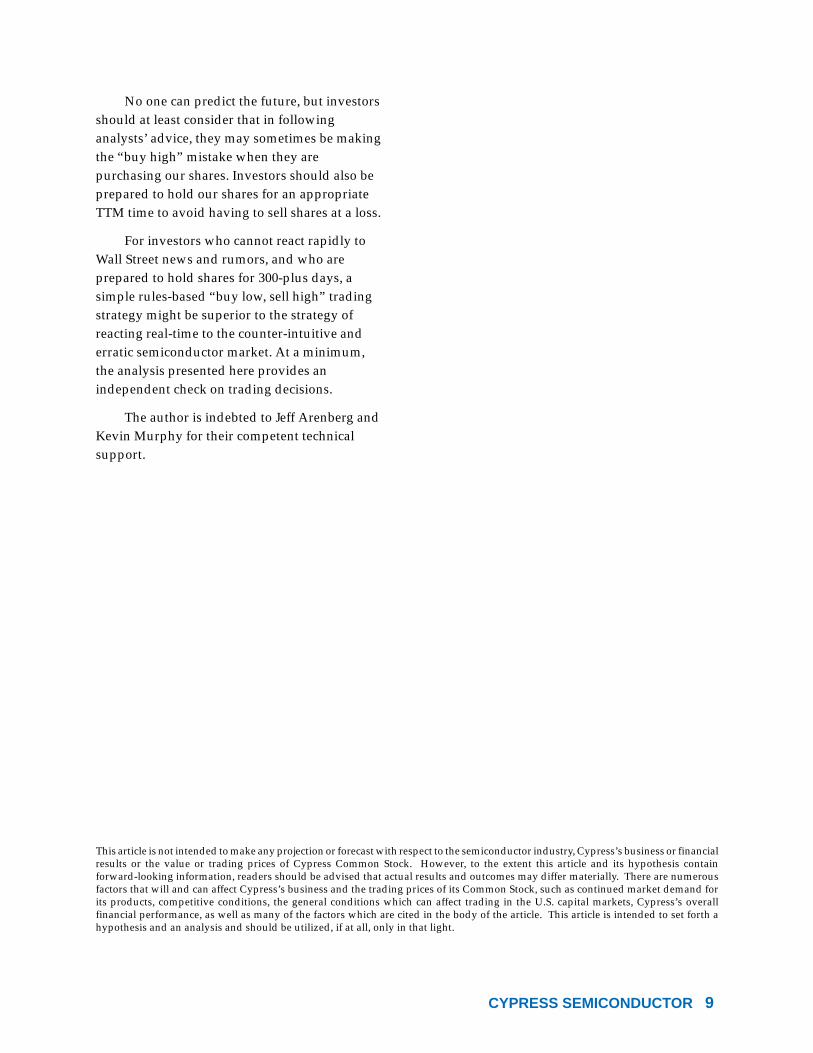
A second set of simulations showed that astrategy to buy low and sell high would haveyielded a reasonable gain over a very widevariety of buy and sell points in the middle ofthe P/S range. HAL ran 330 simulations with theBuy P/S between 1.6 and 3.2, and the Sell P/Sratio higher than the Buy P/S ratio by 0.4 to 1.75.
These were large-gain scenarios with thecapital gain per trade ranging from more than10% to over 100%. The total range of annualreturn figures for these widely varying strategieswas stable, with a minimum gain of 16.8%, amaximum gain of 33.0%, and an average gain of23.7%. These yields are graphed below.
Annual Return for 330 Simulations
HAL ran 330 different hypothetical historical investment scenarios. Shares were purchased at Buy P/S ratios ranging from 1.60 to 3.20.The shares were sold at the Buy P/S plus a P/S gain of 0.4 to 1.75. The best scenario produced a 33.0% annual return; the worst, a 16.8%annual return. The average of all 330 simulations was an annual return of 23.7%. Buy P/S ratios in the 1.60–2.25 range resulted in aworst-case time “under water” of 2 to 361 trading days. Although the return was comparable, Buy P/S ratios in the 2.30–3.20 rangelengthened TTM times to as long as 781 trading days, or as much as 3 years “under water.”
CYPRESS SEMICONDUCTOR 9
No one can predict the future, but investorsshould at least consider that in followinganalysts’ advice, they may sometimes be makingthe “buy high” mistake when they arepurchasing our shares. Investors should also beprepared to hold our shares for an appropriateTTM time to avoid having to sell shares at a loss.
For investors who cannot react rapidly toWall Street news and rumors, and who areprepared to hold shares for 300-plus days, asimple rules-based “buy low, sell high” tradingstrategy might be superior to the strategy ofreacting real-time to the counter-intuitive anderratic semiconductor market. At a minimum,the analysis presented here provides anindependent check on trading decisions.
The author is indebted to Jeff Arenberg andKevin Murphy for their competent technicalsupport.
This article is not intended to make any projection or forecast with respect to the semiconductor industry, Cypress’s business or financialresults or the value or trading prices of Cypress Common Stock. However, to the extent this article and its hypothesis containforward-looking information, readers should be advised that actual results and outcomes may differ materially. There are numerousfactors that will and can affect Cypress’s business and the trading prices of its Common Stock, such as continued market demand forits products, competitive conditions, the general conditions which can affect trading in the U.S. capital markets, Cypress’s overallfinancial performance, as well as many of the factors which are cited in the body of the article. This article is intended to set forth ahypothesis and an analysis and should be utilized, if at all, only in that light.

3901 North First Street, San Jose, CA 95134. Phone: (408) 943-2600. Fax: (408) 943-2796. http://www.cypress.com
5937.FC.pg8.BC 12/18/02 7:15 AM Page 3