Embed Size (px)
Citation preview

arX
iv:1
207.
5576
v2 [
astr
o-ph
.GA
] 2
0 D
ec 2
012
Mon. Not. R. Astron. Soc. 000, 1–12 (201x) Printed 2 May 2014 (MN LATEX style file v2.2)
The star cluster formation history of the LMC
H. Baumgardt1⋆, G. Parmentier2,3, P. Anders4 and E. K. Grebel51School of Mathematics and Physics, University of Queensland, St. Lucia, QLD 4072, Australia2Max-Planck-Institut fur Radioastronomie, Auf dem Hugel 69, D-53121 Bonn, Germany3Argelander-Institut fur Astronomie, Universitat Bonn, Auf dem Hugel 71, D-53121 Bonn, Germany4Kavli Institute for Astronomy and Astrophysics, Peking University, Yi He Yuan Lu 5, Hai Dian District, Beijing 100871, China5 Astronomisches Rechen-Institut, Zentrum fur Astronomie der Universitat Heidelberg, Monchhofstrasse 12 - 14, D-69120 Heidelberg, Germany
Accepted 2012 xx xx. Received 2012 xx xx; in original form 2012 xx xx
ABSTRACT
The Large Magellanic Cloud is one of the nearest galaxies to us and is one of only fewgalaxies where the star formation history can be determined from studying resolvedstellar populations. We have compiled a new catalogue of ages, luminosities and massesof LMC star clusters and used it to determine the age distribution and dissolutionrate of LMC star clusters. We find that the frequency of massive clusters with massesM > 5000 M⊙ is almost constant between 10 and 200 Myr, showing that the influenceof residual gas expulsion is limited to the first 10 Myr of cluster evolution or clustersless massive than 5000 M⊙. Comparing the cluster frequency in that interval withthe absolute star formation rate, we find that about 15% of all stars in the LMCwere formed in long-lived star clusters that survive for more than 10 Myr. We alsofind that the mass function of LMC clusters younger than 109 Gyr can be fitted by apower-law mass function N(m) ∼ m−α with slope α = 2.3, while older clusters followa significantly shallower slope and interpret this is a sign of either incompleteness orthe ongoing dissolution of low-mass clusters. Our data shows that for ages older than200 Myr, about 90% of all clusters are lost per dex of lifetime. The implied clusterdissolution rate is significantly faster than that based on analytic estimates and N -body simulations. Our cluster age data finally shows evidence for a burst in clusterformation about 109 yrs ago, but little evidence for bursts at other ages.
Key words: galaxies: star clusters: general — Magellanic Clouds — galaxies: kine-matics and dynamics
1 INTRODUCTION
Open clusters are important test beds for star formation andstellar evolution theories since they provide statistically sig-nificant samples of stars of known distance, age and metallic-ity. Especially useful are star clusters in Local Group galax-ies, which are close enough so that they can be resolvedinto individual stars and therefore allow their age and massto be determined more accurately than based on integratedphotometry as is done for more distant clusters.
The Large Magellanic Cloud (LMC) is one of the near-est galaxies to the Milky Way and contains several thousandstar clusters (Bica et al. 2008) with ages ranging from a fewMyr to a Hubble time. The large cluster system togetherwith its proximity and the low extinction due to the low in-clination of the LMC disc make the LMC cluster system anideal test case to study the relation between star formationand cluster formation and the dissolution of star clusters.
⋆ E-mail: [email protected]
Two main epochs of cluster formation have been foundin the LMC, separated by an age gap of several Gyr(Bertelli et al. 1992; Girardi et al. 1995; Olszewski et al.1996). The first star formation episode led to the formationof globular clusters and ended about 10 Gyr ago, while thesecond epoch started about 4 Gyr ago and is still ongoing.Within the last few Gyrs, several short peaks of star forma-tion have been found (e.g. Harris & Zaritsky 2009), whichmight have been triggered by close encounters between theLarge and Small Magellanic Cloud or between the LMC andthe Milky Way (Pietrzynski & Udalski 2000; Chiosi et al.2006). Similar peaks have also been found in the clusterformation rate and at least during the last Gyr, peaks instar cluster formation correspond to similar peaks that areseen in the field star formation rate (Maschberger & Kroupa2011).
The mass function of star clusters in the LMC is gener-ally found to follow a power-law N(m) ∼ M−α, although thevalue of the power-law exponent α varies considerably be-tween different authors. Chandar, Fall & Whitmore (2010)

2 Baumgardt et al.
found that the mass function of LMC clusters more mas-sive than 103 M⊙ can be fitted with a power-law slopeα = 1.8 ± 0.2 without any evidence for a change of thisvalue with cluster age up to 109 yrs. de Grijs & Anders(2006) found that cluster older than 100 Myr can be fit-ted by a power-law mass function with slope α = 2, whileyounger clusters follow significantly flatter mass functions.A slope between 2 and 2.4 was also found by Hunter et al.(2003) for clusters more massive than a few times 103 M⊙
at T = 1 Gyr and a few times 102 M⊙ at T < 10 Myr inthe combined cluster sample of the LMC and SMC. On theother hand, from their reanalysis of the Hunter et al. clustersample, Popescu et al. (2012) found a relatively small valueof only α = 1.5 to 1.6 as the average slope for all clustersthat are more massive than 103 M⊙ and less than a few Gyrold.
Star clusters are prone to a number of dissolutionmechanisms, including two-body relaxation and an externaltidal field (Vesperini & Heggie 1997; Baumgardt & Makino2003), disc and bulge shocking (Ostriker et al. 1972;Gnedin & Ostriker 1997) and encounters with giant molec-ular clouds (Spitzer 1958; Wielen 1985; Gieles et al. 2006a).Boutloukos & Lamers (2002) found evidence for ongoing dis-solution of star clusters in the LMC with a characteris-tic lifetime of log(tdis4 /yr)=9.7 ± 0.3 for a 104 M⊙ cluster,significantly longer than the corresponding value found byLamers et al. (2005) for a sample of nearby galaxies. Thelong characteristic timescale implies that the high mass endof the cluster mass function in the LMC has stayed virtuallyunchanged since the time of its formation. Using the samedata but a more careful treatment of the incompletenesslimit, Parmentier & de Grijs (2008) showed that the clusterdisruption time scale is actually highly uncertain and onlya lower limit of tdis4 = 1 Gyr can be given, since clustersat the low-mass end fall below the completeness limit ofHunter et al. (2003) before they are destroyed.
Apart from the absolute time scale of cluster dissolu-tion, another important question is whether the timescalefor cluster dissolution depends on the cluster mass. Usingthe cluster sample of Hunter et al. (2003) and based on theobserved relation between the mass of the most massivecluster and the sampled age range, Gieles & Bastian (2008)found evidence for mass dependent cluster dissolution forages larger than 108 yrs, but mass independent dissolutionfor smaller ages. Chandar, Fall & Whitmore (2010) on theother hand found no evidence for mass dependent clusterdissolution up to 109 yrs when looking at the evolution ofthe mass function of LMC and SMC star clusters.
Most of the above papers are based on data fromthe cluster catalogue of Hunter et al. (2003), who de-termined properties of 939 clusters in the SMC andLMC based on ground-based CCD photometry. Re-cently a wealth of new data has been obtained forLMC star clusters by Glatt, Grebel & Koch (2010) andPopescu, Hanson & Elmegreen (2012). Glatt et al. have pre-sented ages and luminosities of almost 1200 star clustersin the LMC using data from the Magellanic Cloud Photo-metric Surveys (Zaritsky et al. 2002, 2004, MCPS). In ad-dition, Popescu et al. (2012) have presented new age andmass estimates based on integrated colors for the clusters ofHunter et al. (2003) taking into account random samplingof the IMF and stochastic effects due to bright stars.
Figure 1. Position of star clusters in the LMC from recent largesurveys plus a few additional clusters from the literature. OnlyGlatt et al. (2010) and Mackey & Gilmore (2003) cover the wholeLMC, while all other surveys are restricted to certain parts of theLMC.
In this paper, we present a new derivation of the massand age distribution of LMC clusters and use it to studythe relation between star and star cluster formation anddifferent cluster dissolution models. Our paper is organisedas follows: In Sec. 2 we present the observational data forLMC clusters and derive a combined catalogue of ages andmasses for massive LMC clusters. We use this catalogue inSec. 3 to calculate the age distribution and mass function ofLMC clusters. In Sec. 4 we present a discussion of the vari-ous cluster dissolution mechanisms and compare predictionswith the observational data in Sec. 5. Our conclusions arefinally presented in Sec. 6.
2 OBSERVATIONAL DATA
We use four recent compilations of LMC star cluster param-eters to derive a combined catalogue for LMC clusters. Ourfirst catalogue is the recent work of Glatt, Grebel & Koch(2010), who used data from the Magellanic Cloud Photo-metric Surveys together with isochrone fitting to derive agesand luminosities for 1193 populous star clusters in a 64 deg2
area of the LMC. The cluster identifications, sizes, and po-sitions were taken from the catalogue of Bica et al. (2008).Since the MCPS becomes highly incomplete below V = 24,the Glatt et al. data become incomplete for ages larger than500 Myr and do not contain any clusters older than T = 1Gyr. Glatt et al. also did not determine ages for clustersyounger than about 10 Myr to avoid confusion between starclusters and unbound stellar associations.
The second data set that we use is the catalogue ofPietrzynski & Udalski (2000), who used BVI data from theOGLE II microlensing experiment (Udalski et al. 1998) to-gether with isochrone fitting to derive ages of about 600 star

The star cluster formation history of the LMC 3
clusters which are located in the central parts of the LMCand are younger than 1.2 Gyr. Since Pietrzynski & Udal-ski did not derive cluster luminosities or cluster masses, wecould only use their data if luminosity information was avail-able from another source. Our third catalogue is the clus-ter catalogue presented by Hunter et al. (2003). The Hunteret al. catalogue contains data for about 746 different LMCclusters, limited to the inner regions of the LMC and toabsolute luminosities brighter than MV = −3.5. New agedeterminations for the cluster in the Hunter et al. cataloguewere presented by de Grijs & Anders (2006) from broad-band spectral energy distribution fitting of the integratedUBVR photometry given by Hunter et al. (2003) and re-cently also Popescu, Hanson & Elmegreen (2012). Popescuet al. use the stellar cluster analysis package MASSCLEANage
to derive new ages and masses for the Hunter et al. clus-ter sample. The advantage of MASSCLEANage is that it allowsto take into account stochastic fluctuations in cluster colorsand magnitudes which arise from the finite number of starspresent in clusters. We average the ages for clusters whichappear multiple times in the Popescu et al. sample and areleft with a list of 746 unique clusters which are almost iden-tical to those analysed by de Grijs & Anders.
In order to increase the accuracy of the age and massdeterminations especially for bright clusters, we also includeage determinations from the literature. In particular, we usethe ages recently derived by Milone et al. (2009) for massiveintermediate-age star clusters from colour-magnitude fittingand the age data compiled by Mackey & Gilmore (2003) for53 massive LMC clusters. Many of the ages in these papersare derived from HST data reaching several magnitudes be-low the turnover and are therefore significantly more accu-rate than the ages derived in the above surveys.
Fig. 1 depicts the positions of all clusters from theabove catalogues. Since the list of clusters in de Grijs& Anders is nearly identical to that of Popescu et al.,we do not show them separately. It can be seen thatthe Glatt et al. data covers most of the LMC, whilede Grijs & Anders (2006), Popescu, Hanson & Elmegreen(2012) and Pietrzynski & Udalski (2000) catalogues are re-stricted to varying parts of the LMC. Since the LMC showsevidence for different regions having undergone different starformation histories (Glatt, Grebel & Koch 2010), it is clearthat only a combination of all catalogues can give a completepicture of the LMC cluster population.
Fig. 2 and Table 1 compare the ages of star clustersderived in the studies by Pietrzynski & Udalski, de Grijs &Anders, Glatt et al., and Popescu et al. with one another forthe clusters common to the different studies. The de Grijs &Anders ages are in good agreement with the OGLE II agesbut disagree significantly with the Glatt et al. and Popescuet al. ages, since clusters with T < 108 yrs in de Grijs &Anders tend on average to be younger than found by theother authors, while clusters with T > 108 yrs are on averageolder in de Grijs & Anders than in the other catalogues.As noted by Popescu et al., this difference could be dueto the absence of single red giants or supergiants in youngclusters, which make the cluster appear bluer and thereforeyounger. The Glatt et al. data shows fairly good agreementwith Popescu et al. It is also in rough agreement with theOGLE II data, however the number of clusters in common istoo small to make a meaningful comparison. The OGLE II
ages have a small offset by about log T = 0.2 dex comparedwith the de Grijs & Anders ages, which might also be presentin the comparison with the Popescu et al. data. As notedby de Grijs & Anders, this can be explained by the smallerLMC distance modulus of (m − M) = 18.23 adopted byPietrzynski & Udalski, compared to the value of (m−M) =18.50 used by most other authors. Placing the LMC at asmaller distance decreases the absolute luminosities of thestars and the turn-over region in the CMD, and thereforemakes the clusters appear older. In order to correct for thisbias, we increase the OGLE II ages by 0.2 dex.
From the comparison of the cluster ages shown in Fig.2, we calculate Pearson r coefficients and best-fitting linearrelations log age1 = α log age2 + β and the standard devia-tion in log T about this best-fitting relation. The results areshown in Table 1, which also includes a comparison with theliterature data. The relatively large discrepancy between thede Grijs & Anders data on the one hand and Glatt et al. andPopescu et al. on the other is again apparent. Since Glattet al. use CMD fitting while Popescu et al. work with inte-grated colors, the difference cannot result from the methodused and is more likely due to stochastic effects influencingthe integrated colors. Given the Pearson r coefficients, theages from OGLE II seem to better agree with de Grijs &Anders ages than with either Glatt et al. or Popescu et al.However the slope α of the best-fitting relation for OGLE IIis in all cases compatible with unity. The literature samplehas only few clusters in common with the other studies, so itis hard to make a meaningful comparison, but the Pearsonr coefficients as well as the slopes α are mostly compatiblewith unity within the error bars, indicating good agreement.The final column of Table 1 shows that the RMS deviationin log t between the different catalogues is typically around0.20 to 0.30, a value that also agrees with the age uncertain-ties of individual clusters (see Table 2).
To obtain a complete catalogue of LMC clusters, wecombine the clusters from the above data sets, excludingduplicate entries through a coordinate based search witha search radius of 20”, which corresponds to a distance of5 pc at an assumed LMC distance of 50 kpc. When assign-ing ages to the clusters, we give the highest priority to theages given in Milone et al. (2009) and Mackey & Gilmore(2003), followed by Glatt et al. (2010), the OGLE II data,and finally Popescu et al. (2012). We ignore the de Grijs &Anders dataset due to its significant deviation against theGlatt et al. and Popescu et al. ages. Since we need cluster lu-minosities to calculate cluster masses and OGLE II has onlyage information, we include clusters from OGLE II only ifinformation on the total cluster luminosity is available fromPopescu et al. (2012).
Cluster masses are then derived from the MV luminosi-ties by calculatingM/LV values using the Padova isochronesfor Z = 0.008. These isochrones are based on the Marigoet al. (2008) stellar evolution tracks with corrections fromcase A in Girardi et al. (2010), assuming a Kroupa (1998)stellar mass function corrected for binaries. The resultingcluster masses show good agreement with the cluster massescalculated by Popescu et al. for the clusters which we takefrom their catalogue. As shown by Anders et al. (2009), clus-ter dissolution can affect the cluster M/L ratios since low-mass stars are lost preferentially, however the resulting effect

4 Baumgardt et al.
Figure 2. Comparison of age determinations from Pietrzynski & Udalski (2000) (OGLE II), de Grijs & Anders (2006), Glatt et al.(2010) and Popescu et al. (2012). Crosses denote the positions of individual clusters. Solid lines show lines of equal ages, while dashedlines give the best-fitting linear relation. Shown are also the Pearson r coefficients and the slope α of the best fitting relation for thedifferent comparisons.
on the M/L ratios is less than 50% until the cluster is closeto dissolution.
Fig. 3 depicts the location of all clusters from the com-bined data set in a mass vs. age diagram. The dotted lineshows the 50% completeness limit of MV = −3.5 fromHunter et al. (2003). The majority of clusters have ages be-tween 107 to 109 yrs and masses of a few hundred to a fewthousand M⊙. The lack of clusters younger than 107 yrs isdue to the fact that such clusters are often obscured by dustclouds and are also easy to confuse with unbound associa-tions and were therefore not analysed by Glatt et al. andOGLE II. The Glatt et al. and OGLE II samples also donot contain clusters older than ≈ 109 yrs, since neither theOGLE nor the MCPS photometry is deep enough to permit
age dating such clusters from resolved CMDs. This could inpart explain the absence of clusters above 109 yrs. In addi-tion, the 50% completeness limit of the Hunter et al. samplereaches several thousand M⊙ for ages larger than 109 yrs. Inorder to work with a sample that is as complete as possible,we therefore restrict our analysis to clusters older than 107
yrs and brighter thanMV = −3.5. For clusters of a few thou-sand stars, a single giant star can have a luminosity exceed-ing that of the rest of the cluster, leading to large fluctua-tions in the clusters’ M/L ratio (Piskunov et al. 2011). Thismakes mass estimates based on cluster luminosity highlyuncertain. We therefore also restrict our analysis to clustersmore massive than 5000 M⊙. For clusters of this mass andages larger than 107 yrs, Fig. 11 in Piskunov et al. (2011)

The star cluster formation history of the LMC 5
Table 1. Number of clusters NCl in common between different catalogues, Pearson r coefficient, slope of best-fitting relation α in anlog(age) vs. log(age) diagram, and the residual scatter log T about this best-fitting relation for all data sets.
Data set 1 Data set 2 NCl Pearson Slope Scatter Data set 1 Data set 2 NCl Pearson Slope Scatterr α <∆ log T > r α <∆log T >
OGLE II de Grijs&Anders 198 0.75 0.95± 0.19 0.28 de Grijs&Anders OGLE II 198 0.75 1.05± 0.21 0.28OGLE II Glatt et al. 29 0.44 0.75± 1.38 0.26 de Grijs&Anders Glatt et al. 294 0.46 0.38± 0.11 0.33OGLE II Popescu et al. 191 0.54 0.84± 0.22 0.37 de Grijs&Anders Popescu et al. 745 0.68 0.73± 0.07 0.62OGLE II Literature val. 11 0.96 2.07± 1.40 0.13 de Grijs&Anders Literature val. 18 0.91 1.60± 0.67 0.27
Glatt et al. OGLE II 29 0.44 1.33± 1.81 0.26 Popescu et al. OGLE II 191 0.54 1.19± 0.31 0.37Glatt et al. de Grijs&Anders 294 0.46 2.61± 0.83 0.33 Popescu et al. Glatt et al. 293 0.77 0.74± 0.16 0.20Glatt et al. Popescu et al. 293 0.77 1.35± 0.30 0.20 Popescu et al. de Grijs&Anders 745 0.68 1.37± 0.13 0.62
Glatt et al. Literature val. 18 0.70 1.71± 1.56 0.30 Popescu et al. Literature val. 18 0.07 3.99± 0.67 0.82
shows that stochastic effects due to bright giants change theM/L ratio in the V band by less than 20% compared toa model with a continuous IMF. Comparable mass uncer-tainties are also found by Popescu et al. for clusters moremassive than a few thousand solar masses. The resulting se-lection limit is shown in Fig. 3 by dashed lines. Out of atotal number of 1649 unique clusters in the four data sets,322 clusters pass our selection criteria. Their basic parame-ters (names, positions, total MV luminosities, ages, age un-certainties and masses) are listed in Table 2. Although con-taining only the brightest and most massive clusters in theLMC, none of the individual catalogues is complete withinour age and mass ranges: Of the 322 clusters in our finalsample, only 86 were listed in OGLE II, 85 in Glatt et al.and 194 in Popescu et al. In the following analysis, we re-strict ourselves to the area of the LMC covered by Glattet al., which is roughly located between 4.7 and 6.1 hoursin right ascension and -65 and -72.5 degrees in declination.This region contains 294 clusters of our final sample and isidentical to the region for which Harris & Zaritsky (2009)determined the field star formation rate, which we will com-pare to the cluster formation rate in the next section.
3 RESULTS
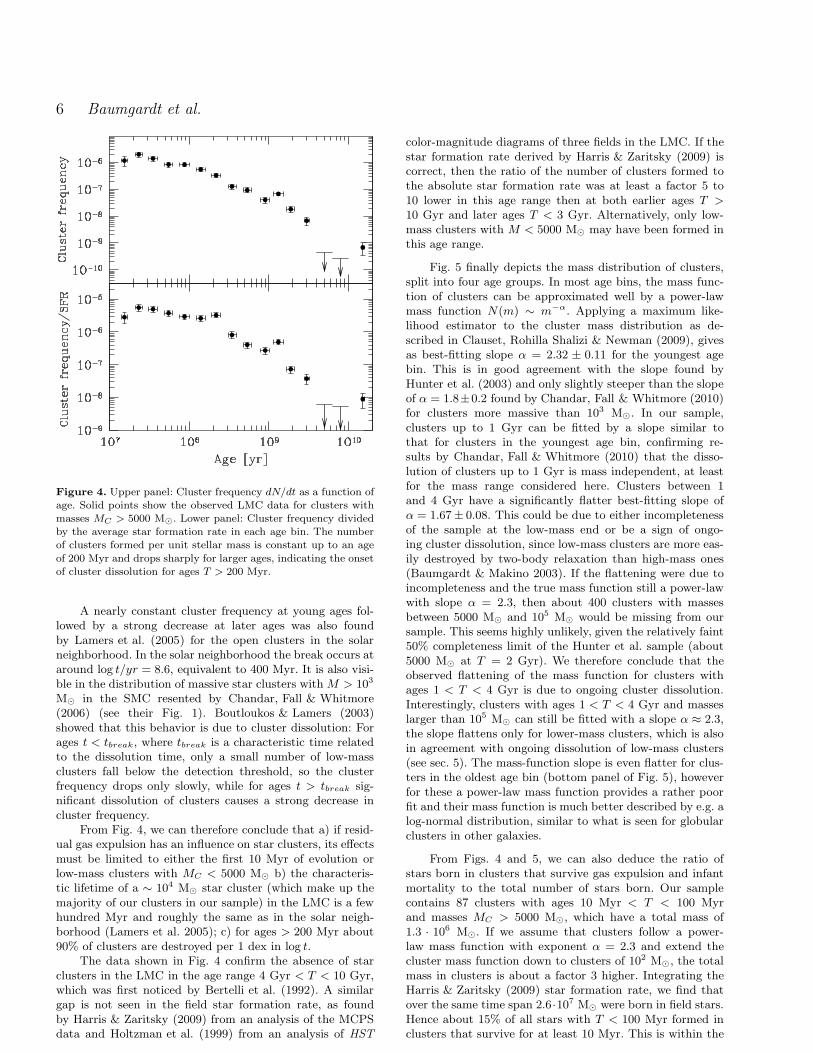
Fig. 4 depicts the cluster frequency dN/dt, defined as thenumber of clusters per time unit, as a function of age forclusters with present masses MC > 5000 M⊙ and magni-tudes brighter than MV = −3.5. It can be seen that theobserved frequency drops steadily as a function of age. Thedrop is relatively small during the first 100 Myr since thedata point at T=150 Myr is only a factor of two lower thanthe one at the youngest age. The data show clear evidencefor a peak in cluster frequency at T = 1.5 · 109 yrs. Otherpeaks are more ambiguous, but could be present between20 to 30 Myr and around 100 Myr. The peak at ages be-tween 20 to 30 Myr, might however simply be due to clusterincompleteness at ages T < 20 Myr. Also visible is the well-known absence of star clusters between 3 and 8 Gyr, wherethe cluster frequency is at least a factor of 10 lower than atolder and younger ages.
In order to disentangle true variations in cluster fre-quency from star formation variations, we divide the clusterfrequency by the total star formation rate in each age binaccording to Harris & Zaritsky (2009) and show the result
Figure 3. Location of all clusters in a mass vs. age diagram. Thedotted line shows the location of the 50% completeness limit ofMV = −3.5 for the Popescu et al. (2012) data. The dashed lineshows the location of clusters used for our analysis, which areconfined to ages larger than 107 yrs, masses larger than 5000 M⊙
and total luminosities brighter than MV = −3.5.
in the bottom panel of Fig. 4. As can be seen, the clusterto star ratio is now nearly constant for ages from 10 Myrto 200 Myr. Primordial gas expulsion does therefore eitherhave only a moderate effect on star clusters or its observableeffects must be limited to either the first 10 Myr of clusterevolution or low-mass clusters with MC < 5000 M⊙ sinceno strong drop in cluster frequency is visible in the first 100Myr. After 200 Myr, the frequency of clusters drops signif-icantly, at T = 1 Gyr it is roughly only 1/10th of that atT < 200 Myr, and at T = 10 Gyr it is lower by an addi-tional factor of 10. We note that at T = 10 Gyr, the 50%completeness limit of Hunter et al. (2003) is almost a fac-tor of 4 more massive than our mass-cut at 5000 M⊙ (seeFig. 4). This, however, does not explain the low number ofclusters at T = 10 Gyr, since all of them are more massivethan 105 M⊙.
6 Baumgardt et al.
Figure 4. Upper panel: Cluster frequency dN/dt as a function ofage. Solid points show the observed LMC data for clusters withmasses MC > 5000 M⊙. Lower panel: Cluster frequency dividedby the average star formation rate in each age bin. The numberof clusters formed per unit stellar mass is constant up to an age
of 200 Myr and drops sharply for larger ages, indicating the onsetof cluster dissolution for ages T > 200 Myr.
A nearly constant cluster frequency at young ages fol-lowed by a strong decrease at later ages was also foundby Lamers et al. (2005) for the open clusters in the solarneighborhood. In the solar neighborhood the break occurs ataround log t/yr = 8.6, equivalent to 400 Myr. It is also visi-ble in the distribution of massive star clusters with M > 103
M⊙ in the SMC resented by Chandar, Fall & Whitmore(2006) (see their Fig. 1). Boutloukos & Lamers (2003)showed that this behavior is due to cluster dissolution: Forages t < tbreak, where tbreak is a characteristic time relatedto the dissolution time, only a small number of low-massclusters fall below the detection threshold, so the clusterfrequency drops only slowly, while for ages t > tbreak sig-nificant dissolution of clusters causes a strong decrease incluster frequency.
From Fig. 4, we can therefore conclude that a) if resid-ual gas expulsion has an influence on star clusters, its effectsmust be limited to either the first 10 Myr of evolution orlow-mass clusters with MC < 5000 M⊙ b) the characteris-tic lifetime of a ∼ 104 M⊙ star cluster (which make up themajority of our clusters in our sample) in the LMC is a fewhundred Myr and roughly the same as in the solar neigh-borhood (Lamers et al. 2005); c) for ages > 200 Myr about90% of clusters are destroyed per 1 dex in log t.
The data shown in Fig. 4 confirm the absence of starclusters in the LMC in the age range 4 Gyr < T < 10 Gyr,which was first noticed by Bertelli et al. (1992). A similargap is not seen in the field star formation rate, as foundby Harris & Zaritsky (2009) from an analysis of the MCPSdata and Holtzman et al. (1999) from an analysis of HST
color-magnitude diagrams of three fields in the LMC. If thestar formation rate derived by Harris & Zaritsky (2009) iscorrect, then the ratio of the number of clusters formed tothe absolute star formation rate was at least a factor 5 to10 lower in this age range then at both earlier ages T >10 Gyr and later ages T < 3 Gyr. Alternatively, only low-mass clusters with M < 5000 M⊙ may have been formed inthis age range.
Fig. 5 finally depicts the mass distribution of clusters,split into four age groups. In most age bins, the mass func-tion of clusters can be approximated well by a power-lawmass function N(m) ∼ m−α. Applying a maximum like-lihood estimator to the cluster mass distribution as de-scribed in Clauset, Rohilla Shalizi & Newman (2009), givesas best-fitting slope α = 2.32 ± 0.11 for the youngest agebin. This is in good agreement with the slope found byHunter et al. (2003) and only slightly steeper than the slopeof α = 1.8±0.2 found by Chandar, Fall & Whitmore (2010)for clusters more massive than 103 M⊙. In our sample,clusters up to 1 Gyr can be fitted by a slope similar tothat for clusters in the youngest age bin, confirming re-sults by Chandar, Fall & Whitmore (2010) that the disso-lution of clusters up to 1 Gyr is mass independent, at leastfor the mass range considered here. Clusters between 1and 4 Gyr have a significantly flatter best-fitting slope ofα = 1.67± 0.08. This could be due to either incompletenessof the sample at the low-mass end or be a sign of ongo-ing cluster dissolution, since low-mass clusters are more eas-ily destroyed by two-body relaxation than high-mass ones(Baumgardt & Makino 2003). If the flattening were due toincompleteness and the true mass function still a power-lawwith slope α = 2.3, then about 400 clusters with massesbetween 5000 M⊙ and 105 M⊙ would be missing from oursample. This seems highly unlikely, given the relatively faint50% completeness limit of the Hunter et al. sample (about5000 M⊙ at T = 2 Gyr). We therefore conclude that theobserved flattening of the mass function for clusters withages 1 < T < 4 Gyr is due to ongoing cluster dissolution.Interestingly, clusters with ages 1 < T < 4 Gyr and masseslarger than 105 M⊙ can still be fitted with a slope α ≈ 2.3,the slope flattens only for lower-mass clusters, which is alsoin agreement with ongoing dissolution of low-mass clusters(see sec. 5). The mass-function slope is even flatter for clus-ters in the oldest age bin (bottom panel of Fig. 5), howeverfor these a power-law mass function provides a rather poorfit and their mass function is much better described by e.g. alog-normal distribution, similar to what is seen for globularclusters in other galaxies.
From Figs. 4 and 5, we can also deduce the ratio ofstars born in clusters that survive gas expulsion and infantmortality to the total number of stars born. Our samplecontains 87 clusters with ages 10 Myr < T < 100 Myrand masses MC > 5000 M⊙, which have a total mass of1.3 · 106 M⊙. If we assume that clusters follow a power-law mass function with exponent α = 2.3 and extend thecluster mass function down to clusters of 102 M⊙, the totalmass in clusters is about a factor 3 higher. Integrating theHarris & Zaritsky (2009) star formation rate, we find thatover the same time span 2.6·107 M⊙ were born in field stars.Hence about 15% of all stars with T < 100 Myr formed inclusters that survive for at least 10 Myr. This is within the

The star cluster formation history of the LMC 7
Figure 5. Mass distribution of star clusters for four different agebins. The dashed lines show best-fitting power-law mass func-tions. The power-law slopes α and their errors are also given inthe different panels. Clusters in the two youngest age bins fol-low power-law mass functions with slope α ≈ 2.35. Clusters olderthan 1 Gyr follow a significantly flatter distribution, which ismost likely a result of ongoing cluster dissolution. For clusterswith T > 4 Gyr, a power-law mass function does not give a gooddescription of their mass function.
range of ratios seen in other nearby galaxies as determinedby Goddard, Bastian & Kennicutt (2010).
4 THEORETICAL ESTIMATES FOR THE
DISSOLUTION OF STAR CLUSTERS
Star clusters are destroyed through a number of mech-anisms, including residual gas expulsion (Hills 1980;Goodwin 1997; Baumgardt & Kroupa 2007), two-body re-laxation and external tidal fields (Vesperini & Heggie 1997;Baumgardt & Makino 2003) and tidal shocks from disc orbulge passages or passing giant molecular clouds (Spitzer1958; Ostriker et al. 1972; Wielen 1985; Gnedin & Ostriker1997; Gieles et al. 2006a). In the following, we discuss eachof these dissolution mechanisms in more detail.
4.1 Gas expulsion
Clusters typically form at the centres of dense molecularclouds with star formation efficiencies of about 30%. Whenthe residual gas that is not converted into stars is removedby winds from young O and B type stars, the gravitationalpotential is lowered and some clusters can become unbound.Baumgardt & Kroupa (2007) showed that the impact of gasexpulsion depends on the star formation efficiency ǫ, thetimescale over which the gas is removed compared to theclusters crossing time τgas/tcross, and the strength of the
external tidal field which can be quantified through the ra-tio of the clusters half-mass radius prior to gas expulsion toits tidal radius rh/rt. Although gas expulsion is thoughtto happen within the first few Myr after cluster forma-tion, and therefore does not directly affect clusters with ages≥ 10 Myr, clusters need several initial crossing times to dis-solve into the field. While dissolving, they could still be vis-ible as clusters and would therefore influence our sample atthe youngest ages (see e.g. Parmentier & Baumgardt 2012).The absence of any decrease of cluster frequency between10 and 200 Myr (see Fig. 4), argues against the presence ofdissolving clusters in our sample. We therefore assume thatthe observed cluster response to gas expulsion is over byan age of 10 Myr and neglect the influence of residual gasexpulsion.
4.2 Stellar evolution
Stellar evolution reduces the masses of star clusters byabout 45% during a Hubble time if stars follow a Kroupa(2001) IMF. Low-mass clusters with masses M < 104 M⊙
will therefore fall below our adopted lower mass limit ofM = 5000 M⊙ even without any dynamical mass loss. Inorder to model stellar evolution, we assume for the masslost by stellar evolution:
dM
dt= − (MC −MDyn(t))
dµevdt
(1)
where MC is the initial cluster mass, MDyn(t) is the accu-mulated mass lost by the dynamical effects described belowand µev is calculated as described in Lamers et al. (2010),assuming a metallicity of Z = 0.0080. Apart from mass loss,stellar evolution also causes the clusters to expand and veryextended clusters could suffer additional dynamical massloss due to this expansion and the related tidal overflow.However we neglected the influence of this process since it ismost effective in the first few 100 Myr of cluster evolution,where we see little evidence for cluster dissolution (see Sec.3).
4.3 Two-body relaxation and external tidal fields
The effects of two-body relaxation and a spherical exter-nal tidal field were modeled according to the results ofBaumgardt & Makino (2003), who performed simulationsof multi-mass clusters moving through spherically symmet-ric, isothermal galaxies. According to Baumgardt & Makino(2003), the lifetime tDis|Rel of a star cluster moving throughan external galaxy with circular velocity VC on an orbit withdistance R from the centre of the galaxy is given by
tDis|Rel[Gyr]
= k
(
N
ln(0.02N)
)xR
[kpc]
(
VC220km/s
)−1
. (2)
Here N is the initial number of cluster stars, which canbe calculated from the initial cluster mass and the meanmass of the cluster stars as N = MC/< m >. A Kroupa(2001) IMF between mass limits of 0.1 and 100 M⊙ has< m >= 0.64 M⊙. x and k are constants describingthe dissolution process and are given by x = 0.75 andk = 1.91 · 10−3 (Baumgardt & Makino 2003). Kinematicstudies of various population tracer populations show thatthe LMC has near-solid body rotation in its inner parts

8 Baumgardt et al.
(Meatheringham et al. 1988; Hughes, Wood & Reid 1991,e.g.). van der Marel et al. (2002) found that the LMC showssolid body rotation out to a radius of about 4 kpc and anapproximately flat rotation curve for larger radii. The rota-tion velocity of the LMC is however rather uncertain and de-pends on the tracer population that is used. Olsen & Massey(2007) find values of VC = 61 km/sec for carbon stars,VC = 80 km/sec for H I gas and VC = 107 km/sec forred supergiants and speculate that the differences could bea sign of the ongoing tidal perturbation of the LMC. If weassume a maximum circular rotation speed of the LMC of80 km/sec, similar to what Olsen & Massey (2007) foundfor the rotation velocity of the H I gas, eq. 2 becomes
tDis|Rel[Gyr]
= 3.92
(
MC
104M⊙
)0.75
(3)
for radii R < 4 kpc. We do not consider larger radii sinceobserved LMC clusters mostly have R < 4 kpc. Note that, asa result of the solid body rotation, tDis|Rel does not dependon galactocentric distance.
We finally note that Gieles & Baumgardt (2008) haveshown that compact clusters dissolve faster than the tidallyfilling clusters simulated by Baumgardt & Makino (2003)due to their smaller relaxation times. However we neglectthis effect since it only becomes important for rh/rJ < 0.05,where rh is the half-mass radius and rJ is the Jacobi ra-dius of the cluster. A cluster starting with an initial mass of104 M⊙ at a typical distance of 1 kpc from the centre of theLMC has a Jacobi radius rJ = 20 pc, so this effect wouldonly be important if clusters start with radii rh ≪ 1 pc.
4.4 Disc shocks
Clusters passing through galactic discs experience tidal heat-ing due to the difference in acceleration for stars in differentparts of the cluster (Ostriker et al. 1972). The dissolutiontime against disc shocking is given by (Binney & Tremaine1987, eq. 7-72):
tDis|Shock =Tψσ
2∗V
2z
8z2g2z(4)
where Tψ is the orbital time of the cluster, σ∗ the 1D ve-locity dispersion of stars in the cluster, Vz the velocity withwhich the cluster passes the disc, z2 = r2h/3 the root-meansquare z distance of stars in the cluster and gz the gravita-tional acceleration of stars due to the disc. Using the virialtheorem, we find
3
2MCσ
2
∗ =ηGM2
C
rh(5)
where η ≈ 0.4 for most density profiles. For a typical half-mass radius of rh = 4 pc, this gives
σ∗
km/sec= 1.7
√
MC
104M⊙. (6)
The LMC is classified as a SBm galaxy(de Vaucouleurs & Freeman 1972) and contains a rela-tively thick disc with an out-of-plane axial ratio of ∼ 0.3 orlarger (van der Marel et al. 2002). The velocity dispersionof stars perpendicular to the LMC disc depends on theirage and increases for older stars, similar to the situation
in the Milky Way (van der Marel et al. 2009). We adopt avelocity dispersion of Vz = 10 km/sec, which is intermediatebetween the velocity dispersion found for red supergiantsand that of the H I gas (van der Marel et al. 2009). Ifwe also assume a circular velocity of V = 20 km/sec ata distance of R=1 kpc from the centre of the LMC, wefind Tψ = 312 Myr. For an infinitely thin disc with radialscale length of RD = 1.42 kpc (Weinberg & Nikolaev 2001)and a total mass in stars and gas of MD = 3.2 · 109 M⊙
(van der Marel et al. 2002), the acceleration in z directionis gz = 4.3 pc/Myr2 at R = 1 kpc. Inserting all the valuesin eq. 4 gives a dissolution time of roughly 110 Myr for a104 M⊙ cluster. Eq. 4 is however only valid for impulsiveencounters in which the time scale for shocking is muchsmaller than the orbital time for stars in the cluster.Slower encounters have a reduced effect since stars withorbital times torb ≪ tshock can adiabatically adjust to theshocking. Gnedin & Ostriker (1997) give various forms forthe adiabatic correction factor. If we use their eq. 11, then
A(x) =(
1 + x2/4)−3/2
(7)
where x is the ratio of the angular velocity of stars in thecluster to the crossing timescale of the cluster through thedisc and is given by
x =σ∗
rh
2z0Vz
(8)
For a vertical scale height of z0 = 270 pc(van der Marel et al. 2002) and a cluster mass of 104
M⊙, x ≈ 20, and A(x) ≈ 1/1500. Disc shocks thereforeseem to have a negligible influence on the evolution ofstar clusters in the LMC. Even if we set Vz = 50 km/sec,corresponding to a cluster moving on a highly inclinedorbit through the disc and assume a smaller scale height ofz0 = 100 pc in the past, the lifetime of a 104 M⊙ clusteragainst disc shocks is still larger than that against two-bodyrelaxation. We therefore neglect the influence of disc shockson the cluster evolution.
4.5 GMC encounters
Similar to galactic discs, passing giant molecular clouds cre-ate transient tidal forces on a star cluster, which increasesthe internal energy of a cluster and leads to cluster dissolu-tion (Spitzer 1958). Wielen (1985) found that giant molec-ular clouds dominate the dissolution of star clusters in thesolar neighborhood.
The most thorough calculation of the influence of GMCencounters has been given by Gieles et al. (2006), whoshowed that considering only the total energy gain can over-estimate the effect of GMC encounters since much of theenergy gained by the cluster is carried away by escapers andthat considering the mass loss of a cluster leads to a betterdescription of the dissolution process. Gieles et al. (2006)also showed that GMCs cannot destroy clusters with morethan ∼ 104 M⊙ in a single disruptive encounter if one takesthe finite size of the GMCs into account. For the cumulativeeffect of many distant encounters, they derived the followingexpression for the lifetime of a star cluster of mass MC andhalf-mass radius rh:
tdis|GMC =
(
3σcnη
8π3/2gfG
r2hr2
)(
MC
r3h
)
1
Σnρn(9)

The star cluster formation history of the LMC 9
where ρn = MGMC nGMC is the mass density of GMCs ina galaxy, Σn the typical surface density of a single GMC, fis the ratio of relative mass loss to the relative energy gainof a cluster during an encounter, g a numerical correctionfactor for close encounters, σcn is the typical relative ve-locity between a star cluster and a GMC, r the root-meansquare radius of the cluster, and η a constant which dependson the density profile of the cluster. A King (1966) modelwith W0=5.0 has η ≈ 0.4 and (r2h/r
2) = 0.50. The typicalvelocity dispersion of stars in the LMC is σ = 20 km/sec(van der Marel et al. 2002). Fig. 12 in Gieles et al. showsthat for a typical cluster mass of 104 M⊙ and a typical GMCmass of 105 M⊙, the correction factor g is slightly largerthan unity, so we adopt g = 1.5. We also assume f = 0.25as found by Gieles et al. through direct N-body simulationsand an average cluster radius of rh = 4 pc. The mass densityρn and the surface density Σn of the GMCs are taken fromthe results of the NANTEN LMC molecular cloud survey(Fukui et al. 2008). Fukui et al. found 270 molecular cloudswith masses MCO > 2 · 104 M⊙ within a survey area of 30deg2. Inside 2 kpc from the center of the LMC, they founda surface mass density of GMCs of 2 M⊙/pc2. Assuminga disc scale height of 180 pc (Padoan et al. 2001) for thegas and that all GMCs are located within ±1 scale heightof the plane of the disc, gives a space density ρn = 0.0056M⊙/pc
3. Hughes et al. (2010) found an average surface den-sity of Σn = 50 M⊙/pc
2 for individual GMCs in the LMC.Inserting all values, we find for the lifetime of star clustersin the LMC:
tdis|GMC
[Gyr]= 93.0
(
MC
104M⊙
)
(10)
Unlike in the Milky Way, GMC encounters do not seem tobe a dominant dissolution process for star clusters in theLMC, the main reason being their lower space density as aresult of the large disc scale height and their smaller sur-face density (Σn = 50 M⊙/pc
2 for clouds in the LMC vs.Σn = 170 M⊙/pc
2 in the Milky Way, see Solomon et al.1987). N-body simulations by Weinberg (2000) suggest thatthe large scale height of the LMC disc could be a result ofthe interaction with the Milky Way. Hence the importanceof GMC encounters might have been higher in the past whenthe LMC disc had a smaller scale height. It is however un-likely that the lifetime would drop below a Hubble time evenfor the smallest clusters in our sample, and we therefore alsoneglect GMC encounters.
We are therefore left with two-body relaxation drivenevaporation as the only dissolution process which seems tohave a significant influence on the LMC cluster system. Inorder to model relaxation driven evaporation, we assumethat the dynamical mass loss is linear in time, so the dy-namically lost mass is given by:
dM
dt= − (MC −Mev(t)) /tDis|Rel , (11)
where Mev(t) is the total mass lost by stellar evolution upto time t.
We assume that clusters form with the same rate as thefield stars and use the star formation history of LMC fieldstars as derived by Harris & Zaritsky (2009) to form clus-ters. We assume that clusters form with a power-law massfunction dN(m) ∼ m−αdm and adjust the exponent such
that the mass function of clusters in the youngest age bin inFig. 5 is fitted. We also assume that clusters follow an ex-ponential density distribution in the LMC with scale lengthR = 1.42 kpc, similar to what is seen for the field stars,and that clusters move on circular orbits. Clusters are thenevolved according to the description presented in this sec-tion up to the present time. The mass and age distributionof the surviving clusters with MC > 5000 M⊙ and absoluteluminosities MV > −3.5 mag is then compared with the ob-servational data for LMC clusters and we discuss the resultsin the next section.
5 COMPARISON WITH THEORY
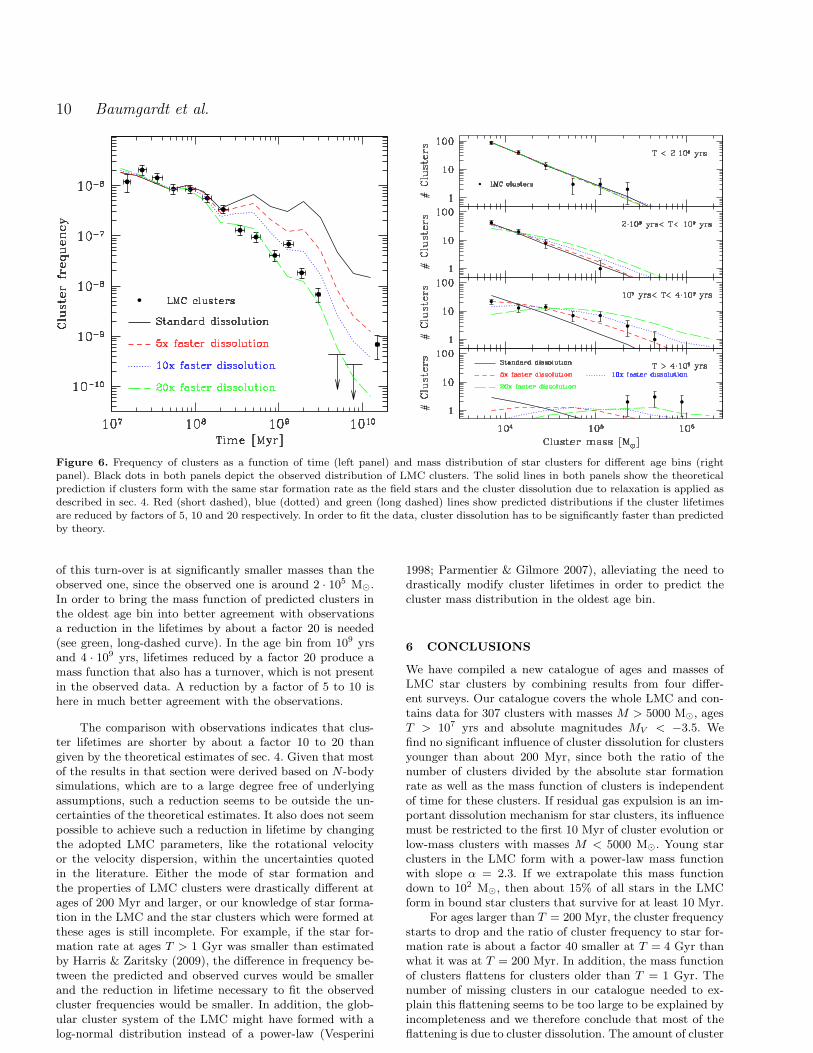
The left panel of Fig. 6 shows a comparison between thepredicted and observed cluster frequency as a function oftime, assuming that star clusters form with a power-lawmass function N(m) ∼ m−α and with a rate similar to thestar formation rate determined by Harris & Zaritsky (2009)for LMC field stars. Clusters are distributed in the LMC fol-lowing an exponential density distribution up to a maximumradius of R = 4 kpc, similar to the largest distances fromthe centre of the LMC for clusters in our sample. The black,solid line depicts the expected cluster frequency distribu-tion if dissolution mechanisms are applied to star clustersexactly as described in the previous section. It can be seenthat the frequency of the predicted clusters decreases signif-icantly slower with time than the cluster frequency of theobserved clusters for ages T > 200 Myr, and the black solidline predicts about a factor 10 more clusters than observedfor ages of several Gyr. If due to incompleteness, several hun-dred unstudied clusters with ages 1 < T < 4 Gyr would stillexist in the LMC. While new clusters in this age range arestill being found (e.g. Piatti 2011), it seems rather unlikelythat so many clusters are missing from our sample.
It is therefore much more likely that the theoretical es-timates from sec. 4 underestimate the true rate of clusterdissolution. The red (short dashed), blue (dotted) and green(long dashed) lines show the predicted cluster distributionif we reduce the cluster lifetimes by factors of 5, 10 and 20respectively. It can be seen that lifetimes need to be reducedby about a factor of at least 10 to 20 to give an agreementbetween predicted and observed cluster frequency.
The right panel of Fig. 6 depicts the mass distributionof star clusters as a function of their age. If we apply thevarious dissolution mechanisms as described in the previoussection (solid lines), the mass distribution of star clustersup to 1 Gyr is in good agreement with the observationaldata since the predicted mass function can be fitted by thesame slope for all ages, similar to what was found for theobserved cluster distribution in sec. 3. The reason is that inthis case the turnover carved into the cluster mass functionremains at masses lower than our mass-cut, and is thereforenot seen in our cluster sample. As a result, at masses higherthan 5000 M⊙, the slope of the cluster mass function is pre-served during the first Gyr. For ages larger than 109 yrs,dissolution of clusters more massive than 5000 M⊙ becomesimportant and the slope starts to flatten at the low-mass endof our sample. For clusters that are more than 4 Gyr old andstandard dissolution, the power-law mass function developsa turn-over at a few thousand solar masses. The location
10 Baumgardt et al.
Figure 6. Frequency of clusters as a function of time (left panel) and mass distribution of star clusters for different age bins (rightpanel). Black dots in both panels depict the observed distribution of LMC clusters. The solid lines in both panels show the theoreticalprediction if clusters form with the same star formation rate as the field stars and the cluster dissolution due to relaxation is applied asdescribed in sec. 4. Red (short dashed), blue (dotted) and green (long dashed) lines show predicted distributions if the cluster lifetimesare reduced by factors of 5, 10 and 20 respectively. In order to fit the data, cluster dissolution has to be significantly faster than predictedby theory.
of this turn-over is at significantly smaller masses than theobserved one, since the observed one is around 2 · 105 M⊙.In order to bring the mass function of predicted clusters inthe oldest age bin into better agreement with observationsa reduction in the lifetimes by about a factor 20 is needed(see green, long-dashed curve). In the age bin from 109 yrsand 4 · 109 yrs, lifetimes reduced by a factor 20 produce amass function that also has a turnover, which is not presentin the observed data. A reduction by a factor of 5 to 10 ishere in much better agreement with the observations.
The comparison with observations indicates that clus-ter lifetimes are shorter by about a factor 10 to 20 thangiven by the theoretical estimates of sec. 4. Given that mostof the results in that section were derived based on N-bodysimulations, which are to a large degree free of underlyingassumptions, such a reduction seems to be outside the un-certainties of the theoretical estimates. It also does not seempossible to achieve such a reduction in lifetime by changingthe adopted LMC parameters, like the rotational velocityor the velocity dispersion, within the uncertainties quotedin the literature. Either the mode of star formation andthe properties of LMC clusters were drastically different atages of 200 Myr and larger, or our knowledge of star forma-tion in the LMC and the star clusters which were formed atthese ages is still incomplete. For example, if the star for-mation rate at ages T > 1 Gyr was smaller than estimatedby Harris & Zaritsky (2009), the difference in frequency be-tween the predicted and observed curves would be smallerand the reduction in lifetime necessary to fit the observedcluster frequencies would be smaller. In addition, the glob-ular cluster system of the LMC might have formed with alog-normal distribution instead of a power-law (Vesperini
1998; Parmentier & Gilmore 2007), alleviating the need todrastically modify cluster lifetimes in order to predict thecluster mass distribution in the oldest age bin.
6 CONCLUSIONS
We have compiled a new catalogue of ages and masses ofLMC star clusters by combining results from four differ-ent surveys. Our catalogue covers the whole LMC and con-tains data for 307 clusters with masses M > 5000 M⊙, agesT > 107 yrs and absolute magnitudes MV < −3.5. Wefind no significant influence of cluster dissolution for clustersyounger than about 200 Myr, since both the ratio of thenumber of clusters divided by the absolute star formationrate as well as the mass function of clusters is independentof time for these clusters. If residual gas expulsion is an im-portant dissolution mechanism for star clusters, its influencemust be restricted to the first 10 Myr of cluster evolution orlow-mass clusters with masses M < 5000 M⊙. Young starclusters in the LMC form with a power-law mass functionwith slope α = 2.3. If we extrapolate this mass functiondown to 102 M⊙, then about 15% of all stars in the LMCform in bound star clusters that survive for at least 10 Myr.
For ages larger than T = 200 Myr, the cluster frequencystarts to drop and the ratio of cluster frequency to star for-mation rate is about a factor 40 smaller at T = 4 Gyr thanwhat it was at T = 200 Myr. In addition, the mass functionof clusters flattens for clusters older than T = 1 Gyr. Thenumber of missing clusters in our catalogue needed to ex-plain this flattening seems to be too large to be explained byincompleteness and we therefore conclude that most of theflattening is due to cluster dissolution. The amount of cluster

The star cluster formation history of the LMC 11
dissolution necessary to fit the observed cluster distributionis about a factor 10 higher than predicted by theory, indicat-ing either that the effectiveness of the considered processeswas significantly underestimated or that older star clusterformed with a mass distribution significantly different fromtheir younger counterparts.
ACKNOWLEDGMENTS
HB is supported by the Australian Research Councilthrough Future Fellowship grant FT0991052. EKG wishesto acknowledge support from the Sonderforschungsbereich”The Milky Way System” (SFB 881) of the German Re-search Foundation (DFG), especially via subproject B5. PAacknowledges funding by the National Natural Science Foun-dation of China (NSFC, grant number 11073001). GP ac-knowledges support from the Max-Planck-Institut fur Ra-dioastronomie (Bonn) in the form of a Research Fellowship.
REFERENCES
Anders, P., Lamers, H.J.G.L.M., Baumgardt, H., 2009,A&A 502, 817
Baumgardt, H., Makino, J., 2003, MNRAS 340, 227Baumgardt, H., Kroupa, P., 2007, MNRAS 380, 1589Bertelli, G. Mateo, M., Chiosi, C., Bressan, A., 1992, ApJ388, 400
Bica, E., Bonatto, C., Dutra, C. M., Santos, J. F. C., 2008,MNRAS, 389, 678
Boutloukos, S. G., Lamers, H. J. G. L. M., 2002, in GeislerD., Grebel E. K., Minniti D. eds, IAU Symposium 207,Extragalactic Star Clusters, San Francisco, p. 703
Boutloukos, S. G., Lamers, H. J. G. L. M., 2003, MNRAS338, 717
Chabrier, G., 2001, ApJ 554, 1274Chandar, R., Fall, S. M., Whitmore, B. C., 2006, ApJ 650,L111
Chandar, R., Fall, S. M., Whitmore, B. C., 2010, ApJ 711,1263
Chiosi, E., Vallenari, A., Held, E. V., Rizzi, L., Moretti,A., 2006, A&A 452, 179
Clauset, A., Rohilla Shalizi, C., Newman, M.E.J., 2009,SIAM Review 51, 661
de Grijs, R., Anders, P., 2006, MNRAS 366, 295de Vaucouleurs, G., Fremmen, K. C., 1972, Vistas in As-tronomy 14, 163
Fukui, Y., et al., 2008, ApJSS, 178, 56Goddard, Q. E., Bastian, N., Kennicutt, R. C., 2010, MN-RAS 405, 857
Gieles, M., Portegies Zwart, S. F., Baumgardt, H.,Athanassoula, E., Lamers, H.J.G.L.M., Sipior, M.,Leenaarts, J., 2006, MNRAS 371, 793
Gieles, M., Larsen, S. S., Bastian, N., Stein, I. T., 2006,A&A, 450, 129
Gieles, M., Bastian, N., 2008, A&A 482, 165Gieles, M., Baumgardt, H., 2008, MNRAS 389, L28Girardi, L., Chiosi, C., Bertelli, G., Bressan, A., 1995, A&A298, 87
Girardi, L., et al., 2010, ApJ 724, 1030Glatt, K., Grebel, E. K., Koch, A., 2010, A&A 517, 50
Gnedin, O., Ostriker, J., 1997, ApJ 474, 223Goddard, Q. E., Bastian, N., Kennicutt, R. C., 2010, MN-RAS, 405, 857
Goodwin, S., 1997, MNRAS 284, 785Harris, J., Zaritsky, D., 2009, AJ 138, 1243Hills, J.G., 1980, ApJ 235, 986Holtzman, J. A., et al., 1999, AJ 118, 2262Hughes, S. M. G., Wood, P. R., Reid, N., 1991, AJ 101,1304
Hughes, S. M. G., Wood, P. R., Reid, N., 1991, AJ 101,1304
Hughes, A., et al., 2010, MNRAS 406, 2065Hunter D. A., Elmegreen B. G., Dupuy T. J., MortonsonM., 2003, AJ, 126, 1836
Kroupa, P., 1998, MNRAS 298, 231Kroupa, P., 2001, MNRAS 322, 231Lamers, H. J. G. L. M., Gieles, M., Bastian, N., Baumgardt,H., Kharchenko, N. V., Portegies Zwart, S., 2005a, A&A,441, 117
Lamers, H. J. G. L. M., Gieles, M., Portgies Zwart, S. F.,2005b, A&A, 429, 173
Lamers, H. J. G. L. M., Baumgardt, H., Gieles, M., 2010,MNRAS, 409, 305
Mackey, A. D., Gilmore, G. F., 2003, MNRAS 338, 85Marigo, P., Girardi, L., Bressan, A., Groenewegen, M.A.T.,Silva, L., Granato, G.L., 2008, A&A 482, 883
Maschberger, T., Kroupa, P., 2011, MNRAS 411, 1495Meatheringham, S. J., Dopita, M. A., Ford, H. C., Webster,B. L., 1988, ApJ 327, 651
Milone, A. P., Bedin, L. R., Piotto, G., Anderson, J., 2009,A&A 497, 755
Ostriker, J. P., Spitzer, L. Jr., Chevalier, R. A., 1972, ApJ176, L51
Olsen, K. A. G., Massey, P., 2007, ApJ 656, L61Olszewski, E. W., Suntzeff, N. B.; Mateo, M., 1996,ARA&A 34, 511
Padoan, P., Kim, S., Goodman, A., 2001, ApJ 555, L33Parmentier, G., Gilmore, G., 2007, MNRAS 377, 352Parmentier, G., de Grijs, R., 2008, MNRAS 383, 1103Parmentier, G., Baumgardt, H., 2012, MNRAS submittedPiatti, A. E., 2011, MNRAS 418, L40Pietrzynski, G., Udalski, A., 2000, Acta Astron., 50, 337Piskunov, A.E., Kharchenko, N.V., Schilbach, E., Roser,S., Scholz, R.-D., Zinnecker, H., 2008, A&A, 487, 557
Piskunov, A.E., Kharchenko, N.V., Schilbach, E., Roser,S., Scholz, R.-D., Zinnecker, H., 2011, A&A, 525, 122
Popescu, B., Hanson, M. M, Elmegreen, B. G., 2012, ApJ751, 122
Solomon, P. M., Rivolo, A. R., Barrett, J., Yahil, A., 1987,ApJ 319, 730
Spitzer, L. Jr., 1958, ApJ 127, 17Udalski, A., et al. 1998, Acta Astron., 48, 147van der Marel, R. P., Alves, D. R., Hardy, E., Suntzeff, N.B., 2002, AJ, 124, 2639
van der Marel, R. P., Kallivayalil, N., Besla, G., 2009, in vanLoon J. T., Oliveira J. M., eds, Proc. IAU Symp. 256, TheMagellanic System: Stars, Gas and Galaxies. CambridgeUniv. Press, Cambridge, p. 81
Vesperini, E., Heggie, D. C., 1997, MNRAS 289, 898Vesperini, E., 1998, MNRAS 299, 1091Weinberg, M. D., 2000, ApJ 532, 922Weinberg, M. D., Nikolaev, S., 2000, ApJ 548, 712
12 Baumgardt et al.
Whitmore, B. C., et al., 2010, AJ 140, 75
Wielen, R., 1985, in Goodman J., Hut P., eds, IAU Symp.113, Dynamics of Star Clusters. Reidel, Dordrecht, p. 449
Zaritsky, D., Harris, J., Thompson, I. B.; Grebel, E. K.,Massey, P., 2002, AJ 123, 855
Zaritsky, D., Harris, J., Thompson, I. B.; Grebel, E. K.,2004, AJ 128, 1606

The star cluster formation history of the LMC 13
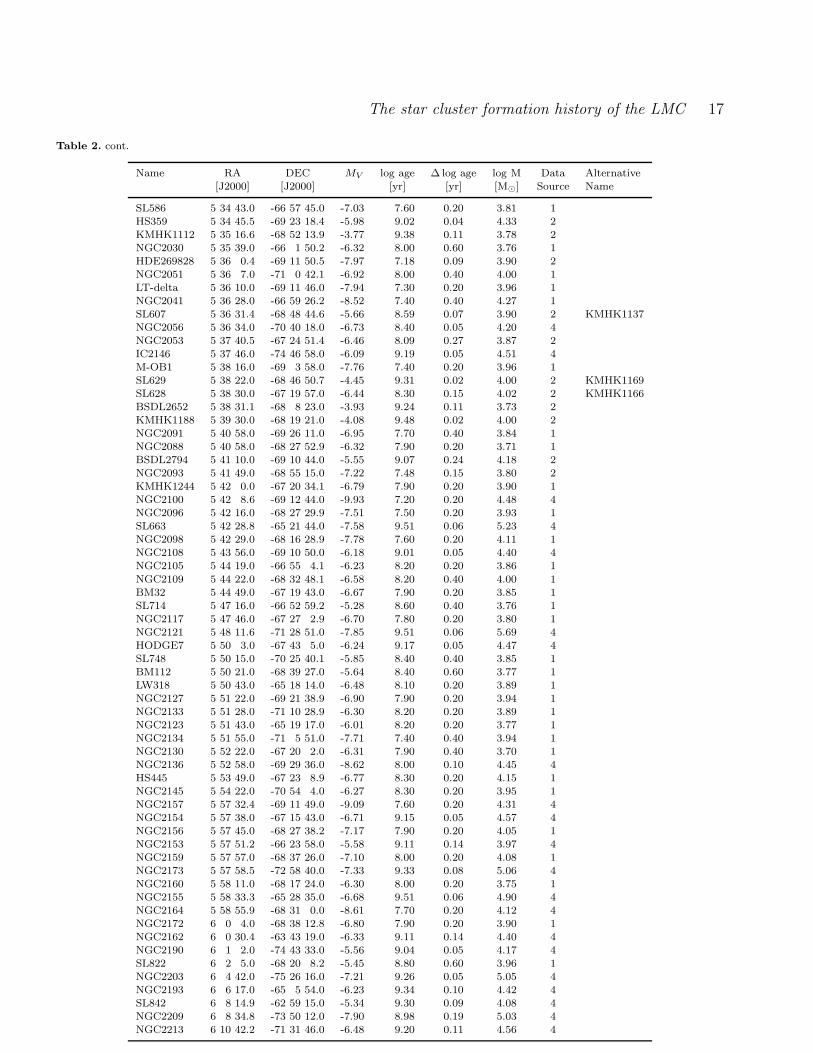
Table 2. Properties of massive LMC clusters. Sources for the data are: 1: Glatt et al. (2010), 2: Pietrzynski & Udalski (2000), 3: Popescuet al. (2012), 4: Additional clusters from the literature. Absolute luminosities for the clusters from Pietrzynski & Udalski (2000) aretaken from Hunter et al. (2003).
Name RA DEC MV log age ∆ log age log M Data Alternative[J2000] [J2000] [yr] [yr] [M⊙] Source Name
NGC1466 3 44 32.9 -71 40 13.0 -7.59 10.10 0.01 5.31 4NGC1651 4 37 31.1 -70 35 2.0 -7.16 9.30 0.09 5.24 4NGC1644 4 37 39.0 -66 11 58.0 -5.61 9.19 0.05 4.32 4NGC1652 4 38 22.0 -68 40 21.0 -5.37 9.23 0.05 4.29 4NGC1841 4 45 23.9 -83 59 56.0 -7.80 10.09 0.01 5.12 4LW52 4 45 46.0 -71 35 40.9 -5.30 8.70 0.20 3.83 1SL37 4 46 46.0 -72 23 40.9 -4.99 8.70 0.20 3.71 1NGC1695 4 47 43.0 -69 22 26.0 -6.24 8.00 0.20 3.73 1NGC1698 4 49 4.0 -69 6 52.9 -7.09 8.00 0.20 4.07 1HS35 4 49 33.0 -69 43 40.0 -4.93 9.00 0.18 3.89 2 KMHK124NGC1704 4 49 55.0 -69 45 19.1 -7.09 7.50 0.20 3.76 1HS37 4 50 28.9 -68 42 42.1 -4.65 9.25 0.23 4.02 2 KMHK139
NGC1711 4 50 37.3 -69 59 4.0 -8.88 7.70 0.05 4.21 4SL58 4 50 59.0 -69 38 13.0 -6.14 8.37 0.15 3.95 2 KMHK153SL66 4 51 56.5 -70 23 25.1 -5.50 9.23 0.15 4.34 2 KMHK180NGC1718 4 52 25.6 -67 3 6.0 -7.14 9.30 0.30 5.10 4SL75 4 52 55.7 -68 55 11.6 -6.49 8.20 0.30 3.96 2 KMHK199KMHK208 4 53 7.2 -69 2 36.0 -6.18 8.58 0.28 4.10 2SL76 4 53 9.0 -68 12 41.0 -6.71 8.10 0.40 3.98 1NGC1732 4 53 11.8 -68 39 1.1 -6.72 7.84 0.17 3.83 2KMHK229 4 53 51.0 -69 34 19.0 -5.04 9.05 0.31 3.97 2NGC1751 4 54 12.0 -69 48 25.0 -6.83 9.15 0.05 4.60 4NGC1754 4 54 18.9 -70 26 31.0 -7.36 10.19 0.06 5.39 4NGC1735 4 54 19.0 -67 6 1.1 -7.79 7.70 0.20 4.17 1BSDL210 4 54 37.0 -68 57 33.1 -5.78 8.40 0.40 3.82 1BRHT43b 4 54 44.0 -68 57 45.0 -6.26 8.30 0.60 3.94 1NGC1756 4 54 50.0 -69 14 17.0 -6.26 8.40 0.05 4.02 4SL106 4 55 5.0 -69 40 26.0 -7.18 7.70 0.20 3.93 1NGC1755 4 55 13.0 -68 12 16.9 -9.11 7.40 0.20 4.50 1SL105 4 55 23.0 -68 32 29.0 -6.45 8.00 0.20 3.81 1HS65 4 55 31.7 -68 52 58.8 -5.02 8.97 0.09 3.91 2 H88-31KMHK292 4 55 34.0 -69 26 53.2 -7.78 7.20 0.20 3.84 1KMHK300 4 55 39.0 -70 32 48.0 -4.68 9.06 0.28 3.83 2NGC1777 4 55 48.9 -74 17 3.0 -7.38 9.08 0.15 4.75 4SL114 4 56 7.9 -69 14 47.6 -7.27 7.35 0.10 3.73 2 KMHK305SL117 4 56 22.0 -68 58 0.1 -6.90 8.10 0.40 4.06 1SL116 4 56 25.1 -68 48 13.9 -6.88 7.68 0.03 3.80 2 KMHK315NGC1767 4 56 26.0 -69 24 11.9 -8.41 7.30 0.40 4.15 1SL124e 4 56 31.0 -69 58 54.0 -5.50 8.73 0.17 3.93 2 KMHK324eHD32228 4 56 34.0 -66 28 25.0 -7.77 7.30 0.20 3.89 1BSDL285 4 56 37.0 -68 14 12.8 -5.83 8.50 0.40 3.91 1SL119 4 56 38.1 -68 9 53.3 -6.16 8.86 0.08 4.28 2 KMHK316NGC1772 4 56 52.0 -69 33 22.0 -7.76 7.60 0.20 4.11 1KMHK355 4 57 22.9 -70 28 58.6 -3.81 9.27 0.18 3.70 2SL134 4 57 30.0 -68 21 47.0 -6.79 7.57 0.09 3.70 2 KMHK349SL136 4 57 30.6 -69 3 6.5 -5.80 9.19 0.11 4.39 2 KMHK352NGC1782 4 57 51.0 -69 23 35.2 -8.30 7.20 0.20 4.05 1NGC1774 4 58 5.0 -67 14 31.9 -8.15 7.70 0.20 4.32 1BSDL365 4 58 40.0 -70 31 39.0 -5.36 8.70 0.60 3.85 1SL151 4 58 51.1 -69 57 32.5 -5.59 9.15 0.07 4.10 2 KMHK388SL150 4 58 56.5 -69 13 2.3 -5.03 9.44 0.01 4.34 2 KMHK386NGC1791 4 59 7.4 -70 10 7.5 -5.94 8.15 0.23 3.71 2NGC1786 4 59 7.9 -67 44 45.0 -8.41 10.18 0.01 5.57 4NGC1783 4 59 8.0 -65 59 18.0 -8.11 9.18 0.05 5.26 4SL153 4 59 19.0 -66 19 7.0 -6.92 8.20 0.40 4.14 1BRHT61a 4 59 21.4 -68 50 36.3 -5.98 8.79 0.01 4.16 2NGC1793 4 59 37.0 -69 33 27.0 -6.40 8.00 0.40 3.79 1NGC1795 4 59 46.0 -69 48 6.0 -6.08 9.11 0.05 4.36 4
NGC1801 5 0 35.6 -69 36 50.1 -6.91 8.45 0.11 4.31 2

14 Baumgardt et al.
Table 2. cont.
Name RA DEC MV log age ∆ log age log M Data Alternative[J2000] [J2000] [yr] [yr] [M⊙] Source Name
HS87 5 0 41.0 -69 20 31.0 -4.56 9.25 0.05 3.98 3SL168 5 0 43.0 -65 27 18.0 -6.29 8.30 0.40 3.96 1HS85 5 0 51.0 -67 48 14.0 -4.71 9.02 0.04 3.82 2 KMHK428NGC1804 5 1 4.0 -69 4 57.0 -6.83 7.80 0.40 3.85 1HS88 5 1 5.3 -68 5 0.7 -4.55 9.39 0.16 4.10 2 KMHK436SL174 5 1 12.3 -67 49 4.9 -5.93 9.04 0.08 4.32 2 KMHK439H88-93 5 1 29.4 -67 38 0.7 -3.72 9.48 0.37 3.85 2KMHK448 5 1 29.5 -68 42 42.2 -5.54 8.45 0.08 3.77 3SL180 5 1 37.0 -69 2 18.0 -5.54 9.20 0.10 4.32 3SL181 5 1 51.0 -69 12 50.0 -5.17 8.80 0.10 3.85 3NGC1806 5 2 11.0 -67 59 17.0 -7.50 9.18 0.05 5.01 4NGC1805 5 2 21.0 -66 6 42.1 -8.42 7.60 0.20 4.37 1NGC1815 5 2 27.0 -70 37 14.9 -6.57 7.80 0.20 3.75 1HS94 5 2 30.6 -70 17 33.5 -4.39 9.05 0.19 3.71 2 KMHK468SL188 5 2 33.7 -68 49 24.0 -6.16 8.10 0.10 3.76 3SL191 5 3 6.1 -69 2 12.0 -7.00 8.10 0.05 4.10 3SL197 5 3 34.3 -67 37 32.2 -4.95 9.10 0.08 3.93 3 KMHK482HS102 5 3 38.5 -69 23 10.0 -4.78 9.10 0.05 3.87 3NGC1818 5 4 13.8 -66 26 2.0 -9.61 7.40 0.20 4.13 4NGC1825 5 4 19.4 -68 55 40.0 -7.24 7.80 0.10 4.02 3NGC1828 5 4 21.0 -69 23 17.0 -6.69 8.40 0.10 4.18 3KMK88-8 5 4 30.0 -69 9 21.0 -5.25 8.60 0.10 3.75 3 H88-106KMK88-7 5 4 31.0 -69 21 19.0 -5.16 9.00 0.10 3.99 3 H88-108NGC1830 5 4 39.0 -69 20 27.1 -6.25 8.60 0.10 4.14 3NGC1837 5 4 53.0 -70 42 55.1 -7.77 7.30 0.20 3.89 1KMK88-11 5 5 4.1 -68 54 35.8 -5.75 9.05 0.15 4.25 3 H88-117NGC1835 5 5 6.7 -69 24 15.0 -8.74 10.22 0.07 5.83 4NGC1834 5 5 12.0 -69 12 27.0 -7.12 8.10 0.15 4.15 3
SL212 5 5 12.4 -68 33 10.7 -6.49 8.70 0.10 4.31 3HS112 5 5 33.3 -69 6 59.2 -5.39 8.95 0.04 4.04 2NGC1836 5 5 35.7 -68 37 42.0 -6.84 8.70 0.05 4.45 3SL224 5 5 43.3 -70 19 30.1 -5.49 8.50 0.42 3.77 2 KMHK534HS111 5 5 44.9 -68 30 23.9 -4.39 9.10 0.10 3.71 3HS115 5 5 54.8 -70 22 21.4 -4.98 8.97 0.25 3.89 2 KMHK537NGC1839 5 6 1.0 -68 37 36.1 -7.17 7.90 0.20 4.05 1NGC1831 5 6 17.4 -64 55 11.0 -8.41 8.50 0.30 4.81 4HS117 5 6 25.9 -68 42 12.0 -5.10 9.20 0.10 4.15 3SL228w 5 6 28.0 -66 54 24.1 -6.49 8.20 0.20 3.96 1SL230 5 6 33.0 -68 21 47.9 -7.55 7.40 0.20 3.88 1SL234 5 6 53.0 -68 43 7.0 -6.31 7.95 0.20 3.73 1OGLE-LMC0114 5 6 56.0 -69 25 48.0 -3.88 9.25 0.10 3.71 3SL237 5 6 58.3 -69 9 0.1 -7.11 7.78 0.05 3.95 3NGC1847 5 7 7.7 -68 58 17.0 -10.41 7.42 0.30 4.97 4NGC1844 5 7 29.0 -67 19 23.9 -6.31 7.90 0.40 3.70 1NGC1846 5 7 35.0 -67 27 39.0 -7.82 9.17 0.05 5.10 4SL249 5 7 35.5 -70 44 56.1 -6.14 8.38 0.14 3.95 2 KMHK562SL244 5 7 38.9 -68 32 30.9 -6.12 9.43 0.01 4.77 2SL250 5 7 51.0 -69 26 10.6 -5.83 9.00 0.10 4.25 3NGC1850 5 8 45.8 -68 45 38.0 -10.95 7.50 0.20 5.42 4BRHT5 5 8 54.6 -68 45 16.8 -7.28 8.20 0.10 4.28 3 H88-159BSDL734 5 9 13.3 -69 16 57.6 -4.10 9.25 0.05 3.80 3SL268 5 9 14.8 -69 35 16.0 -7.02 9.20 0.30 4.92 3NGC1854 5 9 20.3 -68 50 55.0 -8.70 8.05 0.05 4.75 3NGC1852 5 9 23.0 -67 46 42.0 -6.49 9.12 0.05 4.51 4NGC1856 5 9 31.5 -69 7 46.0 -10.39 8.12 0.30 5.25 4NGC1849 5 9 34.0 -66 18 59.0 -5.85 8.30 0.20 3.78 1BSDL767 5 9 43.3 -70 18 34.9 -5.47 8.51 0.26 3.77 2HS141 5 9 49.3 -69 5 3.1 -5.01 9.00 0.10 3.92 3SL276 5 9 58.0 -69 21 11.0 -6.17 8.90 0.08 4.32 3OGLE-LMC0169 5 10 6.1 -69 5 19.6 -6.32 8.25 0.05 3.93 2SL282 5 10 10.9 -70 22 33.3 -4.52 9.13 0.10 3.71 2 KMHK619SL278 5 10 16.0 -68 29 30.8 -5.53 8.40 0.40 3.72 1KMK88-32 5 10 20.0 -68 52 45.0 -5.58 8.50 0.10 3.81 3 H88-178

The star cluster formation history of the LMC 15
Table 2. cont.
Name RA DEC MV log age ∆ log age log M Data Alternative[J2000] [J2000] [yr] [yr] [M⊙] Source Name
NGC1861 5 10 21.9 -70 46 44.2 -5.97 8.79 0.11 4.16 2HS153 5 10 30.0 -68 52 21.0 -5.84 8.55 0.10 3.95 3 BRHT48SL291 5 10 30.5 -70 54 36.2 -5.54 8.72 0.11 3.94 2 KMHK626NGC1860 5 10 38.9 -68 45 12.0 -8.88 8.28 0.30 4.30 4SL288 5 10 39.4 -69 2 28.6 -6.94 7.65 0.05 3.81 3SL294 5 10 42.2 -70 3 46.8 -5.89 8.28 0.30 3.78 2 KMHK627SL296 5 10 56.7 -69 33 31.1 -5.86 8.85 0.05 4.15 3NGC1859 5 11 31.0 -65 14 57.1 -6.31 8.10 0.20 3.82 1NGC1863 5 11 39.0 -68 43 48.0 -7.91 7.80 0.40 4.28 1SL304 5 12 1.0 -69 12 1.0 -6.76 8.40 0.10 4.21 3KMK88-38 5 12 9.3 -68 54 40.6 -4.40 9.10 0.05 3.71 3 H88-206NGC1865 5 12 25.0 -68 46 23.0 -6.65 8.80 0.05 4.44 3BSDL880 5 12 27.6 -69 33 13.8 -4.68 9.10 0.05 3.83 3KMK88-40 5 12 34.0 -69 17 11.0 -7.66 7.20 0.60 3.79 1KMK88-42 5 12 50.2 -68 51 51.2 -6.34 8.20 0.05 3.91 3 H88-216NGC1878 5 12 50.7 -70 28 20.2 -6.00 8.54 0.03 4.01 2HS177 5 13 3.5 -69 3 1.7 -4.48 9.25 0.05 3.95 3NGC1870 5 13 10.0 -69 7 1.0 -7.49 8.15 0.05 4.33 3NGC1872 5 13 11.0 -69 18 43.0 -8.05 8.70 0.10 4.93 3NGC1866 5 13 38.9 -65 27 52.0 -9.98 8.12 0.30 4.63 4BSDL946 5 13 57.5 -68 42 52.1 -5.67 9.13 0.06 4.17 2NGC1868 5 14 36.2 -63 57 14.0 -7.58 8.74 0.30 4.53 4HS190 5 14 47.0 -69 27 22.0 -5.44 9.44 0.35 4.51 2HS186 5 14 49.0 -66 11 1.0 -4.84 8.80 0.60 3.71 1HS191 5 14 51.0 -69 25 39.5 -4.58 8.95 0.10 3.71 3BSDL985 5 14 53.0 -66 3 33.8 -5.15 8.60 0.60 3.71 1NGC1885 5 15 6.0 -68 58 45.0 -7.32 8.30 0.03 4.37 3NGC1894 5 15 51.0 -69 28 9.0 -7.96 8.05 0.05 4.45 3
NGC1887 5 16 4.0 -66 19 9.1 -6.13 8.10 0.20 3.75 1BSDL1102 5 16 37.4 -70 12 38.9 -4.12 9.21 0.11 3.77 2SL352 5 16 41.6 -70 32 27.0 -5.80 8.61 0.03 3.97 2 KMHK715NGC1898 5 16 42.4 -69 39 25.0 -7.82 10.15 0.07 5.88 4SL349 5 16 55.1 -68 52 36.2 -5.38 8.85 0.05 3.96 3 BRHT33H1 5 17 8.4 -68 52 27.0 -6.82 9.20 0.10 4.84 3 SL353, BRHT33NGC1903 5 17 22.0 -69 20 17.0 -9.28 8.08 0.03 5.00 3SL357 5 17 27.0 -69 22 35.0 -6.59 9.20 0.08 4.75 3 BRHT9SL358 5 17 34.0 -69 30 51.0 -6.03 8.70 0.05 4.12 3HS211 5 17 38.0 -68 58 30.4 -5.01 8.70 0.10 3.71 3H2 5 17 49.2 -69 38 38.6 -7.06 9.25 0.10 4.98 3 SL363HS213 5 17 56.2 -69 34 56.2 -5.79 8.30 0.07 3.76 3BRHT10 5 18 10.7 -69 32 25.4 -5.87 8.20 0.10 3.72 3 H88-264NGC1902 5 18 17.0 -66 37 37.9 -7.24 8.00 0.20 4.13 1NGC1913 5 18 19.1 -69 32 13.7 -7.55 7.58 0.03 4.01 3NGC1916 5 18 37.5 -69 24 25.0 -8.93 10.20 0.09 5.79 4H88-269 5 18 41.7 -69 4 46.5 -4.98 9.00 0.10 3.91 3HS223A 5 18 52.4 -69 22 15.2 -5.15 9.10 0.05 4.02 3NGC1917 5 19 2.0 -69 0 4.0 -6.17 9.11 0.05 4.42 4HS227 5 19 4.0 -69 48 39.0 -5.16 9.00 0.03 3.99 3NGC1921 5 19 23.8 -69 47 16.2 -5.95 8.30 0.10 3.82 3SL385 5 19 26.3 -69 32 25.2 -6.63 8.50 0.05 4.23 3 BRHT35SL387 5 19 33.7 -69 32 31.7 -6.41 9.00 0.10 4.49 3 BRHT35NGC1922 5 19 50.0 -69 30 1.0 -7.74 7.35 0.10 3.92 3SL390 5 19 54.3 -68 57 50.4 -5.92 9.20 0.03 4.48 3SL397 5 20 12.0 -68 54 15.1 -6.67 7.80 0.20 3.79 1SL402 5 20 23.6 -69 35 6.3 -6.53 8.50 0.07 4.19 3H88-281 5 20 26.0 -69 15 8.8 -5.81 8.27 0.22 3.74 2NGC1926 5 20 35.0 -69 31 27.8 -7.76 8.20 0.10 4.47 3NGC1928 5 20 57.5 -69 28 41.6 -6.83 9.23 0.05 4.87 3BSDL1334 5 21 14.0 -68 47 0.0 -3.72 9.48 0.41 3.86 2NGC1938 5 21 25.4 -69 56 23.3 -5.90 8.75 0.05 4.10 3NGC1939 5 21 27.1 -69 57 1.3 -7.43 9.20 0.10 5.08 3SL410 5 21 45.0 -65 13 55.9 -6.36 8.05 0.20 3.81 1SL418 5 21 49.5 -69 39 6.9 -6.47 8.40 0.20 4.10 3

16 Baumgardt et al.
Table 2. cont.
Name RA DEC MV log age ∆ log age log M Data Alternative[J2000] [J2000] [yr] [yr] [M⊙] Source Name
NGC1944 5 21 57.0 -72 29 39.0 -6.66 7.84 0.05 3.81 4SL419 5 22 3.4 -69 15 18.3 -6.39 8.55 0.05 4.17 3SL423 5 22 13.3 -69 30 48.8 -6.30 8.40 0.10 4.03 3SL425 5 22 25.0 -68 47 6.0 -6.21 8.20 0.40 3.85 1NGC1932 5 22 26.0 -66 9 9.0 -6.85 8.10 0.20 4.04 1NGC1943 5 22 29.5 -70 9 14.9 -7.25 8.35 0.05 4.38 3NGC1940 5 22 43.0 -67 11 10.0 -6.50 8.00 0.20 3.83 1HS259 5 22 45.7 -69 50 49.5 -7.18 8.14 0.02 4.20 2SL434 5 23 25.6 -69 1 18.2 -5.07 8.70 0.20 3.74 2SL453 5 25 1.9 -69 26 7.4 -7.01 8.50 0.05 4.38 3SL461 5 25 19.0 -71 48 11.2 -5.05 8.70 0.40 3.73 1NGC1953 5 25 26.0 -68 50 17.9 -6.87 7.90 0.20 3.93 1NGC1951 5 26 4.0 -66 35 49.9 -7.82 7.70 0.20 4.18 1BSDL1657 5 26 5.0 -67 10 57.0 -6.33 8.00 0.20 3.77 1KMHK898 5 26 24.0 -68 2 48.1 -5.59 9.12 0.03 4.16 2HS301A 5 26 38.0 -71 58 50.2 -6.46 7.90 0.20 3.76 1NGC1967 5 26 43.0 -69 6 5.0 -7.62 7.20 0.20 3.78 1NGC1987 5 27 17.0 -70 44 8.0 -6.76 9.03 0.05 4.65 4SL482 5 27 17.0 -66 22 7.0 -7.47 7.60 0.20 3.99 1NGC2000 5 27 29.0 -71 52 48.0 -6.62 8.00 0.20 3.88 1NGC1984 5 27 40.0 -69 8 3.1 -9.11 7.80 0.20 4.76 1SL492 5 27 43.0 -68 59 8.2 -7.47 7.70 0.20 4.04 1SL495 5 28 3.0 -68 48 42.1 -7.59 7.40 0.20 3.89 1NGC1994 5 28 21.0 -69 8 30.1 -7.02 7.70 0.40 3.86 1HS314 5 28 26.0 -68 58 55.9 -7.30 7.30 0.40 3.70 1KMHK945 5 28 27.4 -68 38 59.4 -5.27 9.08 0.25 4.06 2SL498 5 28 34.0 -67 13 30.0 -7.15 7.45 0.12 3.75 2 KMHK943HODGE14 5 28 39.3 -73 37 49.0 -5.95 9.26 0.10 4.33 4
NGC1978 5 28 45.0 -66 14 10.0 -7.80 9.30 0.05 5.33 4HS319 5 28 47.6 -68 59 1.4 -6.02 8.32 0.41 3.86 2 BRHT52aSL503 5 29 0.2 -68 25 8.0 -5.47 8.56 0.42 3.81 2 KMHK952SL502 5 29 10.0 -66 35 29.0 -8.37 7.60 0.20 4.35 1BSDL1938 5 29 19.0 -69 0 20.9 -7.16 7.60 0.20 3.87 1OGLE-LMC0531 5 30 2.1 -69 31 36.2 -4.24 9.30 0.05 3.91 3NGC2005 5 30 10.3 -69 45 9.0 -13.12 10.22 0.14 5.49 4NGC2002 5 30 21.0 -66 53 2.0 -8.57 7.10 0.20 4.05 1ESO86SC2 5 30 22.0 -65 54 32.0 -7.39 7.50 0.20 3.88 1BSDL2001 5 30 25.4 -67 13 17.9 -6.74 7.81 0.18 3.82 2NGC2010 5 30 35.0 -70 49 11.0 -6.78 8.19 0.05 4.07 4NGC2004 5 30 40.9 -67 17 9.0 -9.62 7.30 0.20 4.43 4NGC2003 5 30 53.0 -66 27 59.0 -7.78 7.40 0.20 3.97 1SL539 5 30 55.0 -70 41 42.0 -7.89 7.40 0.20 4.01 1NGC2009 5 30 58.0 -69 11 3.1 -7.60 7.50 0.20 3.96 1SL543 5 30 59.0 -71 53 35.9 -6.38 7.90 0.20 3.73 1KMHK1022 5 31 7.0 -71 57 45.0 -6.68 8.30 0.60 4.11 1SL538 5 31 17.0 -66 57 28.1 -7.92 7.40 0.20 4.03 1NGC2006 5 31 19.0 -66 58 22.1 -7.81 7.60 0.20 4.13 1NGC2019 5 31 56.6 -70 9 33.0 -12.97 10.25 0.08 5.68 4BSDL2180 5 32 1.0 -66 50 57.1 -5.01 8.70 0.60 3.71 1HS346 5 32 3.0 -69 22 10.0 -6.11 8.22 0.20 3.82 2SL558 5 32 11.9 -69 29 41.1 -5.66 8.40 0.10 3.77 3KMHK1047 5 32 18.0 -68 52 28.0 -6.59 7.74 0.19 3.72 2BRHT14b 5 32 19.0 -67 31 40.1 -7.25 7.50 0.20 3.82 1NGC2011 5 32 19.0 -67 31 16.0 -7.66 7.40 0.20 3.92 1HODGE4 5 32 25.2 -64 44 11.0 -9.29 9.34 0.10 5.39 4NGC2025 5 32 33.0 -71 43 0.8 -7.36 7.95 0.20 4.15 1BSDL2300 5 33 19.0 -68 53 32.0 -5.86 9.47 0.03 4.70 2SL569 5 33 20.4 -68 9 9.9 -5.83 9.08 0.01 4.29 2 KMHK1065NGC2031 5 33 41.1 -70 59 13.0 -8.98 8.20 0.10 5.13 4SL582 5 34 28.0 -67 7 28.9 -7.23 7.90 0.20 4.07 1HS358 5 34 35.0 -66 3 56.2 -6.05 8.30 0.20 3.86 1KMHK1098 5 34 40.0 -67 30 13.0 -6.95 7.50 0.20 3.70 1SL588 5 34 40.3 -68 18 18.5 -5.46 8.70 0.10 3.89 2 KMHK1101
The star cluster formation history of the LMC 17
Table 2. cont.
Name RA DEC MV log age ∆ log age log M Data Alternative[J2000] [J2000] [yr] [yr] [M⊙] Source Name
SL586 5 34 43.0 -66 57 45.0 -7.03 7.60 0.20 3.81 1HS359 5 34 45.5 -69 23 18.4 -5.98 9.02 0.04 4.33 2KMHK1112 5 35 16.6 -68 52 13.9 -3.77 9.38 0.11 3.78 2NGC2030 5 35 39.0 -66 1 50.2 -6.32 8.00 0.60 3.76 1HDE269828 5 36 0.4 -69 11 50.5 -7.97 7.18 0.09 3.90 2NGC2051 5 36 7.0 -71 0 42.1 -6.92 8.00 0.40 4.00 1LT-delta 5 36 10.0 -69 11 46.0 -7.94 7.30 0.20 3.96 1NGC2041 5 36 28.0 -66 59 26.2 -8.52 7.40 0.40 4.27 1SL607 5 36 31.4 -68 48 44.6 -5.66 8.59 0.07 3.90 2 KMHK1137NGC2056 5 36 34.0 -70 40 18.0 -6.73 8.40 0.05 4.20 4NGC2053 5 37 40.5 -67 24 51.4 -6.46 8.09 0.27 3.87 2IC2146 5 37 46.0 -74 46 58.0 -6.09 9.19 0.05 4.51 4M-OB1 5 38 16.0 -69 3 58.0 -7.76 7.40 0.20 3.96 1SL629 5 38 22.0 -68 46 50.7 -4.45 9.31 0.02 4.00 2 KMHK1169SL628 5 38 30.0 -67 19 57.0 -6.44 8.30 0.15 4.02 2 KMHK1166BSDL2652 5 38 31.1 -68 8 23.0 -3.93 9.24 0.11 3.73 2KMHK1188 5 39 30.0 -68 19 21.0 -4.08 9.48 0.02 4.00 2NGC2091 5 40 58.0 -69 26 11.0 -6.95 7.70 0.40 3.84 1NGC2088 5 40 58.0 -68 27 52.9 -6.32 7.90 0.20 3.71 1BSDL2794 5 41 10.0 -69 10 44.0 -5.55 9.07 0.24 4.18 2NGC2093 5 41 49.0 -68 55 15.0 -7.22 7.48 0.15 3.80 2KMHK1244 5 42 0.0 -67 20 34.1 -6.79 7.90 0.20 3.90 1NGC2100 5 42 8.6 -69 12 44.0 -9.93 7.20 0.20 4.48 4NGC2096 5 42 16.0 -68 27 29.9 -7.51 7.50 0.20 3.93 1SL663 5 42 28.8 -65 21 44.0 -7.58 9.51 0.06 5.23 4NGC2098 5 42 29.0 -68 16 28.9 -7.78 7.60 0.20 4.11 1NGC2108 5 43 56.0 -69 10 50.0 -6.18 9.01 0.05 4.40 4NGC2105 5 44 19.0 -66 55 4.1 -6.23 8.20 0.20 3.86 1
NGC2109 5 44 22.0 -68 32 48.1 -6.58 8.20 0.40 4.00 1BM32 5 44 49.0 -67 19 43.0 -6.67 7.90 0.20 3.85 1SL714 5 47 16.0 -66 52 59.2 -5.28 8.60 0.40 3.76 1NGC2117 5 47 46.0 -67 27 2.9 -6.70 7.80 0.20 3.80 1NGC2121 5 48 11.6 -71 28 51.0 -7.85 9.51 0.06 5.69 4HODGE7 5 50 3.0 -67 43 5.0 -6.24 9.17 0.05 4.47 4SL748 5 50 15.0 -70 25 40.1 -5.85 8.40 0.40 3.85 1BM112 5 50 21.0 -68 39 27.0 -5.64 8.40 0.60 3.77 1LW318 5 50 43.0 -65 18 14.0 -6.48 8.10 0.20 3.89 1NGC2127 5 51 22.0 -69 21 38.9 -6.90 7.90 0.20 3.94 1NGC2133 5 51 28.0 -71 10 28.9 -6.30 8.20 0.20 3.89 1NGC2123 5 51 43.0 -65 19 17.0 -6.01 8.20 0.20 3.77 1NGC2134 5 51 55.0 -71 5 51.0 -7.71 7.40 0.40 3.94 1NGC2130 5 52 22.0 -67 20 2.0 -6.31 7.90 0.40 3.70 1NGC2136 5 52 58.0 -69 29 36.0 -8.62 8.00 0.10 4.45 4HS445 5 53 49.0 -67 23 8.9 -6.77 8.30 0.20 4.15 1NGC2145 5 54 22.0 -70 54 4.0 -6.27 8.30 0.20 3.95 1NGC2157 5 57 32.4 -69 11 49.0 -9.09 7.60 0.20 4.31 4NGC2154 5 57 38.0 -67 15 43.0 -6.71 9.15 0.05 4.57 4NGC2156 5 57 45.0 -68 27 38.2 -7.17 7.90 0.20 4.05 1NGC2153 5 57 51.2 -66 23 58.0 -5.58 9.11 0.14 3.97 4NGC2159 5 57 57.0 -68 37 26.0 -7.10 8.00 0.20 4.08 1NGC2173 5 57 58.5 -72 58 40.0 -7.33 9.33 0.08 5.06 4NGC2160 5 58 11.0 -68 17 24.0 -6.30 8.00 0.20 3.75 1NGC2155 5 58 33.3 -65 28 35.0 -6.68 9.51 0.06 4.90 4NGC2164 5 58 55.9 -68 31 0.0 -8.61 7.70 0.20 4.12 4NGC2172 6 0 4.0 -68 38 12.8 -6.80 7.90 0.20 3.90 1NGC2162 6 0 30.4 -63 43 19.0 -6.33 9.11 0.14 4.40 4NGC2190 6 1 2.0 -74 43 33.0 -5.56 9.04 0.05 4.17 4SL822 6 2 5.0 -68 20 8.2 -5.45 8.80 0.60 3.96 1NGC2203 6 4 42.0 -75 26 16.0 -7.21 9.26 0.05 5.05 4NGC2193 6 6 17.0 -65 5 54.0 -6.23 9.34 0.10 4.42 4SL842 6 8 14.9 -62 59 15.0 -5.34 9.30 0.09 4.08 4NGC2209 6 8 34.8 -73 50 12.0 -7.90 8.98 0.19 5.03 4NGC2213 6 10 42.2 -71 31 46.0 -6.48 9.20 0.11 4.56 4

18 Baumgardt et al.
Table 2. cont.
Name RA DEC MV log age ∆ log age log M Data Alternative[J2000] [J2000] [yr] [yr] [M⊙] Source Name
SL855 6 10 53.7 -65 2 30.0 -5.01 9.13 0.30 4.58 4NGC2210 6 11 31.5 -69 7 17.0 -8.00 10.20 0.01 5.48 4NGC2214 6 12 55.8 -68 15 38.0 -8.41 7.60 0.20 4.50 4LW431 6 13 27.0 -70 41 42.0 -4.83 9.18 0.05 3.94 4HODGE11 6 14 22.3 -69 50 50.0 -7.50 10.18 0.01 5.63 4NGC2231 6 20 42.7 -67 31 10.0 -7.03 9.18 0.11 5.18 4NGC2241 6 22 53.0 -68 55 30.0 -5.25 9.28 0.05 4.29 4NGC2249 6 25 49.8 -68 55 13.0 -6.73 8.82 0.30 4.35 4NGC2257 6 30 12.1 -64 19 42.0 -7.06 10.20 0.10 5.41 4