Embed Size (px)
Citation preview

RSC Advances
PAPER
Ope
n A
cces
s A
rtic
le. P
ublis
hed
on 0
1 M
ay 2
019.
Dow
nloa
ded
on 1
/1/2
022
7:27
:28
PM.
Thi
s ar
ticle
is li
cens
ed u
nder
a C
reat
ive
Com
mon
s A
ttrib
utio
n-N
onC
omm
erci
al 3
.0 U
npor
ted
Lic
ence
.
View Article OnlineView Journal | View Issue
Thermoelectric a
aDepartment of Physics, Mohan Lal Sukha
E-mail: [email protected] of Physics, Jai Narain Vyas UncDepartment of Pure & Applied Physics, Uni
Cite this: RSC Adv., 2019, 9, 13515
Received 2nd March 2019Accepted 16th April 2019
DOI: 10.1039/c9ra01573f
rsc.li/rsc-advances
This journal is © The Royal Society of C
nd vibrational properties of Be2C,BeMgC and Mg2C using first-principles method
V. Maurya,a U. Paliwal,b G. Sharmac and K. B. Joshi *a
Transport coefficients are calculated combining first-principles calculations with the Boltzmann transport
theory. Electronic states obtained in terms of the k-space eigen-energies from the crystalline orbital
program, based on density functional theory, are Fourier transformed and interfaced with the transport
equations modeled in the BoltzTraP. The calculations are performed for Be2C, Mg2C, and the BeMgC mixed
crystal. The Seebeck coefficient, electronic thermal conductivity and the power factor are calculated. Further,
the transport coefficients are linked to find the electronic fitness function to compare the performance with
other thermoelectric materials. The procedure can also be applied to study the thermoelectric properties of
other materials. The vibrational frequencies at the Brillouin zone centre are calculated generating a Hessian
matrix from the analytical gradients of the energy with respect to atomic coordinates in the three antifluorite
crystals. Moreover, the static, high frequency dielectric constants and Born effective charges are calculated to
find splitting in the longitudinal optic and transverse optic modes. Results are compared with the data
wherever available in the literature and a very good agreement is found in most cases.
1. Introduction
Clean energy is one of the central issues from scientic,economic and environmental points of view. Efforts havebegun to look into sustainable and efficient sources of cleanenergy.1–7 Thermoelectric (TE) and photo-voltaic devices inconjunction with renewable energy sources play a vital role inthis strategic area such as thermoelectric generators and spaceexploration.7,8 Like solar-energy conversion, the TE generatorsrequire enhanced energy efficiency and waste heat recoveryfrom the exhaust. Reliable, silent or sustainable operationsand small device size are the additional required features.7,9
The challenges are to nd materials having specic andtailored thermoelectric properties.1–9 Combining quantummechanical principles with computational power, it ispossible to simulate and predict properties of materials.4,7,10
Density functional theory (DFT) has been the backbone of suchtechniques over the last several decades.11 Now it is alsopossible to calculate thermoelectric coefficients by coupling k-space eigen-energies from rst-principles DFT methods withthe Boltzmann transport equations (BTEs).12,13 No suchprovision lies for each computational method used in generalby the community of computational materials scientists.14
These are highly needed because the performance of a TEmaterial is quantied in terms of the gure of merit (zT), and
dia University, Udaipur-313001, India.
iversity, Jodhpur-342011, India
versity of Kota, Kota-324005, India
hemistry 2019
the power factor (PF) which can be obtained theoretically vis-a-vis experimentally. Such an interface was published for theLinearized Augmented Plane Wave (LAPW) method recently.15
In this endeavor we couple the k-space eigen-vectors andeigen-energies calculated from the rst-principles periodicLinear Combination of Atomic Orbitals (LCAO) with thesecond principle model based on the BTE embodied in theBoltzTraP.16–18 The periodic LCAO method is implemented inthe CRYSTAL package.16,17 A series of this crystalline orbitalprogram in several versions has appeared in literature. Inthese, the non-cellular periodic LCAO method enables to usethe Hartree–Fock or the DF theory to nd the E–k curve andseveral other properties of a crystal. The Hartree–Fock methodtreats the exchange part exactly and correlation part verypoorly. The DFT treats both parts reasonably well butapproximately.16 The multi-valley structures of E–k curves andthe band gap of periodic solids largely depend on the theoryapplied and consequently the electronic and thermoelectricproperties vary.18 Recent trends are to use hybrid functionalsto get accurate values of the band gap and bands dispersionwhich works well in some solids.19–22 The hybrid functionalsclub merit of both approaches. Many methods use a number ofhybrid functionals from the library of exchange and correla-tion (XC) functionals. On the contrary, one can devise a hybridXC functional tuning percentage of mixing in the CRYSTAL98and higher versions.16,17 Effect on the band gap and bandsdispersion can also be examined. Therefore an interface of theperiodic LCAOmethod with the BoltzTraP will be highly usefulto predict the transport coefficients from the E–k dispersion
RSC Adv., 2019, 9, 13515–13526 | 13515

RSC Advances Paper
Ope
n A
cces
s A
rtic
le. P
ublis
hed
on 0
1 M
ay 2
019.
Dow
nloa
ded
on 1
/1/2
022
7:27
:28
PM.
Thi
s ar
ticle
is li
cens
ed u
nder
a C
reat
ive
Com
mon
s A
ttrib
utio
n-N
onC
omm
erci
al 3
.0 U
npor
ted
Lic
ence
.View Article Online
spectra provided by the periodic LCAO method.16–18 This is themajor objective of this paper.
Hitherto, oxides cover major section (�70%) of the exploredTE materials. Half or full-Heusler compounds which owe spin-polarized band structure, skutterudites, clathrates and chalco-genides share major part of the residual section.2,4,7,23–25
Alkaline-earth metal methanides are technologically importantcarbides. The complex chemical synthetic process leads toeither very low yield or very less stability.7,26 The Be2C, Mg2C andAl4C3 are among a few known alkaline-earth methanides.26–29
Interestingly, Mg2C is only recently synthesized28,29 whereas noternary methanide is studied to our knowledge. The Be2C, usedin the ceramic and nuclear technology, has attracted quite a fewtheoretical as well as experimental studies.30–38 On Mg2C, theband gap and the pressure coefficients are calculated employinglocal density approximation (LDA) in FP-LAPW method.39,40
Later it is synthesized and characterized by X-ray diffractionmethod.28,29 In our earlier work we have studied structural andbonding properties of Be2C, Mg2C and the hypothetical BeMgCdeploying the periodic LCAO method.41,42 The thermalconductivity and band gap are proposed without specifying thecarrier density or the chemical potential which is mandatory forpractical purpose.43,44 Thus there are minimal efforts on the TEstudies of carbides. So the second objective is to deploy theinterface between periodic LCAO method and the BoltzTraP tond the thermoelectric coefficients of the Be2C, Mg2C and theBeMgC. Further, we compare the TE performance with othermaterials by means of the newly introduced electronic tnessfunction (EFF).45
While modeling the properties of particularly the ceramics,nuclear and refractory materials, some limitations remain forpractical applications due to change in properties at hightemperatures. Vibrational properties and nature of bonding areelemental to the thermal behavior of crystals. Moreover, thevibration frequencies carry information regarding symmetrydriven structural stability under different conditions.1,44,47 Thefrequencies can be compared with the Infrared (IR) and Ramanspectra. Essentially, the visible and infrared radiation used inconventional IR and Raman spectroscopies interact stronglywith the phonon modes close to the Brillouin Zone (BZ)centre.1,46–48 Therefore, meaningful information can also beobtained from frequencies at the G point of the BZ in a crystal.Further, the Born effective charges (BEC) and the splitting inlongitudinal optical (LO) and transverse optical (TO) modesprovide additional features of the vibration spectra anddynamical behavior of crystals.16,17,49 Thus it is imperative toimprove upon the current understanding on the vibrationalbehavior of the three methanides. Therefore, the third objectiveof this work is to present the vibrational frequencies at the BZcentre, the BEC, static and high frequency dielectric constantsand the LO–TO splitting of vibrational frequencies in Be2C,Mg2C and BeMgC.
Following is the plan of the remaining part of the paper:calculations procedures are described in the second section.Three parts of this section contains computational details,a brief description to compute the TE properties followed by thedescription on zone centre frequencies along with the LO–TO
13516 | RSC Adv., 2019, 9, 13515–13526
splitting. Results are presented in the third section. The foursub-sections cover discussion of results on electronic, thermo-electric, vibrational and the dielectric properties. Results aresummarized in the last section.
2. Methods and computational details2.1 Periodic LCAO method
The rst-principles periodic LCAO method is applied.16,17,49,50
The salient features can be found in our earlier work.41 ThePerdew–Burke–Ernzerhof (PBE) ansatz based on the generalizedgradient approximation (GGA) is applied to treat the XC part ofthe Kohn–Sham Hamiltonian.51 The structure is optimized withan iterative method based on the total energy gradients calcu-lated analytically with respect to the nuclear coordinates andnumerically with respect to the lattice constants. The conver-gence is checked from the root-mean-square and absolute valueof the largest component of the gradients and displacements.The thresholds (in a.u.) for the maximum and the root-mean-square forces were set to 4.5 � 10�4, 3.0 � 10�4 and those fordisplacements the thresholds were 1.8 � 10�3, 1.2 � 10�3
respectively. The complete optimization was ensured when thefour conditions are simultaneously satised for the fractionalcoordinates and cell parameters. For exact treatment of theCoulomb and exchange terms of the total energy operator,computation of integrals over an innite series is manda-tory.16,17,49,50 To achieve it in practice, each innite series needsto be truncated by setting threshold values of controllingparameters. These tolerance (T) parameters ensure that beyondcutoff limits the contribution to the total sum is smaller than10�T that can be neglected. In current calculations, ve toler-ances of the order of 10�7, 10�7, 10�7, 10�7 and 10�12 wereundertaken to truncate Coulomb and exchange sum.17,49,50 TheSCF process is stopped when two successive cycles differ inenergy by less than 10�8 Hartree in geometry optimization and10�12 Hartree in force calculations. The antiuorite structurebelonging to the space group Fm�3m (#225) is taken for the threecarbides. The lattice parameters and bulk modulii deducedfrom the equation of state E(V) are the same as described in ourearlier work for this crystal structure of the three carbides.41
2.2 Transport properties
The gure of merit zT, expressed above, depends on the thermalconductivity (k) which contains both electronic (ke) and lattice(kl) contributions. The electronic part (ke) is usually low insemiconductors. However, band gaps and bandwidth in thevicinity of Fermi level affect the electronic part associated withTE properties. It is well known that many XC functionals arebeing used by the community which show variation in the bandgap of semiconductors. Usage of hybrid functional brings theband gap values close to the many body GW calculations whichare believed to give accurate band gap in semiconductors.19–21
Better agreement of band gap from quasi particle or GWcalculations with the hybrid functional and also with experi-ments, in some cases, is ascribed to the fact that hybrid func-tionals essentially augment LDA or GGA by non-local
This journal is © The Royal Society of Chemistry 2019

Paper RSC Advances
Ope
n A
cces
s A
rtic
le. P
ublis
hed
on 0
1 M
ay 2
019.
Dow
nloa
ded
on 1
/1/2
022
7:27
:28
PM.
Thi
s ar
ticle
is li
cens
ed u
nder
a C
reat
ive
Com
mon
s A
ttrib
utio
n-N
onC
omm
erci
al 3
.0 U
npor
ted
Lic
ence
.View Article Online
exchange.19–21 The underestimation of band gap by DFT hascommonly been attributed to the inappropriate treatment of theXC functional20–22,52 and the incomplete cancellation of thearticial self-interaction20,52 within the LDA (local) or GGA(semi-local) descriptions. The hybrid functional, generally,combines the 1
4 non-local exchange,34 of the semi-local exchange
with the correlation functional.16,17,20–22,50 The Kohn–Shameigenvalues generated using such XC functionals are closer tothose generated from many body perturbation theory. Here,therefore, we have also deduced band energies using a PBE0hybrid functional.20–22,52
Now it has become possible to unravel thermoelectricproperties by combining rst-principles methods with theBTE.15,18,53 The requisite formulation to nd tensors of transportcoefficients from band energies, 3ik of the ith band at a k pointcan be found elsewhere.12,13,15,18 Two approximations are madeto simplify the calculation procedure. Firstly, in the constantrelaxation time approximation si,k ¼ s for all i,k and secondly, inthe rigid-band approximation we assume that the band struc-ture does not vary with temperature or doping. The formulationgives the electrical conductivity tensor s, thermal conductivitytensor ke and the Seebeck coefficient S. The temperature andchemical potential (m) dependent tensors determine thenumber of charge carriers.15,18,53 The thermoelectric quantitiesare obtained from the average of the diagonal components ofthe Seebeck and electrical conductivity tensors.
To compute these tensors, the band energies calculated fromthe converged electronic charge density using periodic LCAOmethod over a dense grid of k-points need to be linked with theBoltzTraP. To achieve this an interface is created. The interfacearranges the E–k spectrum from the LCAO method and writesinto the case.energy le required for processing by the Boltz-TraP to compute the transport coefficients. The interface alsotakes care of the units conversion of the energy and the k-vectors. Lattice vectors and symmetry related information of thecrystal under investigation are given in the case.struct le.Thereaer another required le namely case.intrans is gener-ated to completely ll the basket of les BoltzTraP.def. A ow-chart of the entire process can be found in our recent workwhere a similar interface is created to link the energy spectrumfrom the LAPW method with the BoltzTraP.15 In the currentstudy the band energies are calculated over a dense grid sizeleading to �10 000 k-points in the irreducible BZ of the threecrystals. The k-points were adequate to ensure convergence inFourier expansion coefficients.
Performance of a TE material is quantied in terms ofgure of merit (zT) dened as zT ¼ (SsT)/k where S is theSeebeck coefficient, s is electrical conductivity, k is thermalconductivity, and T is absolute temperature. The quantity S2s,known as the power factor (PF) is of profound interest tocharacterize TE materials theoretically as well as experimen-tally. An ideal TE should follow an electron-crystal phonon-glass model because high zT requires a large S, high s andlow k. First two transport coefficients also ensure high PF. Formetals and semiconductors, the Seebeck coefficient is givenby:54
This journal is © The Royal Society of Chemistry 2019
S ¼ 2kb2
3eħ2m*
DOST�p3n
�2=3: (1)
So for high power at certain temperature, a material shouldhave high effective mass and low carrier density, which in turnreduces s. The effective mass comes from the complexity of theelectronic band structure. The degree to which the bandstructure can be decoupled with the electrical conductivity andS is quantied by means of the EFF. Otherwise these havecounterpoising role in determining the gure of merit and thePF. The EFF (or the t function) is dened as45 t ¼ (s/s)S2(N/V)2/3,where s is the relaxation time, s/s and S are directly obtainedfrom band structure and the BTE, (N/V) is the volumetric densityof states directly proportional to the density of states effectivemass ðm*
DOSÞ and the Fermi energy (EF) as:�NV
�fðm*
DOSÞ3=2
EF1=2. The function captures the behaviour that
quanties the favourable thermoelectric performance that isuseful to scrutinize on a scale. The unit of the t-function turns
out to beW5=3
K2
mffiffiffiS3
p .
2.3 Zone centre frequencies and dielectric tensors
In periodic systems the phonon frequencies at the G point arecalculated by diagonalizing the mass weighted Hessian matrix(Wij) within the harmonic approximation as:16,17,49,50,55–57
Wk¼0ij ¼
XG
H0Gijffiffiffiffiffiffiffiffiffiffiffiffi
MiMj
p ; (2)
whereMi andMj are themasses of the atoms associated with theith and jth coordinates, respectively. Hessian H0G
ij is the secondderivative of the electronic and nuclear repulsive energy E at u¼0 with respect to displacement ui ¼ xi � x0iof atom A in the 0th
cell, and displacement uj ¼ xj � x0j of atom B in the Gth cell fromthe equilibrium positions x0i; x
0j:
XG
H0Gij ¼
XG
"v2E
vu0i vuGj
#0
; i ¼ 1; ::::3N; j ¼ 1; ::::3N: (3)
The Hessian at u ¼ 0 is calculated by the analytical evalua-tion of the rst derivative Fjof E with respect to the atomicdisplacements:
Fj ¼XG
vGj ¼XG
"vE
vuGj
#; j ¼ 1; ::::::; 3N; (4)
and the numerical evaluation of the derivative�vFj
vu0i
�0
. Since the
displacement step considered here is ui ¼ 0.001 A, the corre-sponding change in energy is very small and therefore tighttolerance in the self-consistent-eld cycles is taken.
The effect of dynamical charge due to macroscopic electriceld associated with the coherent displacement of crystal nucleican be included in the Hessian as a correction.55–58 It takes careof the long range Coulomb interaction and results into LO–TO
RSC Adv., 2019, 9, 13515–13526 | 13517

RSC Advances Paper
Ope
n A
cces
s A
rtic
le. P
ublis
hed
on 0
1 M
ay 2
019.
Dow
nloa
ded
on 1
/1/2
022
7:27
:28
PM.
Thi
s ar
ticle
is li
cens
ed u
nder
a C
reat
ive
Com
mon
s A
ttrib
utio
n-N
onC
omm
erci
al 3
.0 U
npor
ted
Lic
ence
.View Article Online
splitting. The LO frequencies are obtained by the additionalnon-analytic term to the dynamical matrix (eqn (2)):
Wk/0ij ¼ 1ffiffiffiffiffiffiffiffiffiffiffiffiffiffi
MaMb
p 4p
U
�Pk
qkZ*a;ki
� Pk0qk0Z
*b;k0 j
!Pkk0qk3
Nkk0qk0
; (5)
where U is the cell volume and Z*ais the BEC tensor of atom a.
The electronic dielectric tensor is evaluated using a nite eldsaw-tooth model50 and the BEC tensor is obtained from thelocalised Wannier functions.50,58 The ionic contributiondeduced from frequency eigenvalues um, eigenvector V andBorn tensor Z are added in 3N to nd the static dielectric tensor:
30ijðuÞ ¼ 3ijN þ 4p
U
Xm
Zm;iZm;j
um2 � u2
; (6)
where Zm;i ¼Pa;jZ*a;ijVða;iÞj , u is the electric eld frequency,
a labels the N atoms of the unit cell, and i and j indicate thethree Cartesian components.
3. Results and discussion3.1 Electronic states
The lattice constant and bulk modulus reported in our earlierpublication are well reproduced from the total energy curves ofthe three crystals.41 The bands dispersion curves delineatingmicroscopic picture of electronic bands are described in Fig. 1.The bands structures show that each carbide has indirect bandgap with the valence band maximum (VBM) at G and theconduction bandminimum (CBM) at X. The G–X gaps, for Be2C,BeMgC and Mg2C, in order, are 2.90, 1.86 and 2.05 eV. Likewise
Fig. 1 Band structures and the DOS of three carbides using the PBE fun
13518 | RSC Adv., 2019, 9, 13515–13526
G–G direct gaps are 4.24, 4.21 and 3.53 eV. Similar calculationsusing PBE0 hybrid functional21 suggest that G–X gaps, sequen-tially for Be2C, BeMgC and Mg2C are 4.37, 3.24 and 3.46 eVwhereas the G–G direct gaps are 5.77, 5.59 and 5.19 eV. ThusPBE0 gives larger band energies and band gaps than the PBE.Band gap measurement is attempted only for the Be2C and G–Xindirect band gap is reported.38,40 The authors did not proposedenite value but concluded that the band gap may be morethan at least 1.3 eV.37,38 Moreover, X1v and X 0
4v bands observed at�11.5 and�6.7 eV from VBM in LEED, ARPES and NEXAFSexperiments are found at �11.46 and�6.79 eV by PBE calcula-tions. The PBE0 functional locates these bands at�12.87 eVand�7.71 eV. Thus energies of these states are very wellproduced by PBE–GGA in case of Be2C. In case of Mg2C onlya few calculations are available for comparison. The publishedcalculations reveal that indirect (direct) band gap lies in the0.67–0.97 eV (1.34–1.9 eV) range.28,40,43 So both PBE and PBE0predict band gaps beyond the limits proposed by earlierworkers. The LDA used by earlier workers may be the reason forthis discrepancy.52 In BeMgC, interestingly PBE0 calculationgives a value of 5.6 (�0.1) eV for both G–K and G–G gaps. Thesetwo gaps are separated by 0.25 eV in the PBE bands structure.Current results follow the trends of compounds with identicalcrystal structure wherein the band gap is found more in thecompound with lighter elements.59
It is known that DOS gives the number of electronic statesintegrated over k-space in a nite energy interval. The curvesshowing electronic DOS are displayed on the right hand panelsof Fig. 1. The occupied DOS can be divided into two parts. Inrst part, the occupied valence band below �10 eV is largelyconstituted by the C-2s state present in the three carbides. Inthe second part, the upper valence bands extend from �9.5 to
ctional.
This journal is © The Royal Society of Chemistry 2019
Paper RSC Advances
Ope
n A
cces
s A
rtic
le. P
ublis
hed
on 0
1 M
ay 2
019.
Dow
nloa
ded
on 1
/1/2
022
7:27
:28
PM.
Thi
s ar
ticle
is li
cens
ed u
nder
a C
reat
ive
Com
mon
s A
ttrib
utio
n-N
onC
omm
erci
al 3
.0 U
npor
ted
Lic
ence
.View Article Online
0 eV approaching to the Fermi level. The interacting cationic (Beand or Mg) 2s2p and C-2p states constitute states in this region.Additionally, the cationic 2p states interact in bonding and anti-bonding modes with C-2p state to form remaining valencebands as well as a few conduction bands in the vicinity of Fermienergy. There is a minor contribution of outer cation s statesalso. Difference in the DOS of three carbides can be marked byappearance of peaks. The peaks like structures are absent inBe2C and clearly visible in the other two compounds. Thesebands have typical character of C-2p states and play major rolein the thermoelectric properties. Both DOS and dispersioncurves reveal that the lowest valence band of Be2C is very deephaving the largest width and least number of states. On thecontrary, in Mg2C corresponding band has the shortest widthand maximum number of states. This is a manifestation of atbands in Mg2C. The at bands are normally seen in materialswith ionic character. So, the DOS of BeMgC indicate mixed ionicand covalent character.
3.2 Thermoelectric properties
As discussed before, experimental studies of band energies andgaps are reported only for Be2C and the characteristic energiesfrom PBE are in very good agreement compared to the PBE0hybrid functional. Also, in a study on SrRuO3 several XC func-tionals were applied to compute the TE properties and PBE wasfound to be the most suitable.60 Therefore, we use the PBEeigen-energies at k points to compute the TE properties. Alsothese properties are studied under the constant relaxation timeapproximation wherein s is a constant, and the band structureis independent of both temperature and doping. The relaxationtime can be estimated from the experimental electricalconductivity s at given carrier density and temperature. In caseof Be2C, such a specied value of electrical conductivity is notavailable. So we have compared the optimum value of s/sdeduced directly from the BTE with the reciprocal of theexperimental resistivity r ¼ 103 mU cm (ref. 61) at 300 K whichgives s ¼ 4 � 10�14 s. In absence of such a data for three
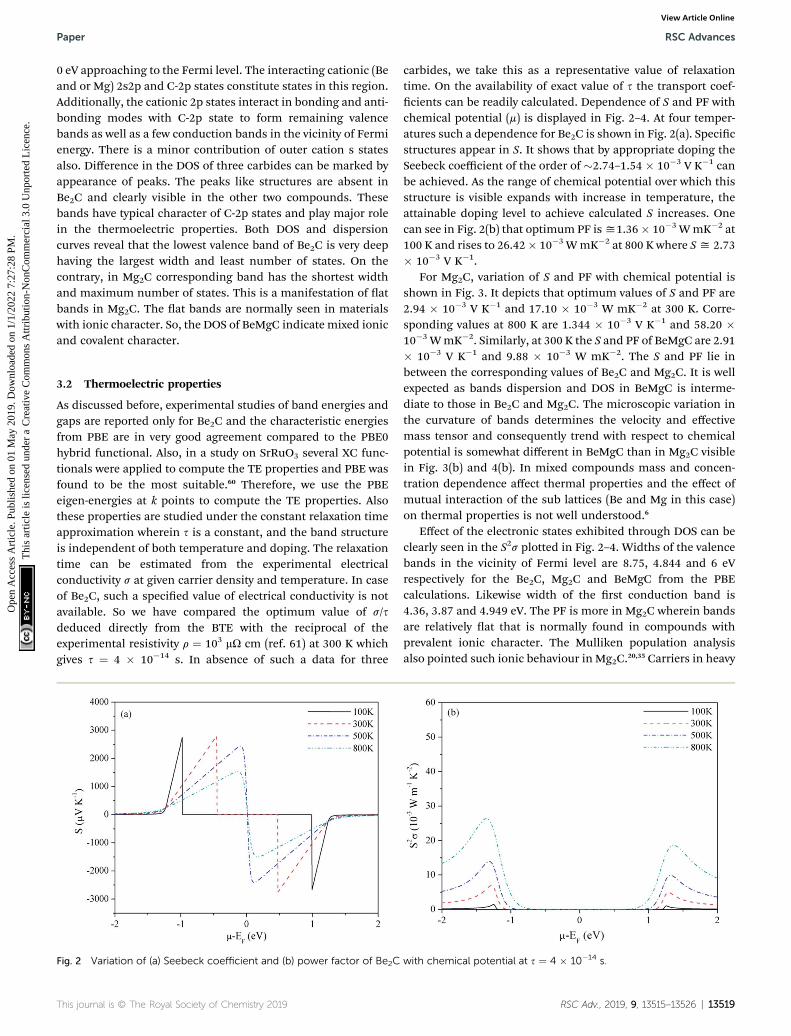
Fig. 2 Variation of (a) Seebeck coefficient and (b) power factor of Be2C
This journal is © The Royal Society of Chemistry 2019
carbides, we take this as a representative value of relaxationtime. On the availability of exact value of s the transport coef-cients can be readily calculated. Dependence of S and PF withchemical potential (m) is displayed in Fig. 2–4. At four temper-atures such a dependence for Be2C is shown in Fig. 2(a). Specicstructures appear in S. It shows that by appropriate doping theSeebeck coefficient of the order of �2.74–1.54 � 10�3 V K�1 canbe achieved. As the range of chemical potential over which thisstructure is visible expands with increase in temperature, theattainable doping level to achieve calculated S increases. Onecan see in Fig. 2(b) that optimum PF isy1.36� 10�3 WmK�2 at100 K and rises to 26.42� 10�3 WmK�2 at 800 K where Sy 2.73� 10�3 V K�1.
For Mg2C, variation of S and PF with chemical potential isshown in Fig. 3. It depicts that optimum values of S and PF are2.94 � 10�3 V K�1 and 17.10 � 10�3 W mK�2 at 300 K. Corre-sponding values at 800 K are 1.344 � 10�3 V K�1 and 58.20 �10�3 WmK�2. Similarly, at 300 K the S and PF of BeMgC are 2.91� 10�3 V K�1 and 9.88 � 10�3 W mK�2. The S and PF lie inbetween the corresponding values of Be2C and Mg2C. It is wellexpected as bands dispersion and DOS in BeMgC is interme-diate to those in Be2C and Mg2C. The microscopic variation inthe curvature of bands determines the velocity and effectivemass tensor and consequently trend with respect to chemicalpotential is somewhat different in BeMgC than in Mg2C visiblein Fig. 3(b) and 4(b). In mixed compounds mass and concen-tration dependence affect thermal properties and the effect ofmutual interaction of the sub lattices (Be and Mg in this case)on thermal properties is not well understood.6
Effect of the electronic states exhibited through DOS can beclearly seen in the S2s plotted in Fig. 2–4. Widths of the valencebands in the vicinity of Fermi level are 8.75, 4.844 and 6 eVrespectively for the Be2C, Mg2C and BeMgC from the PBEcalculations. Likewise width of the rst conduction band is4.36, 3.87 and 4.949 eV. The PF is more in Mg2C wherein bandsare relatively at that is normally found in compounds withprevalent ionic character. The Mulliken population analysisalso pointed such ionic behaviour in Mg2C.20,35 Carriers in heavy
with chemical potential at s ¼ 4 � 10�14 s.
RSC Adv., 2019, 9, 13515–13526 | 13519

Fig. 3 Variation of (a) Seebeck coefficient and (b) power factor of Mg2C with chemical potential at s ¼ 4 � 10�14 s.
Fig. 4 Variation of (a) Seebeck coefficient and (b) power factor of BeMgC with chemical potential at s ¼ 4 � 10�14 s.
RSC Advances Paper
Ope
n A
cces
s A
rtic
le. P
ublis
hed
on 0
1 M
ay 2
019.
Dow
nloa
ded
on 1
/1/2
022
7:27
:28
PM.
Thi
s ar
ticle
is li
cens
ed u
nder
a C
reat
ive
Com
mon
s A
ttrib
utio
n-N
onC
omm
erci
al 3
.0 U
npor
ted
Lic
ence
.View Article Online
band (at band structure) have low velocity and large effectivemass so Seebeck coefficient is somewhat higher in Mg2C. Theoverall effect is the maximum PF of Mg2C among the threecarbides. The dependence of PF on m is shown in Fig. 2(b)–4(b)reveal that PF depends strongly on the sign of chemicalpotential. The curves signify better performance of threecarbides with p-type doping. The asymmetry with respect to signis lowest in the Be2C and maximum in Mg2C. The asymmetry issufficiently large inMg2C and BeMgC to propose p-type majoritycarriers. So both Mg2C and the BeMgC could, in principle, makea good TE unlike Be2C.
In Fig. 5–7, we plot temperature and concentration depen-dence of S and PF. The optimum values of the S and PF aremaximum for Mg2C followed by BeMgC and the Be2C. In thegures both coefficients increase with temperature. The value ofS is comparable to the experimental values 147 mV K�1 in SrTiO3
which has band gap 3.25 eV.62 The difference in the relaxationtime and band gap may cause the residual deviation.60,62
13520 | RSC Adv., 2019, 9, 13515–13526
In the three cases the maximum PF is well around theexperimentally realizable high doping (up to 1020 cm�3).4,7,54
The values of PF at three temperatures are listed in Table 1. Wesee that at a given temperature PF is maximum in Mg2C thatincreases with temperature. Though hole concentration corre-sponding to the maximum PF is higher in Mg2C (�7 � 1020
cm�3) it is well within the achievable experimental limits. Topredict the values of TE quantities, we need to consider thevariation resulting from the relaxation time. We have taken s ¼4 � 10�14 s in all calculations reported above. However, in thecase of Mg2C thermal conductivity �34 W mK�1 is reported at300 K using plane wave pseudopotential (PP) method.43,44 Thecomparison with the optimum value obtained in the currentcalculations give s ¼ 4.4 � 10�15 s.43 It alters the relaxation timeby a factor of�10�1. Therefore we calculated optimum values ofPF and ke also at s ¼ 4.4 � 10�15 s, and give in Table 1. Itfurnishes the range of transport coefficients. Reviews on thebasis of high-throughput calculations suggest that PF morethan 3 � 10�3 W mK�2 at experimentally realizable doping are
This journal is © The Royal Society of Chemistry 2019
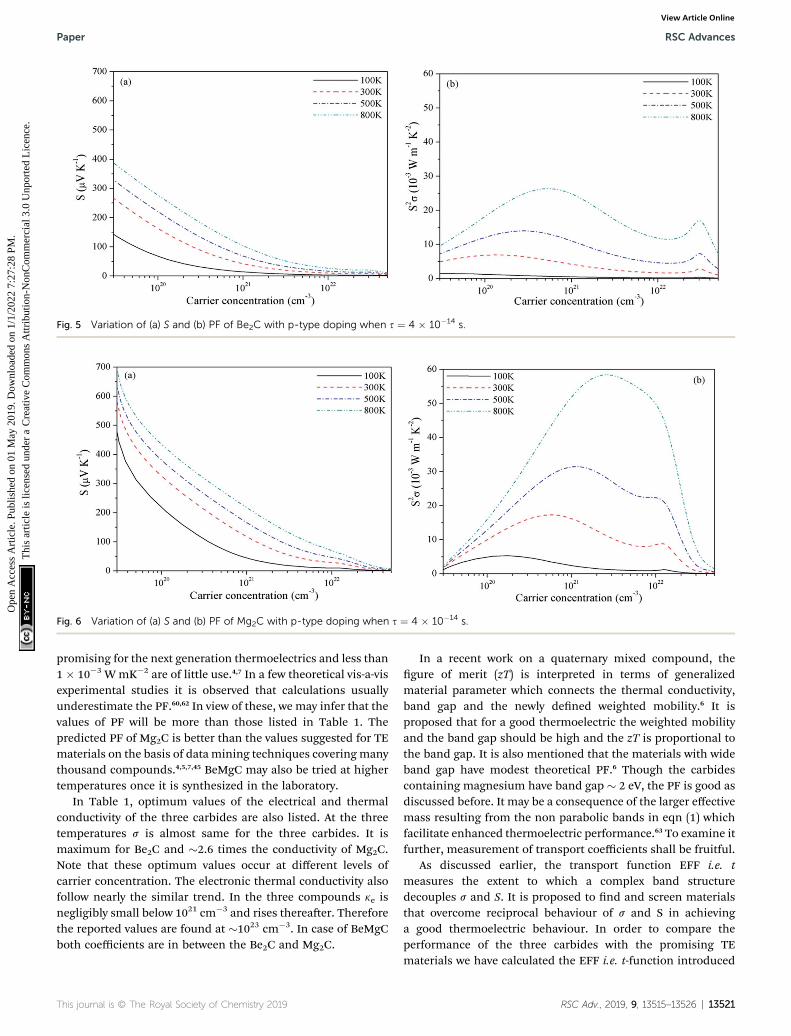
Fig. 5 Variation of (a) S and (b) PF of Be2C with p-type doping when s ¼ 4 � 10�14 s.
Fig. 6 Variation of (a) S and (b) PF of Mg2C with p-type doping when s ¼ 4 � 10�14 s.
Paper RSC Advances
Ope
n A
cces
s A
rtic
le. P
ublis
hed
on 0
1 M
ay 2
019.
Dow
nloa
ded
on 1
/1/2
022
7:27
:28
PM.
Thi
s ar
ticle
is li
cens
ed u
nder
a C
reat
ive
Com
mon
s A
ttrib
utio
n-N
onC
omm
erci
al 3
.0 U
npor
ted
Lic
ence
.View Article Online
promising for the next generation thermoelectrics and less than1 � 10�3 WmK�2 are of little use.4,7 In a few theoretical vis-a-visexperimental studies it is observed that calculations usuallyunderestimate the PF.60,62 In view of these, we may infer that thevalues of PF will be more than those listed in Table 1. Thepredicted PF of Mg2C is better than the values suggested for TEmaterials on the basis of datamining techniques covering manythousand compounds.4,5,7,45 BeMgC may also be tried at highertemperatures once it is synthesized in the laboratory.
In Table 1, optimum values of the electrical and thermalconductivity of the three carbides are also listed. At the threetemperatures s is almost same for the three carbides. It ismaximum for Be2C and �2.6 times the conductivity of Mg2C.Note that these optimum values occur at different levels ofcarrier concentration. The electronic thermal conductivity alsofollow nearly the similar trend. In the three compounds ke isnegligibly small below 1021 cm�3 and rises thereaer. Thereforethe reported values are found at �1023 cm�3. In case of BeMgCboth coefficients are in between the Be2C and Mg2C.
This journal is © The Royal Society of Chemistry 2019
In a recent work on a quaternary mixed compound, thegure of merit (zT) is interpreted in terms of generalizedmaterial parameter which connects the thermal conductivity,band gap and the newly dened weighted mobility.6 It isproposed that for a good thermoelectric the weighted mobilityand the band gap should be high and the zT is proportional tothe band gap. It is also mentioned that the materials with wideband gap have modest theoretical PF.6 Though the carbidescontaining magnesium have band gap � 2 eV, the PF is good asdiscussed before. It may be a consequence of the larger effectivemass resulting from the non parabolic bands in eqn (1) whichfacilitate enhanced thermoelectric performance.63 To examine itfurther, measurement of transport coefficients shall be fruitful.
As discussed earlier, the transport function EFF i.e. tmeasures the extent to which a complex band structuredecouples s and S. It is proposed to nd and screen materialsthat overcome reciprocal behaviour of s and S in achievinga good thermoelectric behaviour. In order to compare theperformance of the three carbides with the promising TEmaterials we have calculated the EFF i.e. t-function introduced
RSC Adv., 2019, 9, 13515–13526 | 13521

Fig. 7 Variation of (a) S and (b) PF of BeMgC with p-type doping when s ¼ 4 � 10�14 s.
Table 1 Calculated PF, s and ke at the optimum carrier density and two relaxation times (s)
Temp (K) Transport coefficients
Be2C BeMgC Mg2C
4 � 10�14 s 4.4 � 10�15 s 4 � 10�14 s 4.4 � 10�15 s 4 � 10�14 s 4.4 � 10�15 s
300 PF(10�3 W mK�2) 6.78 0.75 9.88 1.09 17.10 1.93ke (W mK�1) 628 68 334 38.4 244 27.00s (106 S m�1) 86.7 9.5 47 5.2 33 3.7
500 PF(10�3 W mK�2) 13.93 1.52 19.40 2.13 31.00 3.43ke (W mK�1) 1043 116 578.9 63.94 409 45.00
800 PF(10�3 W mK�2) 26.33 2.88 35.94 3.96 58.20 6.47ke (W mK�1) 1678 186 922.2 101.18 655 71
RSC Advances Paper
Ope
n A
cces
s A
rtic
le. P
ublis
hed
on 0
1 M
ay 2
019.
Dow
nloa
ded
on 1
/1/2
022
7:27
:28
PM.
Thi
s ar
ticle
is li
cens
ed u
nder
a C
reat
ive
Com
mon
s A
ttrib
utio
n-N
onC
omm
erci
al 3
.0 U
npor
ted
Lic
ence
.View Article Online
recently.45 The EFF for three crystals are plotted in Fig. 8. Thefunction gradually decreases and becomes negligible beyond1022 cm�3. At higher temperature the EFF is more. According tothe screening criteria, the p-type materials having EFF morethan that of FeNbSb (0.75 � 1012 W5/2 ms�1/3 K�2 at 300 K and2.10 � 1012 W5/2 ms�1/3 K�2 at 800 K, shown by horizontal linesin Fig. 8) are useful in TE applications.45 The optimum value ofPF for this reference compound lies in the 4.3 to 5.5 � 10�3 WmK�2 range at 800 K. The Mg2C has the PF in this range and theEFF is more than FeNbSb up to a certain carrier concentration.Thus Mg2C ts into this criterion. Moreover, it turns out to bea better TE compared to the similar p-type compound Mg2Ge (t¼ 0.85). The Mg2Si (t ¼ 1.18) is albeit better than the Mg2C.45
The EFF of Be2C also satises the screening criterion but the PFis somewhat lower and other type of carriers will also have somecontribution which does not help to make it a goodthermoelectric.
3.3 Vibrational frequencies and LO–TO splitting
The IR and Raman frequencies are calculated at the zone centrei.e. at G-point of the BZ. The classied active modes and cor-responding frequencies are listed in Table 2. For the antiuoritecrystals the group theory suggests either g or u type modes. The
13522 | RSC Adv., 2019, 9, 13515–13526
Be2C and Mg2C contain six optical modes at the G point. Theirreducible presentation for the two crystals is:
G ¼ 3F2g 4 6F1u. (7)
The g and u indicate symmetric and anti symmetric normalmodes. F1u arises from the Cation–C(apical) whereas F1g arisesfrom the C(central)–C(apical) vibrations. In Be2C, excluding thethree translational acoustic modes belonging to the F1u repre-sentation, there are 3 Raman active (3F2g) and 3 IR active (3F1u)optic modes. The Raman active modes vibrate at 722.41 cm�1
and IR active modes at 632.48 cm�1. In the long wavelengthlimit, optical phonons couple to the macroscopic electric eldsin ionic crystals. It manifests in the difference in the frequencyof LO and TO at the G-point and shows the LO–TO split. In Be2C,the LO, TO modes do not overlap and the anti-symmetric IRoptical mode exhibits an LO–TO split of 333.34 cm�1.
In Mg2C, the three Raman active modes vibrate at389.18 cm�1 while IR active modes vibrate at 421.78 cm�1.These are in very good agreement with 387.76 cm�1,437.79 cm�1 reported by PP method28 and 387 cm�1, 428 cm�1
reported by Quantum Espresso using norm-conserving PPmethod.64 Calculations using LDA in the PAW method foundthese modes at 406.26 and 559.44 cm�1.43 So each calculation,
This journal is © The Royal Society of Chemistry 2019

Fig. 8 Concentration and temperature dependence of the EFF (the t-function) for (a) Be2C, (b) Mg2C and (c) BeMgC. The horizontal linesmark that materials having EFF above these lines at 300 and 800 K arevery good thermoelectric.
Paper RSC Advances
Ope
n A
cces
s A
rtic
le. P
ublis
hed
on 0
1 M
ay 2
019.
Dow
nloa
ded
on 1
/1/2
022
7:27
:28
PM.
Thi
s ar
ticle
is li
cens
ed u
nder
a C
reat
ive
Com
mon
s A
ttrib
utio
n-N
onC
omm
erci
al 3
.0 U
npor
ted
Lic
ence
.View Article Online
except the one using PAW, gives nearly similar frequencies. It isobserved that Mg2C is synthesized at 15 GPa and fully recover-able under ambient conditions. In view of this it is remarkableto see absence of negative zone centre frequencies in Mg2Ccalculations. The BeMgC mixed crystal shows the G ¼ 9F irre-ducible representation with reduced symmetry and 9 modes.The rst three IR and Raman active acoustic modes have zerofrequencies. There are two sets of optic modes. In each set, thethree TO modes have 519.83 cm�1 and 565.59 cm�1 frequen-cies. Both these sets are IR and Raman active and show mixingof the TO and LO modes. Although absence of imaginaryfrequencies alone does not ascertain stability of crystals, thenon-appearance in BeMgC increases the chances of BeMgCsynthesis in laboratory.
The vibrational frequencies and the active modes changewith atoms and symmetry. The optical modes are sensitive tothe inter-cellular interaction and therefore generalized trend
This journal is © The Royal Society of Chemistry 2019
(uL)2 J (uT),2 is usually seen in the vibration spectra of the three
materials. Unlike pure methanides, BeMgC shows mixing of theLO–TO modes. The replacement of Be by Mg reduces symmetryand the interaction between Be–Mg cations leads to thelowering of the LO frequency by 17.7 cm�1 from the TOmode of565.59 cm�1 frequency. In fact, one of active Raman mode ari-ses from the vibration of cations. The Be–Be bond length (dBe–Bey a/2) and mass is lower than the Mg–Mg so the frequency islarger in Be2C. In BeMgC, both inter-cellular environment andappearance of Be–Mg bonds alter the frequencies of vibration.Further, electro-negativity of Be and Mg leads to asymmetry inpolarization which causes mixing of the LO, TO modes inBeMgC.
3.4 Born effective charges and dielectric properties
Now we present the calculated BEC, high frequency (3N) and thestatic dielectric tensors (30). BEC is the derivative of polarizationwith respect to atomic position at zero macroscopic electriceld. Hence this and related quantities exhibit dynamicalproperties of crystals and categorized mathematically as tensor.The BEC captures change in polarization with respect to atomicdisplacement. The three crystals show isotropic behaviour andthe values are given in Table 3. Calculated BEC on two cationsand carbon is about 20% lower than the formal charge(+2|e|;�4|e|) in the two methanides. In BeMgC, the dynamicalcharges on the three atoms are less in comparison to the formalcharge. We found the maximum reduction (�30%) on theberyllium. Further, we note that Z*
C ¼ 2Z*Cation and the sum ruleP
a
Z*a;ij ¼ 0 is very well followed. The BEC, dielectric constants
and susceptibility reveal that the tendency of polarization underelectric eld is more in Be2C and less in the Mg2C. It leads toa larger contribution of vibrational part (Column-VII) in the 30
(Column-V). The total contribution (30) decreases in the Be2C >BeMgC > Mg2C order. The available values of Mg2C taking LDAin the PP method64 are also given in Table 3. We note that ourresults well reconcile. A difference of �39% in the 3N is found.To check if this is due to the lattice constant, we calculated thedynamical tensors at the experimental lattice constant of Mg2C.These numbers, within parenthesis, are given in a row of Table3. Only amarginal reduction in difference (�38.5%) is observed.To check if this is due to the band gap we also calculated thedielectric constants and the refractive index using the empiricalrelations among band gap, high frequency dielectric constantsand the refractive index proposed by Moss.65 The deviations inthe dielectric constant and refractive index (n) from Mossformulation are about 13% and 7%. In case of the PP resultsdeviation rises to 20% and 29%.
The Born effective charges and the LO–TO splitting areclosely related. Themore is the BEC themore is the LO–TO split.In Table 3, the isotropic BEC are listed. The non-zero value ineach case signies the LO–TO splitting. We note that the BEC ismaximum on the constituent atoms in Be2C and the LO–TOsplit 333.34 cm�1 is the largest. This and the acquiescence ofthe BEC sum rule exhibited by the three carbides ensure reli-ability of our calculations. In Mg2C, the anti-symmetric mode
RSC Adv., 2019, 9, 13515–13526 | 13523
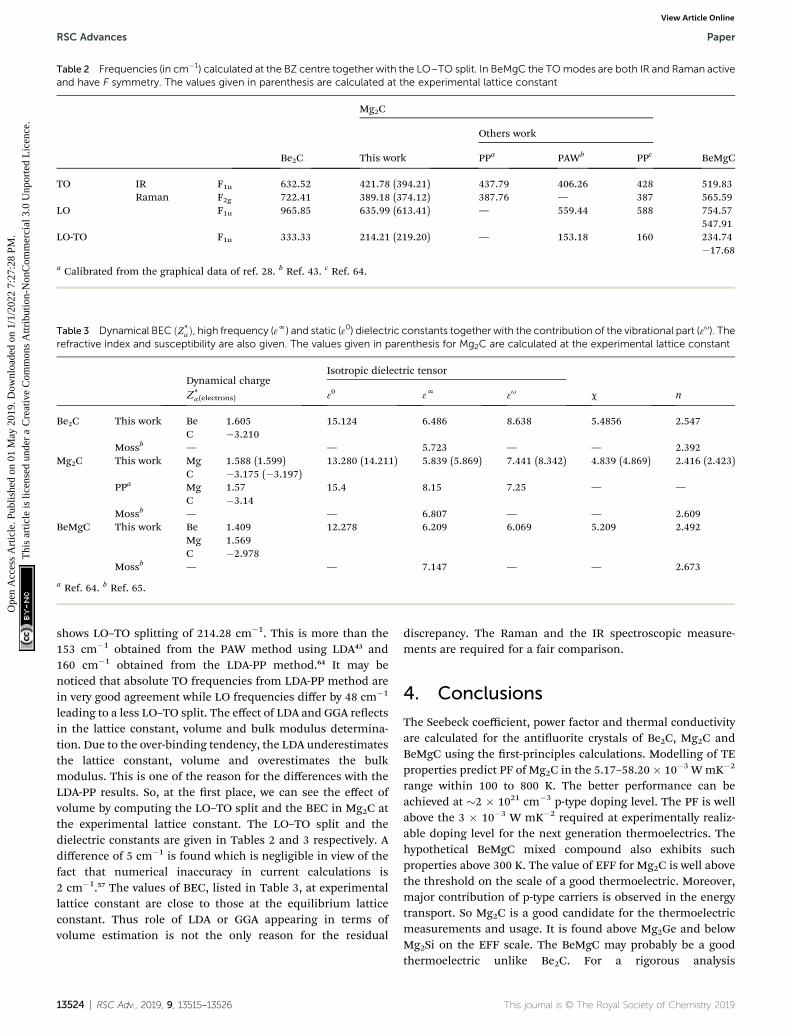
Table 2 Frequencies (in cm�1) calculated at the BZ centre together with the LO–TO split. In BeMgC the TOmodes are both IR and Raman activeand have F symmetry. The values given in parenthesis are calculated at the experimental lattice constant
Be2C
Mg2C
BeMgCThis work
Others work
PPa PAWb PPc
TO IR F1u 632.52 421.78 (394.21) 437.79 406.26 428 519.83Raman F2g 722.41 389.18 (374.12) 387.76 — 387 565.59
LO F1u 965.85 635.99 (613.41) — 559.44 588 754.57547.91
LO-TO F1u 333.33 214.21 (219.20) — 153.18 160 234.74�17.68
a Calibrated from the graphical data of ref. 28. b Ref. 43. c Ref. 64.
Table 3 Dynamical BEC ðZ*aÞ, high frequency (3N) and static (30) dielectric constants together with the contribution of the vibrational part (3u). The
refractive index and susceptibility are also given. The values given in parenthesis for Mg2C are calculated at the experimental lattice constant
Dynamical chargeZ*
a(electrons)
Isotropic dielectric tensor
c n30 3N 3u
Be2C This work Be 1.605 15.124 6.486 8.638 5.4856 2.547C �3.210
Mossb — — 5.723 — — 2.392Mg2C This work Mg 1.588 (1.599) 13.280 (14.211) 5.839 (5.869) 7.441 (8.342) 4.839 (4.869) 2.416 (2.423)
C �3.175 (�3.197)PPa Mg 1.57 15.4 8.15 7.25 — —
C �3.14Mossb — — 6.807 — — 2.609
BeMgC This work Be 1.409 12.278 6.209 6.069 5.209 2.492Mg 1.569C �2.978
Mossb — — 7.147 — — 2.673
a Ref. 64. b Ref. 65.
RSC Advances Paper
Ope
n A
cces
s A
rtic
le. P
ublis
hed
on 0
1 M
ay 2
019.
Dow
nloa
ded
on 1
/1/2
022
7:27
:28
PM.
Thi
s ar
ticle
is li
cens
ed u
nder
a C
reat
ive
Com
mon
s A
ttrib
utio
n-N
onC
omm
erci
al 3
.0 U
npor
ted
Lic
ence
.View Article Online
shows LO–TO splitting of 214.28 cm�1. This is more than the153 cm�1 obtained from the PAW method using LDA43 and160 cm�1 obtained from the LDA-PP method.64 It may benoticed that absolute TO frequencies from LDA-PP method arein very good agreement while LO frequencies differ by 48 cm�1
leading to a less LO–TO split. The effect of LDA and GGA reectsin the lattice constant, volume and bulk modulus determina-tion. Due to the over-binding tendency, the LDA underestimatesthe lattice constant, volume and overestimates the bulkmodulus. This is one of the reason for the differences with theLDA-PP results. So, at the rst place, we can see the effect ofvolume by computing the LO–TO split and the BEC in Mg2C atthe experimental lattice constant. The LO–TO split and thedielectric constants are given in Tables 2 and 3 respectively. Adifference of 5 cm�1 is found which is negligible in view of thefact that numerical inaccuracy in current calculations is2 cm�1.57 The values of BEC, listed in Table 3, at experimentallattice constant are close to those at the equilibrium latticeconstant. Thus role of LDA or GGA appearing in terms ofvolume estimation is not the only reason for the residual
13524 | RSC Adv., 2019, 9, 13515–13526
discrepancy. The Raman and the IR spectroscopic measure-ments are required for a fair comparison.
4. Conclusions
The Seebeck coefficient, power factor and thermal conductivityare calculated for the antiuorite crystals of Be2C, Mg2C andBeMgC using the rst-principles calculations. Modelling of TEproperties predict PF of Mg2C in the 5.17–58.20� 10�3 WmK�2
range within 100 to 800 K. The better performance can beachieved at �2 � 1021 cm�3 p-type doping level. The PF is wellabove the 3 � 10�3 W mK�2 required at experimentally realiz-able doping level for the next generation thermoelectrics. Thehypothetical BeMgC mixed compound also exhibits suchproperties above 300 K. The value of EFF for Mg2C is well abovethe threshold on the scale of a good thermoelectric. Moreover,major contribution of p-type carriers is observed in the energytransport. So Mg2C is a good candidate for the thermoelectricmeasurements and usage. It is found above Mg2Ge and belowMg2Si on the EFF scale. The BeMgC may probably be a goodthermoelectric unlike Be2C. For a rigorous analysis
This journal is © The Royal Society of Chemistry 2019

Paper RSC Advances
Ope
n A
cces
s A
rtic
le. P
ublis
hed
on 0
1 M
ay 2
019.
Dow
nloa
ded
on 1
/1/2
022
7:27
:28
PM.
Thi
s ar
ticle
is li
cens
ed u
nder
a C
reat
ive
Com
mon
s A
ttrib
utio
n-N
onC
omm
erci
al 3
.0 U
npor
ted
Lic
ence
.View Article Online
measurements of transport coefficients shall be fruitful.Nevertheless, the current study demonstrates that the interfaceused in this study can be well applied to explore TE properties ofother materials using the periodic LCAO method.
For the three methanides, the zone centre vibrationfrequencies are in very good agreement with other calculations.The BEC, static as well as high frequency dielectric tensors,susceptibility and refractive index are isotropic in nature for thethree crystals. A consistent trend and a good accord withavailable results is observed. Calculated BEC charges andsusceptibility show that Be2C has the maximum tendency ofpolarization and hence exhibits largest LO–TO splitting. Theband gap measurement and spectroscopic investigations of thevibrational properties of the methanides shall be helpful toexamine our ndings rigorously.
Conflicts of interest
Authors declare no conicts of interest.
Acknowledgements
VM is thankful to the UGC, New Delhi for the BSR fellowship.Partial support is also received from the grants of RUSA-Phase I.Authors gratefully acknowledge the assistance provided by S.Lemal and P. Ghosez, Universite de Liege, Belgium at variousstages of the thermoelectric calculations.
References
1 J. M. Skelton, L. A. Burton, A. J. Jackson, F. Oba, S. C. Parkerand A. Walsh, Phys. Chem. Chem. Phys., 2017, 19, 12452.
2 A. J. Hong, L. Li, R. He, J. J. Gong, Z. B. Yan, K. F. Wang, J.- MLiu and Z. F. Ren, Sci. Rep., 2016, 6, 22778.
3 T. D. Sparks, M. W. Gaultois, A. Oliynyk, J. Brgoch andB. Meredig, Scr. Mater., 2016, 111, 10.
4 W. Chen, et al., J. Mater. Chem. C, 2016, 4, 4414.5 C. G. Fu, T. J. Zhu, Y. T. Liu, H. H. Xie and X. B. Zhao, EnergyEnviron. Sci., 2015, 8, 216.
6 W. Liu, J. Zhou, Q. Jie, Y. Li, H. S. Kim, J. Bao, G. Chen andZ. Ren, Energy Environ. Sci., 2016, 9, 530.
7 A. Zevalkink, et al., Appl. Phys. Rev., 2018, 5, 021303.8 J. Yang and T. Caillat, MRS Bull., 2006, 31, 224.9 J.-P. Fleurial, M. A. Ryan, A. Borshchevsky, W. Phillips,E. A. Kolawa, G. J. Snyder, T. Caillat, T. Kascich andP. Mueller, US Pat. number 6787691, 2004.
10 W. Setyawen and S. Curtarolo, Comput. Mater. Sci., 2010, 49,299.
11 D. S. Sholl and J. A. Steckel, Density Functional Theory, JohnWiley & Sons, Hoboken, New Jersey, 2009.
12 S. Bhattacharya and G. K. H. Madsen, Phys. Rev. B: Condens.Matter Mater. Phys., 2015, 92, 85205.
13 K. P. Ong, D. J. Singh and P. Wu, Phys. Rev. B: Condens.Matter Mater. Phys., 2011, 83, 115110.
14 J. Neugebauer and H. Tilmann, Wiley Interdiscip. Rev.:Comput. Mol. Sci., 2013, 3, 438.
15 V. Maurya and K. B. Joshi, J. Alloys Compd., 2019, 779, 971.
This journal is © The Royal Society of Chemistry 2019
16 R. A. Evarestov, Quantum Chemistry of Solids: The LCAO FirstPrinciples Treatment of Crystals, Springer-Verlag, Berlin, vol.153, 2007.
17 R. Dovesi, et al., Int. J. Quantum Chem., 2014, 114, 1287.18 G. K. H. Madsen, J. Carrete and M. J. Verstraete, Comput.
Phys. Commun., 2018, 231, 140.19 K. B. Joshi, U. Paliwal and B. K. Sharma, Phys. Status Solidi B,
2011, 248, 1248.20 F. Fuchs, J. Furthmuller and F. Bechsted, Phys. Status Solidi
B, 2009, 246, 1877.21 A. D. Becke, J. Chem. Phys., 2014, 140, 18A301.22 F. Fuchs, J. Furthmuller, F. Bechstedt, M. Shishkin and
G. Kresse, Phys. Rev. B, 2007, 76, 115109.23 B. Chen, J.-H. Xu, C. Uher, D. T. Morelli, G. P. Meisner,
J.-P. Fleurial, T. Caillat and A. Borshchevsky, Phys. Rev. B:Condens. Matter Mater. Phys., 1997, 55, 1476.
24 J. Martin, G. S. Nolas, H. Wang and J. Yang, J. Appl. Phys.,2007, 102, 103719.
25 M. W. Gaultois, T. D. Sparks, C. K. H. Borg, R. Seshadri,W. D. Bonicio and D. R. Clarke, Chem. Mater., 2013, 25,2911.
26 U. Ruschewitz, Coord. Chem. Rev., 2003, 244, 115.27 R. O. G. Blachnik, P. Gross and C. Hyaman, Trans. Faraday
Soc., 1970, 66, 1058.28 O. O. Kurakevych, Y. Le Godec, T. A. Strobel and D. Y. Kim, J.
Mater. Chem. C, 2014, 118, 8128.29 O. O. Kurakevych, T. A. Strobel, D. Y. Kim and G. D. Cody,
Angew. Chem., 2013, 52, 8930.30 L. H. Rovner and G. R. Hopkins, Nucl. Technol., 1976, 29, 274.31 H. Migge, J. Nucl. Mater., 1981, 103, 687.32 W.-S. Shish, R. B. Stephens and W. J. James, Fusion Sci.
Technol., 2000, 37, 24.33 H. Kleykamp, J. Nucl. Mater., 2001, 294, 88.34 A. Anghel, C. Porosnicu, C. P. Lungu, K. Sugiyama, C. Kriger
and J. Roth, J. Nucl. Mater., 2011, 416, 9.35 M. M. Disko, J. C. H. Spence, O. F. Sankey and D. Saldin,
Phys. Rev. B: Condens. Matter Mater. Phys., 1986, 33, 5642.36 J. L. Corkill and M. L. Cohen, Phys. Rev. B, 1993, 48, 17138.37 C. H. Lee, W. R. L. Lambrecht and B. Segall, Phys. Rev. B:
Condens. Matter Mater. Phys., 1995, 51, 10392.38 C.-T. Tzeng, K.-D. Tsuei and W.-S. Lo, Phys. Rev. B: Condens.
Matter Mater. Phys., 1998, 58, 6837.39 F. Kalarasse and B. Bennecer, J. Phys. Chem. Solids, 2008, 69,
1775.40 S. Laref and A. Laref, Comput. Mater. Sci., 2008, 44, 664.41 K. B. Joshi, D. K. Trivedi, U. Paliwal and K. L. Galav, Mater.
Res. Express, 2016, 3, 55601.42 U. Paliwal, D. K. Trivedi, K. L. Galav and K. B. Joshi, AIP Conf.
Proc., 2013, 1536, 395.43 A. Chernatynskiy and S. R. Phillpot, Phys. Rev. B: Condens.
Matter Mater. Phys., 2015, 92, 64303.44 K. Kaur and R. Kumar, Chin. Phys. B, 2016, 25, 26402.45 G. Xing, J. Sun, Y. Li, X. Fan, W. Zheng and D. J. Singh, Phys.
Rev. Mater., 2017, 1, 65405.46 J. M. Skelton, S. C. Parker, A. Togo, I. Tanaka and A. Walsh,
Phys. Rev. B: Condens. Matter Mater. Phys., 2014, 89, 205203.
RSC Adv., 2019, 9, 13515–13526 | 13525

RSC Advances Paper
Ope
n A
cces
s A
rtic
le. P
ublis
hed
on 0
1 M
ay 2
019.
Dow
nloa
ded
on 1
/1/2
022
7:27
:28
PM.
Thi
s ar
ticle
is li
cens
ed u
nder
a C
reat
ive
Com
mon
s A
ttrib
utio
n-N
onC
omm
erci
al 3
.0 U
npor
ted
Lic
ence
.View Article Online
47 L. Valenzano, F. J. Torres, K. Doll, F. Pascale, C. M. Zicovich-Wilson and R. Dovesi, Z. Phys. Chem., 2006, 220, 893.
48 U. Paliwal, G. Sharma and K. B. Joshi, J. Mat. Sci., 2019, 54,1382.
49 F. Pascle, C. M. Zicovich-Wilson, G. Lopez, B. Civalleri,R. Orlando and R. Dovesi, J. Comp. Chem., 2004, 25, 888.
50 R. Dovesi, V. R. Saunders, C. Roetti, R. Orlando,C. M. Zicovich-Wilson, F. Pascale, B. Civalerri, K. Doll,N. M. Harrison, I. J. Bush, Ph. D'Arco and M. Llunell,CRYSTAL14 User's Manual, Turin:University of Torino, 2014.
51 J. P. Perdew, K. Burke and M. Ernzerhof, Phys. Rev. Lett.,1996, 77, 3865.
52 J. P. Perdew and A. Zunger, Phys. Rev. B: Condens. MatterMater. Phys., 1981, 23, 5048.
53 K. Seeger, Semiconductor Physics, Springer-Verlag,Heidelberg, 2004.
54 Y. Pei, H. Wang and G. J. Snyder, Adv. Mater., 2012, 24, 6125.55 K. Doll, N. M. Harrison and V. C. Saunders, Int. J. Quantum
Chem., 2001, 82, 1.
13526 | RSC Adv., 2019, 9, 13515–13526
56 K. Doll, Comput. Phys. Commun., 2001, 137, 74.57 C. M. Zicovich-Wilson, F. Pascale, E. Roetti, V. R. Saunders,
R. Orlando and R. Dovesi, J. Comp. Chem., 2004, 25, 1874.58 C. M. Zicovich-Wilson, A. Bert, C. Roetti, R. Dovesi and
V. R. Saunders, J. Chem. Phys., 2002, 116, 1120.59 D. M. Rowe and C. M. Bhandari, Modern Thermoelectrics,
Reston Publishing Company, Reston Virginia, 1983.60 N. Miao, B. Xu, N. C. Bristowe, D. I. Bilc, M. J. Verstraete and
P. Ghosez, J. Phys. Chem. C, 2016, 120, 9112.61 S. T. Oyama and R. Kieffer, Carbides, Kirk-Othmer Encycl.
Chem. Technol., 2000, 4, 647.62 D. I. Bilc, C. G. Floare, L. P. Zarbo, S. Garabagiu, S. Lemal and
P. Ghosez, J. Phys. Chem. C, 2016, 120, 25678.63 H. Shi, D. Parker, M.-H. Du and D. J. Singh, Phys. Rev. Appl.,
2015, 014004.64 T. Li, W. Ju, H. Liu, H. Cui, X. Zhao, Y. Yong and Z. Feng,
Comput. Mater. Sci., 2014, 93, 234.65 T. S. Moss, Proc. Phys. Soc., London, Sect. B, 1950, 63, 167.
This journal is © The Royal Society of Chemistry 2019


![L16 Naumov 11fen.nsu.ru/posob/gchem/2011_inorg_medbiol_14.pdf · 2BeO + 3C = 2CO + Be2C ( ‘) Be2C ... [Kr]4d105s2 Hg: [Xe]4f145d106s2. 18 ... Microsoft PowerPoint - L16_Naumov_11.ppt](https://img.dokumen.tips/doc/110x75/5b91d8dd09d3f2f8508c7ec0/l16-naumov-11fennsuruposobgchem2011inorgmedbiol14pdf-2beo-3c-2co.jpg)