Embed Size (px)
Citation preview
P H Y S I C A L R E V I E W X V O L U M E 9 , N U M B E R 6 JrSI.. 1 9 7 4
Thermodynamic study of the 4He monolayer adsorbed on Grafoil*
Robert L. Elgin' and David L. Goodstein Department of Physics, California Insrirure of Technology, Pasadena, California 91109
(Received 17 December 1973)
A calorimetric and vapor-pressure study of the behavior of 'He adsorbed on Grafoil III the temperature range 4 to 15 K is reported. These results have been combined with preexisting low-temperature heat-capacity data to form a complete thermodynamic description of the film, The Grafoil substrate evidently consists almost entlrely of basal-plane graphite, with only a small fraction of energetically distinct adsorption sites. Techniques of semiempirical modelling are introduced which make rt possible to eliminate the effects both of these inhomogeneitres and of the formation of second and higher layers, so that a detailed picture may be formed of the behavior of the 'He first layer on an ideal graphite substrate. The binding energy of a 'He atom on the graphite substrate is reported to be 143 i 2 K. with a first excited state at 89 3 K. A lattice-gas ordering transition occurs near 3 K at a coverage corresponding to one 'He atom for every three carbon hexagons in the graphite surface, and is used as a fiducial for calibrating our system relative to those of previous investigators. At both higher and lower densities rhe film seems little influenced by the crystal structure of the substrate. Particular attentron is given to the high-coverage low-temperature region, which has been identified as a two-dimensional (2D) solid bounded by a melting-phase transition. The available data are combined with two-dimensional elastic theory to establish the presence of low-lying transverse sound modes, thus confirming the solidlike character of this medium. The behavior of the thermodynamic variables of state through the observed transition is also presented. The theoretical implications of the existence of a 2D 5olid are drscussed, together with a dislocation theory of melting which gives rise to the well-known three-dimensional Lindemann empirical melting formula without an adjustable parameter. It IS shown that at very low coverage the film does not form a low-density solid as previously suggested, but 1s rather dominated by substrate inhomogenerties. At intermediate temperatures and coverages the film is a f l u~d which is accurately described if a leading-order quantum virial correction is made to the 2D ideal-gas equation of state.
In a recent paper , Bretz , Dash, Hickernell, McLean, and Vilches,' hereafter known a s BDHMV, presented a survey of the behavior of thin helium f i lms adsorbed on a graphite subs t ra te called Grafoil.' In this paper we presen t extensive new data on the sys tem 'He on Grafoil and detailed analysis , both thermodynamic and model-based, in an attempt to answer some of the experimental and theoretical questions that have a r i s e n in con- nection with these sys tems . The importance of these sys tems l i es in the fact that the adsorbate behaves in many respec t s a s if i t were constrained to move in an ideal plane. The resu l t s thus al- low an experimental comparison between the pro- per t i es of matter in two dimensions (2D) and in th ree dimensions (3D).
The BDHMV experiments were principally mea- surements of the relat ively low temperature heat capaci t ies of the He-Grafoil system. The new data reported i n the p resen t paper , hereafter re fe r red to a s the Caltech data , a r e principally concentrated at higher t empera tures (4 to 15 K) and include both vapor -p ressure and ca lor imet r ic measurements . As explained i n Sec. 111, both kinds of data a r e required for a complete thermo-
dynamic character izat ion of the sys tem. The Caltech and BDHMV data may be compared
where they overlap, using the "ordering peak" a s a fiducial for calibrating sur faces i n the two lab- o ra tor ies , a s explained i n Sec. IV. Although some uncertainties a r e found to exis t , the over-all r e - sult of intercomparison of the data is a striking confirmation of the reproducibility of both the qualitative and quantitative fea tures observed. Internal comparisons a r e given in Sec. IV between Caltech data f r o m vapor -pressure measurements and f r o m heat-capacity measurements in regions where those two techniques a r e redundant. Good agreement is found.
As explained in Sec. 111, the Caltech data may be used in combination with BDHMV to generate a complete thermodynamic character izat ion in the regions of temperature and p r e s s u r e covered by ei ther portion of the combined data. For ex- ample, f rom a tabulation of the Landau potential &I as a function of temperature T and chemical potential 9, one can obtain a l l other thermody- namic quantities by taking appropriate derivatives. Having such detailed thermodynamic information in hand, we have been able to analyze the phenom- ena observed in this sys tem in ways which have not previously been possible. One example is

2658 R O B E R T L . E L G I N A N D D A V I D L . G O O D S T E I N - 9
that we have been able quite accurately to find f r o m these measurements the g a s p r e s s u r e in equilibrium with the film a t p r e s s u r e s much too low to have been measured by conventional means. For instance, we repor t a p r e s s u r e of 1.4 X lo-'' t o r r for the "ordering peak." Moreover, the r e - su l t s of our thermodynamic analysis allow u s to make d i rec t t es t s of a number of theoretical mod- e l s proposed for various aspec t s of the 4He-Grafoil system. These theories and their comparison with the data a r e discussed where appropriate in Secs. V-VII.
In both the low-coverage region and a t coverages near one layer , we have worked out s imple, semi- empir ical models which, we believe, both great ly facilitate handling of the data by providing analytic equations of s ta te to work with, and a l so allow u s to understand quantitatively, and to separate out, the effects of inhomogeneity a t low coverage, and of second-layer formation a t high coverage. These models a r e presented and discussed in Sec. V. Sections VI and VII a r e devoted to discussions of the s ta tes of 2D mat te r found, respectively, a t high density (in the vicinity of monolayer coverage) and low density (below the ordering peak).
On the bas i s of their heat-capacity data, BDHMV have proposed a phase diagram for the He-Gra- foil sys tem in the coverage-temperature plane, assigning identifications to some of the phases and apparent phase t ransi t ions observed. We shall p resen t evidence tending to corroborate their identifications in two part icular ly important in- stances: the solid phase and the melting t rans i - tion. In the c a s e of the solid phase, available data together with two-dimensional e last ic theory may be used to a rgue that the region identified a s solid h a s the solidlike property of res i s t ing shear s t r e s s e s and supporting t ransverse sound modes. We a l s o show that the relat ions between two-dimensional p r e s s u r e , density, and tempera- tu re , in the vicinity of what BDHMV cal l the melting curve, a r e indeed reminiscent of melting in the bulk, with the important exception that the transition in the f i lm is not f i r s t o rder . The ap- parent existence of a solid phase and melting transition in the 4He-Grafoil sys tem cal ls into question cur ren t ideas concerning the nonexistence of long-range order in 2D. These ideas a r e con- s idered in the light of the data in Sec. VI, and a recent theory of melting in 2D is discussed. We find ourselves in disagreement with the BDHMV assignment to the low-coverage region of a low- density solid. Instead, the s a m e data a r e ac - counted for in detail by the s imple modeling of the effect of observed subs t ra te inhomogeneity men- tioned above.
The contents of the sections a r e a s follows:
Sec. I, Introduction; Sec. 11, Experimental Ap- paratus and Technique, including a discussion of the c r i t e r i a f o r equilibrium in experiments of this kind; Sec. 111, Thermodynamic Analysis; Sec. IV, Data; Sec. V, Modeling the Film; Sec. VI, Solid State and Melting Transition; Sec. VII. Ordering Peak and Lower Densities; and Sec. VIII. Conclusions.
11. EXPERIMENTAL APPARATUS AND TECHNIQUE
A . Equipmeat
Some of the ensuing manipulations may be eso- t e r ic but the experimental apparatus and methods a r e s t raightforward. The apparatus consis ts of a pile of Grafoil shee t s in a copper cel l suspended in a vacuum chamber surrounded by a liquid- helium bath. Temperature i s measured and reg- ulated by means of a germanium thermometer and a n Evanohm w i r e heater on the outside of the cell . Metered amounts of helium a r e l e t into the cel l through a filling line that a l s o allows the p r e s s u r e to be measured by a capacitive manometer a t room temperature.
The Grafoil came in a nominally 0.38-mm thick sheet. It was cut into 55 d i sks , 2.86 c m in d iam- e te r . Four 3.2-mm holes and 24 radial s l i t s were cut into each disk to improve g a s flow. The r e - sult weighed 12.51 g af ter baking in vacuo a t 900 C for 1 h. After interleaving with 27 shee t s of 0.05- m m sh im copper to improve the thermal conduc- tivity, the d i sks were gently p ressed into a copper cell . A copper base was s i lver soldered on in a hydrogen atmosphere and the resul t ing cel l was then soft soldered onto the 1.56-mm-i.d. CuNi filling line and baked above 100 C under vacuum for a week. General Electric-type 7031 varnish was used to apply the 4 8 0 4 heater wire . The germanium thermometer was screwed into the top and the leads varnished to the cel l for better thermal contact. The complete ca lor imete r con- s i s t s of 14 g of Grafoil (par t ly in an unused s e c - ondary cel l ) , 64 g of copper , 3 g of other metals , and l e s s than 0.2 g of other mater ials . The f r e e volume is 9.5 cm3.
Manganin wi res , thermally grounded to the vacuum chamber, f o r m leads to the heater and thermometer . The filling line is baffled and loose- l y coupled to the chamber s o that it i s about 0.5-K w a r m e r than the helium bath a t i t s coldest point. A 0.64-cm-i.d. monel tube filled with low-pressure helium gas and containing a copper plunger was used to v a r y the thermal contact between the calor imeter and the bath.3
The gas-handling sys tem consis ts of a number of calibrated volumes, two capacitive manometers , and pumps. The germanium resis tance was mea-
9 - T H E R M O D Y N A M I C S T U D Y O F T H E ' H e M O N O L A Y E R A D S O R B E D . . . 2659
sured by use of a Wheatstone bridge and a lock-in amplifier. The temperature was regulated by manually adjusting the output of a variable-voltage power supply. The heat-capacity heat pulses were generated by the s a m e method."
B . Calibrations
The cal ibrated volumes, their temperature, and the p r e s s u r e could a l l be measured to better than 0.1%. The p r e s s u r e of the gas added to the sys tem was always l e s s than 500 t o r r , s o the gas was ideal to bet ter than 0.1%. The g a s purity was checked a t the end of the run by measuring the fraction of the g a s that could not be removed by pumping a t 70 K. This was generally l e s s than 0.01%, but for the ea r ly data a leak in the s to rage volume ra i sed i t to 0.12%. This has been sub- t racted f r o m the affected data s o the amount of helium in the cel l is always known to 0.1%.
The germanium thermometer was calibrated against the vapor p r e s s u r e of 'He f r o m 1.5 to 3.5 K and against a constant volume g a s thermometer f r o m 4 to 25 K. Interpolation and smoothing was done using the heat capacity of a copper sample. The la rges t source of e r r o r appears to have been variations in res i s tance in the leads and the Wheat- stone bridge. The temperature sca le is believed to be accura te to 0.2% and the derivative used i n the heat-capacity measurements to 0.5%.
As already mentioned, the p r e s s u r e a t room temperature could be measured t o bet ter than 0.1% down to 0.02 t o r r . Unfortunately, differences of opinion in the l i terature5 on the s i z e of the thermal t ranspirat ion correct ion a r e a s much a s a factor of 2 in the mil l i torr region. To overcome this problem we cal ibrated the t ranspirat ion c o r r e c - tion In S Z ~ Z L by the absolute method, replacing the adsorption cel l by a l a rge , empty cel l and by comparing with the p r e s s u r e s calculated f rom the heat capacity where the film data a r e redundant. The calibration curve was fit by a n empir ical mod- ification of the equation of Weber and S ~ h m i d t . ~ We believe the calculated p r e s s u r e s a t the cel l t o be accura te to 0.1% above 2 t o r r , to 1% above 0.3 t o r r , and to 3% above 0.2 mtor r .
The resis tance of the heater wi re a t low tem- pera ture was only known to 0.2'h but was constant to much higher accuracy. The cur ren t and t ime of the heat pulses were easily measured to 0.02%. The main source of e r r o r in the heat capacity was caused by uncertainty in how much of the added heat actually warmed the helium film.
Of the heat added to the ca lor imete r , pa r t is lost to heat leaks, par t w a r m s up the copper and Grafoil container, pa r t w a r m s the helium gas , p a r t causes the film to desorb, and par t w a r m s the film. The f i r s t two t e r m s were evaluated very
accurately a s a unit, by using the s a m e tempera- ture intervals and s a m e temperature r i s e ra te with and without helium in the cell. Since the (OFHC copper) outer sur face of the calor imeter i s a very good heat conductor, the heat flows to the outside world under these conditions a r e in- dependent of the coverage (except for a slight cooling of the filling line by desorbing gas at high p r e s s u r e s ) . The heat capacity of the helium g a s in the cel l is easi ly calculated s ince the p r e s s u r e is measured direct ly . The desorption correct ion will be derived r igorously in Sec. I11 f r o m the temperature variation of the p r e s s u r e at constant coverage. The accuracy of the remaining f i lm heat capacity var ies great ly because i t is the remainder af ter subtracting al l the other t e r m s . Over most of the data range it is comparable to the 0.5% accuracy of the derivative of the tempera- tu re calibration, but below one-tenth of a layer and above 10 t o r r i n p r e s s u r e the uncertainties r i s e a s high a s 5%.
The actual amount of helium adsorbed on the Grafoil (the coverage) can be found by subtracting the helium in the g a s s ta te f r o m the total in the sys tem, s ince the s u m of a l l other sur faces is negligible. Only the bottom 7.5 cm of the filling line was near helium tempera tures and this con- t r ibutes 0.2 cm3 to the cold volume in addition to the 9.5 cm3 of the calor imeter proper . The r e - mainder of the filling line and the tubing connecting the capacitive manometers was equivalent to 47 cm3 at room temperature. Since l a r g e uncertain- t i es in the cel l p r e s s u r e occur only when this cor - rection i s smal l , the amount of helium adsorbed is known to the 0.1% accuracy of the total g a s added except in the multilayer, high-temperature region.
Accurate data a r e of lit t le use in a thermody- namic analysis unless the sample is in equilib- r ium. For complete equilibrium, the temperature and the chemical potential must be the s a m e for a l l helium atoms in the calor imeter . A nonuni- f o r m tempera ture distribution could easi ly be detected by the variation in the apparent heat leak while the thermometr ic temperature was held constant. This always disappeared within a few minutes. A nonuniform chemical potential d i s - tribution was detected by the dr if t in the p r e s s u r e when this was la rge enough to be measured easi ly . At low tempera tures the lack of a measurable p r e s s u r e removes both the bes t means of obtaining chemical potential equilibrium and the best method of verifying it. We therefore had to develop a method of preparat ion for the low-temperature f i lm that assured this equilibrium u P ~ i u r i .
A common procedure for improving the uni-

2660 R O B E R T L . E L G I N A N D D A V I D L . G O O D S T E I N 9 -
formity of adsorbed f i lms i s to anneal them a t "high" temperature. This unfortunately gives only negative information: if the film changes, then a t l eas t one se t of data was not a t equilibrium. For a positive indication, we used a p r e s s u r e cr i ter ion. In general , if a submonolayer film formed a t low temperature was warmed just to the point a t which the manometry reached full accuracy 10.01 t o r r ) , dr i f ts were observed for a day o r longer. At higher t empera tures the dr if t t ime fell a t l eas t in proportion to the increase in p r e s s u r e , reaching a few minutes a t 10 t o r r . At this point we had complete equilibrium, but helium equivalent of up to 2% of a monolayer was in the gas s tate . If the cell were cooled rapidly, most of this g a s would condense on the nearest cold sur face , re-creat ing a nonequilibrium film. On the other hand, if the cell i s cooled slowly, the m a s s to be redistributed drops proportionally with the p r e s s u r e s o that the relaxation t ime should remain almost constant. This was observed to be the case . When the temperature was reduced a t the r a t e of 1% per minute and then stabilized, the p r e s s u r e a l so stabilized within the next 10 minutes, whether it w a s near 1 t o r r or near 0.01 t o r r . The procedure probably continues to work to much lower p r e s s u r e s , but that is not important because a t the la t ter p r e s s u r e only 0.002% of a monolayer remains in the gas s ta te . (Similar be- havior was not obtained when cooling more rapidly than 2% in temperature per minute; instead, the stabilization time grew without l imit a s the t em- pera ture decreased . ) It should be noted that this technique is conservative s ince a very smal l amount of helium condensed a t the base of the filling line may have a l a rge effect on the p r e s - s u r e without significantly affecting the heat capac- ity.
Since we were interested in both the p r e s s u r e and the heat capacity, the temperature was lowered in 10% decrements each followed by 10 minute periods during which the p r e s s u r e reached equilib- r ium and was recorded. The heat capacity could then be taken over 10% increments in temperature followed by only 4 minute waiting periods because a given deviation f rom equilibrium becomes rapidly annealed on fur ther heating a s contrasted to be- coming frozen in on fur ther cooling.
The initial temperatures needed for this tech- nique varied considerably with coverage. F o r a freshly formed film of 0.01, 0.1, 0.5, and 1.0 monolayer the temperatures needed were 17, 16, 1 4 , and 7 K, respectively. For 10% increments in coverage to previously annealed f i lms , about 20'c lower t empera tures were sufficient. As- suming that the m a s s flow r a t e continues to be proportional to the p r e s s u r e at much lower p r e s -
s u r e s , the more conventional technique of an- nealing overnight a t a constant temperature should work if that temperature i s above 11, 10, 9. and 3.5 K, respectively.
There a r e two kinds of data available for the study of the adsorbed helium film. In raw form these consist of the heat capacity of the experi- mental cel l and the p r e s s u r e of the gas in the cel l , both of these a s a function of the t empera- ture and of the amount of helium in the cel l ( a third kind of data , the heat of adsorption, i s dif- ficult to obtain in equilibrium except at high p r e s - s u r e s ; it will be shown below to be redundant). F rom these data we wish to extract the thermo- dynamic behavior of the film alone, and we wish to do s o in a way that depends on a s few assump- tions a s possible.
In principle, the p r e s s u r e data alone a r e suf- ficient to give the complete thermodynamic be- havior of the film. The p r e s s u r e can be used to deduce the chemical potential of the film a s a function of temperature and coverage. and from that all other thermodynamic propert ies follow. In p rac t ice , however, the p r e s s u r e i s too low to be measured for much of the range of t empera- ture and coverage of most in te res t to us.
On the other hand, heat-capacity data from one cel l alone a r e not sufficient to character ize the film thermodynamically, even in principle,' and moreover , the heat-capacity contribution of the film cannot be unambiguously extracted f rom the raw calorimetr ic data unless the p r e s s u r e i s e i ther known or negligible. Thus it i s c l e a r that the two types of data a r e complementary. In this section we describe how to analyze the combined data in such a way a s to produce a complete ther - modynamic description of the f i lm.
The thermodynamic analysis follows the te rmi- nology of Landau and Lifshitz"7ith modifications to bet ter match the recommendations of the IUPAC."he independent variables a r e taken a s the chemical potential p and the temperature T"' because these a r e identical in all phases. The subscript "0" is used for extensive variables r e - fe r r ing to al l the helium in the experimental s y s - tem. The subscript "g" i s used for extensive var i - ables re fe r r ing to al l the helium in a comparison sys tem with the same f r e e volunle but negligible surface a r e a . In pract ice this "comparison s y s - tem" is just the bulk gas in the experimental system. The differences between the experimental sys tem and the comparison sys tem a r e called surface excesses and a r e not subscripted. The constants A and I.' and the intensive variables

9 - T H E R M O D Y N A M I C S T U D Y O F T H E 4 H e M O N O L A Y E R A D S O R B E D ... 2661
p , T, P , cp, and B do not need to be distinguished by subscripts .
Starting with the internal energy U, of the com- parison sys tem, we may define in the usual way the Gibb's f r e e energy
G,=U,- TS,+PV ( l a )
and the Landau potential (the p roper energy func - tion of the grand canonical ensemble) ,
Wg = U, - T Sg - pCINg , ( l b )
s o that
dU,=TdS, - P d V + p (2a)
Since P depends on only p and T, we may inte- g ra te (2c) a t constant JL and T to get
a,= - P V . (3)
If we now specialize to constant volume, we may drop dV and replace V d P with -dQ, s o (2) s impli- f i es to
Also, f r o m (1) and (3) we get
6, = pN, . (4d)
Work of the P V kind has no meaning for the surface excess sys tem, but i t s Landau potential is well defined by 52 = R, -fig. Thus, s o long a s no external work is done, equations like (4) can be written for a l l th ree sys tems . In part icular , by replacing every subscript "3" in (4) by "0," we generate four more equations lto be r e f e r r e d to a s Eqs. (5)] , and dropping al l subscr ip t s gives another s e t of four [to be r e f e r r e d to a s Eqs. (6)].
The experimental data may be converted into a complete thermodynamic description of the film a s follows: F r o m p r e s s u r e i so therms a t high temperature we may calculate pLVo) a t constant T , using the formula f r o m stat is t ical mechanics8
where B is the second v i r ia l coefficient, k i s Boltzmann's constant, and m is the atomic mass . Explicitly, fo r 4He with P in t o r r and p in K,
We then find 51, by integrating (5c) t o get the Gibbs- Bangham equation"
W,, = - I'v%o d p (T cons t ) . v,=o
Using (5b) and (5d) we find the entropy a t a tem- pera ture midway between two i so therms by
From the g r o s s heat capacity of the ca lor imete r , we may find C, = (aU, /BT)," by subtract ing the calor imeter background, which is the g r o s s heat capacity when N,=O. We then have f rom (5a) that
The entropy a t the upper ( + I and lower (-) iso- therm is then
Thus we can find the function a , , i t s proper var i - ables T and p , and i t s proper f i r s t der ivat ives -So and -No, a t each experimental point on a rectangular No, T gr id . We may extend S , to lower t empera tures , where the p r e s s u r e is un- measurably smal l a t low coverage, by integrating (7). Equating the c rossed second derivat ives of (Go + n o ) with respec t to T and ?i, and using (5b) gives the Maxwell relation
which allows us to calculate the chemical potential a t lower t empera tures , given the entropies at adjacent coverages. Then, using (5c) we may extend R, along an i sos te re . Finally, if i t is possible to obtain heat-capacity data t o low- enough tempera tures to integrate So accurately f r o m absolute ze ro , the accuracy of the en t i re analysis increases by an order of magnitude be- cause both proper derivat ives of a,, a r e then found by integrations ra ther than by differentiation. The accuracy a t high coverage i s a l so improved if the integration of W, is c a r r i e d out along a s e r i e s of isotherm and i s o s t e r e segments such that IV, is always smal l along the i sos te re seg- ments.
One simply sub t rac t s a , , N,, and S, f rom R,,, N o , and S, to find Q, N , and S respectively. For the cur ren t c a s e where the comparison sys tem is a dilute gas ,

2662 R O B E R T L . E L G I N A N D D A V I D L . G O O D S T E I N 9
The data may now be used to deduce any other thermodynamic quantity of interest ; for example1'
where q, is the differential heat of adsorption, qfr the i sos te r ic heat of adsorption, and C,, the heat capacity at constant two-dimensional spread- ing p r e s s u r e , 6 = -Q 'A; A is the substrate a rea .
By means of the techniques just descr ibed, raw data in the form of vapor p r e s s u r e s and g r o s s heat capacities may be analyzed into a detailed and complete thermodynamic description of the ad- sorbed film. If the gr id of data points is suf - ficiently complete, any desired thermodynamic property may be extracted. For example, a s we shal l s e e in Sec. IV, p r e s s u r e i so therms may be constructed even a t coverages and tempera tures where d i rec t p r e s s u r e measurement is impossible. In any single experimental ceil , the ent i re analysis may be done without recourse to any assumptions whatever about the microscopic nature o r behavior of the adsorption system.
The Caltech data resul ted in the tabulation of over 4000 i t ems between 4.5 and 15 K after analy- zing with the methods of the preceding section. These a r e available13 but a r e of limited utility in isolation because many of the interesting r e - gions of the film occur below 4 5 K. Because considerable heat-capacity data a r e already avail- able below 4.2 K, and the p r e s s u r e was too smal l to measure , it was planned to use preexisting data f rom BDHMV to extend the analysis to lower temperatures .
While the data from a single cel l could be ana- lyzed without any reference to the sur face a r e a , the use of severa l cel ls required a normalization procedure. In principle, any distinctive feature could be used. For example, a traditional method i s to find a break in a p r e s s u r e isotherm using a nitrogen adsorbate at liquid-nitrogen tempera- ture.14 However, the optimal feature would be sharp and occur a t a unique coverage and t e m -
pera ture s o that the coverage calibration is not affected by smal l differences in the calibration of the temperature o r other propert ies . Such a feature is provided by the t r iangular -lattice-gas ordering transition, where the helium has been shown to fo rm a n ordered s ta te in reg i s t ry with the graphite substrate. ' '
Heat capaci t ies in the vicinity of this transition a r e shown in Fig. 1. An important bonus derived f rom calibrating with this feature i s that absolute a s well a s relat ive a r e a s may be determined. Since the s ize of the carbon lattice s i t e s a r e well known, the coverage a t the center of the t rans i - tion can be determined t o be 1 ' ( 1 =6.366 atoms nm2 (or cr = 15.71 A' a t o m ) . Data for th ree cover- ages a r e shown, using four cel ls f rom both BDHMV and Caltech. The feature is seen to vary rapidly with both temperature and coverage and to reproduce well in the different cel ls . Similar consistency was found a t higher coverages.
Data from Caltech and BDHMV were combined to c r e a t e Fig. 2 . At the higher t empera tures , the data were corrected for desorption using the surface excess formalism. The curves a r e con-
F IG . 1. Specific heat in the vicinity of the lattice-gas ordering transition All coverages reported in this paper a r e normalized by assuming that the uppermost peahs occurs at 6.37 atoms/nm2, corresponding to one helium atom for every six carbon atoms in the surface plane of the substrate. The c i rc les and diamonds a r e data from two cells used by the BDHIbIV group; the open and filled boxes a r e from two cells used at Caltech.
9 - T H E R M O D Y N A M I C S T U D Y O F T H E ' H e M O N O L A Y E R A D S O R B E D . . . 2663
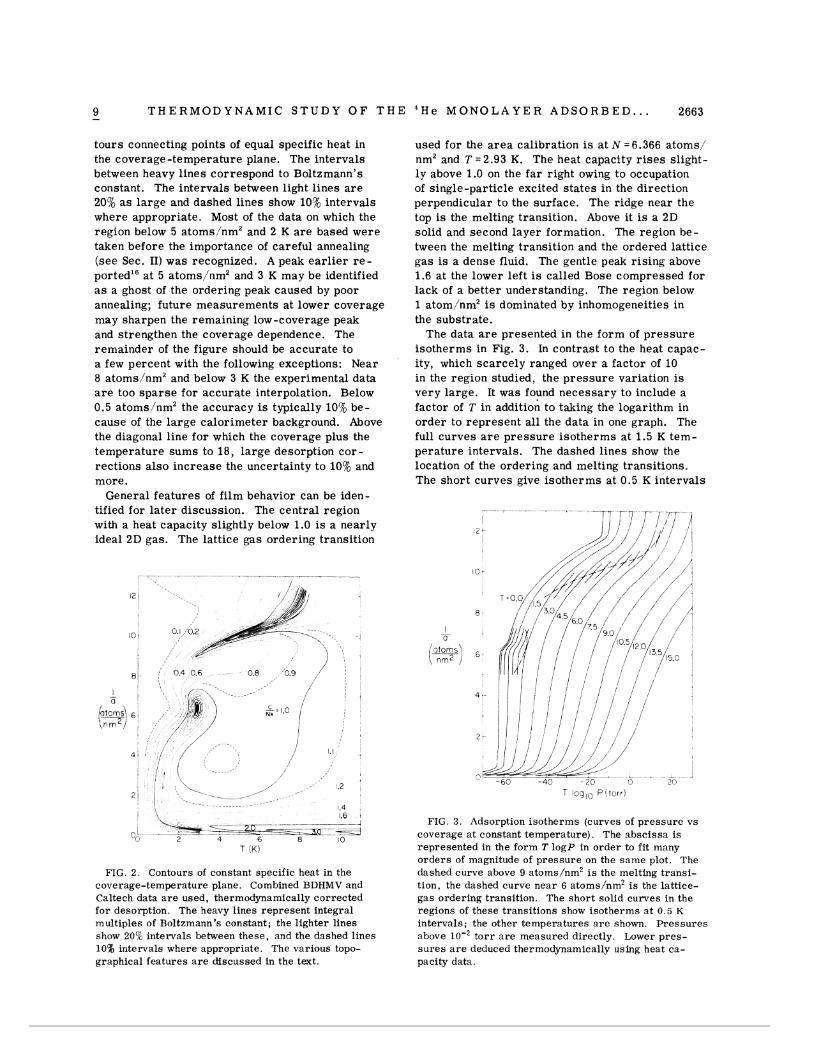
tours connecting points of equal specific heat in the coverage-temperature plane. The intervals between heavy l ines correspond to Boltzmann's constant. The intervals between light l ines a r e 20% a s l a rge and dashed l ines show 10% intervals where appropriate , Most of the data on which the region below 5 a toms /nm2 and 2 K a r e based were taken before the importance of careful annealing ( see Sec. 11) was recognized. A peak e a r l i e r r e - ported16 a t 5 a toms /nm2 and 3 K may be identified a s a ghost of the ordering peak caused by poor annealing; future measurements a t lower coverage may sharpen the remaining low-coverage peak and strengthen the coverage dependence. The remainder of the figure should be accurate to a few percent with the following exceptions: Near 8 a toms 'nm2 and below 3 K the experimental data a r e too s p a r s e fo r accura te interpolation. Below 0.5 a toms/nm2 the accuracy is typically 10To be- cause of the l a rge ca lor imete r background. Above the diagonal line f o r which the coverage plus the temperature s u m s to 18, l a rge desorption c o r - rect ions a l so increase the uncertainty t o 10% and more.
General features of f i lm behavior can be iden- tified for l a t e r discussion. The central region with a heat capacity slightly below 1.0 is a nearly ideal 2D gas. The lat t ice gas ordering transition
FIG. 2 . Contours of constant specific heat in the coverage-temperature plane. Combined BDHMV and Caltech data a r e used, thermodynamically corrected for desorption. The heavy lines represent integral multiples of Boltzmann's constant; the lighter lines show 2 0 8 intervals between these, and the dashed lines 10% intervals where appropriate. The various topo- graphical features a r e discussed in the text.
used for the a r e a calibration is a t N =6.366 a toms , nm2 and T = 2.93 K. The heat capacity r i s e s slight- l y above 1.0 on the f a r right owing to occupation of s ingle-part ic le excited s t a t e s i n the direct ion perpendicular to the surface. The r idge near the top is the melting transition. Above it is a 2D solid and second layer formation. The region be- tween the melting t ransi t ion and the ordered lat t ice gas i s a dense fluid. The gentle peak r is ing above 1.6 a t the lower left i s called Bose compressed for lack of a bet ter understanding. The region below 1 a tom/nm2 is dominated by inhomogeneities in the substrate .
The data a r e presented in the f o r m of p r e s s u r e i so therms in Fig. 3. In contrast to the heat capac- ity, which scarce ly ranged over a factor of 10 in the region studied, the p r e s s u r e variation i s very la rge . It was found necessary to include a factor of T in additio; to taking the logarithm in order to represen t a l l the data in one graph. The full curves a r e p r e s s u r e i so therms a t 1.5 K tem- pera ture intervals. The dashed l ines show the location of the ordering and melting t ransi t ions, The shor t curves give i so therms a t 0.5 K intervals
FIG. 3 . Adsorption isotherms (curves of pressure vs coverage a t constant temperature). The abscissa is represented in the form T logP in order to fit many orders of magnitude of pressure on the same plot. The dashed curve above 9 atoms/nm"s the melting transi- tion, the dashed curve near 6 atoms/nm%s the lattice- gas ordering transition. The short solid curves in the regions of these transitions show isotherms a t 0.5 K intervals; the other temperatures a r e shown. Pressures above lo-' t o r r a r e measured directly. Lower pres- su re s a r e deduced thermodynamically using heat ca- pacity data.

R O B E R T L . E L G I N A N D D A V I D L . G O O D S T E I N 9 -
in these regions. The l a r g e heat-capacity peaks associated with these t ransi t ions have litt le effect on the p r e s s u r e i so therms , which depend mainly on the binding energy and compressibility a t 0 K. Because of this low sensitivity, the relat ively l a r g e uncertaint ies in Fig. 2 a r e not reflected i n Fig. 3. The accuracy of the i so therms in Fig. 3 ranges f r o m 0.01% of full sca le f o r Tlog,,P > O t o 1% of full sca le for T = O .
The advantages of deriving the p r e s s u r e thermo- dynamically, even in regions where i t could in principle be measured direct ly , a r e shown in Fig. 4. Over this smal le r range i t i s possible to use the p r e s s u r e direct ly fo r the horizontal ax i s , but otherwise the curves a r e mere ly a more com- plete s e t of those shown in Fig. 3. The c i r c l e s a r e direct p r e s s u r e measurements made with the capacitive manometer concurrent ly with the heat- capacity measurements . The c r o s s e s show mea- surements using a residual-gas analyzer (RGA) on a separa te Grafoil cell1' (the coverage was nor- malized using p r e s s u r e s higher than those shown). Above lo-' t o r r the calculated curves a r e based almost solely on the measured p r e s s u r e s s o the agreement is not surpris ing. The curves were extended to lower p r e s s u r e s using the heat-capac- ity data and the methods of Sec. III. The melting transition is too sharp to be represented well by
FIG. 4 . Detail o f the adsorption isotherms comparing directly measured pressures with deduced values. Open circles are pressures measured by room temper- ature capacitive manometry. Crosses show 4.2 K data in a different cell using a residual gas analyzer to mea- sure pressure (coverage normalized at higher pressure than those shown). The heavy curves are based on the capacitive measurements above torr , extended to lower pressures by means of heat-capacity data. The disagreement between these curves and the direct- pressure measurements at low pressures i s attributed to the e f fects of incomplete equilibrium in the latter. The light curve shows the position of the melting transi- tion.
the c o a r s e data gr id, but e lsewhere the agreement remains excellent down to 3 x t o r r . At lower p r e s s u r e s the deviations a r e within the i 3 ~ 1 0 - ~ t o r r uncertainty (after thermal t ranspirat ion c o r r e c - tions) of the capacitive gauge. However, the RGA is capable of measuring below lo-' t o r r and back- ground contamination was equivalent to only torr.18 The factor of 5 disagreement for the low- e s t two points appears mainly owing to lack of complete equilibrium in the d i rec t p r e s s u r e mea- surements , even though each of these points took severa l days. The property that the lowest mea- sured points show relatively litt le change in p r e s - s u r e with coverage is very common in the l i t e r a - b . ~ r e , ' ~ but apparently it is a n artifact. The method used h e r e is a n improvement in two ways. High temperature annealing gives much fas te r equilib- r ium than any isothermal method and the heat capacity is much l e s s sensi t ive than the direct ly measured p r e s s u r e to the tendency of the film to be thickest neares t the inlet tube.
F r o m the data incorporated in Figs. 2 and 3 we may derive the other thermodynamic functions using the methods of Sec. 111. Specific applications will be given in the following sections. One part ic- u la r application re la tes t o the quality of the data itself. The entropy may be found ei ther by inte- grating the data of Figs. 1 and 2 f r o m 0 K o r by integrating the data in Fig. 3 f r o m 0 atoms/nm2. These two methods general ly agree within 26, providing additional evidence that the adopted data a r e consistent and represen t t rue equilibrium.
V . MODELING OF FILM
In Sec. 111 we showed how the thermodynamic behavior of the adsorbed f i lm may be isolated from the raw data fo r the experimental cel l a s a whole. In this section we wish to show how the f i lm data in turn may be decomposed into contr i - butions f rom various distinct phenomena. In p r e - vious helium adsorption s tudies , lg subs t ra te in- homogeneity caused the measured heat capacity in most instances to be a n admixture of contribu- tions from p a r t s of the helium film a t var ious densi t ies , behaving in different ways, and i m - possible to disentangle. In the 4He-Grafoil s y s - tem, however, the inhomogeneity is much smal le r and better defined. Consequently, the various aspects of the behavior of the film a r e able to stand out more clear ly, dominating the data in cer tain ranges of T and j l , and the resu l t is that with s o m e simple semiempi r ica l modeling i t is possible to s o r t out the contributions that go into much of the data.
As an example of how the procedure is to be ca r r ied out, consider the l a r g e cen t ra l plain in

9 - T H E R M O D Y N A M I C S T U D Y O F T H E ' H e M O N O L A Y E R A D S O R B E D . . . 2665
Fig. 2 where the specific heat s t a y s in the range 0.9 < C / N k < 1 .l. This is close to the behavior of a 2D ideal gas (C = N k ) and suggests that the smal l depar tu res f rom ideality might be susceptible to correct ion by means of the v i r ia l equation of s tate . Siddon and Schickz0 have computed the quantum mechanical second v i r ia l coefficient fo r helium in 2D, and their resu l t s do in fact account fo r most of the depar tu res f rom ideality in our data in the range 2 < l , / a < 5 a toms/nm2 and 1 . 5 < T < 7 K.
In the s a m e range of densi t ies , but a t higher temperature, the observed heat capacity r i s e s above the v i r ia l equation predictions. We believe the excess heat capacity to be due to the excitation of s ingle-part ic le excited s ta tes in the direction perpendicular to the substrate . These s ta tes were discussed by Jackson.'l If the excitation energy f o r a n atom is E l , then these s ta tes con- tribute an energy p e r atom E , (1 +eE1lkT) every- where in the f i r s t l ayer , and a n excess heat capac- ity
In Fig. 5 the excess heat capacity above the v i r ia l gas contribution is plotted in comparison to this function for two values of E l . Data f rom seven coverages spanning 4 to 7 atoms/nm2 were used. The excited-state energy E l l k is thus determined to be 54 K above the ground state . When this con-
FIG. 5 Heat capacity due to a single-particle excited state perpendicular to the surface. Circles show the average excess heat capacity after quantum virial gas contribution has been subtracted. X monotonic de- pendence on coverage, from 4 to 7 atomsinm2, i s shown by the e r r o r bars This dependence, a s well a s the downward displacement of al l the points, i s probably due to the effects of substrate inhomogeneity not yet taken into account in this plot. The dashed and solid curves shown the function given in Eq. (1 1) fo r , re- spectively. E l /k = 52 and 55 I(.
tribution is added to the Siddon and Schick calcula- tion, the range of agreement with the data is ex- tended up to 15 K in temperature, and up to 8 atoms lnmZ in coverage a t the higher temperatures .
C * i s p a r t of the heat capacity for a l l N and T in the f i r s t l ayer , but it was necessary to find a region where C* is appreciable and the r e s t of C well known in o rder to isolate i t and measure E,. That kind of sort ing out i s the f i r s t s t ep in disentangling the contributions t o the f i lm data The sort ing out by itself is not enough, however, because i n most c a s e s the interaction between different aspects of the film behavior is more complex than the s imple additive effect of the ex- cited s ta tes .
To i l lustrate the next s tage of reduction, we consider the ridge in the upper par t of Fig. 2 which we have r e f e r r e d to a s the melting transition. In Fig. 6 we show heat-capacity data along the ridge taken f rom BDHMV, We s e e that a d ramat ic change occurs in the peaks for coverages above 10.5 atoms 'nm2. The peaks become much hlgher and nar rower than they a r e a t lower coverage. We have proposed a quantitative explanation of this change2' which we outline here .
Study of the data between 9 and 10 a toms/nm2 suggests that the r idge separa tes a 2D solid on the low T s ide f rom a 2D fluid (we will d i scuss the evidence for a 2D solid i n Sec. VI). When the solid melts , i t t r i e s t o expand, a s do many sol ids in 3D. Below 10 a toms 'nm2 the available a r e a is constant, and s o instead of expanding the t rans i - tion causes the 2D spreading p r e s s u r e @ to in- c rease . However, a t about 10.5 a toms 'nm2, the second layer s t a r t s to become populated. At this point the medium is able to expand by squeez- ing atoms out of the f i r s t l ayer into the second (and into the 3D g a s a s well). That p rocess r e - q u i r e s heat, owing t o the difference in binding energy between the f i r s t and second l a y e r s (and the g a s ) , and hence appears a s a n addition to the heat capacity. This has the effect of amplifying the underlying peak owing to melting in the f i r s t layer .
To make the model quantitative, we consider equilibrium between th ree subsystems: the f i r s t l ayer , the second layer , and the gas. The g a s is a 3D ideal gas. The second layer is a 2D ideal gas with a binding energy of -30 K relat ive to the 3D g a s (the second layer binding energy is de- duced f rom the 0 K i so therm i n Fig. 3). For the f i r s t l ayer we assume that i t s behavior af ter the second layer s t a r t s to f o r m is the s a m e a s it is without the second layer . I ts equation of s ta te is therefore extrapolated by means of analytic fo rms fitted to the data below 10 atoms/nm2. In equilibrium the th ree subsystems must have the

2666 R O B E R T L . E L G I N A N D D A V I D L . G O O D S T E I N
FIG. 6. Heat capacities near melting. All data points taken from BDMhlIT.'. All curves generated by the semiempirical model de- scribed in the text. Cover- ages are shown for each peal,. In the inset the peak at 13.27 atorns/nm2 is de- composed into contribu- tions from melting in the first layer, promotion into the second layer, and de- sorption into the gas. Sote especially the shoulder to the left of the peak, which is accounted for by the model.
s a m e chemical potential, and the number of a toms in each is allowed to adjust itself subject to the constraint that the total N o is fixed. F r o m the outcome, the heat capacity of the sys tem may be computed, and the resu l t s a r e shown a s the solid curves in Fig. 6 ,
Details of the parameters and analytic f o r m s used to represen t the f i r s t l ayer may be found in Ref. 22. There is relat ively litt le room for maneuver in adjusting the p a r a m e t e r s t o f i t the data . For example, the shapes of the l a r g e peaks could not be adjusted independently of the positions of their cen te rs and the shapes of the s m a l l e r peaks. Nevertheless, the curves go right through the experimental data . In the inset of Fig. 6 we s e e one of the l a r g e peaks decomposed into con- tributions f rom the underlying f i r s t layer , promo- tion into the second layer , and promotion into the gas. Notice that the shoulder in the data to the left of the peak is reproduced by the model, a l - though no attempt was made to do so. We a l so note n pohtei-iovz that promotion of a toms out of the f i r s t l ayer reduces the density in that l ayer , and has the effect of narrowing the transition, thus accounting for the fact that the peaks become n a r - rower above 10.5 atoms nm2.
We believe that the success of this model justi- fies our use l a te r on of f i r s t layer only data for fur ther analysis , even when it comes f r o m regions where higher l a y e r s have begun to fo rm.
The essential pr inciples we have just used to separa te out the effects of second-layer formation
will now be applied to isolate the influence of sub- s t r a t e inhomogeneity. The method i s s imi la r to that proposed by Rossz3: to use the equation of s ta te of an idealized f i lm together with a binding energy distribution to produce the behavior of a r e a l experimental film. Following Ross , we shall cal l the procedure the Ross-Olivier model.
Even a smal l amount of substrate inhomogeneity causes major effects a t low coverage because the helium is preferent ial ly adsorbed at the most energetic ( least typical) s i t es . On the other hand, a t high coverage the compressibi l i ty fal ls rapidly and the data a r e comparable to that expected on a uniform subs t ra te with the s a m e average binding energy. We may therefore use the experimental data with any multiple l a y e r s removed to r e p r e - sent an idealized film a t high coverage. Below 5 a toms 'nmz we u s e the vir ia l gas equation of Siddon and Schick.'' We now consider equilib- r ium among a continuum of subsystems each with a slightly different binding energy. Given the temperature and the chemical potential, the density appropriate to each binding energy is determined by the equation of s tate . We may ca l - culate the p r e s s u r e f rom p and T and f rom the binding energy distribution function we may de te r - mine the average coverage and compare the r e - su l t s with Fig. 3.
Reversing this p r o c e s s to find the distribution function is usually v e r y difficult. However, for the 0 K isotherm, energy variat ions due to the equation of s ta te a r e negligible below 5 a toms 'nm2,

9 - T H E R M O D Y N A M I C S T U D Y O F T H E ' H e M O N O L A Y E R A D S O R B E D . . . 2667
while binding energy effects a r e negligible above 1 atom,'nm2. This makes an i terat ive solution converge rapidly. In f i r s t approximation the bind- ing energy is identical to the chemical potential a t low coverage, with approximately 10 s i t e s jnm.' If B i s the fraction of the sur face binding more strongly than E , the i terat ive solution i s E = -143[1 + (1 + b/0.026)-3] . Differentiating gives the distribution function f ( E ) = 0.045(E + 143)-$ j3 , 143.0025 < -E <286 , with E in K.
This functional dependence is very different f rom the Ross-Olivier Gaussian distribution but it may be derived f rom a s imple model. If two sur faces make contact a t a smal l angle, an atom in the corner is simultaneously adsorbed on both sur faces and will have twice the binding energy. The van d e r Waals's nature of the fo rces will cause the excess binding energy to v a r y a s the inverse cube of the dis tance f rom the contact line. This model predicts that the sur face a r e a avail- able to the second layer will be decreased by 2 x0.026 ~ 1 0 0 % = 5.2% owing to the filling of these corners . The 0.026 is a fit to data ( see formula for E above), accuracy about 10%. This predic- tion is consistent with recen t multilayer data.'*
An example of the success of this model in ex- plaining the low-coverage data i s shown in Fig. 7 .
FIG. 7 Entropy-coverage isotherms in the low- coverage region. The temperature of each isotherm is shown in the figure. The points are measured values and the curves a re generated from the semiempirical model discussed in the text. As low coverage is ap- proached, the entropy rises logarithmically a s a quan- tum virial gas, hut this tendency is counterbalanced by the effect of substrate inhomogeneities.
The points give the experimental entropies calcu- lated f rom the data in Figs. 2 and 3. The curves have been calculated f r o m the preceding model. In the absence of inhomogeneity a l l the curves would show a n identical logarithmic r i s e as the coverage fal ls if the v i r ia l gas behavior were to continue. In fact, we s e e that the entropy i s strongly depressed, especially a t low tempera- tu res . The large heat capacities a t the bottom of Fig. 2 a r e therefore due to a p rocess akin to 2D desorption f r o m the tight-binding s i t es . Good agreement i s a l s o found with the p r e s s u r e iso- t h e r m s in Fig. 3.
Both the ground-state and first-excited-state energies found h e r e differ considerably f r o m the predictions by Hagen, Novaco, a n d Milfordz5 (-143 i 2 and -89* 3 v s -188.8 and = -105 p r e - dicted). NovacoZ6 has recently noted that such discrepancies a r e within the uncertaint ies of the carbon-helium potential.
To recapitulate, the 2D helium film i s accurately described by Siddon and Schick's v i r i a l g a s p r e - dictionsz0 above 4 K and below 7 a toms/nm2. The deviations observed experimentally have been ex- plained quantitatively in t e r m s of a single-particle excited s ta te and subs t ra te inhomogeneity. At higher coverage s i m i l a r analysis techniques allow us to separa te out the contributions to the data f rom f i r s t - l ayer behavior and second-layer fo rma- tion.
In a l l of the l i t e ra ture on physical adsorption. one of the mos t persis tent ly recur r ing themes i s the problem of identifying the point of monolaver completion. In the above model sys tem the point of monolayer completion was uniquely defined by the f i r s t a tom to en te r the second layer . At finite temperatures o r in the presence of subs t ra te in- homogeneity, completion may occur a t different points depending on the c r i t e r ion used to define it. The melting model gives u s enough information to compare and analyze the various theoretical and experimental c r i t e r i a found in the l i terature.
The two most common experimental methods, the Langmuir and theB. E. T . isotherms,14give mean- ingless resu l t s a t sufficiently low tenlperatures s ince the p r e s s u r e var ies exponentially with cover - age. This exponential variation o c c u r s when ei ther the inhomogeneity energy o r the interpart ic le in- teraction energies become la rge compared to the temperature, a s i s the c a s e over the ent i re t em- pera ture range of the p resen t experiment.
J u r a and Hill2' in connection with heat of i m m e r - sion s tudies suggested the entropy minimum a s a sounder c r i t e r ion for monolayer completion. This cr i ter ion was a l s o used by BDHMV by integrating their heat capaci t ies f r o m 0 K. It does not s e e m to have been noticed that essentially the s a m e

2668 R O B E R T L . E L G I N A N D D A V I D L . G O O D S T E I N - 9
c r i t e r ion may be applied using only p r e s s u r e iso- t h e r m s near the monolayer. The t r ick i s to plot the data in the f o r m of a chemical potential v e r s u s the coverage. These lines will c r o s s where the part ia l molar entropy i s zero. The part ia l molar entropy i s negative f o r a solid and positive f o r a gas , s o every other crossing should indicate the completion of a layer.z8 When the lines cease crossing (or if they never c r o s s ) , the 3D g a s i s no longer condensing into distinct layers . This monolayer cr i ter ion thus contains a built in t es t for h o m ~ g e n e i t y . ~ ~ P lo t s of li. v s l l u a r e shown in Fig. 8.
In the p resen t c a s e the second derivat ive of the chemical potential with density i s positive f o r the 2D solid. This should be t rue fo r a l l other heli- u m experiments , but it i s not known whether it i s t rue in general. When it is t rue , the point of inflection in a plot of p v s T (or simply l o g P v s T) using a sirzg-Le isotherm will indicate the monolay- e r . Both the inflection and c ross ing c r i t e r ia give essentially the s a m e monolayer capaci t ies in the p resen t experiment. This d rops about 1% f o r each 1 K r i s e in T with a n ex t ra 44; drop on crossing the melting line. The s imple theoretical c r i t e r ion that the next a tom added has an equal probability
of going into ei ther l ayer gives the s a m e capacity a t 0 K but only half the temperature dependence.
V1 SOLID STATE AND MELTING TRANSITION
In this section we wish to review the evidence that the upper left-hand region of Fig. 2 does in fact represen t a 2D solid, and the ridge that bounds it r epresen ts a melting transition. We shal l comment on the theoretical significance of these findings.
At low tempera tures in 3D, the heat capacity of a solid i s proportional to T3 owing to the excita- tion of long-wavelength phonons. A 2D solid should, f o r the s a m e reason, have a heat capacity proportional to TZ. This T2 dependence f o r the heat capacity of near monolayer f i lms h a s been reported f o r a number of systems,30 and i s found in Grafoil a s well. In a study on argon coated copper, substitution of 3He for 4He a t about the s a m e density was shown to change the coefficient of the heat capacity i n the rat io of 3:4,31 fur ther supporting the supposition that 2D phonons a r e responsible fo r the observations. However, the m e r e fact that phonons a r e excited i s not enough to identify the 2D medium a s a solid. I t i s neces- s a r y to show that both t ransverse and longitudinal modes a r e present . Thus, in 3D, liquid 4He has a T 3 heat capacity a t low T, but it is due to excita- tion of longitudinal phonons only.
In o r d e r to determine whether t ransverse modes a r e p resen t it i s necessary to have a n independent measurement of the elast ic p roper t i es of the me- dium. F o r this purpose we may use the two-di- mensional compressibility h;. Measurements of K , were f i r s t reported by Stewart, Siegel, and Goodstein.17 Values in agreement with those may b e extracted f rom our own data. The compres - sibility i s given by
If the medium is a fluid, supporting longitudinal sound waves only, then the Debye temperature should be direct ly related to the compressibility by
03;--p - --_. -__ ._--A ' 4 h S 1 2 where the 0,'s a r e derived f r o m the experimental
i/a ' o to r r /n r r2 heat c a p a c ~ t i e s according to
FIG 8 Cheniical potential-coterage isotherms The C/L'Vk=28.8(T/8D)2 . (14) vertical scale has been skewed, a s shown by the dashed l ines, to increase the sensitivity. Temperatures of the Instead, the measured b t ' s a r e s m a l l e r than those
isotherms a r e shown. Various features. including re- predicted by Eq. (13) by a factor of 4 o r more. TO
gions of positive and negative partial molar entropy, a r e account f o r the difference, we must a s s u m e low- pointed out in the figure. frequency t ransverse modes a r e present , in which

9 - T H E R M O D Y N A M I C S T U D Y O F T H E ' H e M O N O L A Y E R A D S O R B E D . . . 2669
c a s e
where c, and c , a r e the t ransverse and longitudinal sound speeds. Since c , must always b e l e s s than c , , 8, i s dominated by the excitation of low-ly ing t ransverse mod%, and is consequently consider- ably s m a l l e r than it would be in a medium with the s a m e compressibility and only longitudinal modes.
A s reported by Stewart et al.," the compress i - bility and Debye tempera tures together suffice to give the Poisson's rat io u of the medium. F o r a fluid in 2D the Poisson's rat io i s equal to 1; any lower value implies the existence of t ransverse modes. The measured value of a f o r 4He i s be- tween 0.6 and 0.7 over the en t i re zone we claim to be 2D solid. In 3D solid 4He, the corresponding values a r e a = 0.5 f o r fluid, a 0.3 observed. We thus have d i rec t evidence that the medium supports t ransverse modes, o r , in o ther words, that i s r e - s i s t s s h e a r s t r e s s e s .
It should be noted that if the f i lm were partially a uniform phase in regis trat ion with the subs t ra te lattice, the melting peak and Poisson's rat io ought to show oscillations a s the coverage var ies through the values of optimum regis trat ion. Since no such variat ions were observed (the sharpening of the melting peak near 6 K has already been ex- plained in t e r m s of multilayer formation), the s h e a r res i s tance i s evidently intrinsic to the f i lm.
The picture of a n isotropic 2D solid i s fu r ther supported by a n analysis performed by S t e ~ a r t . ~ ' Under cer tain specific conditions the two elast ic constants of a n isotropic medium a r e not indepen- dent, but a r e related instead by the Cauchy condi- tions. When this i s t r u e in ei ther 2D o r 3D, Po is - son's rat io i s fixed. In 3D the Cauchy conditions give u=0 .25 in 2D, a = 0 . 3 3 f o r any mate r ia l obey- ing them. However, the ordinary Cauchy condi- tions need to be modified for helium, because helium does not f o r m a solid under i ts own vapor p r e s s u r e in 3D, nor a t ze ro spreading p r e s s u r e in 2D. When the Cauchy conditions a r e applied under conditions of initial s t r e s s , a comes to depend on the applied p r e s s u r e and the compressibility. An- alyzing the situation in 3D, Stewart finds that the Cauchy conditions cor rec t ly predict u and i t s de- pendence on density over the en t i re range of ex- isting data fo r solid 4He. In 2D the predicted val- ue (using our data f o r the applied spreading p r e s - s u r e and compressibility a t 0 K ) i s a= 0.53, r e a - sonably close to the measured value of 0.6-0.7 quoted above.
Other evidence that the medium i s a 2D solid
has been quoted by BDHMV and i s based on the s t r iking s imilar i ty between cer tain propert ies of the film and the corresponding proper t i es of 3D solid helium a t the s a m e interpart ic le spacing. F o r example, the Debye tempera tures a t the s a m e interatomic spacings33 a r e compared in Fig. 9. The c i r c l e s a r e 2D and the c r o s s e s 3D. It should be possible to calculate a unique rat io between 8, and 0, f o r c lose packed c rys ta l s f r o m elast ic theory. Such a p rogram has not been c a r - r ied out, but the experimental rat io does appear to be independent of density. The melting temper - a tu res a t corresponding interatomic spacings a r e shown in Fig. 10. In 2D the two phases do not co- exis t a t different densi t ies a s they do f o r the f i r s t o r d e r transition found in 3D. However. the heat- capacity peaks, shown by c i rc les , a r e found a t the s a m e densi t ies a s the two-phase region shown f o r 3D. (The s q u a r e s a r e a theoretical prediction. to b e explained below.)
The melting peak in the heat capacity a t constant 2Dpressure C* i s shown in Fig. 11 together with the nearby i sos te r ic heat capaci t ies f romwhich it i s de- duced [see Eq. (10c)l. Although C, i s obviously s h a r p e r than C,,,, i t i s c lear ly not the 6 function singularity one would expect if the transition were f i r s t o r d e r . Withthe complete thermodynamic de- scr ipt ion obtained in this project , we can go fur ther and compare the ent i re equations of s ta te . That is done in Fig. 12: T h e r e a r e s t r iking s imi la r i t i es be- tween the observed 2Dbehavior and 3D melting, but we s e e once again that the transition we a r e observing in 2Dis not f i r s t o r d e r . Nevertheless, we a r e in- clined to accept the identification of this phenom- enon a s the melting transition in 2D.
FIG. 9. Debye temperatures a s a function of density. The circles a r e 2 D values reported by BDHXIV. The c ros ses a r e for 3D bulk hcp solid ' ~ e . scaled to an equivalent 2D density, a s explained in Ref. 3 3

R O B E R T L . E L G I N A N D D A V I D L . G O O D S T E I N 9 -
There i s a c l a s s of o rdered s ta tes of mat te r which a r e not supposed to occur in 2D. The c l a s s includes superfluidity, superconductivity, and cer tain kinds of magnetic order .34 In part icular , the c l a s s a l s o includes crystal l ine solids.35 We wish to comment upon the relation between this theorem and the evidence we have reviewed above for the existence of a 2D solid.
Crystals a s they a r e conventionally defined can- not exis t in 2D because the mean-square thermal fluctuations in the position of a n atom in the lat- t ice would increase a s the logarithm of the d i s - tance between the atom's lattice s i t e and the origin. Thus a t any finite temperature there can- not be a well-defined c rys ta l lattice in the thermo- dynamic limit. The importance of this theorem i s underscored by the apparent connection between these mean-square fluctuations and the melting of solids in 3D. If we suppose that sol ids melt when the thermal mean-square displacement of the atoms, 6?. becomes equal to s o m e fract ion of the square of the lattice parameter a: the resu l t i s a melting tempera ture in agreement with empir ical observation. In part icular , assuming that melting occurs when
5?/:a;=y . (16)
then the melting tempera ture of a 3D harmonic solid i s then given by
This resul t i s in agreement with the Lindemann empir ical melting formula,36 which observes that solids melt when
where u i s the molecular volume and C, a n empi r - ical constant. Applying the s a m e idea in 2D, the theorem above tel ls us that the melting tempera- t u r e will always b e 0 K, s ince b2 diverges in the thermodynamic l imit a t a l l finite temperatures .
Nevertheless , we shal l a rgue h e r e that the theorem i s not in conflict with the evidence we have presented, and fur thermore that the Linde- mann formula may be derived f rom entirely dif- ferent arguments which do not s t r e s s the ro le of the mean-square displacements.
It i s c l e a r that we have not and cannot p resen t experimental proof that an infinite 2D crys ta l would exist in a n ideal 2D world. The extent of the observed 2D solid may be limited by the s ize
FIG. 10. Melting curve. Circles show the positions of the melting peaks (see Fig. 6) a s a function of density in the f i rs t layer only, corrected from the raw data by means of the semiempirical model. The solid curves show the phase diagram of bulk helium scaled to 2 0 density by the same method used in Fig. 9. The squares a r e the predictions of the Kostlerlitz-Thouless-Feyn- man theory using 0 K Debye temperatures from BDHhlV. The predicted temperatures a r e higher than those given by Eq. (21) by a factor 1.15, since that equation i s for a square lattice, but we believe the real lattice to be tcp.
FIG. 11. Specific heat a t the melting transition. The data points labeled CeXp show two of the peaks in the isosteric heat capacity attributed to melting in the f i rs t layer only. The curve shows C o , the specific heat at constant 2 D pressure . generated by means of Eq. (10c) In a f irst-order phase transition, C would appear a s a 8 -function infinity.

9 - T H E R M O D Y N A M I C S T U D Y O F T H E ' H e M O N O L A Y E R A D S O R B E D . . . 2671
0.71 + "L/,+-- 1 dyne' G.33 1
FIG. 12. Isochors through melting in the pressure-temperature plane. The left-hand figure, included for compari- son, shows behavior in bulk k e with isochors at densities comparable to those in the 2D plot on the right-hand side (the 2D-3D scaling i s the same as that used in Figs. 9 and 10) . The right-hand figure has been corrected to first- layer-only data using the semiempirical model. The dashed lines show uncorrected isochors including the second layer (i .e.; data with only desorption into the gas corrected for ) . On each isochor, the heat-capacity melting peak occurs at the point of maximum slope in the transition region. Along each isochor between the lighter curves, the medium undergoes a change in entropy of 4 the entropy change observed in 3D melting.
of the Grafoil platelets, which i s not well known.' Moreover , the s t ruc ture of the f i lm may be influ- enced by the crystal l ine subs t ra te upon which it is adsorbed. A s we have argued above, the close correspondence between the propert ies of the 2D and 3D solid 4 ~ e s e e m s to imply that the f i lm in this range of p and 'I' i s not much influenced by the substrate , but that argument i s not conclusive. However, we d o not believe that the nonideality of the experimental film i s central to the question a t hand. We wish to a rgue instead that the theorem does not preclude the existence even of a n ideal infinite 2D solid with the proper t i es we have a t - tributed to the helium film.
The central observation which identifies the s ta te in question a s a 2D solid i s the fact that i t supports long-wavelength, low -f requency t rans - v e r s e sound waves. That observation means that i t r e s i s t s s h e a r s t r e s s e s . If we a r e able to dem- ons t ra te in 3D that a medium r e s i s t s s h e a r s t r e s s , we identify it a s a solid. It may, to be s u r e , not be a crystal l ine solid; g lasses and amorphous sol ids r e s i s t s h e a r s t r e s s e s a s well. However, we believe we can rule out the possibility that the observed f i lm i s a 2D analog of a g lass o r amorphous solid. Amorphous mate r ia l s a r e not equilibrium s ta tes of mat te r . If heated and an- nealed, they tend to c rys ta l l i ze o r a t l e a s t show hysteresis ; moreover , if cooled to 0 K they have
residual entropy. The experimental technique f o r studying the films, on the o ther hand, involved r e - peated warming and annealing, a s described above in Sec. 11. Fur thermore , a s mentioned in Sec. IV. the absolute entropy of the film has been measured both by integrating the heat capacity f rom 0 K a t constant N, and by integrating the par t i a l molar entropy f r o m zero coverage a t constant T. The agreement found between the resu l t s of these pro- cedures indicate that the film entropy goes to ze ro a t 0 K. We therefore believe that we a r e dealing with a s ta te of matter which, in thermo- dynamic equilibrium, r e s i s t s long-wavelength shear s t r e s s e s . In 3D only crystal l ine sol ids have these proper t i es .
Thus solidity (the ability to r e s i s t s h e a r s t r e s s ) and crystallinity (finite 6' about a l l s i t e s in a n in- finite lattice) a r e always found together a t equilib- r ium in 3D. Nevertheless , we know of no funda- mental law which specifies that the f o r m e r i m - pl ies the l a t t e r . Instead, we may have in 2D a medium which has solidity, a s observed, even though infinite-range crystallinity i s forbidden. Such a 2D medium would s t i l l be a n ordered s tate , with a toms in any local region falling on well-de- fined lattice s i t es . The spat ial correlat ions be- tween the positions of a toms a r e washed out a t long dis tances owing to thermal fluctuations, but angular correlat ions between direct ions in the
2672 R O B E R T L . E L G I N A N D D A V I D L . G O O D S T E I N 9 -
lattice a r e p reserved , even in the thermodynamic limit.22 Such a medium could not have a s h a r p x-ray diffraction pat tern (s ince the x-ray intensity is the Four ie r t ransform of the spat ial c o r r e l a - tions) but it could have many other p roper t i es common to c rys ta l s in 3D, among them of course , s h e a r resis tance. The point of view we have just described has been adopted by Koster l i tz and T h o ~ l e s s , ~ ~ and by F e ~ n m a n , ~ ~ who a l s o presen t a theory of melting of 2D solids. An al ternat ive view of the ro le of o r d e r and the melting phenom- enon in 2D has been presented by Dash and B r e t ~ . ~ ~ We have previously reviewed and compared these theories," and do not wish to do s o again in detai l he re . However, we would like to point out again the relation between the Kosterlitz-Thouless- Feynman theory and the Lindemann formula cited above.
In the Kosterlitz-Thouless-Feynmar. view, melt- ing in 2D i s a consequence of the thermal excita- tion of dislocation p a i r s in the 2D solid. If the energy in the s t ra in field of a dislocation pa i r i s given by
where Y is the distance between the members of the pa i r , then the solid melts a t the temperature T , = L k, where the average value of r2 diverges. Feynman has computed L for a 2D solid and gives fo r the resul t
for a square lattice, where C , and c , a r e the speeds of sound a s above. The speeds of sound enter into the 2D Debye temperature in this s a m e combination, s o the predicted melting tempera- tu re may be expressed a s
This has the s a m e f o r m a s the Lindemann formu- la. Eq. (17) above, with the a r b i t r a r y constant y replaced by 2.19/(2n)2-&, a value that i s not un- reasonable. The melting tempera tures predicted by this theory a r e shown by the squares in Fig. 10. It mus t be remembered, of course , that the theory giving r i s e to Eq. (21) i s not applicable in 3D where Eq. (17) i s found to work, s ince dislo- cations a r e very much m o r e complicated in 3D than in 2D. Nevertheless we feel that this resu l t shows that the Lindemann formula cannot be used to establish a d i rec t connection between the melt- ing of a solid and the finiteness of 6'. Thus, the argument we gave e a r l i e r in this section, indicat- ing that 2D solids should melt a t 0 K, loses i t s force.
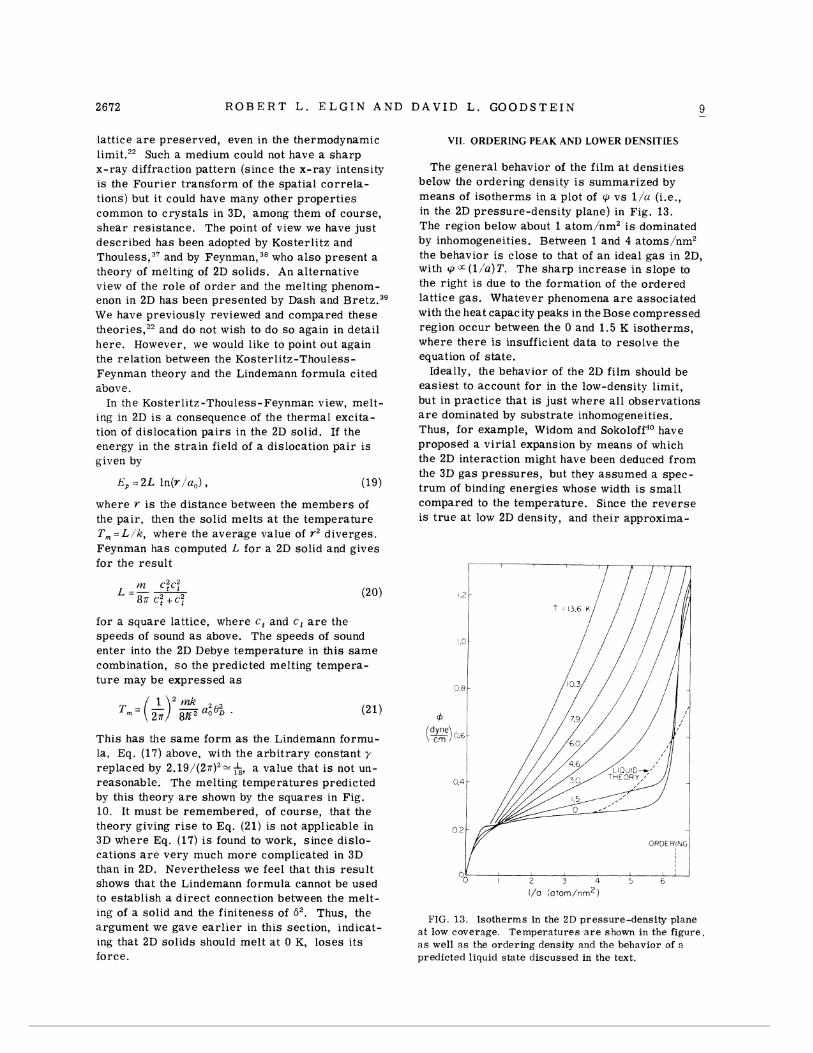
VIf. ORIIERING PEAK AND LOWER DENSITIES
The general behavior of the film a t densi t ies below the ordering density i s summar ized by means of isotherms in a plot of cp v s l i a (i.e., in the 2D pressure-densi ty plane) in Fig. 13. The region below about 1 atom/nm2 i s dominated by inhomogeneities. Between 1 and 4 atoms/nm2 the behavior i s c lose to that of a n ideal gas in 2D, with cpE(l/ 'a)T. The s h a r p increase in slope to the right i s due to the formation of the ordered lattice gas. Whatever phenomena a r e associated with the heat capacity peaks in the Bose compressed region occur between the 0 and 1.5 K isotherms, where there i s insufficient data to resolve the equation of s tate .
Ideally, the behavior of the 2D f i lm should be eas ies t to account fo r in the low-density limit, but in pract ice that i s just where a l l observations a r e dominated by subs t ra te inhomogeneities. Thus, f o r example, Widom and S o k ~ l o f f * ~ have proposed a v i r ia l expansion by means of which the 2D interaction might have been deduced f r o m the 3D g a s p r e s s u r e s , but they assumed a spec- t r u m of binding energies whose width i s s m a l l compared to the temperature. Since the r e v e r s e i s t r u e a t low 2D density, and their approxima-
FIG. 13. Isotherms in the 2D pressure-density plane at low coverage. Temperatures a r e shown in the figure. a s well a s the ordering density and the behavior of a predicted liquid state discussed in the text.
9 - T H E R M O D Y N A M I C S T U D Y O F T H E ' H e M O N O L A Y E R A D S O R B E D . . . 2673
tions a r e applicable only a t low density, i t i s not surpr i s ing that the f o r m they predict f o r the ad- sorption i so therms is never found to be applicable.
The behavior that actually i s observed in the low-density l imit of Fig. 13 i s mos t easily de- scr ibed a s a region of negative 2D p r e s s u r e re la - tive to a n ideal homogeneous substrate . The neg- ative p r e s s u r e i s applied by the inhomogeneities, which a t t rac t the helium away f r o m the more ideal portion of the substrate . To a f i r s t approxima- tion, the behavior of the f i lm on an ideal subs t ra te may be seen by shifting both axes to ignore the inhomogeneity dominated region.
Dash4' has observed that the heat capacity a t 0.5 atoms/nm2 has the fo rm of a 2D Debye solid up to 4 K, and has proposed the existence of a low-density solid region in that p a r t of the phase diagram that we a r e calling inhomogeneity dom- inated. Our own data confirm this f o r m a l l the way up to 15 K, but the agreement does not ob- tain a t e i ther higher o r lower density. The heat capacity in this region i s accounted f o r by the Ross-Oliver-type model discussed in Sec. V. The f o r m i s in fact due to the p resence of 2D solid, but it i s the ordinary high-density solid which f o r m s on the inhomogeneous portions of the sub- s t r a t e .
The equation of s ta te of a 0 K liquid, according to Mil ler , Woo, and Campbell'z i s shown by the dashed curve in Fig. 13. The data do not confirm the exis tence of such a s ta te . N o ~ a c o ~ ~ has es t i - mated that the o rdered lattice g a s should be m o r e s table than this liquid, but l e s s s table than the 2D ideal gas . These predictions a r e confirmed by the observations a t 1.5 K. If the o rdered s ta te were m o r e s table than the gas, this isotherm would be horizontal, s ince patches of o rdered s ta te would f o r m a t low coverage, filling up the sur face a t constant q5 as the coverage increases . Instead the ordered s ta te becomes s table only a t some sufficiently elevated 2D p r e s s u r e .
It should be noted that the ordered s ta te itself is character ized by a compressibility which ap- parently approaches zero. This i s in sharp d i s - tinction to the behavior, say, a t a gas-liquid cr i t ical point, where the compressibility diverges. The s m a l l compressibility i s in excellent agree- ment with the picture that in this s ta te the helium a toms a r e found on s i t e s fixed by the rigid graphite substrate . The zeroing of the compressibility, which shows up a s the s h a r p r i s e in Q, on the right-hand s ide of Fig. 13 may a l s o b e seen in the 3D p r e s s u r e i so therms in Fig. 3. There have been many repor t s of gas-liquid equilibrium in various f i lms,44 which a r e detected by means of a ver t ical portion on a n adsorption isotherm. The lattice g a s ordering phenomenon is character ized
instead by a d e c r e a s e in the s lopes of the iso- therms .
VI11. CONCLUSIONS
The general picture of the %e-Grafoil sys tem that e m e r g e s f r o m this study does not differ in any fundamental respec t f rom that put forward e a r l i e r by BDHMV, but it h a s been enriched by the addition of many quantitative details. Broadly speaking, there i s a 2D solid a t low T and high N in the f i r s t l ayer , bounded by a melting t ransi t ion. The fluid phase on the low-N high-T s ide of the transition may generally be described a s a quan- tum v i r ia l gas , especially when the s ingle-part ic le excited s ta te perpendicular to the sur face i s taken into account. These phases and the transition be- tween them s e e m little affected by the subs t ra te potential once the semi-empir ical models have been used to remove the effects of subs t ra te in- homogeneity and of second-layer formation. The unimportance of the periodic potential found even on a perfect graphi te subs t ra te confirms est i - mates2' that the helium zero-point energy i s l a rge compared to the b a r r i e r height between potential adsorption s i t e s on the subs t ra te . However. a t a coverage corresponding to one helium atom f o r every th ree carbon hexagons in the graphite basal plane substrate , the subs t ra te potential i s able to "shine through" and impose upon the helium a n ordered s t a t e in regis try with itself. This la t ter phenomenon i s observed a s the lattice-gas o r d e r - ing peak.
The part icular contributions of this project to understanding the 4 ~ e - G r a f o i l sys tem a r i s e f r o m the new ca lor imet r ic and vapor -pressure data above 4 K, the combined thermodynamic analysis made possible by those data, and application of the technique of semiempi r ica l modeling of the film. In addition, dependable c r i t e r i a for a s c e r - taining equilibrium in the film have been developed and, we believe, important new insights have been gained a s a resu l t of Feynman's in te res t in this work.
The analyses of the data that we have presented have allowed u s to show that the d ramat ic increase in the heights of the melting peaks a t elevated den- s i t i es a r e a consequence of second-layer fo rma- tion, and that the observed low-density heat ca - pacities a r e due to the formation of compressed helium film on inhomogeneous portions of the substrate . The ground-state and f i rs t -exci ted- s ta te energies of a helium a tom adsorbed on a perfect Grafoil subs t ra te have been measured to be -143 * 2 and -89 * 3 K, respectively. E a r l i e r vapor -pressure measurements in this laboratory, confirmed in the p resen t work, have given the 2D

2674 R O B E R T L . E L G I N A N D D A V I D L . G O O D S T E I N 9 -
compressibi l i t ies of the film; these together with Debye tempera tures f r o m BDHMV have made it possible to establ ish the presence of t ransverse sound modes in the solid phase. Moreover, iso- chores in the 2D p r e s s u r e temperature plane have been constructed allowing detailed character iza- tion of the melting transition. In the fluid region we have confirmed that the 2D ideal g a s with quantum vir ial correct ion gives a n accura te a c - count of the system.
Finally, i t should be pointed out that the s tudies of the kind we have reported h e r e may be expected to lead to new insights into the nature of mat te r in 3D. A s an example, Stewart's study of the e las - tic propert ies of the 2D medium has led to the ob- servat ion, evidently not previously realized, that the Debye temperature of 3D solid 4He a r e con- s i s ten t with the Cauchy conditions if initial s t r e s s is properly taken into account. More speculative but perhaps m o r e fundamental is the discovery that the 2D dislocation theory of melting gives r i s e to the 3D Lindemann empir ical melting formula. In a s i m i l a r vein, we s e e in the 2D solid f o r the f i r s t t ime c l e a r evidence for a mater ial which,
x ~ u p p o r t e d in p a r t under FSF Grant No. GH34682. + p r e s e n t address : 26-147 &TIT, Cambridge, Mass.
02139. 'h1. B r e t z , J . G. Dash, D. C. Hickernell, E. 0. AIcLean,
and 0. E. Vilches, Phys. Rev. A 8, 1589 (1973). 'GTA grade Grafoil @, produced by Union Carbide. "J. G. Dash and J. Siegwarth, Rev. Sci. Instrum. 34.
1276 (1963). 'FO' further details concerning the apparatus s e e R. L.
Elgin, thes i s (California Institute of Technology, 1973), unpublished (available f rom University Microfi lms, .inn Arbor) . 9. Edmonds and J. P . Hobson, J. Pac . Sci. Technol. 2,
182 (1965); J. P . Hobson, J . Vac. Sci. Technol. 6, 257 (1969); J. T'ac. Sci. Technol. z, 851 (1970); G. T. Mc- Conville. Cryogenics 9, 122 (1969) ; R. A. Watkins , LV. L. Taylor , and W. J . Hanbach, J. Chem. Phys. 46, 1007 (1967); J. Chem. Phys. $, e r r a t u m 3692.
%. W. Weber, W . H. Keesom, and G. Schmidt, Commun. Kamerlingh Onnes Lab. Univ. Leiden No. 246a (1937); s e e a l so Nos. 22313 Suppl. (1932). 716 (1933), and 246b, c , d (1937).
'It i s possible in principle to deduce the vapor p r e s s u r e f rom heat capacit ies if measurements a r e made in two ce l l s with different f r e e volumes. See J . G. Dash, R. E. P e i e r l s , and G. A . Stewart . Phys. Rev. A 2, 932 (1970).
'L . D. Landau and E. hI. Lifshitz, Statistical P h y s ~ c s , 2nd ed . , t ranslated by J . B. Sykes and M. J. Kearsley (Addison Wesley, Reading, Mass., 1969).
"RI. I,, hlcGlashan, J. Chem. Educ. 3, 226 (1966). 'OX. UTidom, Phys. Rev. 185, 344 (1969). ' IT. L. Hill. J . Chem. Phys. s, 520 (1949).
in i t s equilibrium s ta te , r e s i s t s low-frequency s h e a r s t r e s s e s , but cannot have the spat ial cor - relations usually associated with crystallinity. Moreover, when the 2D solid melts , the t rans i - tion i s not f i r s t o rder , although melting in 3D i s always f i r s t o r d e r . This observation tends to lend weight to the view" that melting in 3D must always be f i r s t o r d e r because the long-range spat ial o r d e r of 3D crys ta l s i s a property that cannot vanish in a continuous wag.
ACKNOWLEDGMENTS
The authors owe a substantial debt of gratitude to Professor R. P . Feynman, not only for the very rea l , d i rec t contributions he has made to this work, but a l so fo r his continuing enthusiasm and support. We a r e a l s o indebted to Professor J. G. Dash, the other members of BDHMV, and the r e s t of the Seattle group f o r their generous sharing of data and ideas. Professor G. A . Stew- a r t h a s mater ial ly aided the p r o g r e s s of this work, and we a r e grateful to him and to Jeffrey Greif for countless discussions and contributions.
" ~ e f . 1, pp. 42-51. '%ee Ref. 4 , Appendix I. ' ' see, for example, D. 31. Young and .A. D. Crowell ,
Physical Adsorption of C ~ s e s (Butterworths, London, 1962).
' " 3 1 . Bretz and J. G. Dash, Phys. Rev. Lett . g, 729 (1972).
''see Ref. 1. part icularly Fig. 19. "G. A. Stewart , S. Siegel, and D. L. Goodstein, in Pro-
c e ~ d i n z s <$ the 13th Internationul Confe?.encc, on Lozc Tenzperatzcre Phys ics , Boulder, Colouatfo, 1972 (Plenum, Kew York, to be published).
18J. L. Wallace and D. L. Goodstein, J. 1 . o ~ Temp. Phys. 3 , 283 (1970).
'gSee, f o r example. IV. D. hZcCormick. D. L. Goodstein, and J. G. Dash, Phys. Rev. 168. 249 (1968).
''3. L Siddon and &I. Schicli, Pllys. Rev. A 2, 907 (1974); in :!4onoluyer an(/ Subrnonolayer F i l m s , edited by ,T. G . Daunt and E. L e r n e r (Plenum. New York, 1973), pp. 65-74.
"H. K. Jacltson, Phys. Rev. 180, 184 (1969). "R. L. Elgin and D. L. Goodstein, in Monolaye), and
Submonolaye?- Fil tns, edited by J. G. Daunt and E. L e r n e r (Plenum, New York. 1973), pp. 35-52.
2 3 ~ . Ross , in The Solid-Gas Interface, edited by E . '1. Flood (DeMcer, New York? 1966).
" ~ a t a in the multilayer region and in the monolayer r e - gion using 3 ~ e a r e being analyzed and will be presented in a l a t e r publication.
"D. E, Hagen, A . D. NOVRCO, and F. J . hlilford. P r o - ceedings of the 2nd Interrlational Symposium on Atlsovp- tion-Desarption Phenornenu, Florence, Italy, 1971 (Academic. New Yorlz. 1972).

9 - T H E R M O D Y N A M I C S T U D Y O F T H E
2 6 ~ D. Sovaco. Phys. Rev. A 7, 1653 (1973). 2 ' ~ . J u r a and T . L. Hill. J. A m . Chem. Soc. 74-, 1598
(1952). 2 8 ~ h e other c ross ings indicate the transi t ion f rom dilute
to dense fluid within a s ingle layer . Below the c r i t i ca l t empera ture , plotting T log(Po/P) , where Po i s the vapor p r e s s u r e in the bulk. should give the m o r e sen- sitive t e s t of whether the part ial entropy i s above the bulk value.
"An experiment in this laboratory using helium on oxi- dized copper gave no c ross ings f o r T > 4 K.
"H. P. R. Freder ickse , Physica e, 860 (1949) [the sig- nificance of the T~ dependence in these measurements was pointed out by W. Band, Phys. Rev. 2, 441 (1949)); W. D. hIcCornlick et a l . , Ref. 19 ; D. F . B r e w e r , A. J. Symonds, and A. L . Thomson. Phys. Rev. Lett . 15, 182 (1965): G. A. Stewart and J . G. Dash, Phys. Rev. A 2, 918 (1970); J. Low Temp. Phys. 5, 1 (1971). See also J. G . Dash, J. Low Temp. Phys. 1, 173 (1969).
3 1 ~ . L. Goodstein, W. D, hIcCormick. and J . G. Dash, Phys. Rev. Lett. 15, 447 (1965).
3 2 ~ . A, Stewart , Phys. Rev. A (to be published). 3 3 ~ o l i d ' ~ e in 3D i s hexagonal c lose packed (hcp) a t 0 K.
The close packed 2 D s t ruc ture i s t r iangular (tcp). The atomic a r e a that corresponds to the s a m e interatomic spacing a t a given volume for these c rys ta l s i s a = 1 , 0 9 1 ~ ~ ' ~ . This scal ing w a s used in Figs. 9 . 1 0 , and 12.
' H e M O N O L A Y E R A D S O R B E D . . . 2675
'IP. C. Hohenberg, Phys. Rev. 158, 383 (1967). 3 5 ~ e e Ref. 34. See a l so R. E . P e i e r l s , Ann. Inst. Henri
Poincare 5, 177 (1935); L. D. Landau, Phys. Z . Sowjetunion 11, 26 (1937); B. Jnncovici, Phys. Rev. Lett. 5, 20 (1967); I-. Gunther, Phys. Lett. z, 649 (1967); z, e r r a t a (1968); N. D. Mermin, Phys. Rev. 176, 250 (1968); Y. I m r y and I,. Gunther. Phys. Rev. - B 2, 3939 (1970); J . F. Fernandez . Phys. Rev. A 3, 2555 (1970).
3 6 ~ . A . Lindemann, Z. Physik 2, 609 (1910). 3i5. M. Kosterl i tz and D J. Thouless, J . Phys. C 2,
L124 (1972); J. Phys. C 5, 1181 (1973). 3 8 ~ . P . Feynman, a s repor ted in Ref. 22. "J. G. Dash and RI. Bre tz , J. Low Temp. Phys. 2, 291
(1972). ''A. Widom and J. B. Sokoloff, Phys. Itev. A 5, 475
(1972). "J. G . Dash, in Ref. 17 . 12h'I. D. Miller , C. n'. Woo. and C. E. Campbell. Phys.
Rev. .A 6 , 1942 (1972). %ee Ref. 26.
number of such r e p o r t s a r e reviewed in Ref. 14. See a l so A. Thorny and X. Duval, J. Chim. Phys. Physiocochim. Biol. s. 1966 (1969); .J. Chim. Phys. Physiocochim. Biol. 61, 286 (1970); J. Chim. Phys. Physiocochim. Biol. 61, 1101 (1970)
"see Ref. 8. p. 264.