Embed Size (px)
Citation preview

Research ArticleThermodynamic Analysis of a Solar Combined EjectorAbsorption Cooling System
Doniazed Sioud , Raoudha Garma, and Ahmed Bellagi
Energy Engineering Department, Ecole Nationale d’Ingenieurs de Monastir (ENIM), University of Monastir, Tunisia
Correspondence should be addressed to Doniazed Sioud; [email protected]
Received 30 July 2018; Revised 15 October 2018; Accepted 24 October 2018; Published 11 November 2018
Academic Editor: Angelo Maiorino
Copyright © 2018 Doniazed Sioud et al.This is an open access article distributed under theCreative Commons Attribution License,which permits unrestricted use, distribution, and reproduction in any medium, provided the original work is properly cited.
The objective of this paper is to investigate theoretically a solar driven 60 kWabsorption cooling system.The system is constituted ofa combined ejector single-effect absorption cycle coupled with a linear Fresnel solar concentrator and using water/lithium bromideas working fluid. The combined ejector single-effect absorption cycle exhibits high performances, almost equal to that of double-effect absorption device. However, higher driving heat temperatures are required than in the case of conventional single-effectmachines. A mathematical model is set up to analyze the optical performance of the linear Fresnel concentrator. Simulations arecarried out to study the overall system performance𝐶𝑂𝑃system and the performances of the combined absorption machine𝐶𝑂𝑃cyclefor generator driving temperatures and pressures in the ranges 180∘C – 210∘C and 198 kPa – 270 kPa, respectively. Further, the effectof operating parameters such as the coolingmedium and chilledwater temperatures is investigated. Amaximum cycle performanceof 1.03 is found for a generator pressure of 272 kPa and chilled and cooling water temperatures of 7∘C and 25∘C, respectively. A casestudy is investigated for a typical summer Tunisian day, from 8:00 to 18:00. The effect of ambient temperature and solar radiationon cycle and system performances is simulated. The optical performances of the concentrator are also analyzed. Simulation resultsshow that between 11:00 and 14:00 the collector efficiency is 0.61 and that the𝐶𝑂𝑃𝑐𝑦𝑐𝑙𝑒 reaches values always higher than 0.9 and the𝐶𝑂𝑃𝑠𝑦𝑠𝑡𝑒𝑚 is larger than 0.55. Globally the performances of the investigated cycle are similar to those of double-effect conventionalabsorption system.
1. Introduction
In summer, the demand of electrical energy for air-condi-tioning and refrigeration becomes important, particularly inhot climate zones like the Mediterranean region. In manycountries in this climate zone, the electric energy consump-tion reaches, and sometimes exceeds, in hot summer daysthe limit of production capacity. Consequently, the overallenergy consumption and costs and the environmental impactbecome important. To reduce these impacts, solar coolingtechnologies may constitute a promising and attractive solu-tion.
Solar energy applications and practices are investigatedfor different domains [1] such as pyrolysis [2], refrigerationand cooling [3], power generation [4], drying and variousother industrial uses [5, 6]. In view of the increased interestin high temperature solar applications, many studies focus onthe amelioration of collector configurations and concentrator
techniques in order to improve their optical efficiency andthe heat transfer characteristics of the absorber by using forinstance nanofluids as a heat transfer fluids [7].
In the domain of refrigeration and air-conditioning,absorption techniques for production of cold are consid-ered particularly suitable for solar applications. Single-effectabsorption systems can be activated by flat plate collectorsand/or evacuated tube collectors [8, 9] since they require rela-tively low temperatures of the driving heat sources.They havehowever low performances. Therefore, investigators focusattention on double-effect absorption cycles that need highertemperature heat sources provided by parabolic through col-lectors or linear Fresnel concentrators. Several investigationsconsider the technologies of double-effect absorption systemscoupled with parabolic through collectors. An 11 kW solarabsorption cooling system was studied by Florides et al.[10] in Nicosia and optimized using TRNSYS. The requiredparabolic collector area was 15m2 and the capacity of hot
HindawiJournal of EngineeringVolume 2018, Article ID 7090524, 12 pageshttps://doi.org/10.1155/2018/7090524

2 Journal of Engineering
1518
17 16
Steam drum
11
8 Condenser
EvaporatorAbsorber
Generator
4
5
6
3
7
1
2
9
10
12
13
Chilled waterCooling water
Figure 1: Solar combined ejector single-effect chiller.
water storage, 600 L. Shirazi et al. [11] investigated the feasi-bility of producing cooling via the connection of LiBr-H2Osingle, double, and triple-effect absorption cycles to solarcollectors under various weather conditions, namely, 1023kW single-effect absorption chiller coupled with evacuatedtube collectors (ETCs), parabolic trough collectors (PTC)coupled with 1163 kW double-effect and triple-effect units.The authors concluded that the energetic and economicperformance of multieffect absorption machines coupledwith concentrating collectors in low direct normal irradiation(DNI) fraction (less than 50%) climate zones is poor dueto large solar field sizes required and high payback timecompared to a single-effect chiller system driven by heatfrom evacuated tube collector array. On the other hand,in climatic regions with very high DNI faction (more than65%), the combination of triple-effect chiller and parabolictrough collectors results in the most energy-efficient andcost-effective plant configuration, achieving the smallest solarfield and the lowest payback period. Chemisana et al. [12]compared cooling systems connected and not connected tosolar collectors. The solar cooling devices were basic single-effect absorption system that used heat from evacuated tubecollectors, double-effect absorption system coupled with aFresnel reflective collector incorporated on a building facade.These authors found that the solar absorber area of theFresnel collector systemwas lower than that of standard solarthermal machine. Beltagy et al. [13] investigated theoreticallyand experimentally a solar cooling prototype with Fresnelcollectors. The setup was designed basing on developedtheoretical model, and experimental data was comparedto numerical results. It was found that the measured andestimated produced thermal power from collectors and theefficiency per day were comparable. In addition, they foundthat the efficiency exceeds 40% per day for the 250 kWthermal prototype.
A 174 kW solar/gas double-effect LiBr/water absorptionplant was tested at Seville in Spain [14].The systemwas drivenby a pressurized hot water flow using a 352 m2 heated bya linear Fresnel collector. A direct-fired natural gas burnerwas used as auxiliary heat source. For 75% of generator’s
total heat input covered by solar energy, the average collectorefficiency was found to vary between 0.35 and 0.4, and themean coefficient of performance of the chiller, between 1.1and 1.25.
Major drawbacks of the solar cooling systems are lowefficiency in case of use of solar collectors with single-effectabsorption systems and huge areas of thermal collectorsrequired in case of double-effect absorption cycles. Newmachine configurations with high efficiency are needed. Inliterature, it is reported that some modified designs of single-effect chillers might exhibit coefficients of performance sim-ilar to that machines applying double-effect cycles [15, 16].In these configurations, ejectors are incorporated in betweengenerator and condenser.
The aim of this paper is to investigate a solar combinedsingle-effect cycle using LiBr-H2O as working fluid andcoupled to solar collector. Because high temperature levelsare needed to active the installation, a linear Fresnel collectoris considered for the production of high temperature steamrequired to regenerate the refrigerant in the desorber. Drivingtemperature and chilled water temperature as well as coolingwater temperature affect the performance of the chiller,𝐶𝑂𝑃cycle, and the overall system performance, 𝐶𝑂𝑃system.Following simulations analyze thoroughly the effect of thesethree parameters. Also a case study of a typical Tunisiansummer day is performed.
2. Description of the System
The proposed solar 60 kW cooling system is coupled witha 164 m2 linear Fresnel collector, as schematically illustratedin Figure 1. The adopted collector (type IS-LF11 [17]) is usedto produce steam at temperatures between 180∘C and 230∘C(pressures of 10 bar and 28 bar, respectively) for driving thegenerator of the combined cooling cycle. Cold is produced attemperatures between 12∘C and 4∘C.
The combined ejector single-effect cycle looks like anordinary absorption single-effect cycle where an ejector isinserted between the generator and the condenser. The basicoperational principle of the system is as follows: In the

Journal of Engineering 3
4.5m
7.5m
4.06m
1 23 4 5 6 7 8 9 10 11
Figure 2: A module of industrial linear Fresnel collector.
generator, the aqueous salt solution (H2O/LiBr) is broughtto boiling by heat provided by the solar source, in orderto vaporize the refrigerant (water) and separate it fromthe solution. These high-pressure refrigerant vapors (7) areintroduced in the ejector nozzle as primary flow where theyare accelerated and strongly depressurized. A fraction ofthe vapor exiting the evaporator (13) is entrained by theprimary flow into the ejector. The two gases are then wellmixed in the mixing chamber and compressed in the diffuser(8) before feeding the condenser (9) where they liquefy byrejecting condensation heat to the cooling water (cw). Thecondensate expands through an adiabatic expansion valve(10) and proceeds to the evaporator where it evaporates(11) by absorbing heat from the chilled water. While in thebasic cycle, all the refrigerant vapor leaving the evaporatorproceeds to the absorber, only a part of it flows into theabsorber in the combined cycle where it dissolves in the saltrich solution. The rest of the vapor is sucked in the ejector assecondary flow.The salt solution that leaves the absorber (1) ispumped to the generator (3), after preheating in the solutionheat exchanger.
The generator is activated by the heat ��𝑔 liberated bycondensation of hot saturated steam (15) which is thenpumped back as liquid (16) to the steam drum. A primarythermal transfer fluid loop (17-18) vehicles heat from solarcollector to steam drum.
2.1. Solar Linear Fresnel Collector. IS-LF11 solar linear Fresnelcollectors considered here are combined with boiler andcan be used for industrial processes. Process heat in therange of 100 kW to 10 MW at standard pressure of 40bar is generated, but up to 120 bar and temperatures up to400∘C are possible [17]. A “module” is one block of collectorsassociated with 4.06 m long vacuum absorber tubes. Figure 2presents two modules of the adopted industrial collector. It ispossible to use different kinds of heat transfer fluids (HTF):pressurized water, thermal oil, superheated steam, etc. Table 1gives the manufacturer data of the commercial industrialFresnel collector used in the simulations.
Table 1: Technical data of basic IS-LF11 module [17]
Width (m) 7.5Length (m) 4.06Primary mirror area (m2) 22Receiver height (m) 4.5Mirror rows number 11Thermal loss of primary reflector,𝑢1 (W/m2K2) 0.00043
Clearance between mirror rows(m) 0-0.5
Specific weight (kg/m2installation surface area) 27
Maximum operationaltemperature (∘C) 400
Life expectancy (years) +20
Heat transfer flow Pressurized Wateror thermal oil
2.2. LiBr-H2O Combined Ejector Single-Effect AbsorptionChiller. In the investigated combined ejector single-effectabsorption cycle the ejector is located between condenserand generator. It uses the vapor produced in the generator toentrain and compress the refrigerant vapor coming from theevaporator before flowing in the condenser. Consequently,the pressure in generator and condenser—equal in a con-ventional single-effect cycle—are now distinct: intermedi-ate pressure in condenser, equal to the high pressure inthe original cycle, and a higher pressure in the generator.Hence, higher driving source temperatures are now required,between 180∘C and 210∘C. Table 2 gives the assumed operat-ing conditions in the simulations. In particular, the nominalcooling power of the installation is ��𝑒 = 60 kW, available inform of chilled water at temperatures between 4∘C and 12∘Cfor driving temperatures and pressures in the range 180∘C –210∘C and 198 kPa – 270 kPa, respectively.
2.3. Ejector. A typical ejector configuration is shown inFigure 3. A steam ejector is composed of four zones: primarynozzle, suction chamber, mixing chamber (convergent ductfollowed by constant section area), and diffuser. Table 3 givesthe ejector geometrical data [16].
3. Theoretical Model
3.1. Linear Fresnel Collector Model. The optical efficiency𝜂𝑜𝑝𝑡𝑖𝑐𝑎𝑙 of the collector depends on the incidence angle of thedirect irradiation. As reference of 𝜂𝑜𝑝𝑡𝑖𝑐𝑎𝑙 is its value 𝜂0 underideal conditions: clean reflectors and absorber tubes, sun atzenith. For the adopted collector 𝜂0 = 0.635 and 𝜂𝑚𝑎𝑥 = 0.663(sun at 5∘ transversal zenith angle, and 0∘ longitudinal zenithangle). For arbitrary incidence angle 𝜂0 is multiplied by a cor-rection factor, the so-called incidence angle modifier (𝐼𝐴𝑀).𝐼𝐴𝑀 has two components: a field independent transversalcomponent, 𝐼𝐴𝑀𝑡, and a longitudinal component, 𝐼𝐴𝑀𝑙, thatdepends on the number of in string assembled modules (onein Figure 2).

4 Journal of Engineering
Table 2: Operating conditions assumed for the simulations.
Input parameter Fixed value RangesCapacity (kW) 60Generator temperature (∘C) 180-210Steam pressure (kPa) 198-270Inlet temperature cooling medium (∘C) 32 25-35Chilled water outlet (∘C) 7 7- 12Heat exchanger efficiency 0.8
Secondary fluid
Primaryfluid
Back pressure
At
t
7
13
8Ak
j ki
Primary nozzle
Mixingchamber DiffuserSuction chamber
Figure 3: Schematic diagram of ejector.
Table 3: Ejector characteristics [16].
Parameter ValueNozzle throat diameter, 𝑑𝑡 (mm) 1.6Nozzle exit diameter, 𝑑𝑖 (mm) 6Mixing chamber diameter, 𝑑𝑗 (mm) 18Mixing chamber length (mm) 140Diffuser divergent length (mm) 210Diffuser exit diameter (mm) 40
The thermal losses of the reflector, 𝑞𝑙𝑜𝑠𝑠, are dominated byradiative losses and approximately estimated by
𝑞𝑙𝑜𝑠𝑠 = 𝑢0𝐴𝑎𝑝𝑒𝑟𝑡𝑢𝑟𝑒Δ𝑇 + 𝑢1𝐴𝑎𝑝𝑒𝑟𝑡𝑢𝑟𝑒Δ𝑇2 (1)
𝐴𝑎𝑝𝑒𝑟𝑡𝑢𝑟𝑒 stands for the active aperture area of the collectorand Δ𝑇 for the temperature difference between that of theheat transfer flow HTF and the ambient, as expressed in
Δ𝑇 = 𝑇𝐻𝑇𝐹 − 𝑇𝑎𝑚𝑏 (2)
The thermal loss coefficients of the IS-LF11 are 𝑢0 = 0 and𝑢1 = 43. 10−5W/m2K2 [17]. Equation (1) reduces then to
𝑞𝑙𝑜𝑠𝑠 = 43.10−5𝐴𝑎𝑝𝑒𝑟𝑡𝑢𝑟𝑒Δ𝑇
2 (3)
The collected thermal power 𝑞 writes as
𝑞 = 𝜂𝑜𝑝𝑡𝑖𝑐𝑎𝑙𝐴𝐺 − 𝑞𝑙𝑜𝑠𝑠
= 𝜂0𝐼𝐴𝑀𝑙 (𝜃𝑙,𝛿) 𝐼𝐴𝑀𝑡 (𝜃𝑡,𝛿) 𝐴𝑎𝑝𝑒𝑟𝑡𝑢𝑟𝑒𝐺
− 𝑢1𝐴𝑎𝑝𝑒𝑟𝑡𝑢𝑟𝑒Δ𝑇2
(4)
where 𝜃 is the zenith angle, 𝛿, the angle between absorberpipe and the north-south direction, and 𝐺, the direct normalirradiance (DNI).
The thermal efficiency of the collector 𝜂 is the ratio ofthe usable thermal power 𝑞 and the solar irradiance collected(𝐴𝑎𝑝𝑒𝑟𝑡𝑢𝑟𝑒𝐺), detailed in
𝜂 =𝑞
𝐴𝑎𝑝𝑒𝑟𝑡𝑢𝑟𝑒𝐺= 𝜂𝑜𝑝𝑡𝑖𝑐𝑎𝑙 −
𝑞𝑙𝑜𝑠𝑠𝐴𝑎𝑝𝑒𝑟𝑡𝑢𝑟𝑒𝐺
= 𝜂0𝐼𝐴𝑀𝑙 (𝜃𝑙,𝛿) 𝐼𝐴𝑀𝑡 (𝜃𝑡,𝛿) − 𝑢1𝐴𝑎𝑝𝑒𝑟𝑡𝑢𝑟𝑒Δ𝑇2
𝐺
(5)
Figure 4 depicts this correlation, 𝜂 versus(Δ𝑇/𝐺), for theadopted collector and various values of 𝐺 [17]. It is worthynoticing that knowing thermal efficiency, irradiation, andactual collector size, the expected gross heat produced by thecollector can be predicted.
3.2. Combined Ejector Single-Effect Absorption Cycle Model.The mathematical model of the cycle is based on mass andenergy balances written for each machine element. For asteady state process and neglecting kinetic and potential

Journal of Engineering 5
Table 4: Comparison of results from [16] with those of present work.
Ref. [16] Present workCondenser pressure (kPa) < 3 3.78Generator temperature (∘C) 192 192Generator Pressure (∘C) 198 198Concentration at absorber exit (mass. %) 62.3 62.3Refrigerant mass flow rate, generator (kg/min) 0.0393 0.0393Refrigerant mass flow rate, evaporator (kg/min) 0.059 0.063��𝑔(kW) 2.8 2.8��𝑒(kW) 2.4 2.5𝐶𝑂𝑃 0.87 0.91
T/
G=0
.2 m
K
/W
T/
G=0
.m
K
/W
DNI 200W/G2
DNI 400W/G2
DNI 600W/G2
DNI 800W/G2
DNI 1000W/G2
= 0 −O0Δ4/'-O1Δ42/'
0.25 0.50 0.75 1.00 1.25 1.50 1.75 2.000.00Δ4/' [G2K/W]
0.0
0.1
0.2
0.3
0.4
0.5
0.6
0.7
Effici
ency
Figure 4: Collector thermal efficiency 𝜂 versus (Δ𝑇/𝐺) for variousvalues of 𝐺.
energy variations, balance equations for global mass (equa-tion (6)), salt mass (equation (7)), and energy (equation (8))write, respectively,
∑��𝑖𝑛 = ∑��𝑜𝑢𝑡 (6)
∑��𝑖𝑛𝑋𝑖𝑛 = ∑��𝑜𝑢𝑡𝑋𝑜𝑢𝑡 (7)
∑�� −∑�� = ∑��𝑜𝑢𝑡ℎ𝑜𝑢𝑡 −∑��𝑖𝑛ℎ𝑖𝑛 (8)
�� and �� are heat and transfer rates between machineelement and its surroundings. The𝐶𝑂𝑃cycle of the absorptionsystem is expressed as
𝐶𝑂𝑃cycle =��𝑒
��𝑔 + ∑��P(9)
3.3. Ejector Model. The adopted 1D model of the ejector isdetailed in reference [15]. It is based on quadratic equationsof each zone and enables the prediction of the ejectorperformance, i.e., the entrainment ratio (ratio of mass flowrate of the primary flow ��7 and secondary flow rate ��13)for given ejector geometry and inlet and outlet pressures andtemperatures.
4. Validations
A computer programs are developed using the softwareEngineering Equation Solver (EES) [20] in order to validatethermodynamically the models of combined ejector single-effect absorption unit and steam ejector.
4.1. Validation of Combined Ejector Single-Effect Model. Thesimulations are run under following conditions, according tothe data of [16]:
(i) Evaporator temperature: 5∘C(ii) Condenser temperature: 28∘C(iii) Concentrations of salt solution leaving absorber:
62.3%(iv) Heat exchanger effectiveness: 0.8(v) Solution flow rate leaving generator: 0.393 kg/min(vi) Generator pressure: 198 kPa and temperature: 192∘CTable 4 compares the obtained simulations results with
those reported by Aphornratana et al. [16]. As can be noted,deviations are generally small, less than 1%, with a maximumof 6% for the mass flow rate of refrigerant leaving the evap-orator. This can be attributed to the simplifying assumptionof perfect gas behavior for the steam in the ejector model.Deviations of driving power and cooling load are respectively0.3% and 6%.Thus, the proposed model for the simulation ofthe chiller is fairly validated.
4.2. Validation of Ejector Model. In the experimental workof Sriveerakul et al. [19], various combinations of ejectorgeometry were tested for different operating temperaturesand pressures. Primary and secondary flows were vapors.The1D model used for the machine simulations is tested againstthe data of this experimental work for validation. Calculatedresults are compared with data reported in [19] in Table 5.
Deviations 𝜀% for backpressure, entrainment ratio, andejector area ratio are determined as
𝜀% = calculated value − experimental valueexperimental value (10)
Minimum absolute percent deviation of backpressure is 3%and maximum, 23%. For entrainment ratio the correspond-ing values are 0.3% and 18%, and for ejector area ratio, 0% and

6 Journal of Engineering
Table 5: Ejector model validation (𝑇𝑝, primary flow temperature;𝑇𝑠, entrained flow temperature; (𝐴𝑘/𝐴 𝑡), ejector area ratio, i.e., ratio ofconstant area section, 𝐴𝑘, and nozzle throat area, 𝐴 𝑡).
Backpressure (mbar) Entrainment ratio (𝐴𝑘/𝐴𝑡)Exp. [19] Cal. 𝜀 (%) Exp. [19] Cal. 𝜀 (%) Exp. [19] Cal. 𝜀 (%)
𝑇𝑝 = 120∘C, 𝑇𝑠 = 10
∘C0.53 0.48 -10. 90.25 103 14. 37 37 0
𝑇𝑝 = 130∘C, 𝑇𝑠 = 10
∘C0.4 0.39 -3. 90.25 97.71 18. 50 50 0
𝑇𝑝 = 140∘C, 𝑇𝑠 = 15
∘C0.28 0.33 18. 90.25 96.02 6. 65 65 0
𝑇𝑝 = 130∘C, 𝑇𝑠 = 5
∘C0.31 0.32 5. 90.25 96.55 7. 48 48 00.39 0.43 13. 117.9 117.5 -0.3 41 37 11.0.47 0. 57 23. 160.5 144.2 -10. 35 31 13.0.31 0.36 19. 90.25 104.6 16. 45 43 5.0.3 0.35 18. 90.25 101.7 13. 46 46 0
13%. Based on the simulation results and percent deviationsreported in Table 5, it can be concluded that the proposed 1Dejector model describes fairly well the experimental data.
5. Solar Chiller SimulationResults and Discussion
Simulations of a 60 kW solar chiller are performed in orderto analyze thermodynamically and predict the performancesof a combined ejector single-effect absorption refrigerationcycle coupledwith linear Fresnel collectormodules.The com-puter programwas developed using the software EngineeringEquation Solver (EES) [20]. Thermophysical properties ofthe refrigerant system LiBr-H2O are determined by applyinginternal procedures of the software. Tunisian climate andmeteorological data are taken into consideration in theprogram.
A solar absorption chiller is characterized by an overallcoefficient of performance,𝐶𝑂𝑃𝑠𝑦𝑠𝑡𝑒𝑚, a key factor to describethe efficiency of the entire system, expressed in (11), and isdefined as the product of the efficiency of the solar collector 𝜂and the thermal coefficient of performance of the absorptionrefrigerant cycle 𝐶𝑂𝑃𝑐𝑦𝑐𝑙𝑒 [21]:
𝐶𝑂𝑃𝑠𝑦𝑠𝑡𝑒𝑚 = 𝜂𝐶𝑂𝑃𝑐𝑦𝑐𝑙𝑒 (11)
5.1. Effect of Generator Temperature and Pressure on SystemPerformance (for Constant ChilledWater Temperature). Sim-ulations are performed by varying gene rotor temperatureand pressure as well as the cooling medium temperature,for fixed chilled outlet-temperature, 𝑇𝑐 = 7
∘C. The resultsare represented graphically in Figures 5(a), 5(b) and 5(c),for, respectively, three values of the generator pressure 198kPa, 232 kPa, and 272 kPa. The coefficient of performanceof the chiller 𝐶𝑂𝑃𝑐𝑦𝑐𝑙𝑒 together with the performance ofthe whole installation 𝐶𝑂𝑃𝑠𝑦𝑠𝑡𝑒𝑚, including the solar facility,is depicted versus generator temperature for three valuesof the generator pressure and cooling medium tempera-ture.
Table 6: Maximum 𝐶𝑂𝑃 reached for solution generator tempera-ture set at 210∘C (maximum considered) and 𝑇𝑐 = 7
∘C.
𝑃𝑔𝑒𝑛𝑒𝑟𝑎𝑡𝑜𝑟 (kPa) 𝐶𝑂𝑃𝑠𝑦𝑠𝑡𝑒𝑚 𝐶𝑂𝑃𝑐𝑦𝑐𝑙𝑒 𝑇𝑐𝑤 (∘C)
1980.57 0.99 250.52 0.85 300.46 0.75 35
2320.59 1.02 250.53 0.88 300.47 0.77 35
2700.6 1.03 250.54 0.89 300.48 0.79 35
Given these findings, we note that
(i) The𝐶𝑂𝑃 increases with increasing generator temper-ature, 𝑇𝑔. For fixed 𝑇𝑔, it decreases with decreasingcooling water temperature.
(ii) The 𝐶𝑂𝑃𝑐𝑦𝑐𝑙𝑒 reaches values ranging from 0.4 to 1.03,reaching the performances of double- effect absorp-tion cycles, thus larger than what can be obtained incase conventional single-effect without ejector [22].
(iii) The 𝐶𝑂𝑃𝑠𝑦𝑠𝑡𝑒𝑚 is almost half 𝐶𝑂𝑃𝑐𝑦𝑐𝑙𝑒 due to thelimited efficiency of the solar collector installation.Even in the case of favorable conditions, in grayhigh-lightened zone in Figure 4 and representing acommon situation in Tunisian summer, this efficiencyis ranging between 0.5 and 0.6.
(iv) It is observed that themaximum𝐶𝑂𝑃𝑐𝑦𝑐𝑙𝑒 (and conse-quently the 𝐶𝑂𝑃𝑠𝑦𝑠𝑡𝑒𝑚) attains higher values when thegenerator pressure is larger.Thehighest performancesare reached for the maximum generator temperatureconsidered in this study, 𝑇𝑔,𝑚𝑎𝑥 = 210∘C. Table 6summarizes these results. In fact, for minimal coolingmedium temperature (25∘C) and highest generatortemperature (210∘C), the 𝐶𝑂𝑃𝑐𝑦𝑐𝑙𝑒 = 0.99, 1.02, 1.03

Journal of Engineering 7
Generator pressure=198kPaChilled water at 7∘C
Tcw=25∘CTcw=30∘CTcw=35∘C
0.20.40.60.8
#/0=S
=F?
1.01.2
Tcw=25∘CTcw=30∘CTcw=35∘C
0.10.20.30.4
#/0MS
MN?G 0.5
0.60.7
180 190 200 210 220170Driving temperature (∘C)
(a)
Generator pressure=232kPa
0.20.40.60.81.01.2
#/0=S
=F?
Chilled water at 7∘C
Tcw=25∘CTcw=30∘CTcw=35∘C
Tcw=25∘CTcw=30∘CTcw=35∘C
180 190 200 210 220170Driving temperature (∘C)
0.10.20.30.4
#/0MS
MN?G 0.5
0.60.7
(b)
Generator pressure=270kPa
#/0=S
=F?
Chilled water at 7∘C
Tcw=25∘CTcw=30∘CTcw=35∘C
0.20.40.60.81.01.2
#/0MS
MN?G
Tcw=25∘CTcw=30∘CTcw=35∘C
0.10.20.30.40.50.60.7
180 190 200 210 220170Driving temperature (∘C)
(c)Figure 5: Effect of generator temperature on system performance for different generator pressures and cooling medium temperatures.
and the 𝐶𝑂𝑃𝑠𝑦𝑠𝑡𝑒𝑚 = 0.57, 0.59, 0.6 for generatorpressures at 198 kPa, 232 kPa, 272 kPa, respectively.It is noticed further that
(v) For a fixed generator pressure, the maximum 𝐶𝑂𝑃decreases when the temperature of the coolingmedium rises. So when the pressure in the generatoris at 198 kPa, the maximum 𝐶𝑂𝑃𝑐𝑦𝑐𝑙𝑒 = 0.99, 0.85, 0.75for cooling medium temperature, respectively, set at25∘C, 30∘C, 35∘C, with the corresponding values for𝐶𝑂𝑃𝑠𝑦𝑠𝑡𝑒𝑚 = 0.57, 0.52, 0.46.
(vi) The performances of cycle and system are optimalfor the highest generator pressure (270 kPa), lowestcooling medium temperature (25∘C), and largestchilled water temperature (12∘C).
5.2. Effect of Generator Temperature and Pressure on SystemPerformance (for Constant Cooling Medium Temperature).Similar simulations are run by maintaining constant thecooling medium temperature 𝑇𝑐𝑤 = 32
∘C and varying thechilled water temperature 𝑇𝑐. Figures 6(a), 6(b) and 6(c)present the evolution of 𝐶𝑂𝑃𝑐𝑦𝑐𝑙𝑒 and 𝐶𝑂𝑃𝑠𝑦𝑠𝑡𝑒𝑚 of the solar

8 Journal of Engineering
Generator pressure=198kPaCooling water at 32∘C
Tc=7∘CTc=10∘CTc=12∘C
Tc=7∘CTc=10∘CTc=12∘C
0.2
0.4
0.6
#/0=S
=F? 0.8
1.0
0.2
0.3
0.4
#/0MS
MN?G
0.5
0.6
180 190 200 210 220170Driving temperature (∘C)
(a)
Generator pressure=232kPaCooling water at 32∘C
Tc=7∘CTc=10∘CTc=12∘C
Tc=7∘CTc=10∘CTc=12∘C
0.2
0.4
0.6
#/0=S
=F?
0.8
1.0
0.1
0.2
0.3
0.4
0.5
#/0MS
MN?G
0.6
180 190 200 210 220170Driving temperature (∘C)
(b)
Generator pressure=270kPaCooling water at 32∘C
Tc=7∘CTc=10∘CTc=12∘C
Tc=7∘CTc=10∘CTc=12∘C
0.2
0.4
0.6
#/0=S
=F?
0.8
1.0
0.1
0.2
0.3
0.4
0.5
#/0MS
MN?G
0.6
180 190 200 210 220170Driving temperature (∘C)
(c)
Figure 6: Effect of generator temperature on system performance for different generator pressures and chilled water temperatures.
combined single-effect absorption refrigeration system forthree values of the generator pressure 198 kPa, 232 kPa, and272 kPa, respectively. It can be noted that
(i) Again, both 𝐶𝑂𝑃𝑐𝑦𝑐𝑙𝑒 and 𝐶𝑂𝑃𝑠𝑦𝑠𝑡𝑒𝑚 increase whenthe generator temperature is increased.
(ii) 𝐶𝑂𝑃𝑐𝑦𝑐𝑙𝑒 and 𝐶𝑂𝑃𝑠𝑦𝑠𝑡𝑒𝑚 increase with the driv-ing temperature, similarly to the behavior alreadyobserved in Figure 5. Table 7 gives the maximum of
cycle and system performances, when the drivingtemperature reaches its highest value, 210∘C. For𝑇𝑐 = 12∘C 𝐶𝑂𝑃𝑐𝑦𝑐𝑙𝑒 reaches 0.87, 0.91, and 0.95 forgenerator pressure 198 kPa, 232 kPa, and 270 kPa,respectively.
(iii) The performances of cycle and system (𝐶𝑂𝑃𝑐𝑦𝑐𝑙𝑒 andthe 𝐶𝑂𝑃𝑠𝑦𝑠𝑡𝑒𝑚 ) increase with increasing chilled watertemperature. For example, as shown in Table 7, forgenerator pressure equal to 270 kPa, the maximum
Journal of Engineering 9
Table 7: Maximum 𝐶𝑂𝑃 reached for solution generator temperature set at 210∘C (maximum considered) and 𝑇𝑐𝑤 = 32∘C.
𝑃𝑔𝑒𝑛𝑒𝑟𝑎𝑡𝑜𝑟(kPa) 𝐶𝑂𝑃𝑠𝑦𝑠𝑡𝑒𝑚 𝐶𝑂𝑃𝑐𝑦𝑐𝑙𝑒 𝑇𝑐 (∘C)
1980.50 0.81 70.52 0.85 100.53 0.87 12
2320.51 0.83 70.54 0.88 100.56 0.91 12
2720.51 0.84 70.55 0.91 100.58 0.95 12
July dayJuly day
200
300
400
500
600
700
800
900
1000
Glo
bal s
olar
irra
diat
ion
(W/G
2K)
0
10
20
30
40
50
Am
bien
t tem
pera
ture
(∘C)
10 12 14 16 188Local time
Figure 7: Evolution of solar radiation and ambient temperature ina typical summer day (July 16) in Tunis-Tunisia [18].
𝐶𝑂𝑃𝑐𝑦𝑐𝑙𝑒 = 0.84, 0.91, 0.95 for chilled water tem-perature, respectively, set at 7∘C, 10∘C, 12∘C, withcorresponding values for 𝐶𝑂𝑃𝑠𝑦𝑠𝑡𝑒𝑚 = 0.51, 0.55, 0.58.
(iv) 𝐶𝑂𝑃𝑠𝑦𝑠𝑡𝑒𝑚 is 60% lower than 𝐶𝑂𝑃𝑐𝑦𝑐𝑙𝑒. It rangesbetween 0.1 and 0.6, comparable with the results otherauthors [22, 23].
(v) When the cooling medium temperature is set at 32∘C,the performances of the cycle and the system reachtheir maximum at the highest pressure in the genera-tor (270 kPa) and for a chilled water temperature 𝑇𝑐 =12∘C.
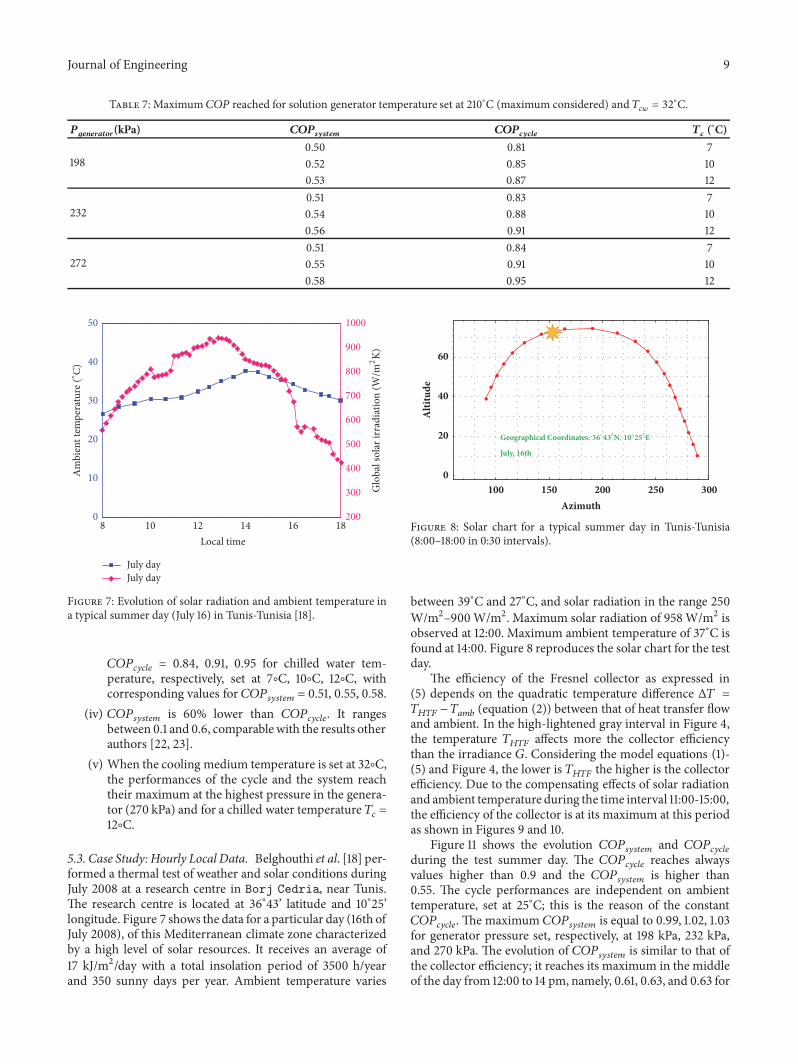
5.3. Case Study: Hourly Local Data. Belghouthi et al. [18] per-formed a thermal test of weather and solar conditions duringJuly 2008 at a research centre in Borj Cedria, near Tunis.The research centre is located at 36∘43’ latitude and 10∘25’longitude. Figure 7 shows the data for a particular day (16th ofJuly 2008), of this Mediterranean climate zone characterizedby a high level of solar resources. It receives an average of17 kJ/m2/day with a total insolation period of 3500 h/yearand 350 sunny days per year. Ambient temperature varies
100 150 200 250 300Azimuth
0
20
40
60
Alti
tude
Geographical Coordinates: ∘N, ∘E
July, 16th
Figure 8: Solar chart for a typical summer day in Tunis-Tunisia(8:00–18:00 in 0:30 intervals).
between 39∘C and 27∘C, and solar radiation in the range 250W/m2–900W/m2. Maximum solar radiation of 958W/m2 isobserved at 12:00. Maximum ambient temperature of 37∘C isfound at 14:00. Figure 8 reproduces the solar chart for the testday.
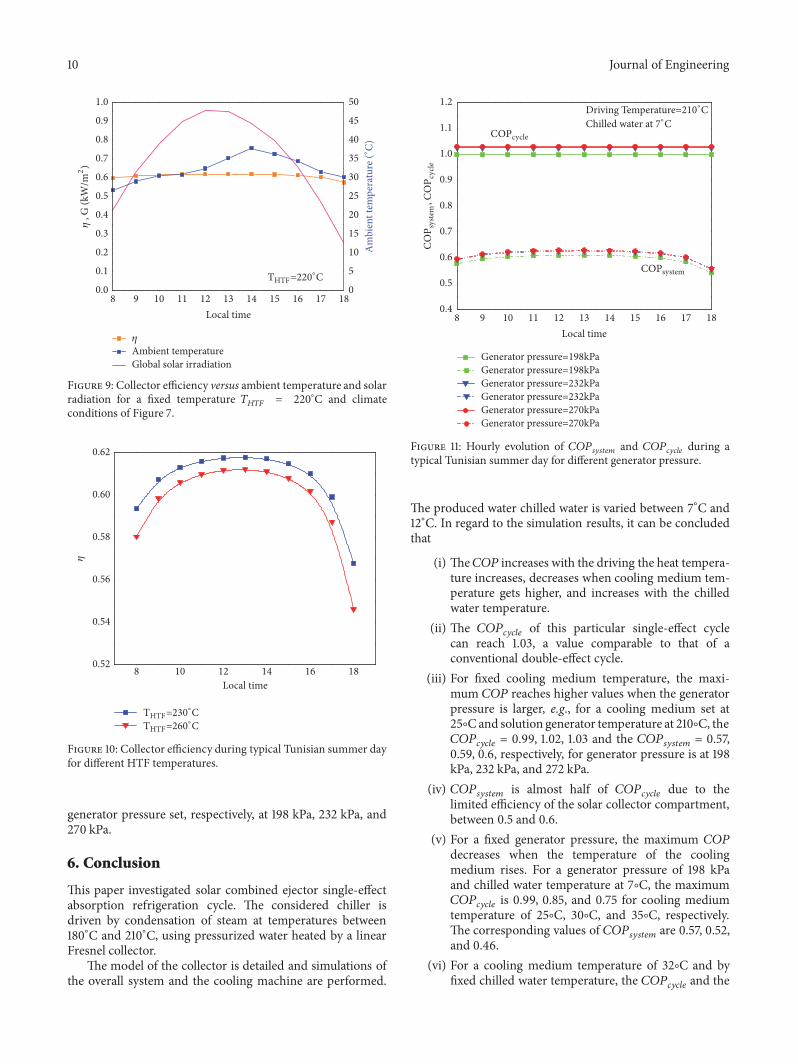
The efficiency of the Fresnel collector as expressed in(5) depends on the quadratic temperature difference Δ𝑇 =𝑇𝐻𝑇𝐹 − 𝑇𝑎𝑚𝑏 (equation (2)) between that of heat transfer flowand ambient. In the high-lightened gray interval in Figure 4,the temperature 𝑇𝐻𝑇𝐹 affects more the collector efficiencythan the irradiance 𝐺. Considering the model equations (1)-(5) and Figure 4, the lower is 𝑇𝐻𝑇𝐹 the higher is the collectorefficiency. Due to the compensating effects of solar radiationand ambient temperature during the time interval 11:00-15:00,the efficiency of the collector is at its maximum at this periodas shown in Figures 9 and 10.
Figure 11 shows the evolution 𝐶𝑂𝑃𝑠𝑦𝑠𝑡𝑒𝑚 and 𝐶𝑂𝑃𝑐𝑦𝑐𝑙𝑒during the test summer day. The 𝐶𝑂𝑃𝑐𝑦𝑐𝑙𝑒 reaches alwaysvalues higher than 0.9 and the 𝐶𝑂𝑃𝑠𝑦𝑠𝑡𝑒𝑚 is higher than0.55. The cycle performances are independent on ambienttemperature, set at 25∘C; this is the reason of the constant𝐶𝑂𝑃𝑐𝑦𝑐𝑙𝑒.Themaximum 𝐶𝑂𝑃𝑠𝑦𝑠𝑡𝑒𝑚 is equal to 0.99, 1.02, 1.03for generator pressure set, respectively, at 198 kPa, 232 kPa,and 270 kPa. The evolution of 𝐶𝑂𝑃𝑠𝑦𝑠𝑡𝑒𝑚 is similar to that ofthe collector efficiency; it reaches its maximum in the middleof the day from 12:00 to 14 pm, namely, 0.61, 0.63, and 0.63 for
10 Journal of Engineering
4(4&=220∘C
Ambient temperatureGlobal solar irradiation
0
5
10
15
20
25
30
35
40
45
50
Am
bien
t tem
pera
ture
(∘C)
0.0
0.1
0.2
0.3
0.4
0.5
0.6
0.7
0.8
0.9
1.0
, G (k
W/G
2)
9 10 11 12 13 14 15 16 17 188Local time
Figure 9: Collector efficiency versus ambient temperature and solarradiation for a fixed temperature 𝑇𝐻𝑇𝐹 = 220
∘C and climateconditions of Figure 7.
8 10 12 14 16 18Local time
4(4&=230∘C4(4&=260∘C
0.52
0.54
0.56
0.58
0.60
0.62
Figure 10: Collector efficiency during typical Tunisian summer dayfor different HTF temperatures.
generator pressure set, respectively, at 198 kPa, 232 kPa, and270 kPa.
6. Conclusion
This paper investigated solar combined ejector single-effectabsorption refrigeration cycle. The considered chiller isdriven by condensation of steam at temperatures between180∘C and 210∘C, using pressurized water heated by a linearFresnel collector.
The model of the collector is detailed and simulations ofthe overall system and the cooling machine are performed.
Generator pressure=198kPaGenerator pressure=198kPaGenerator pressure=232kPaGenerator pressure=232kPaGenerator pressure=270kPaGenerator pressure=270kPa
#/0=S=F?
#/0MSMN?G
Driving Temperature=210∘CChilled water at 7∘C
9 10 11 12 13 14 15 16 17 188Local time
0.4
0.5
0.6
0.7
0.8
0.9
1.0
1.1
1.2
#/0MS
MN?G
,#/0=S
=F?
Figure 11: Hourly evolution of 𝐶𝑂𝑃𝑠𝑦𝑠𝑡𝑒𝑚 and 𝐶𝑂𝑃𝑐𝑦𝑐𝑙𝑒 during atypical Tunisian summer day for different generator pressure.
The produced water chilled water is varied between 7∘C and12∘C. In regard to the simulation results, it can be concludedthat
(i) The𝐶𝑂𝑃 increases with the driving the heat tempera-ture increases, decreases when cooling medium tem-perature gets higher, and increases with the chilledwater temperature.
(ii) The 𝐶𝑂𝑃𝑐𝑦𝑐𝑙𝑒 of this particular single-effect cyclecan reach 1.03, a value comparable to that of aconventional double-effect cycle.
(iii) For fixed cooling medium temperature, the maxi-mum 𝐶𝑂𝑃 reaches higher values when the generatorpressure is larger, e.g., for a cooling medium set at25∘Cand solution generator temperature at 210∘C, the𝐶𝑂𝑃𝑐𝑦𝑐𝑙𝑒 = 0.99, 1.02, 1.03 and the 𝐶𝑂𝑃𝑠𝑦𝑠𝑡𝑒𝑚 = 0.57,0.59, 0.6, respectively, for generator pressure is at 198kPa, 232 kPa, and 272 kPa.
(iv) 𝐶𝑂𝑃𝑠𝑦𝑠𝑡𝑒𝑚 is almost half of 𝐶𝑂𝑃𝑐𝑦𝑐𝑙𝑒 due to thelimited efficiency of the solar collector compartment,between 0.5 and 0.6.
(v) For a fixed generator pressure, the maximum 𝐶𝑂𝑃decreases when the temperature of the coolingmedium rises. For a generator pressure of 198 kPaand chilled water temperature at 7∘C, the maximum𝐶𝑂𝑃𝑐𝑦𝑐𝑙𝑒 is 0.99, 0.85, and 0.75 for cooling mediumtemperature of 25∘C, 30∘C, and 35∘C, respectively.The corresponding values of 𝐶𝑂𝑃𝑠𝑦𝑠𝑡𝑒𝑚 are 0.57, 0.52,and 0.46.
(vi) For a cooling medium temperature of 32∘C and byfixed chilled water temperature, the 𝐶𝑂𝑃𝑐𝑦𝑐𝑙𝑒 and the

Journal of Engineering 11
𝐶𝑂𝑃𝑠𝑦𝑠𝑡𝑒𝑚 increase with the driving heat temperature,reaching a maximum for 𝑇𝑔 = 210∘C: 0.87, 0.91,and 0.95 for, respectively, 198 kPa, 232 kPa, and 270kPa generator pressure and at 12∘C chilled watertemperature.
(vii) The performances of cycle and system are optimal forthe highest generator pressure (270 kPa in this study)and chilled water temperature (12∘C).
A case study of a typical summer day is simulated; resultsshowed that
(i) The average efficiency of linear Fresnel collector con-sidered in the simulations varies between 0.6 and 0.62.
(ii) In the test period, 𝐶𝑂𝑃𝑐𝑦𝑐𝑙𝑒 reaches values alwayshigher than 0.9 and 𝐶𝑂𝑃𝑠𝑦𝑠𝑡𝑒𝑚 larger than 0.55. Thecycle performances are independent from ambienttemperature with a maximum equal to 0.99, 1.02, and1.03 for generator pressure, respectively, at 198 kPa,232 kPa, and 270 kPa.
(iii) The system performance evolves parallel to that ofthe collector efficiency, reaching its maximum in themiddle of the day from 12:00 to 14 pm.
Data Availability
Previously reported solar collector data used to supportthis study are available at [W. Christine, B. Michael, M.Florian, H. Alexander, N. Tomas, “Solar cooling withwater-ammonia absorption chillers and concentrating solarcollector-operational experience”, International Journal ofrefrigeration, vol. 39, pp. 57-76, 2014.].These prior studies anddatasets are cited at relevant places within the text as [17].Also the local metrological data were used to support thisstudy and are available at [M. Balghouthi, M. H. Chahbani,and A. Guizani, “Investigation of a solar cooling installationin Tunisia,” Applied Energy, vol. 98, pp. 138–148, 2012.].Theseprior studies and datasets are cited at relevant places withinthe text as [18].
Conflicts of Interest
The authors declare that they have no conflicts of interest.
References
[1] K. Kaygusuz, “Prospect of concentrating solar power in Turkey:the sustainable future,” Renewable & Sustainable EnergyReviews, vol. 15, no. 1, pp. 808–814, 2011.
[2] M. U. H. Joardder, P. K. Halder, A. Rahim, and N. Paul,“Solar Assisted Fast Pyrolysis: A Novel Approach of RenewableEnergy Production,” Journal of Engineering, vol. 2014, Article ID252848, 10 pages, 2014.
[3] F. J. Cabrera, A. Fernandez-Garcıa, R. M. P. Silva, and M.Perez-Garcıa, “Use of parabolic trough solar collectors for solarrefrigeration and air-conditioning applications,” Renewable &Sustainable Energy Reviews, vol. 20, pp. 103–118, 2013.
[4] S. BeerbaumandG.Weinrebe, “Solar thermal power generationin India - A techno-economic analysis,” Journal of RenewableEnergy, vol. 21, no. 2, pp. 153–174, 2000.
[5] G. Manzolini, M. Bellarmino, E. Macchi, and P. Silva, “Solarthermodynamic plants for cogenerative industrial applicationsin southern Europe,” Journal of Renewable Energy, vol. 36, no. 1,pp. 235–243, 2011.
[6] A. Maiorino andM. Valentini, “On the technical and economicfeasibility of a solar thermodynamic power plant in an area ofmedium–high direct sunlight intensity: an actual case study,”Journal of the Brazilian Society of Mechanical Sciences andEngineering, vol. 39, no. 1, pp. 245–257, 2016.
[7] K. Ajay and L. Kundan, “Combined Experimental and CFDInvestigation of the Parabolic Shaped Solar Collector UtilizingNanofluid (CuO-H2O and SiO2-H2O) as a Working Fluid,”Journal of Engineering, vol. 2016, Article ID 5729576, 10 pages,2016.
[8] O. Marc, G. Anies, F. Lucas, and J. Castaing-Lasvignottes,“Assessing performance and controlling operating conditionsof a solar driven absorption chiller using simplified numericalmodels,” Solar Energy, vol. 86, no. 9, pp. 2231–2239, 2012.
[9] G. A. Florides, S. A. Kalogirou, S. A. Tassou, and L. C. Wrobel,“Modelling and simulation of an absorption solar coolingsystem for Cyprus,” Solar Energy, vol. 72, no. 1, pp. 43–51, 2002.
[10] G. A. Florides, S. A. Kalogirou, S. A. Tassou, and L. C. Wrobel,“Modelling, simulation and warming impact assessment of adomestic-size absorption solar cooling system,” Applied Ther-mal Engineering, vol. 22, no. 12, pp. 1313–1325, 2002.
[11] A. Shirazi, R. A. Taylor, S. D.White, andG. L. Morrison, “Multi-effect absorption chillers powered by the sun: reality or areverie,” Energy Procedia, vol. 91, pp. 844–856, 2016.
[12] D. Chemisana, J. Lopez-Villada, A. Coronas, J. I. Rosell, and C.Lodi, “Building integration of concentrating systems for solarcooling applications,” Applied Thermal Engineering, vol. 50, no.2, pp. 1472–1479, 2013.
[13] H. Beltagy, D. Semmar, C. Lehaut, and N. Said, “Theoreticaland experimental performance analysis of a Fresnel type solarconcentrator,” Journal of Renewable Energy, vol. 101, pp. 782–793, 2017.
[14] P. Bermejo, F. J. Pino, and F. Rosa, “Solar absorption coolingplant in Seville,” Solar Energy, vol. 84, no. 8, pp. 1503–1512, 2010.
[15] D.-W. Sun, I. W. Eames, and S. Aphornratana, “Evaluation ofa novel combined ejector - Absorption refrigeration cycle - I:Computer simulation,” International Journal of Refrigeration,vol. 19, no. 3, pp. 172–180, 1996.
[16] S. Aphornratana and I. W. Eames, “Experimental investigationof a combined ejector-absorption refrigerator,” InternationalJournal of Energy Research, vol. 22, pp. 195–207, 1998.
[17] C. Weber, M. Berger, F. Mehling, A. Heinrich, and T. Nunez,“Solar cooling with water-ammonia absorption chillers andconcentrating solar collector - Operational experience,” Inter-national Journal of Refrigeration, vol. 39, pp. 57–76, 2014.
[18] M. Balghouthi, M. H. Chahbani, and A. Guizani, “Investigationof a solar cooling installation in Tunisia,” Applied Energy, vol.98, pp. 138–148, 2012.
[19] T. Sriveerakul, S. Aphornratana, and K. Chunnanond, “Perfor-mance prediction of steam ejector using computational fluiddynamics: Part 1. Validation of the CFD results,” InternationalJournal of Thermal Sciences, vol. 46, no. 8, pp. 812–822, 2007.
[20] S. A. Klein and F. Alvarado, Engineering equation solver, F–chartsoftware, Middletonm, Wis, USA.
[21] R. Fathi, C. Guemimi, and S. Ouaskit, “An irreversible ther-modynamic model for solar absorption refrigerator,” Journal ofRenewable Energy, vol. 29, no. 8, pp. 1349–1365, 2004.

12 Journal of Engineering
[22] R. Gomri, “Investigation of the potential of application of singleeffect and multiple effect absorption cooling systems,” EnergyConversion andManagement, vol. 51, no. 8, pp. 1629–1636, 2010.
[23] H. K. Ersoy, S. Yalcin, R. Yapici, andM. Ozgoren, “Performanceof a solar ejector cooling-system in the southern region ofTurkey,” Applied Energy, vol. 84, no. 9, pp. 971–983, 2007.

International Journal of
AerospaceEngineeringHindawiwww.hindawi.com Volume 2018
RoboticsJournal of
Hindawiwww.hindawi.com Volume 2018
Hindawiwww.hindawi.com Volume 2018
Active and Passive Electronic Components
VLSI Design
Hindawiwww.hindawi.com Volume 2018
Hindawiwww.hindawi.com Volume 2018
Shock and Vibration
Hindawiwww.hindawi.com Volume 2018
Civil EngineeringAdvances in
Acoustics and VibrationAdvances in
Hindawiwww.hindawi.com Volume 2018
Hindawiwww.hindawi.com Volume 2018
Electrical and Computer Engineering
Journal of
Advances inOptoElectronics
Hindawiwww.hindawi.com
Volume 2018
Hindawi Publishing Corporation http://www.hindawi.com Volume 2013Hindawiwww.hindawi.com
The Scientific World Journal
Volume 2018
Control Scienceand Engineering
Journal of
Hindawiwww.hindawi.com Volume 2018
Hindawiwww.hindawi.com
Journal ofEngineeringVolume 2018
SensorsJournal of
Hindawiwww.hindawi.com Volume 2018
International Journal of
RotatingMachinery
Hindawiwww.hindawi.com Volume 2018
Modelling &Simulationin EngineeringHindawiwww.hindawi.com Volume 2018
Hindawiwww.hindawi.com Volume 2018
Chemical EngineeringInternational Journal of Antennas and
Propagation
International Journal of
Hindawiwww.hindawi.com Volume 2018
Hindawiwww.hindawi.com Volume 2018
Navigation and Observation
International Journal of
Hindawi
www.hindawi.com Volume 2018
Advances in
Multimedia
Submit your manuscripts atwww.hindawi.com