Embed Size (px)
Citation preview

James Spelling1
Department of Energy Technology,
KTH Royal Institute of Technology,
Stockholm SE-100 44, Sweden
e-mail: [email protected]
Bj€orn LaumertDepartment of Energy Technology,
KTH Royal Institute of Technology,
Stockholm SE-100 44, Sweden
e-mail: [email protected]
Thermo-economic Evaluation ofSolar Thermal and PhotovoltaicHybridization Options forCombined-Cycle Power PlantsThe hybridization of combined-cycle power plants with solar energy is an attractivemeans of reducing carbon dioxide (CO2) emissions from gas-based power generation.However, the construction of the first generation of commercial hybrid power plants willpresent the designer with a large number of choices. To assist decision making, athermo-economic study has been performed for three different hybrid power plant config-urations, including both solar thermal and photovoltaic hybridization options. Solar pho-tovoltaic combined-cycle (SPVCC) power plants were shown to be able to integrate up to63% solar energy on an annual basis, whereas hybrid gas turbine combined-cycle(HGTCC) systems provide the lowest cost of solar electricity, with costs only 2.1% higherthan a reference, unmodified combined-cycle power plant. The integrated solarcombined-cycle (ISCC) configuration has been shown to be economically unattractive.[DOI: 10.1115/1.4028396]
1 Introduction
Combined-cycle gas turbine (CCGT) power plants are currentlythe power generation technology that offers the highest fuel-to-electric conversion efficiency, with modern power plants demon-strating efficiencies of 60% and above at design conditions [1].Furthermore, modern combined-cycle power plants are extremelyflexible, capable of reaching full load within 30 min during a hotstart and, once online, being run up or down at rates of around 5%of the installed capacity per minute [2]. This has led to CCGTsbecoming the dominant gas-based technology for intermediateand base-load power generation, currently representing between18% and 20% of worldwide electricity generation [3].
In recent years, growing concerns about anthropogenic climatechange have resulted in policy changes in the power generationsector and led to increased focus being placed on reducing CO2
emissions from electricity generation. While natural-gas firedCCGT power plants are one of the least carbon-intensive optionsavailable (with emissions from a modern power plant below 400kgco2
/MWhe [4]), ambitious emissions targets in the EuropeanUnion and other regions have led to a desire to further reduceemissions from CCGT power plants. Decreases in CO2 emissionsare directly linked to decreases in fuel consumption and, with fuelprices in Europe and Asia currently high [5], reductions in fuelburn will also serve to improve the economic viability of CCGTpower plants and hedge against future volatility in fuel prices.
At first glance, the simplest means to reduce emissions fromCCGT power plants would appear to be to continue to increasethe conversion efficiency of the fuel, which can be achievedthrough higher firing temperatures in the topping gas turbine unit.The historical evolution of the maximum temperature at the firstgas turbine stator row is shown in Fig. 1, and it can be seen that itis becoming progressively harder to increase the temperatures thatthe turbine blades can tolerate. The limits of even advanced mate-rials are beginning to be reached and blade cooling is consumingan ever greater fraction of the total airflow [6]. As such,
alternative means to reduce CO2 emissions from CCGT unitsneed to be found.
One option is to move the focus away from the conversion effi-ciency and toward the heat source itself. If part, or all, of theenergy supplied to the CCGT power plant can be drawn from alow-carbon source, overall emissions from the unit can be dramat-ically reduced. Solar power has great potential to provide an alter-native energy source for CCGT power plants, especially in theMiddle East and North Africa, where solar resources are high andgas-based generation accounts for nearly 60% of the electricitysector [7]. The combination of reduced emissions, resulting fromthe substitution of solar energy for natural gas, and guaranteedcontrollable electricity production makes hybrid CCGT powerplants ideally suited to form the backbone of a future low-carbonelectricity system.
Integration of solar energy into CCGT power plants has beenstudied by a number of authors, including initial studies by Allaniet al. [8], Kribus et al. [9], and Kane et al. [10] and more recentstudies by Libby et al. [11] and Pihl et al. [12], all of whom high-lighted the economic and environmental potential of these hybridpower systems. However, despite the fact that there exist a widerange of different options for integrating solar energy into aCCGT power plant (as will be seen in Sec. 2), each of the studieslisted above focuses on a single configuration and no systematiccomparison of the different options has been carried out. Further-more, advances in the field of high temperature solar receivers[13], increases in the flexibility of CCGT units [1] and significantcost reductions in the field of thin-film solar panels [14] haveopened up new means of integrating solar energy into CCGTpower plants.
As such, the construction of commercial hybrid solar CCGTpower plants presents the designer with a large number of deci-sions, including choosing the means of solar integration and theoverall degree of solarization. In this paper, the tools of thermo-economic analysis are applied to examine the technical and eco-nomic performance of a number of different hybrid solar CCGTpower plant configurations and establish optimum design choicesin order to assist with decision making.
2 Hybrid Solar Combined-Cycle Power Plants
At the current time there are two dominant solar power technol-ogies on the international market. Solar photovoltaic systems
1Corresponding author.Contributed by the Electric Power Committee of ASME for publication in the
JOURNAL OF ENGINEERING FOR GAS TURBINES AND POWER. Manuscript received July 22,2014; final manuscript received July 23, 2014; published online October 7, 2014.Editor: David Wisler.
Journal of Engineering for Gas Turbines and Power MARCH 2015, Vol. 137 / 031801-1Copyright VC 2015 by ASME
Downloaded From: http://gasturbinespower.asmedigitalcollection.asme.org/ on 12/22/2014 Terms of Use: http://asme.org/terms

convert the sun’s energy directly into electricity, whereas concen-trating solar power systems use this energy to create a high-temperature heat source, which is then used to drive conventionalpower generation equipment.
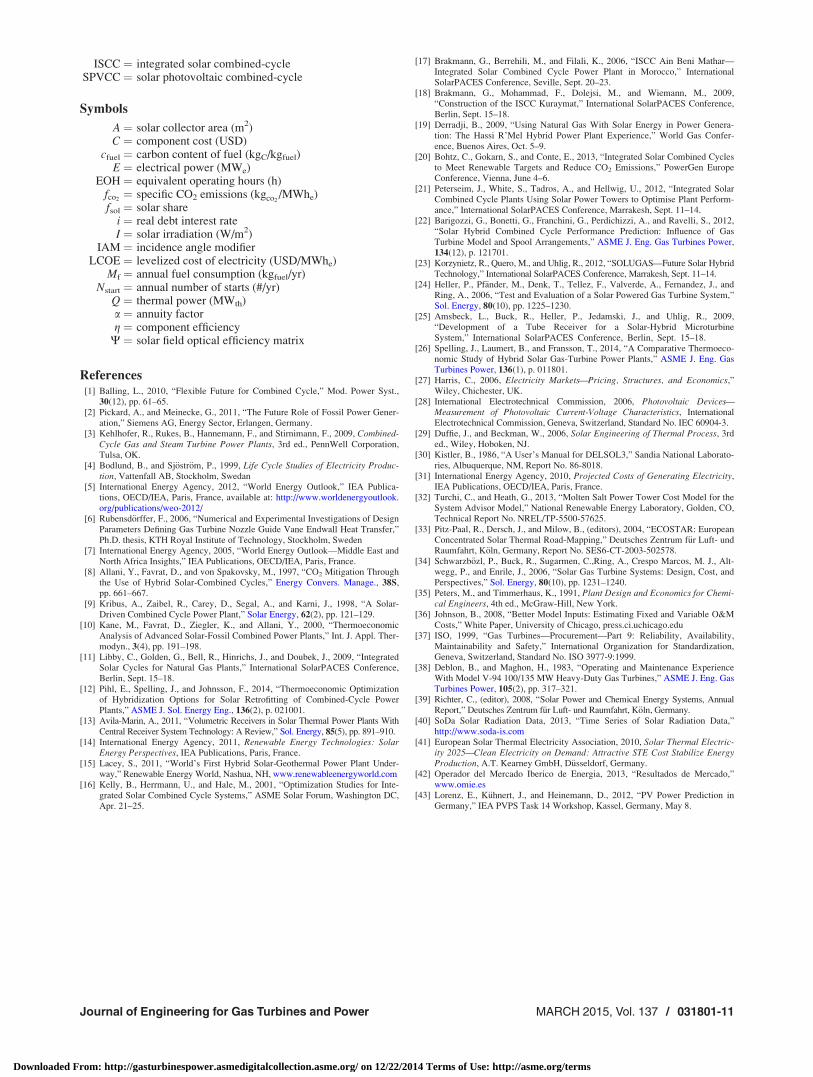
These two different solar power technologies give rise to threemain hybridization schemes for CCGT power plants. The simplestoption is to install a photovoltaic array alongside the CCGT unit;the electrical output of the photovoltaic array is then used toreplace part of the electrical output from the CCGT power plant.Alternatively, a concentrating solar collector can be used to con-vert the sun’s energy into heat, which is then inserted into eitherthe topping gas turbine or the bottoming steam cycle, dependingon the temperature at which the solar energy is harnessed. The so-lar heat input serves to replace part of the fuel input to the CCGTpower plant. These different hybridization options are summar-ized in Fig. 2 and are described in more detail in the followingsections.
2.1 The SPVCC. In a SPVCC power plant, a large photovol-taic array is installed alongside the CCGT power plant, and theflexibility of the CCGT unit is harnessed in order to compensatefor fluctuations in the variable solar output. When the photovoltaicarray produces electricity, the output of the CCGT is reduced inorder to maintain a constant overall output from the combinedsystem. The operation of an SPVCC power plant is shown inFig. 3 for two example days, one good day, and one intermittentday.
It can clearly be seen that the limiting factor for solar energyintegration in an SPVCC power plant is the minimum load of theCCGT unit. Given that the startup time of a contemporary CCGTis in the region of 30 min [2], the unit is not shut down during so-lar operation as it must be available to respond quickly to changes
in solar output in order to guarantee a constant overall output. Ifexcess solar electricity is produced, it is curtailed in order to main-tain the desired output.
At the current time, no SPVCC systems have been installedworldwide; instead, transmission lines are used to integrate photo-voltaic arrays with other power plants acting as backup. However,siting both systems at the same location simplifies control andoffers the possibility of sharing infrastructure and electrical inter-connection lines, reducing costs. This approach has been adoptedfor the 60 MW hybrid geothermal and photovoltaic power plant atStillwater, NV [15].
2.2 The ISCC. In an ISCC power plant, medium-temperaturesolar heat is introduced into the bottoming cycle of the CCGT,increasing steam production. During solar operation, this addi-tional steam increases the output of the steam turbine, and the top-ping gas turbine can be throttled back, reducing fuel consumptionwhile maintaining the desired power output from the CCGT, asshown in Fig. 4. The chief drawback is that an oversized steamturbine is required and, as such, whenever the ISCC operates with-out solar heat input (e.g., at night) the steam turbine operates atpart-load and, consequently, at a lower efficiency. Similarly, dur-ing solar hours, the topping gas turbine operates at part-load,again reducing the efficiency.
The ISCC is the most widely deployed hybrid solar CCGT sys-tem and the technical feasibility of the concept is well proven.
Fig. 2 Solar thermal and photovoltaic hybridization options forCCGT power plants
Fig. 3 Typical operation of an SPVCC power plant
Fig. 4 Typical operation of an ISCC power plant
Fig. 1 Historical evolution of gas turbine turbine entry temper-atures; data taken from Rubensd€orffer [6]
031801-2 / Vol. 137, MARCH 2015 Transactions of the ASME
Downloaded From: http://gasturbinespower.asmedigitalcollection.asme.org/ on 12/22/2014 Terms of Use: http://asme.org/terms

The first generation of ISCC power plants used heat from para-bolic trough solar collectors to generate saturated high-pressuresteam which was then mixed with conventionally generated steamin the high-pressure drum of the heat recovery steam generator[16]. Power plants of this type are operational in Morocco [17],Egypt [18], and Algeria [19], and range in size between 150 and470 MW. The next generation of ISCC power plants will likelyemploy solar tower (i.e., heliostat field) collectors with directsteam receivers [20], capable of generating high-temperaturesuperheated steam which can then be injected directly at the inletof the high-pressure steam turbine. This results in a higher solarconversion efficiency [21] and a more economically viable powerplant design; as such, only the solar tower configuration is consid-ered in this work.
However, regardless of the chosen integration scheme, theamount of solar energy that can be harnessed by an ISCC powerplant is limited by the spare capacity of the steam turbine. In orderto avoid large efficiency penalties for off-design operation, over-sizing of the steam turbine has been limited to 40% in existingpower plants, giving annual solar electricity fractions below 5%.As such, the degree of fuel saving achieved by ISCC power plantsis relatively small.
2.3 The HGTCC. In a HGTCC power plant, high-temperature solar heat is introduced into the topping gas turbineof the CCGT, directly replacing fuel. The most promisingapproach is to re-route the main airflow leaving the gas turbinecompressor and send it to a pressurized solar air receiver, wheresolar heat is added to the flow. As the solar heat is to be harnessedat high temperatures, heliostat field collectors are required in orderto ensure an acceptable efficiency of the receiver [14]. The pre-heated air produced by the solar receiver is then sent to the gas-turbine combustion chamber where fuel can be injected in orderto reach the desired final combustor outlet temperature. During so-lar operation, the increased temperature of the combustion inletair results in reduced fuel consumption, as shown in Fig. 5.
The performance of the topping gas turbine is penalized duringsolar operation, due to the additional pressure drops created by thereceiver, resulting in around a 1% reduction in efficiency [22]. Onthe other hand, this does not affect the performance of the bottom-ing cycle; after expansion, the exhaust gases from the hybrid gasturbine are ducted to a standard heat recovery steam generator andsteam cycle.
Given the large size of utility-scale CCGT power plants, thepower block will have to remain at the base of the tower, and hotgas piping used to duct the compressor air up and down the tower,as shown in Fig. 6. Material limits in the pipes have restricted cur-rent tower-mounted solar receivers to temperatures of around
800 �C [23]. Higher operating temperatures (up to 1200 �C [13])have been demonstrated in pilot facilities, but can only beachieved if the receiver and gas turbine form an integrated unit.The higher the temperature at which solar heat can be integratedinto the gas turbine, the greater the fraction of the fuel input thatcan be displaced by solar energy.
At the current time, no utility-scale HGTCC systems have beeninstalled, but a number of demonstration projects have establishedthe technical viability of the HGTCC concept. Early work onsmall-scale units was performed as part of the SOLGATE [24]and SOLHYCO [25] projects. Following the success of thesesmall-scale units, the ongoing SOLUGAS project [23] will scale-up the system to 4.6 MW. However, moving to even larger utility-scale plants is associated with significantly higher capitalexpenditure, which increases the perceived risk: an issue whichhas thus far dissuaded potential investors, despite the high poten-tial of HGTCC systems.
3 Solar Share of Electricity Production
In regions where incentive measures are in place to reward theproduction of carbon-free electricity, it is important to be able todetermine the share of solar electricity that is generated by ahybrid CCGT. In a correctly designed electricity market, hybridpower plants should only receive incentive payments for theelectricity that is actually produced from solar energy.
The method of determining the solar share fsol depends uponthe type of hybrid power plant that is under consideration. In thecase of the SPVCC power plant, the share of solar produced elec-tricity can be determined directly from the output of the CCGTunit ECCGT and the (noncurtailed) output of the solar photovoltaicarray EPV, using below equation:
fsol ¼_E�PV
_E�PV þ _E�CCGT
(1)
In the case of the ISCC and HGTCC power plants, it is not possi-ble to directly separate the solar-derived electricity from the fuel-derived electricity, and the solar share is instead calculated usingEq. (2), based on the solar heat and fuel inputs to the CCGT,denoted Qsol and Qfuel, respectively. As solar heat can be intro-duced into the CCGT system in different ways, it is also necessaryto take into account the efficiencies gsol and gfuel at which the solarheat and fuel inputs are converted to electricity, as a given quan-tity of solar heat will not necessarily displace the same quantity offuel if it is introduced at a different point in the power conversionprocess.
fsol ¼gsol � _Qþsol
gsol � _Qþsol þ gfuel � _Qþfuel
(2)Fig. 5 Typical operation of an HGTCC power plant
Fig.6 Solar integration into the topping gas turbine
Journal of Engineering for Gas Turbines and Power MARCH 2015, Vol. 137 / 031801-3
Downloaded From: http://gasturbinespower.asmedigitalcollection.asme.org/ on 12/22/2014 Terms of Use: http://asme.org/terms

It can be seen from Eq. (2) that there is a strong incentive to intro-duce solar heat into the power cycle at the highest temperaturepossible, as this will result in a higher conversion efficiency forthe solar energy, and thereby displace a greater quantity of fuel.As such, the HGTCC power plant has an intrinsic advantage overthe ISCC power plant, in that solar heat is added to the toppinggas turbine rather than bottoming steam cycle. Solar energy isthus converted to electricity at a higher efficiency and can displacea greater amount of fuel.
As the solar energy input is highly variable, it is important todistinguish between the nominal and annual values of the solarshare. The nominal solar share measures the degree of solarintegration at design conditions, when all the solar equipment isproducing its rated output. However, due to the variability of thesolar flux, operation of the hybrid CCGT power plant will changethroughout the year and the nominal solar share cannot be used todetermine the true distribution between solar-generated and fuel-generated electricity; an annualized value for the solar share mustbe used instead. As there are times when the sun will not be shin-ing, the annual solar share is always less than the nominal value.
A previous study by the authors [26] has shown that in the ab-sence of storage, efforts to increase the annual solar share above avalue of around 50% of the nominal solar share are usually uneco-nomical. Reaching very high annual solar shares requires the solarequipment to be oversized, resulting in very high investmentcosts, thus making the designs uncompetitive. Oversizing is nec-essary in order to increase the time during which the solar equip-ment produces at least nominal output. With oversized solarequipment, the delivered power reaches the required value fornominal operation earlier in the day, allowing the power plant tobe operated at full solar load for a longer duration. In this way thesolar share of the hybrid CCGT can be increased. However, in theabsence of a storage unit, the excess power above the nominaldemand cannot be harnessed and this surplus energy must bespilled from the system, either by curtailing the output of the pho-tovoltaic array or by spilling energy from the concentrating solarcollectors. As such, oversizing the solar equipment suffers fromrapidly diminishing returns.
4 Thermo-economic Modeling
The performance of the different hybrid CCGT conceptspresented in Sec. 2 has been analyzed using the in-house thermo-economics tool: DYESOPT (for DYnamic Energy Systems OPTi-miser). Thermo-economic analysis combines thermodynamic per-formance calculations with equipment cost predictions and
financing concepts; in this way both environmental and economicaspects can be taken into account and the correct compromiseselected to reflect society’s needs.
A basic flowsheet of the thermo-economic analysis process isshown in Fig. 7. Based on the parameters of the desired configura-tion, the nominal power plant design is first calculated and thepower plant equipment is sized. These values are then sent to atransient simulation routine where an entire year’s worth of opera-tion can be simulated, based on a given set of meteorological dataand the desired operating strategy for the power plant. Given thehigh variability of the solar resource over the year, annual simula-tion of the hybrid CCGT systems is essential in order to obtain arepresentative evaluation of their performance. Nominal pointdata are also used to determine the capital cost of the power plantequipment, and are combined with operating data to calculate theannual operation and maintenance costs. As output, the analysisprocess produces a series of thermo-economic performance indi-cators, such as investment costs, electricity costs, specific CO2
emissions, and many more. This modeling process is described inmore detail below.
4.1 Thermal Power Cycle Modeling. The models of thethermal power units (i.e., the topping gas turbine and bottomingsteam cycle) are based on the fixed and variable heat rate model[27], which distinguishes between the fixed heat that is required todrive the turbines at full speed and maintain synchronization withthe grid (at zero output) and the variable heat that is required toproduce power. As can be seen in Fig. 8, this model effectivelycaptures the efficiency penalty for operating the power cycles atpart-load conditions.
In numerical terms, the heat rate model can be expressed usingEq. (3), where Qþ is the heat input required to produce a givenelectrical output E�, and Enom is the nominal output of the powercycle
_Qþ ¼ A � _E�nom þ B � _E� (3)
The constants A and B are determined using Eq. (4), based on theefficiency of the power cycle at full load gnom and at 50% loadg50. Equation (3) is used to model both the topping gas turbineand bottoming steam cycle, with different values of the constantsA and B, based on the relevant efficiencies.
A ¼ 1
g50
� 1
gnom
and B ¼ 2
gnom
� 1
g50
(4)
Fig. 7 Flowsheet of the modeling strategy adopted in the thermo-economic analysis tool
031801-4 / Vol. 137, MARCH 2015 Transactions of the ASME
Downloaded From: http://gasturbinespower.asmedigitalcollection.asme.org/ on 12/22/2014 Terms of Use: http://asme.org/terms

In the basic CCGT configuration used in the SPVCC power plant,heat is supplied to the gas turbine in the form of fuel, while theheat input for the steam cycle is derived from the gas turbineexhaust. Applying the conservation of energy to Eq. (3), theexhaust heat Qexh produced by the gas turbine can be determinedusing below equation:
_Q�exh ¼ AGT � _E�nom þ BGT � 1ð Þ � _E�GT (5)
In the ISCC and HGTCC configurations, more than one heatsource is present, and the basic heat rate model needs to be modi-fied to take this into account. For the ISCC power plant, solar heatsupplements the gas turbine exhaust to drive the steam cycle, andthe output of the steam turbine can be determined using Eq. (6).For the HGTCC power plant, solar heat is combined with fuelinput to drive the gas turbine, the output of which can be deter-mined using Eq. (7). In this case, the constants AGT and BGT varyas a function of the solar heat input, in order to take into accountthe reduced efficiency of the gas turbine during solar operation(see Sec. 2.3). The output of the steam cycle is not affected by so-lar integration in the HGTCC case, and is calculated using thesame approach as the unmodified CCGT.
_E�ST ¼_Qþexh þ _Qþsol
� �� AST � _E�ST;nom
BST
(6)
_E�GT ¼_Qþfuel þ _Qþsol
� �� AGT � _E�GT;nom
BGT
(7)
Using the different the heat rate models presented above, therequired fuel input to the CCGT unit can be determined for thethree hybrid power plant configurations under study, as a functionof the required load and varying solar heat input. This fuelconsumption is then directly linked to the fuel costs and the envi-ronmental impact of the power plants.
4.2 Solar Power Equipment Modeling. In addition to themodel of the CCGT power cycles, separate performance modelsare required in order to determine the output of the solar equip-ment. The electrical output of the photovoltaic array in theSPVCC power plant can be determined using Eq. (8), where Enom
is the nominal output of the array under standard solar irradiationtest conditions ISTC (set as 1000 kW/m2 [28]) and It is the currenttotal solar irradiation. An incidence angle modifier (IAM) is usedto take into account the cosine losses [29] resulting from thechanging position of the sun (elevation aS and azimuth cS) relativeto the fixed orientation of the photovoltaic array.
_E�PV ¼ _E�nom �It
ISTC
� �� IAM aS; cSð Þ (8)
The solar heat input to the ISCC and HGTCC power plants can becalculated using Eq. (9), as a function of the installed solar collec-tor area Acol, the direct beam irradiation Ib, the thermal efficiencyof the solar receiver grec and a field efficiency matrix W, which
maps the solar position to a value of the overall optical efficiencyof the heliostat field. An in-house version of the DELSOL3 cell-wise field model [30] was used to calculate the field efficiencymatrix in this study.
_Qþsol ¼ Acol � Ib � grec �W aS; cSð Þ (9)
The electrical output of the photovoltaic array is used to set therequired load for the CCGT unit in the SPVCC; whereas for theISCC and HGTCC power plants, the heat input from the solar col-lector is used to determine the relative production of the gasturbines and steam turbines, and the required fuel consumption torun the power plant.
4.3 Cost Functions. The total overnight construction cost C0
for the hybrid CCGT power plant (i.e., neglecting interest duringconstruction) is calculated using Eq. (10), which takes intoaccount the cost of the CCGT power block CPB, including boththe gas turbine and the bottoming steam cycle, the cost of the solarequipment Csol, the cost of equipment installation Cinst, the costsassociated with engineering, procurement, and construction man-agement CEPCM as well as contingencies Ccont:
C0 ¼ CPB þ Csol þ Cinst þ CEPCM þ Ccont (10)
An overview of capital costs for the different power plant compo-nents is given in Table 1. Costs for the gas turbine and steamcycle, as well as the photovoltaic array, are based on data fromthe IEA [31]. Costs for the heliostat field collectors are based ondata from NREL [32]. Central tower and receiver costs for theISCC and HGTCC configurations are based on the ECOSTARreport [33] and the work of Schwarzb€ozl et al. [34].
Equipment installation costs are set at 15% of the initial capitalcosts, based on the recommendations of Peters and Timmerhaus[35], while the costs of engineering, procurement and constructionare set at 5% of the total installed cost, based on figures fromNREL [32]. Contingency requirements are estimated as 10% ofthe installed costs, based on IEA recommendations [31].
In addition to the upfront construction costs, it is also necessaryto determine the annual maintenance costs Cmnt for the hybridCCGT power plants. Maintenance costs are calculated using Eq.(11) and consist of the annual fixed and variable costs, Cfix andCvar, for the power plant equipment, as well as the annual cyclingcosts Ccycl, resulting from the startup and shutdown of the CCGTpower block
Cmnt ¼ Cfix þ Cvar þ Ccycl (11)
An overview of the fixed and variable maintenance costs for thedifferent power plant components is given Table 2; fixed costs arecapacity related (in USD/kWyr), while variable costs are produc-tion related (in USD/MWh). Maintenance costs were obtainedfrom the same sources as the capital costs, with the split betweenfixed and variable costs calculated based on the work of Johnson[36]. The optical equipment (photovoltaic array and heliostat fieldcollectors) is exposed to the weather, and thus requires
Table 1 Capital costs for the power plant components
Capital costs Value
Gas turbine power block 589 (USD/kWe)Steam cycle power block 1478 (USD/kWe)Photovoltaic array 2635 (USD/kWe)Heliostat field collectors 200 (USD/m2)ISCC tower and receiver 144 (USD/kWth)HGTCC tower and receiver 231 (USD/kWth)
Fig. 8 Fixed and variable heat rate model for thermal powercycle modeling
Journal of Engineering for Gas Turbines and Power MARCH 2015, Vol. 137 / 031801-5
Downloaded From: http://gasturbinespower.asmedigitalcollection.asme.org/ on 12/22/2014 Terms of Use: http://asme.org/terms
maintenance regardless of use; no variable costs are associatedwith these components.
Maintenance costs due to cycling can be determined for thepower block and receiver components using Eq. (12), based onthe equivalent operating hours approach [37]. The cost per start isassumed to be equal to the variable maintenance cost cvar multi-plied by an equivalent number of hours of full load operation(nominal electrical output in Eq. (12) should be replaced by nomi-nal thermal output when calculating cycling costs for the solar re-ceiver). The annual cycling cost is then obtained by summing thecost for all the starts within the year. The magnitude of the dam-age caused by each start depends on the nature of the start, withhot and warm starts resulting in less damage than cold starts.CCGT power plants generally operate in daily cycling mode,meaning that all starts are likely to be hot. The equivalent opera-tion hours per start (EOHs) for the CCGT unit can therefore beassumed to be 10 h [38].
Ccycl ¼XNstarts
cvar � _E�nom � EOHs (12)
4.4 Thermo-economic Performance Indicators. The costand performance figures from the models presented above can becombined to calculate a number of thermo-economic performanceindicators, which can then be used to evaluate the different hybridCCGT concepts. Two key performance indicators, the solar shareand the overnight cost, have been defined above. The additionalcost Cadd to hybridize the CCGT can be determined using Eq.(13), based on the cost of a reference, unmodified, CCGT powerplant (see Sec. 5.3)
Cadd ¼ C0 � C0;ref (13)
Upfront costs are generally less important than the levelized costof electricity (LCOE), defined as the minimum electricity saleprice which, over the lifetime of the power plant, generatesenough revenue to pay back the initial loan while covering theoperating and maintenance costs. The LCOE can be calculatedusing Eq. (14), where Cfuel is the annual fuel cost and Enet is thenet annual electricity production. The annuity factor a is calcu-lated using Eq. (15), based on the interest rate i and the powerplant operating lifetime nop. The additional factor fcon takes intoaccount interest accrued during construction of the power plant,and can be calculated using Eq. (16) as a function of the numberof years ncon required to build the power plant: the IEA gives anaverage construction time of 2 yr for natural-gas CCGT powerplants [31].
LCOE ¼ a � fcon � Cinv þ Cmnt þ Cfuel
Enet
(14)
a ¼ i � 1þ ið Þnop
1þ ið Þnop�1(15)
fcon ¼1þ ið Þncon�1
ncon � i(16)
Of further interest is the levelized cost of the solar-derived elec-tricity (LCOEsol), determined using Eq. (17) based on the price atwhich the solar electricity must be sold in order to be able to con-tinue to sell the remaining fossil-derived share of the electricity atthe same price (LCOEref) as an unmodified CCGT power plant(again, see Sec. 5.3)
LCOEsol ¼LCOE� 1� fsolð Þ � LCOEref
fsol
(17)
The specific CO2 emissions fCO2can be calculated using Eq. (18)
where Mfuel is the total mass of fuel burnt annually and cfuel is thecarbon content of the fuel
fCO2¼ 44
12�Mfuelcfuel
Enet
(18)
5 Thermo-economic Analysis
Having established a thermo-economic model of the hybridCCGT power plants, this model can now be used to analyze andcompare the different hybridization options.
5.1 System Specifications. In order to ensure a representativecomparison of the different hybrid CCGT technologies, all thethree power plant configurations are based around the same basicsystem specifications, shown in Tables 3 and 4. A minimumCCGT load of 40% was considered for the SPVCC power plant,based on the assumption of a single-unit CCGT power block [1].For the ISCC power plant, the steam cycle was assumed to 40%oversized, based on values from existing ISCC units [17,18].Finally, for the HGTCC power plant, a maximum receiver temper-ature of 800 �C was assumed, based on experience from theSOLUGAS project [23]. An efficiency penalty of 0.9% wasapplied to the topping gas turbine during solar operation, based onthe predictions of Barigozzi et al. [22]. These values translate intonominal solar shares of 60.0%, 10.7%, and 33.7% for the SPVCC,ISCC, and HGTCC power plants, respectively.
Furthermore, the thermo-economic performance of the differenthybrid CCGT power plants will depend on a number of meteoro-logical and economic boundary conditions. The power plants areall assumed to be located in southern Spain, at 37.2�N, with an an-nual DNI of 2136 kWh/m2yr [39]; radiation data was taken fromthe HelioClim3 service [40].
The financing parameters that affect the LCOE are taken from areport by the European Solar Thermal Electricity Association[41]. An interest rate of 7% was assumed, with an equipmentlifetime of 25 yr. A price of 40.1 USD/MWhth was assumed fornatural gas, based on recent figures from the IEA [5]. Natural gaswas assumed to be an 85-10-5 mixture of methane, ethane, andpropane, giving a lower heating value of 49.6 MJ/kg and a carboncontent of 75.8 wt.%.
A number of key performance indicators are based on the netelectricity production, which depends on the operation of thepower plant. In this study all the hybrid CCGT power plants are
Table 2 Maintenance costs for the power plant components
Maintenance costs Value
Gas turbine power block 27.7 (USD/kWeyr)0.93 (USD/MWhe)
Steam cycle power block 28.3 (USD/kWeyr)0.96 (USD/MWhe)
Photovoltaic array 12.2 (USD/kWeyr)Heliostat field collectors 1.1 (USD/m2yr)
ISCC tower and receiver 7.1 (USD/kWthyr)0.42 (USD/MWhth)
HGTCC tower and receiver 11.4 (USD/kWthyr)0.68 (USD/MWhth)
Table 3 Basic hybrid CCGT system specifications
System specifications Value
Nominal power plant output 150 (MWe)Combined-cycle nominal efficiency 55.4 (%)Minimum CCGT load 40 (%)ISCC steam-turbine oversizing 40 (%)HGTCC receiver max. temperature 800 (�C)HGTCC gas turbine efficiency drop 0.9 (%)
031801-6 / Vol. 137, MARCH 2015 Transactions of the ASME
Downloaded From: http://gasturbinespower.asmedigitalcollection.asme.org/ on 12/22/2014 Terms of Use: http://asme.org/terms

assumed to be operated at full load between 7 am and 11 pm,regardless of the solar irradiation conditions. This gives an annualcapacity factor of 67%, and matches well with the high-loadregion of the Spanish demand curve [42].
5.2 Design Parameters. Having established the standardparameters of the hybrid CCGT power plants under study, it isnecessary to define the design parameters that will be varied dur-ing the analysis. In this work, the main focus is placed on compar-ing the hybrid CCGT configurations at different degrees of solarintegration and, as such, the main design parameters concern thesizing of the solar equipment. For the SPVCC power plant, it isthe installed capacity of the photovoltaic array that is varied,whereas for the ISCC and HGTCC power plants it is the heliostatfield size.
5.3 Reference CCGT Power Plant. In order to put the per-formance of the hybrid CCGT power plants into perspective, areference case has been calculated, based on a standard, unmodi-fied CCGT power plant, and the results are shown in Table 5. Arelatively high LCOE of 96 USD/MWhe is obtained, due to thehigh natural gas cost.
5.4 Economic Performance. The first performance factorconsidered is the economic viability of the different hybrid CCGTconfigurations. The additional equipment cost required to achievea given degree of solar integration is shown in Fig. 9. As addi-tional solar equipment is installed, the annual solar share initiallyincreases linearly and then saturates above a certain level ofinvestment. This behavior results from the physical limitationimposed by the nominal solar share of the hybrid power plants.Even if an extremely large investment was made in solarequipment (in order to provide nominal solar output during allsun-hours) the maximum annual solar share cannot surpass thenominal solar share. In reality, the limit is lower than this as thepower plant operates at least partially at night. The SPVCC,ISCC, and HGTCC configurations achieve maximum annual solarshares of 38.8%, 8.3%, and 24.7% respectively, which representsbetween 65% and 75% of their nominal solar shares.
It can also be seen in Fig. 9 that modification of the power plantto give the ISCC and HGTCC configurations involves certainfixed costs, which are in the region of 229 and 257 USD/kWe,respectively. These fixed costs are for the construction of the cen-tral tower and receiver; additionally, in the ISCC case, theyinclude the oversized steam cycle equipment. As a result of these
fixed costs, at low annual solar shares (up to 3.5%) it is theSPVCC that can integrate solar energy at the lowest cost. How-ever, once the tower is built, the cost of increasing the solar shareof the HGTCC is much lower for the SPVCC, and at medium so-lar shares (between 3.5% and 22.8%) it is the HGTCC configura-tion that can integrate solar energy at the lowest cost. At annualhigh solar shares, the performance of the HGTCC is limited by itsrelatively low nominal solar share (33.7%, compared to 60.0% forthe SPVCC) and the SPVCC is again the cheapest option aboveannual solar shares of 22.8%. It can be seen in Fig. 9 that theISCC is a relatively unattractive option, as for the same cost itresults in a lower degree of solar integration that either theSPVCC or the HGTCC configurations.
The influence of solar integration on the cost of the electricitygenerated is shown in Fig. 10, both in terms of the overall LCOE(solid line) and the LCOE of the solar-derived electricity (dashed-line). For both the SPVCC and ISCC configurations, it can beseen that as the degree of solar integration increases, the overallLCOE of the power plant rises. Initially this increase is linear, butat higher solar shares the overall LCOE grows exponentially dueto the massive increase in the size (and thus cost) of the solarequipment needed to raise the solar share. For the HGTCC config-uration it can be seen that after an initial LCOE increase of 6USD/MWhe (resulting from the fixed equipment costs) the overallLCOE drops slightly to a minimum value of 98 USD/MWhe at anannual solar share of 17.4%, as the additional investment in solarfield equipment is more than compensated for by the reduced fuelconsumption.
Solar electricity costs from the SPVCC have a relatively con-stant value of 196 USD/MWhe across a wide range of annual solarshares (from 0% to 22.6%), as there are no fixed costs associatedwith installation of the photovoltaic array. At higher solar shares(above 22.6%), solar electricity costs rise exponentially as thefraction of the solar output that is curtailed increases. Solar
Table 4 Hybrid CCGT component efficiencies
Component efficiencies Value
Gas turbine efficiency Full-load 38 (%)Half-load 34 (%)
Steam cycle efficiency Full-load 28 (%)Half-load 26 (%)
ISCC receiver efficiency 84 (%)HGTCC receiver efficiency 78 (%)
Table 5 Reference CCGT power plant performance
Reference CCGT system Value
Gas turbine capacity 103 (MWe)Steam cycle capacity 47 (MWe)Overnight construction cost 1128 (USD/kWe)Net electricity production 876 (GWhe/yr)LCOE 95.9 (USD/MWhe)Specific CO2 emissions 415 (kgco2
/MWhe)
Fig. 9 Annual solar share as a function of the additionalinvestment in power plant equipment
Fig. 10 LCOE as a function of the annual solar share for thehybrid CCGT power plants
Journal of Engineering for Gas Turbines and Power MARCH 2015, Vol. 137 / 031801-7
Downloaded From: http://gasturbinespower.asmedigitalcollection.asme.org/ on 12/22/2014 Terms of Use: http://asme.org/terms

electricity costs from the ISCC and HGTCC power plants are veryhigh at low solar shares, as the fixed costs for hybridization aredistributed over a small amount of solar-derived electricity. Asthe annual solar share increases these fixed costs can be better dis-tributed and the solar LCOE drops, reaching minimum values of246 and 105 USD/MWhe at annual solar shares of 5.8% and17.4% for the ISCC and HGTCC power plants, respectively. Athigh solar shares, the solar LCOE from both configurationsincreases exponentially, as it becomes necessary to oversize thesolar collectors.
At low annual solar shares (below 4.8%) it is the SPVCC thatprovides the lowest-cost solar electricity. At medium solar shares(between 4.8% and 22.8%) it is the HGTCC that provides the low-est costs. At higher solar shares, the SPVCC is again the mostcost-effective, but even with this configuration, the solar LCOEincreases rapidly. Overall, the lowest cost solar electricity is pro-duced by a HGTCC power plant operating at an annual solar shareof 17.4%; solar electricity costs for this configuration are only9.5% higher than electricity from the reference CCGT.
5.5 Technical Performance. As the overall output of thehybrid CCGT power plant is fixed, the technical performance ofthe different configurations is evaluated in terms of efficiency andcapacity factor. The mean annual efficiency of the differentCCGT power blocks as a function of the annual solar share isshown in Fig. 11.
The efficiency of the power block in the SPVCC configurationdrops with increasing solar share, as the increased solar outputforces the CCGT to operate at part-load for longer periods oftime. In the HGTCC configuration, increased solar operation alsoreduces the efficiency of the CCGT power block, due to the effi-ciency penalty in the topping gas turbine caused by increasedoperation of the solar receiver. In the ISCC configuration, the effi-ciency of the power block is penalized even before solar heat isintegrated, due to the oversizing of the steam cycle, which resultsin part-load operation of the bottoming cycle even at nominalpower plant output. As the solar input increases, the power blockefficiency drops further, as heat is added directly to the bottomingcycle and less benefit can be drawn from the combined-cyclelayout.
Integration of solar energy into the hybrid power plant alsoinfluences the capacity factors of the power plant equipment, asshown in Fig. 12. In the SPVCC configuration, the capacity factorof the CCGT drops linearly with increasing annual solar share, asthe output of the photovoltaic array replaces output from theCCGT. The HGTCC configuration maintains a constant capacityfactor when additional solar heat is integrated as operation of thepower block is not influenced: fuel input is simply replaced by so-lar heat. The capacity factor of the HGTCC is slightly less thanthat of the reference CCGT power plant, as the topping gas-turbine needs to be slightly oversized in order to account for theefficiency penalty during solar operation. The ISCC configuration
suffers from an even greater reduction in capacity factor, due tothe oversized steam cycle. Overall, the ISCC maintains a constantcapacity factor as solar heat is added; however, if the gas turbineand steam cycle components are examined separately, it can beseen that there is a reduction in the capacity factor of the gas-turbine in order to allow the steam cycle to harness the additionalsolar heat input.
5.6 Environmental Performance. The environmental per-formance of the hybrid CCGTs is evaluated in terms of their spe-cific CO2 emissions, shown in Fig. 13. For all configurations, thespecific CO2 emissions decrease monotonically with increasingannual solar share, as solar energy supplants fuel consumption. Asthe SPVCC power plant can achieve the highest annual solarshares, it is this configuration than achieves the lowest level ofCO2 emissions (down to 268 kgco2
/MWhe), followed by theHGTCC (down to 316 kgco2
/MWhe) and the ISCC (down to385 kgco2
/MWhe). However, due to the efficiency penalties shownin Fig. 11, the true reduction in emissions is less than the theoreti-cal value for all the hybrid CCGT configurations. The initial pen-alty for the oversized steam cycle of the ISCC means that atannual solar shares below 1.2%, emissions from this configurationare higher than those of the reference CCGT power plant.
6 Technical Sensitivity Studies
The thermo-economic performance of the hybrid power plantconfigurations presented in Sec. 5 is dependent upon a number oftechnical hypotheses, and the limitations imposed by thesehypotheses will now be examined in more detail.
6.1 Operational Limitations. The key operational limitationpreventing the integration of more solar energy into the SPVCCpower plant is the need to maintain the CCGT unit online at alltimes in order to respond to changes in solar output. Solarresource prediction has improved dramatically in recent years,
Fig. 11 Mean annual CCGT power block efficiency as a func-tion of the annual solar share
Fig. 12 Annual capacity factors for the hybrid CCGT powerblock as a function of the annual solar share
Fig. 13 Specific CO2 emissions as a function of the annual so-lar share for the hybrid CCGT power plants
031801-8 / Vol. 137, MARCH 2015 Transactions of the ASME
Downloaded From: http://gasturbinespower.asmedigitalcollection.asme.org/ on 12/22/2014 Terms of Use: http://asme.org/terms

with 2 h predictions capable of being made with an error of lessthan 2.5% [43]. As such, on days with favorable solar irradiation,it is feasible to shut down the CCGT unit when the predicted out-put of the photovoltaic array exceeds the nominal capacity of thepower plant for more than the startup time of the CCGT unit, asshown in Fig. 14. As the startup time of the unit is less than theprediction horizon of the photovoltaic array, the power plant canbe restarted in time to guarantee the electrical output.
The influence of day-time shutdown operation of the SPVCCpower plant is shown in Fig. 15. No change occurs for annual so-lar shares below 29.3% as the installed capacity of the photovol-taic array is less than the nominal output of the CCGT unit, and assuch it must remain online at all times. At higher annual solarshares (above 29.3%), the ability to shut down the CCGT unitallows a significant reduction in the LCOE, as less output fromthe photovoltaic array needs to be curtailed. Furthermore, themaximum annual solar share that can be reached by the SPVCC isincreased, from 38.8% to 58.9%. However, these improvementsoccur in a region where the solar LCOE has already begun togrow exponentially, due to the oversized solar equipment. Assuch, the minimum cost of solar electricity from the SPVCC is notreduced, and remains more expensive than electricity from anHGTCC across a wide range of annual solar shares.
6.2 Technical Limitations. A number of the system specifi-cations shown in Table 3 are based on a conservative considera-tion of the current equipment available for hybrid solar powersystems. Near-term technology innovations may allow certainlimitations to be overcome.
The latest generation of CCGT equipment is characterized byincreased flexibility, with minimum stable loads down to 20%
achieved by certain configurations [1]. Advanced solar airreceivers, currently at the prototype stage, will allow solar heat tobe harnessed at temperatures up to 1200 �C [13] in the nextgeneration of HGTCC systems. These advances will increase thenominal solar share of the SPVCC and HGTCC power plants. Asimilar effect can be achieved in the ISCC power plant by increas-ing the degree of oversizing of the bottoming steam cycle, albeitat the cost of increased part-load operation of the CCGT system.The influence of changing these parameters on the overall LCOEof the hybrid CCGT power plants is shown in Fig. 16.
Lowering the minimum load of the CCGT unit reduces theneed to curtail output from the photovoltaic array, and thus allowsmore solar energy to be integrated into the SPVCC for the samecost. At 20% minimum load, the maximum annual solar share ofthe SPVCC is increased from 38.8% to 51.2%. A similar effect isobserved when installing larger steam-turbines in the ISCC powerplant, where the maximum annual solar share passes from 8.3% to19.9%. At the same time, however, the fixed costs for hybridiza-tion of the ISCC power plant rise from 229 to 554 USD/kWe dueto the increased size of the bottoming steam cycle. The greatestincrease in solar share is observed for the HGTCC, where theincrease in receiver temperature from 800 to 1200 �C increasesthe maximum annual solar share from 24.7% to 56.1%. However,the increase in fixed costs for the HGTCC power plant is alsohigher, as the central tower must be dimensioned to cope withoperation at 1200 �C; the fixed costs increase from 257 to 755USD/kWe.
6.3 Optimal Configurations. As a result of these fixed costincreases, there is a tradeoff between maintaining low electricitycosts at low solar shares and increasing the maximum solar sharethat can be reached by the power plant. The optimal solar receivertemperature or degree of steam-turbine oversizing is therefore not
Fig. 14 Day-time shutdown of an SPVCC power plant
Fig. 15 Influence of day-time shutdown on the LCOE
Fig. 16 Influence of changing technical limits on the overallLCOE of the hybrid CCGT power plants
Fig. 17 Optimal design parameters of the ISCC and HGTCCpower plant as a function of the annual solar share
Journal of Engineering for Gas Turbines and Power MARCH 2015, Vol. 137 / 031801-9
Downloaded From: http://gasturbinespower.asmedigitalcollection.asme.org/ on 12/22/2014 Terms of Use: http://asme.org/terms

constant, and varies with the desired annual solar share, as can beseen in Fig. 17. At low annual solar shares, low temperatures andturbine sizes are preferable, in order to keep the fixed costs to aminimum. As the desired solar share increases, these values areincreased, in order to allow more solar heat to be integrated intothe power plant. Once the upper limit is reached, the maximumnominal solar share has been achieved, and the only means toincrease the annual solar share is to oversize the solar collectorequipment, as was previously the case.
The performance of the hybrid CCGT power plants with theoptimally chosen parameters from Fig. 17 are shown in Fig. 18.Furthermore, for the SPVCC power plant, a flexible CCGT unitwith a minimum load of 20% was considered, operating in dailyshutdown mode (see Sec. 6.1).
The use of optimal design parameters allows the ISCC andHGTCC power plants to almost entirely avoid the fixed costincrease for hybridization. With the possibility to vary the receivertemperature and operate up to 1200 �C, the HGTCC configurationnow provides the lowest LCOE (both overall and solar) for annualsolar shares between 1.2% and 53.5%. The SPVCC remains theconfiguration able to reach the highest annual solar shares (up to63.2%), due to the ability to completely shut down the CCGT uniton days with good solar irradiation, when the output of the photo-voltaic array exceeds the nominal capacity of the power plant.
The cost of solar electricity from the HGTCC power plant isrelatively constant at annual solar shares between 6.9% and42.2%, with cost values between 105 and 110 USD/MWhe. Simi-larly, the solar LCOE of the SPVCC configuration is constant atannual solar shares up to 35.3%, although with a value of 196USD/MWhe it is only competitive with electricity from theHGTCC at annual solar shares below 1.2%. Even with optimallyselected design parameters, the ISCC configuration is unattractive,with solar electricity costing between 230 and 240 USD/MWhe atannual solar shares up to 13.3%, and increasing rapidly as thesolar share is increased further.
Overall, the optimal design is an HGTCC power plant, with anannual solar share of 18.9%, capable of generating solar electric-ity at a cost of 105 USD/MWhe. The overall LCOE of the HGTCCconfiguration is 98 USD/MWhe, an increase of only 2.1% com-pared to the reference, unmodified CCGT power plant. The solarreceiver of the optimal HGTCC configuration operates at atemperature of 820 �C, only slightly higher than the initial temper-ature limit specified in Table 3, making this design feasible withexisting technology.
7 Conclusions
Three different means of integrating solar energy into a CCGTpower plant have been analyzed using thermo-economic tools inorder to determine their relative performance and economic
viability. Solar energy can either be harnessed directed using aphotovoltaic array (in an SPVCC power plant) or converted toheat and integrated into the topping gas turbine (in an HGTCCpower plant) or the bottoming steam cycle (in an ISCC powerplant). All three designs were analyzed for a location in southernSpain (located at 37.2�N, with an annual DNI of 2136 kWh/m2yr)where natural-gas prices are relatively high (a value of 40.1 USD/MWhth was assumed).
The initial analysis was based on conservative values for theperformance and technical limits of the power plant equipment,and revealed that at low annual solar shares (below 4.8%) it is theSPVCC that provides the lowest-cost solar electricity, with a con-stant cost of 196 USD/MWhe. At medium solar shares (between4.8% and 22.8%) it is the HGTCC that provides the lowest costs,with a minimum solar electricity cost of 105 USD/MWhe at an an-nual solar share of 17.4%. At higher solar shares, the SPVCCagain becomes the most cost-effective configuration, but in thisregion the solar LCOE increases rapidly and no configuration iseconomically viable. The ISCC configuration suffers from an in-herent disadvantage in that solar heat is added only to thebottoming cycle of the CCGT unit. As more solar heat is inte-grated, the power plant shifts production towards the steam cycle,less benefit can be drawn from the combined-cycle arrangementand the overall efficiency of the power conversion drops.Combined with the need for an oversized steam-turbine, this has anegative impact on the cost of the electricity produced and theISCC configuration is more expensive than either the SPVCC orHGTCC configurations, regardless of the solar share.
A second analysis was also performed, examining the perform-ance of the hybrid CCGT power plants when the power plantcomponents are operated closer to their maximum feasible limits.This approach allowed the maximum degree of solar integrationto be increased, from 38.8% to 58.9% for the SPVCC, from24.7% to 56.1% for the HGTCC and from 8.3% to 19.9% for theISCC. With higher operating temperatures in the solar receiver,the HGTCC establishes itself as the dominant configuration acrossa wide range of annual solar shares, from 1.2% to 53.5%. Withoptimally selected parameters, the lowest cost of solar electricityis obtained by building a HGTCC power plant with an annual so-lar share of 18.9%, which generates solar electricity at a cost of105 USD/MWhe. Overall, the ISCC configuration was shown tobe unattractive, with solar electricity from an ISCC being moreexpensive than from the other configurations at all achievablesolar shares, even when optimal design parameters are considered.
Hybrid CCGT power plants appear to be an interesting meansof integrating solar power into the electricity grid in a controllablemanner, as well as an excellent solution for reducing CO2 emis-sions from traditional fossil-fuel fired CCGT power plants. Withsolar electricity costs from HGTCC power plants significantlylower than from conventional standalone solar power plants,hybrid technology has the potential to be a strong driver forgreater deployment of solar power, leading to increased capacity,lower costs and a reduction in our dependence on fossil-fuels.
Acknowledgment
This research has been funded by the Swedish Energy Agency,Siemens Industrial Turbomachinery AB, GKN Aerospace SwedenAB and the Royal Institute of Technology through the Swedishresearch program TURBO POWER, the support of which is grate-fully acknowledged. Additional funding for the development ofthe DYESOPT thermo-economics tool was received from the Eu-ropean Institute of Innovation and Technology through the KIC-Innoenergy TESCONSOL project.
Nomenclature
CCGT ¼ combined-cycle gas turbineHGTCC ¼ hybrid gas turbine combined-cycle
Fig. 18 Levelized electricity cost as a function of the annualsolar share for the hybrid CCGT power plants
031801-10 / Vol. 137, MARCH 2015 Transactions of the ASME
Downloaded From: http://gasturbinespower.asmedigitalcollection.asme.org/ on 12/22/2014 Terms of Use: http://asme.org/terms
ISCC ¼ integrated solar combined-cycleSPVCC ¼ solar photovoltaic combined-cycle
Symbols
A ¼ solar collector area (m2)C ¼ component cost (USD)
cfuel ¼ carbon content of fuel (kgC/kgfuel)E ¼ electrical power (MWe)
EOH ¼ equivalent operating hours (h)fco2¼ specific CO2 emissions (kgco2
/MWhe)fsol ¼ solar share
i ¼ real debt interest rateI ¼ solar irradiation (W/m2)
IAM ¼ incidence angle modifierLCOE ¼ levelized cost of electricity (USD/MWhe)
Mf ¼ annual fuel consumption (kgfuel/yr)Nstart ¼ annual number of starts (#/yr)
Q ¼ thermal power (MWth)a ¼ annuity factorg ¼ component efficiencyW ¼ solar field optical efficiency matrix
References[1] Balling, L., 2010, “Flexible Future for Combined Cycle,” Mod. Power Syst.,
30(12), pp. 61–65.[2] Pickard, A., and Meinecke, G., 2011, “The Future Role of Fossil Power Gener-
ation,” Siemens AG, Energy Sector, Erlangen, Germany.[3] Kehlhofer, R., Rukes, B., Hannemann, F., and Stirnimann, F., 2009, Combined-
Cycle Gas and Steam Turbine Power Plants, 3rd ed., PennWell Corporation,Tulsa, OK.
[4] Bodlund, B., and Sj€ostr€om, P., 1999, Life Cycle Studies of Electricity Produc-tion, Vattenfall AB, Stockholm, Swedan
[5] International Energy Agency, 2012, “World Energy Outlook,” IEA Publica-tions, OECD/IEA, Paris, France, available at: http://www.worldenergyoutlook.org/publications/weo-2012/
[6] Rubensd€orffer, F., 2006, “Numerical and Experimental Investigations of DesignParameters Defining Gas Turbine Nozzle Guide Vane Endwall Heat Transfer,”Ph.D. thesis, KTH Royal Institute of Technology, Stockholm, Sweden
[7] International Energy Agency, 2005, “World Energy Outlook—Middle East andNorth Africa Insights,” IEA Publications, OECD/IEA, Paris, France.
[8] Allani, Y., Favrat, D., and von Spakovsky, M., 1997, “CO2 Mitigation Throughthe Use of Hybrid Solar-Combined Cycles,” Energy Convers. Manage., 38S,pp. 661–667.
[9] Kribus, A., Zaibel, R., Carey, D., Segal, A., and Karni, J., 1998, “A Solar-Driven Combined Cycle Power Plant,” Solar Energy, 62(2), pp. 121–129.
[10] Kane, M., Favrat, D., Ziegler, K., and Allani, Y., 2000, “ThermoeconomicAnalysis of Advanced Solar-Fossil Combined Power Plants,” Int. J. Appl. Ther-modyn., 3(4), pp. 191–198.
[11] Libby, C., Golden, G., Bell, R., Hinrichs, J., and Doubek, J., 2009, “IntegratedSolar Cycles for Natural Gas Plants,” International SolarPACES Conference,Berlin, Sept. 15–18.
[12] Pihl, E., Spelling, J., and Johnsson, F., 2014, “Thermoeconomic Optimizationof Hybridization Options for Solar Retrofitting of Combined-Cycle PowerPlants,” ASME J. Sol. Energy Eng., 136(2), p. 021001.
[13] Avila-Marin, A., 2011, “Volumetric Receivers in Solar Thermal Power Plants WithCentral Receiver System Technology: A Review,” Sol. Energy, 85(5), pp. 891–910.
[14] International Energy Agency, 2011, Renewable Energy Technologies: SolarEnergy Perspectives, IEA Publications, Paris, France.
[15] Lacey, S., 2011, “World’s First Hybrid Solar-Geothermal Power Plant Under-way,” Renewable Energy World, Nashua, NH, www.renewableenergyworld.com
[16] Kelly, B., Herrmann, U., and Hale, M., 2001, “Optimization Studies for Inte-grated Solar Combined Cycle Systems,” ASME Solar Forum, Washington DC,Apr. 21–25.
[17] Brakmann, G., Berrehili, M., and Filali, K., 2006, “ISCC Ain Beni Mathar—Integrated Solar Combined Cycle Power Plant in Morocco,” InternationalSolarPACES Conference, Seville, Sept. 20–23.
[18] Brakmann, G., Mohammad, F., Dolejsi, M., and Wiemann, M., 2009,“Construction of the ISCC Kuraymat,” International SolarPACES Conference,Berlin, Sept. 15–18.
[19] Derradji, B., 2009, “Using Natural Gas With Solar Energy in Power Genera-tion: The Hassi R’Mel Hybrid Power Plant Experience,” World Gas Confer-ence, Buenos Aires, Oct. 5–9.
[20] Bohtz, C., Gokarn, S., and Conte, E., 2013, “Integrated Solar Combined Cyclesto Meet Renewable Targets and Reduce CO2 Emissions,” PowerGen EuropeConference, Vienna, June 4–6.
[21] Peterseim, J., White, S., Tadros, A., and Hellwig, U., 2012, “Integrated SolarCombined Cycle Plants Using Solar Power Towers to Optimise Plant Perform-ance,” International SolarPACES Conference, Marrakesh, Sept. 11–14.
[22] Barigozzi, G., Bonetti, G., Franchini, G., Perdichizzi, A., and Ravelli, S., 2012,“Solar Hybrid Combined Cycle Performance Prediction: Influence of GasTurbine Model and Spool Arrangements,” ASME J. Eng. Gas Turbines Power,134(12), p. 121701.
[23] Korzynietz, R., Quero, M., and Uhlig, R., 2012, “SOLUGAS—Future Solar HybridTechnology,” International SolarPACES Conference, Marrakesh, Sept. 11–14.
[24] Heller, P., Pf€ander, M., Denk, T., Tellez, F., Valverde, A., Fernandez, J., andRing, A., 2006, “Test and Evaluation of a Solar Powered Gas Turbine System,”Sol. Energy, 80(10), pp. 1225–1230.
[25] Amsbeck, L., Buck, R., Heller, P., Jedamski, J., and Uhlig, R., 2009,“Development of a Tube Receiver for a Solar-Hybrid MicroturbineSystem,” International SolarPACES Conference, Berlin, Sept. 15–18.
[26] Spelling, J., Laumert, B., and Fransson, T., 2014, “A Comparative Thermoeco-nomic Study of Hybrid Solar Gas-Turbine Power Plants,” ASME J. Eng. GasTurbines Power, 136(1), p. 011801.
[27] Harris, C., 2006, Electricity Markets—Pricing, Structures, and Economics,”Wiley, Chichester, UK.
[28] International Electrotechnical Commission, 2006, Photovoltaic Devices—Measurement of Photovoltaic Current-Voltage Characteristics, InternationalElectrotechnical Commission, Geneva, Switzerland, Standard No. IEC 60904-3.
[29] Duffie, J., and Beckman, W., 2006, Solar Engineering of Thermal Process, 3rded., Wiley, Hoboken, NJ.
[30] Kistler, B., 1986, “A User’s Manual for DELSOL3,” Sandia National Laborato-ries, Albuquerque, NM, Report No. 86-8018.
[31] International Energy Agency, 2010, Projected Costs of Generating Electricity,IEA Publications, OECD/IEA, Paris, France.
[32] Turchi, C., and Heath, G., 2013, “Molten Salt Power Tower Cost Model for theSystem Advisor Model,” National Renewable Energy Laboratory, Golden, CO,Technical Report No. NREL/TP-5500-57625.
[33] Pitz-Paal, R., Dersch, J., and Milow, B., (editors), 2004, “ECOSTAR: EuropeanConcentrated Solar Thermal Road-Mapping,” Deutsches Zentrum f€ur Luft- undRaumfahrt, K€oln, Germany, Report No. SES6-CT-2003-502578.
[34] Schwarzb€ozl, P., Buck, R., Sugarmen, C.,Ring, A., Crespo Marcos, M. J., Alt-wegg, P., and Enrile, J., 2006, “Solar Gas Turbine Systems: Design, Cost, andPerspectives,” Sol. Energy, 80(10), pp. 1231–1240.
[35] Peters, M., and Timmerhaus, K., 1991, Plant Design and Economics for Chemi-cal Engineers, 4th ed., McGraw-Hill, New York.
[36] Johnson, B., 2008, “Better Model Inputs: Estimating Fixed and Variable O&MCosts,” White Paper, University of Chicago, press.ci.uchicago.edu
[37] ISO, 1999, “Gas Turbines—Procurement—Part 9: Reliability, Availability,Maintainability and Safety,” International Organization for Standardization,Geneva, Switzerland, Standard No. ISO 3977-9:1999.
[38] Deblon, B., and Maghon, H., 1983, “Operating and Maintenance ExperienceWith Model V-94 100/135 MW Heavy-Duty Gas Turbines,” ASME J. Eng. GasTurbines Power, 105(2), pp. 317–321.
[39] Richter, C., (editor), 2008, “Solar Power and Chemical Energy Systems, AnnualReport,” Deutsches Zentrum f€ur Luft- und Raumfahrt, K€oln, Germany.
[40] SoDa Solar Radiation Data, 2013, “Time Series of Solar Radiation Data,”http://www.soda-is.com
[41] European Solar Thermal Electricity Association, 2010, Solar Thermal Electric-ity 2025—Clean Electricity on Demand: Attractive STE Cost Stabilize EnergyProduction, A.T. Kearney GmbH, D€usseldorf, Germany.
[42] Operador del Mercado Iberico de Energia, 2013, “Resultados de Mercado,”www.omie.es
[43] Lorenz, E., K€uhnert, J., and Heinemann, D., 2012, “PV Power Prediction inGermany,” IEA PVPS Task 14 Workshop, Kassel, Germany, May 8.
Journal of Engineering for Gas Turbines and Power MARCH 2015, Vol. 137 / 031801-11
Downloaded From: http://gasturbinespower.asmedigitalcollection.asme.org/ on 12/22/2014 Terms of Use: http://asme.org/terms