Embed Size (px)
Citation preview

SANDIA REPORT SAND2006-5437 Unlimited Release Printed November 2006
Thermal Properties of PZT95/5(1.8Nb) and PSZT Ceramics Pin Yang, Chris DiAntonio, George R. Burns, David J. Corelis, and David F. Rae Prepared by Sandia National Laboratories Albuquerque, New Mexico 87185 and Livermore, California 94550 Sandia is a multiprogram laboratory operated by Sandia Corporation, a Lockheed Martin Company, for the United States Department of Energy’s National Nuclear Security Administration under Contract DE-AC04-94AL85000. Approved for public release; further dissemination unlimited.
Issued by Sandia National Laboratories, operated for the United States Department of Energy by Sandia Corporation. NOTICE: This report was prepared as an account of work sponsored by an agency of the United States Government. Neither the United States Government, nor any agency thereof, nor any of their employees, nor any of their contractors, subcontractors, or their employees, make any warranty, express or implied, or assume any legal liability or responsibility for the accuracy, completeness, or usefulness of any information, apparatus, product, or process disclosed, or represent that its use would not infringe privately owned rights. Reference herein to any specific commercial product, process, or service by trade name, trademark, manufacturer, or otherwise, does not necessarily constitute or imply its endorsement, recommendation, or favoring by the United States Government, any agency thereof, or any of their contractors or subcontractors. The views and opinions expressed herein do not necessarily state or reflect those of the United States Government, any agency thereof, or any of their contractors. Printed in the United States of America. This report has been reproduced directly from the best available copy. Available to DOE and DOE contractors from U.S. Department of Energy Office of Scientific and Technical Information P.O. Box 62 Oak Ridge, TN 37831 Telephone: (865) 576-8401 Facsimile: (865) 576-5728 E-Mail: [email protected] Online ordering: http://www.osti.gov/bridge Available to the public from U.S. Department of Commerce National Technical Information Service 5285 Port Royal Rd. Springfield, VA 22161 Telephone: (800) 553-6847 Facsimile: (703) 605-6900 E-Mail: [email protected] Online order: http://www.ntis.gov/help/ordermethods.asp?loc=7-4-0#online

SAND2006-5437Unlimited Release
Printed November 2006
Thermal Properties of PZT95/5(1.8Nb) and PSZT Ceramics
Pin Yang, Chris DiAntonio, and George R. Burns Ceramic and Glass Department
David F. Rae
Organic Materials Department
David J. Corelis Power Sources Component Development
Abstract Thermal properties of niobium-modified PZT95/5(1.8Nb) and PSZT ceramics
used for the ferroelectric power supply have been studied from -100 °C to 375°C. Within this temperature range, these materials exhibit ferroelectric-ferroelectric and ferroelectric-paraelectric phase transformations. The thermal expansion coefficient, heat capacity, and thermal diffusivity of different phases were measured. Thermal conductivity and Grüneisen constant were calculated at several selected temperatures between -60°C and 100°C. Results show that thermal properties of these two solid solutions are very similar. Phase transformations in these ceramics possess first order transformation characteristics including thermal hysteresis, transformational strain, and enthalpy change. The thermal strain in the high temperature rhombohedral phase region is extremely anisotropic. The heat capacity for both materials approaches to 3R (or 5.938 cal/(g-mole*K)) near room temperature. The thermal diffusivity and the thermal conductivity are quite low in comparison to common oxide ceramics, and are comparable to amorphous silicate glass. Furthermore, the thermal conductivity of these materials between -60°C and 100°C becomes independent of temperature and is sensitive to the structural phase transformation. These phenomena suggest that the phonon mean free path governing the thermal conductivity in this temperature range is limited by the lattice dimensions, which is in good agreement with calculated values. Effects of small compositional changes and density/porosity variations in these ceramics on their thermal properties are also discussed. The implications of these transformation characteristics and unusual thermal properties are important in guiding processing and handling procedures for these materials.

4

5
TABLE OF CONTENTS
Abstract ................................................................................................................................3
I. Introduction.................................................................................................................9 II. Experimental Procedure ...........................................................................................10 III. Results and Discussion ............................................................................................12
(A) Thermal expansion and phase transformation ................................................12 (B) Heat capacity and enthalpy .............................................................................14 (C) Thermal diffusivity and thermal conductivity ................................................16 (D) Grüneisen Constant .........................................................................................18
IV. Summary ..................................................................................................................19 Acknowledgement ............................................................................................................19 Appendix A – Heat Capacity of a Solid ............................................................................20 Appendix B – Lattice Spacing of Few Low Index Planes in PZT95/5(1.8Nb) Ceramic at Room Temperature..........................................................................................20
References .........................................................................................................................21

6
TABLE OF TABLES Table I. Basic Information for PZT95/5(1.8Nb) and PSZT Ceramics. ........................22 Table II. Coefficient of Thermal Expansion for PZT95/5(1.8Nb) and PSZT
Ceramics.
(A) PZT 95/5(1.8Nb) 15 micron Lucite (HF1251) ...............................................22 (B) PSZT HF6104 .................................................................................................23
Table III. Phase Transformation Temperature and Transformational Strain for
PZT95/5(1.8Nb) and PSZT Ceramics.
(A) PZT 95/5(1.8Nb) 15 micron Lucite (HF1251). ..............................................24 (B) PSZT HF6104 .................................................................................................24
Table IV.
(A) Heat Capacity for PZT95/5(1.8Nb) Ceramic. .................................................25 (B) Heat Capacity for PSZT HF6104 Ceramic. .....................................................28
Table V.
(A) The Constant-Pressure Heat Capacity for Different Phases in PZT95/5(1.8Nb) ceramic. ................................................................................31
(B) The Constant-Pressure Heat Capacity for Different Phases in PSZT Ceramic. ..........................................................................................................31
Table VI.
(A) Enthalpy Change Associated with Phase Transformation in PZT95/5(1.8Nb) Ceramic. ..............................................................................31
(B) Enthalpy Change Associated with Phase Transformation in PSZT Ceramic. ..........................................................................................................31
Table VII.
(A) Thermal Diffusivity and Thermal Conductivity for PZT95/5(1.8Nb) Ceramic at Different Temperatures. ...............................................................32
(B) Thermal Diffusivity and Thermal Conductivity for PSZT Ceramic at Different Temperatures. ..................................................................................32
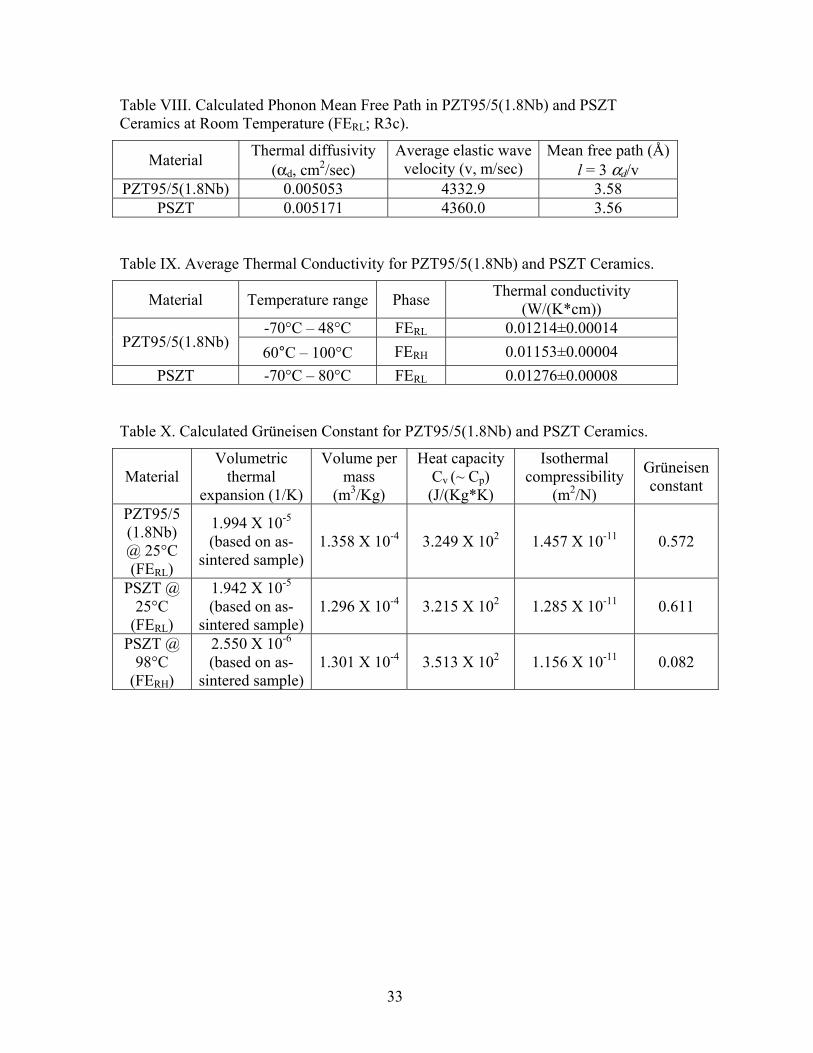
Table VIII. Calculated Phonon Mean Free Path in PZT95/5(1.8Nb) and PSZT
Ceramics at Room Temperature (FERL; R3c). ............................................................33 Table IX. Average Thermal Conductivity for PZT95/5(1.8Nb) and PSZT Ceramics. .....33 Table X. Calculated Grüneisen Constant for PZT95/5(1.8Nb) and PSZT Ceramics. ......33

7
TABLE OF FIGURES Figure 1. Thermal expansion behavior of PZT95/5(1.8Nb) ceramics during a heating
cycle. Thermal strains are reported for as-sintered sample (RN; black), as well as for parallel (PA; red) and perpendicular (PR; blue) to the spontaneous polarization direction [111]c. ................................................................................34
Figure 2. Thermal expansion behavior of PZT95/5(1.8Nb) ceramics during a cooling
cycle. Thermal strains are reported for as-sintered sample (RN; black), as well as for parallel (PA; red) and perpendicular (PR; blue) to the spontaneous polarization direction [111]c. ................................................................................34
Figure 3. Thermal expansion behavior of PSZT ceramics during a heating cycle.
Thermal strains are reported for as-sintered sample (RN; black), as well as for parallel (PA; red) and perpendicular (PR; blue) to the spontaneous polarization direction [111]c. ................................................................................35
Figure 4. Thermal expansion behavior of PSZT95/5 ceramics during a cooling cycle.
Thermal strains are reported for as-sintered sample (RN; black), as well as for parallel (PA; red) and perpendicular (PR; blue) to the spontaneous polarization direction [111]c. ................................................................................35
Figure 5. The constant pressure heat capacity of PZT95/5(1.8Nb) and PSZT ceramics
at different temperatures. The heat capacity of sapphire is used as a reference material for heat capacity calculation. ..................................................................36
Figure 6. Thermal diffusivity of PZT95/5(1.8Nb) and PSZT ceramics from -60°C to
100°C. Three measurements were made at each temperature. ............................36 Figure 7. Calculated thermal conductivity of PZT95/5(1.8Nb) and PSZT ceramics. ......37

8

9
I. Introduction The perovskites lead zirconate (PbZrO3) and lead titanate (PbTiO3) form a
continuous series of solid solutions over the entire composition range.1 The solid solutions, commonly referred to as PZTs or Pb(ZrxTi1-x)O3, are rich in variety of ferroelectric (FE) and non-ferroelectric transformations that can be induced by variations of composition, temperature, electric field,2,3 and pressure4 (stress). This is especially true for compositions near the phase boundary on the PZT temperature-composition phase diagram. This study focuses on the thermal properties of two solid solutions, i.e. niobium-modified PZT95/5(1.8Nb) (Pb0.9910(Zr0.958Ti0.0042)0.982Nb0.018O3) and tin-modified PSZT (Pb0.99(Sn0.13Zr0.82Ti0.05)0.98Nb0.02O3) ceramics. Both compositions are located on the zirconia-rich side of the PZT phase diagram1 near the phase boundary between FE and antiferroelectric (AFE) phases. Above the Curie temperature, the paraelectric phase (PE) for both compositions has the ideal cubic perovskite (Pm3m) structure. Upon cooling, this phase first transforms into a high-temperature rhombohedral symmetry R3m (FERH) and later transforms into a low-temperature rhombohedral symmetry R3c (FERL) which has a unit cell twice the size of the R3m phase. All of these phase transformations are known to be associated with lattice dynamical instabilities, or soft phonon modes. At room temperature, both compositions have the R3c symmetry. Under a high stress condition (a hydrostatic pressure or a shock-wave condition) the low temperature FE phase of these compositions can be mechanically-induced into an AFE phase5 (Pbam), and the bound charge stored on the electrodes can be released. Therefore, these ceramics can be used as a stand-by ferroelectric power supply.
Although PZT95/5(1.8Nb) and PSZT ceramics are used for their unique electrical properties, understanding their thermal properties is important to properly process and handle these ceramics because they experience several additional thermal excursions after sintering. For example, silver electrodes are commonly fired onto ceramics after grinding and slicing from large sintered billets. Hot poling is usually necessary to enable the piezoelectricity and the charge storage capabilities for ferroelectric ceramics. Other events include mounting materials for machining, thermal cleaning, and heat aging processes. In these processes, materials will experience heating and cooling cycles with several structural phase changes. These changes can exacerbate existing flaws in the material. Particularly, if these materials have a high thermal expansion and a low thermal conductivity, existing flaws will propagate when thermal shock is induced. Large transformational strains could also contribute to the raising of thermal mechanical stresses in the material. Therefore, unless these materials are properly handled it could significantly impact production yield and component reliability.
Thermal properties of a dielectric solid are governed by the thermal elastic vibration of atoms (or phonons) in the structure. Therefore, these properties in a crystalline material can be strongly affected by any vibrational anharmonicities induced by impurities, structural defects, different elements in the solid solution, and cooperative structural phase transformations. In addition, microstructure such as grain size, grain boundary and second phase, as well as porosity can play an

10
important role in the thermal properties since they can induce additional phonon scattering in the lattice. For PZT95/5(1.8Nb) and PSZT ceramics, both A- and B- sites in the perovskite lattice are occupied by different cations during solid solution formation, where A sites can be occupied by Pb+2 or Nb+5 and B sites can be filled with Zr+4, Ti+4, or Sn+4. Furthermore, substituting high valence niobium cations into a PZT solid solution creates oxygen vacancies in the lattice in order to maintain local charge neutrality. Therefore, the thermal properties of these ceramics can be influenced by compositional modifications, density, and soft mode phenomenon associated structural phase transformations. In this study, the thermal properties of these ceramics will be measured and compared with common oxide materials. Results will be discussed in terms of chemical modifications and the structural change during phase transformation from the perspective of fundamental solid state physics.
II. Experimental Procedure Coefficients of linear thermal expansion (CTE or αl) for PZT95/5(1.8Nb) and
PSZT ceramics were measured by a dilatometer (Netzsch, DIL 402C) equipped with a liquid nitrogen cooled stage, fused silica sample carrier and push rod. The thermal strain data was collected at a heating and cooling rate of 1°/min from -110 to 375°C as a function of poling direction. Some history of these samples such as high-fire numbers, electrical properties, pore former type, and density of these samples were tabulated in Table I. Samples used in these measurements were nominally 6.5 mm X 1 mm X 1 mm in size. Calibration against a fused silica standard and an alumina rod standard (25 mm in length) was performed before taking measurements. The sample was set in a single push-rod fused silica fixture with dry flowing nitrogen (50 cc/min) to prevent water condensation at sub-ambient temperatures. The measured thermal strains were corrected with the thermal expansion values of the fused silica fixture. For these electrically poled samples, temporary silver electrodes were painted onto the two opposite sides of each sample. Poling was performed at room temperature with field strength of 30 kV/cm in a Fluorinert bath (3M, FC-77). After poling, the temporary electrodes were stripped off by acetone rinsing and marked with a permanent marker thus established the poling direction. To prevent thermal depoling of these samples, all specimens were first cooled to -110°C and held for 20 minutes, then gradually heated to 375°C. Anisotropic thermal expansion parallel (PA) and transverse (or perpendicular (PR)) to the poled axis was also measured. CTE of different phases was determined by the slope of % of strain change versus temperature. The CTE values seem to be quite sensitive to temperature over the range of interest. A slight change in the measured temperature range can result in a large variation of CTE values. Based on thermal expansion measurements of as-sintered samples (RN) in the paraelectric phase region from PZT95/5(1.8Nb) and PSZT ceramics, where materials are free of domains and shape memory effects, the precision of the mean expansion coefficient is determined to be better than ±0.1 X 10-
6/°C. When there were obvious slope changes in one phase (e.g., FERL), multiple CTE data were reported for these temperature ranges. The CTE values were reported (Table II) at the most linear part of each phase region. Phase transformation temperature was defined at the onset of structural phase transformation. Because the transition temperature range from one phase to another can be large (especially for

11
the PE-FERH) and the slope of thermal strain progressively changes, it is difficult to report the transformational strains consistently. Based on the displacive nature of a first order phase transformation, we report the transformational strain from the onset to the end point of the second derivative of the thermal strain curve near a phase transformation event.
The heat capacities (Cp, or specific heat capacities) and enthalpies of different phases in PZT95/5(1.8Nb) and PSZT ceramics were determined by a differential scanning calorimeter (Netzsch, STA 409C). The heat flow as a function of time and temperature was recorded. The difference of heat flow between an empty pan and a pan loaded with sample is measured, which is proportional to the amount of heat necessary to increase the temperature of sample. Equipment was calibrated against two sapphire single crystals with different thicknesses before taking measurements. Thin disk samples of 0.5 mm thick and 5 mm in diameter were used for the calorimetric measurements. The sample was placed in the center of the cell and was in direct contact with the bottom of the test cell. Experiments were performed from -120°C to 320°C at a heating rate of 10°C/min with a flowing helium gas, and heat capacity values were reported from -50 to 300°C. The fast heating rate is necessary to enhance measurement sensitivity. Heat capacity was determined by a ratio method, using the heat capacity value of single crystal sapphire as a reference. The enthalpy change associated with phase transformation was calculated by the integration of heat capacity over the temperature range of a transformation event.
Thermal diffusivities (αd) of PZT95/5(1.8Nb) and PSZT ceramics were measured by a laser flash method (Anter Corporation, Pittsburgh, PA, Model 5000) at temperatures between -60°C to 100°C. In this measurement, the front surface of the sample is exposed to a short laser pulse. A thermocouple is used to record the temperature change as a function of time on the rear surface of the sample. Three sets of data were collected after temperature reached the set point and held for 5 minutes. Prior to the measurement, both the front and the back surfaces were coated with a thin gold film (usually less than 0.5 µm) and graphite to enhance optical absorption from the laser and provide a good electrical contact for the thermocouple. The thermocouple output was adjusted to offset the sample ambient temperature and display only the change in temperature as a function of time. This measurement gives quantitative information about how quick a body can change its temperature as heat moves from the front surface to the back surface. The thermal diffusivity increases with the ability of the body to conduct heat (i.e., thermal conductivity), and decreases with the amount of heat needed to change its temperature (i.e., heat capacity). The sample used in the laser flash measurement was a small thin disk about 0.5 in (12.7 mm) in diameter and a known thickness (0.49 mm or 0.97 mm). Several one dimensional thermal models were used to calculate the thermal diffusivity value based on the temperature rise as a function of time at the rear surface of the sample. To assure that the heat loss between the sample surfaces and its environment is accounted for, the experimental data was compared with the theoretical model corresponding to each diffusivity and estimation of heat loss. Our preliminary analyses suggested that the least square model seems to fit the general thermal behavior quite well, with reasonable flat residues between 0.05t and 0.9t (where t is the time required for the rear side of the sample to reach its maximum temperature).

12
The thermal conductivity (k) of these samples at different temperatures was than calculated from density (ρ, estimated from thermal expansion measurement from room temperature), specific heat capacity, and thermal diffusivity values based on the following relationship
k = αd(Τ) ρ(Τ) Cp(T) (1).
III. Results and Discussion (A) Thermal expansion and phase transformation
Thermal expansion of a crystalline solid comes from the anharmonic vibration of atoms about their mean position in the lattice. As a result, it is strongly dependent on the crystal structure and crystal orientation of the material. This is particularly important for ferroelectric materials where a spontaneous polarization (or dielectric dipole) is developed at the Curie point due to the change from high-symmetry, cubic PE phase to a low symmetry FE phase. As a result of this structural change, ferroelectric materials become anisotropic below their Curie temperature. However, in a polycrystalline ceramic body the transformation produces a multidomain configuration within each grain; thus the spontaneous orientation becomes randomly distributed through the sintered body. At a macroscopic level, these as-sintered materials behave isotropically. After being electrically poled, the polarization direction of individual domains in the FE ceramic is aligned in the field direction and gives anisotropic responses. This field-induced crystal orientation and anisotropic responses are lost after the material is heated above its Curie temperature (generally referred to as thermally depoling). Therefore, the anisotropic properties of an electrically-poled sample can be probed up to its Curie temperature on a heating cycle. On cooling, these anisotropic properties disappear since the samples have been thermally depoled. Considering these factors and the similarity of the structural phase changes in PZT95/5(1.8Nb) and PSZT ceramics, the thermal expansion behavior of these two solid solutions will be reported separately on heating and cooling cycles to minimize the redundancy. Specific CTE values at different temperature ranges are tabulated in Table II (A) and (B), and only general thermal mechanical responses are discussed in the text.
The thermomechanical responses for the PZT95/5(1.8Nb) and the PSZT ceramics during heating from -100°C to 375°C are given in Figure 1 and Figure 3, where strains developed for the as-sintered sample (or random polarization; RN), as well as for the parallel (PA) and the perpendicular (PR) directions to the poled axis (PE) are illustrated in black, red and blue colors, respectively. Two abrupt changes are evident on the thermal strain curves which corresponding to the transformational strains associated with the FERL-to-FERH and the FERH-to-PE phase transformations. Upon heating, these ceramics first transform from the FERL to the FERH phase, as indicated by the abrupt strain increase. Continuing heating, the FERH phase eventually transforms into the PE phase, with a strain decrease at the phase transformation. Results of CTE and transformation temperature for different phases are given in Table II and Table III, respectively. Data indicate that the general thermal expansion behavior for all these samples (RN, PA and PR) is quite similar in

13
the paraelectric phase, slightly different in the FERL phase, but is drastically different in the FERH phase. Particularly in the PA direction where the thermal strain progressively decreases as temperature increases. The average CTE values for the PZT95/5(1.8Nb) and the PSZT ceramics in the paraelectric phase are 7.475 X10⁻⁶/°C
and 7.742 X 10⁻⁶/°C, and in the FERL phase are 7.845 X 10⁻⁶/°C and 6.239 X10⁻⁶/°C, respectively. These values fall in to the typical values for oxide structures with dense packing of oxygen ions which is in the range of 6-8 X 10⁻⁶/°C near room temperature. In addition, the variations in CTE for the PZT95/5(1.8Nb) are greater than the PSZT ceramics. In the FERH phase region, the CTE ranged from a positive value in the PR direction to a lower positive value for the as-sintered sample, and to a negative value in the PA direction. The average of a positive CTE in the PE direction and a negative CTE in the PA direction leads to a near zero CTE value for the as-sintered samples. Because the spontaneous polarization in the FERH is coupled to the thermal strain in the poled axis,6 as temperature increases the spontaneous polarization progressively decreases and eventually diminishes at the Curie temperature. Concurrently, the strain decreases, resulting in a negative thermal expansion in this region. This negative thermal expansion is, therefore, a unique characteristic of the FERH phase, which has been confirmed to exist for other zirconia-rich compositions (without Nb modifications).1 In addition, the thermally stable phase range for the FERH phase in the PSZT (~97°C) is considerably smaller than the PZT95/5(1.8Nb) (~183°C); and the negative CTE for PSZT (-5.112 X 10⁻⁶/°C) in this phase region is greater than observed for PZT95/5(1.8Nb) ceramics (-3.345 X 10⁻⁶/°C). This suggests that the change of spontaneous polarization with respect to temperature in the PSZT could be greater than that in PZT95/5(1.8Nb) ceramics in the FERH region.
A sudden spike in the thermal strain is observed on heating during FERL-to-FERH in PZT95/5(1.8Nb) (see Figure 1) along the spontaneous polarization direction (PA). This observation was confirmed by additional experiments. Because of a short-range electrostatic interaction along the spontaneous polarization direction between Pb+2 cation and O-2 anions on adjacent cells, during cooling this interaction leads to a change in the spontaneous polarization direction from the thermal strain direction in the FERH phase ([111]c in a pseudocubic lattice setting) to the oxygen octahedral rotation in the FERL phase and results in a volume decrease upon phase transformation.6 Therefore, the observed behavior could be attributed to a rapid release of this short-range electrostatic interaction in the lattice as the small volume of FERL phase increases its volume on heating and suddenly transforms into a larger volume FERH phase.
In both PZT95/5(1.8Nb) and PSZT ceramics, a small kink in the thermal strain was observed in the PA and PE directions for the FERL phase. These kinks were not measurement induced, but are reproducible and appear to be intrinsic to these materials. Although fundamental reasons for these observed kinks are still not clear, the trend of a sudden decrease in the spontaneous direction (or PA) and an increase in its transverse direction (PE) is consistent with structural change in FERL phase under a pressure condition13 for PZT95/5(1.8Nb) ceramics. Results also show that transformational strains are greater parallel to the spontaneous polarization direction, and the largest transformational strain is observed at the FERH-to-PE phase transformation. On the average, transformational strains for the FERH-to-PE

14
transformation are greater than the FERL-to-FERH transformation, and these strains are greater for PZT95/5(1.8Nb) than PSZT ceramics. However, the greatest transformation strain was found at the FERH-to-PE phase transformation in PSZT ceramics, which is -1.509 X 10⁻³ and is almost 29% greater than that in the PZT95/5(1.8Nb) ceramics.
Figure 2 and Figure 4 show the thermal contraction behavior of PZT95/5(1.8Nb) and PSZT ceramics during the cooling cycle after samples were heated up to 375°C and held for 30 minutes. Results show that the differences in thermal mechanical responses during cooling for as-sintered (RN), PR and PA samples are small since now all the electrically poled ceramics had been thermally depoled after heating above their Curie temperature. This small variation in CTE values at different phase regions is shown by Figure 2 and Figure 4, as well as data in Table II (A) and (B). The variations of CTE in all phase regions are much greater for PA and PE samples than that for as-sintered sample, suggesting that even though the material has been heated above its Curie temperature a small shape memory effect is built in for ceramics that have been previously electrically poled. In general, the transformational strain for the PE-to-FERH is larger than that of the FERH-to-FERL (0.160 to 0.173 X10⁻³) in both PZT95/5(1.8Nb) and PSZT ceramics, and the magnitude of these transformational strains for PZT95/5(1.8Nb) is slightly (0.12-0.13 X 10⁻³) greater than the PSZT ceramics .
In additional to the transformational strain, small thermal hystereses of about 1 to 2 °C were observed during PE-to-FERH and FERH-to-FERL phase transformations (not shown in these Figures). These characteristics, together with a change of enthalpy during phase transformation indicate that the structural phase transformations for the PE-FERH and FERH-FERL are first order. Comparing the thermal strain induced in the -100°C to 375°C temperature range, the effect of transformational strain is much greater than the effect of the thermal expansion coefficient. Therefore, caution should be taken for processing and handling these materials in this temperature range to minimize unnecessary thermal stress in the materials. This is especially true after components have been electrically poled since the anisotropic thermal strain both from CTE and transformational strains are greater.
Based on the current results, chemical modification plays an important role in the phase transformation temperature. In addition, small variations in chemical composition can significantly change the thermal expansion coefficient and the magnitude of transformational strain in different phase regions. On the other hand, the effect of porosity on the thermal strain should be insignificant. The porosity does not contribute to the thermal strain, Therefore, small variations in the porosity content in these PZT ceramics should not change their thermal expansion behavior.
(B) Heat capacity and enthalpy
The heat capacity is the amount of thermal energy (or heat) required to raise the temperature of a unit mass (or one mole) to a specified amount (or one degree); therefore, its units are commonly expressed as J/(kg*K) or J/(mole*K). The thermal energy absorbed by the material corresponds to an increase in internal energy and this is accompanied by an increase in configurational entropy which contributes to (1) atomic vibrations (2) rotational energy if crystals having rotational degrees of

15
freedom, (3) raising the energy of electrons, and (4) changing atomic positions in the lattice. Therefore, heat capacity is not structure sensitive with regard to the crystal structure or ceramic microstructure, but it is extremely sensitive to a cooperative process such as structural phase transformations.
The quantum mechanical model treats the atomic vibration in a crystalline solid at extremely low temperatures as a cooperative phenomenon with a range of vibrational frequencies. Based on the quantum mechanical model, it predicts that the heat capacity (see Appendix A) of a solid increases rapidly and is proportional to T3 at low temperature. However, at high temperatures these cooperative vibrations break down and each atom in the lattice vibrates independently with respect to its neighboring atoms, and each atom with 3 degrees of freedom, so that the heat capacity approaches the classic kinetic limit of 3R (R is the gas constant), according to the Dulong and Petit rule.7 Therefore, when atoms in the lattice start behaving like independent simple harmonic oscillators, the heat capacity approaches 3R (or 5.96 cal/g-atom °C) and becomes less sensitive to temperature. The temperature at which the heat capacity approaches 3R or only slightly varying with temperature depends on the bond strength (or elastic constants), and melting point of the material and varies widely for different materials (or the Lindemann relationship).8 For example, the heat capacities of soft metals such as silver and copper become independent of temperature near room temperature (Deybe temperature for silver and copper is - 48°C and 70°C, respectively),9 while oxide ceramics such as alumina reaches a constant heat capacity around 1043°C,10 and strong covalently bonded diamond reaches this temperature at 1587°C.8 In this report, the heat capacity for PZT95/5(1.8Nb) and PSZT ceramics were measured between -100 °C to 300 °C (data reported from -50°C to 300°C), which is much higher than the operating temperature range for the quantum mechanical model. The measured heat capacity values for these ceramics are illustrated in Figure 5, and data are tabulated in Table IV (A) and (B). In this temperature range, common oxides such as MgO and Al2O3 have their heat capacities around 50% and 62% of 3R at -50°C, and around 82% and 90% of 3R at 300°C.11 Comparing these data with these ferroelectric ceramics, at -50°C both PZT95/5(1.8Nb) and PSZT reach 79.6% of 3R, while at 300°C PZT95/5(1.8Nb) reaches 94.8% and PSZT reach 95.8% of 3R, respectively. These observations are consistent with the lower elastic moduli of these ferroelectrics (116.0 - 130.0 GPa)12 in comparison with the structural ceramics such as MgO (172.3 GPa) and Al2O3 (365.4 GPa).11 Because the heat capacities for these ceramics (> 80% 3R) at this temperature range are far from the highly nonlinear region predicted by the quantum mechanical model, a simple linear empirical equation (Equation 2) is applicable to describe their heat capacity values,
Cp= a + b*T (2)
where a, and b are empirical constants. These constants are strictly empirical and do not have any physical significance. For convenience, the unit of heat capacity and temperature used in this equation is given by J/(g*K), and Kelvin, respectively. Results of these analyses are tabulated in Table V (A) and (B) for PZT95/5 (1.8Nb) and PSZT ceramics. Note the linear fitting at the PE phase in both systems is not in good agreement with collected data (R2 between 0.51 and 0.58) and there is a small anomaly near 25 °C; these features could be a systematic error collected during the

16
experiment which is also reflected on the reference curve (sapphire). By comparison the heat capacities between PZT95/5(1.8Nb) and PSZT ceramics (see Figure 5), the difference over a wide temperature range (for example for -100 to 300°C) for these ceramics is very small which immediately suggests that these solid solutions at the test temperature range must be already above their Debye temperatures (close to the classic 3R limit and become slightly linear with temperature). As a result, if there is a small variation in chemical composition in preparing these ceramics, the heat capacity values will not change significantly. In addition, the heat capacity for PZT95/5(1.8Nb) and PSZT ceramics near the FE-to-PE phase region are slightly greater than 3R (3.938 cal/(g-mole K)) suggesting that additional configuration entropy must be involved as indicated by large anharmonic lattice vibrations and strong anisotropic thermal expansion.
The enthalpy change associated with phase transformations in these ceramics was calculated by integrating the heat capacity over the transformation temperature range. On heating, two endothermic peaks were observed corresponding to the FERL-to-FERH and FERH-to-PE phase transformations. A linear fit for the baseline will be used for enthalpy calculation when heat capacities on both sides of the phase transformation are linear with respect to the temperature (e.g., the phase transformation between FERL and FERH). If a step change in heat capacities between two phases on both sides of a transformation event (e.g., the phase transformation between FERH and PE) occurs, a sigmoidal fit will be used for the enthalpy calculation. It was found that differences in the fitting model selection and the temperature range for a transformational event can lead to a maximum 0.2 J/(g*K) difference in enthalpy calculation. Using these criteria, the enthalpy changes associated with these phase transformations for PZT95/5(1.8Nb) and PSZT ceramics are summarized in Table VI. Results show that the enthalpy change associated with FERH-PE is always greater than that of FERL-FERH phase transformation in both PZT95/5(1.8Nb) and PSZT ceramics. A greater enthalpy change associated with the FERH-PE phase transformation is indicative of a larger transformational strain, as predicted by thermodynamics8 and as well as experimental data illustrated in Figure 1 and Figure 3.
The heat capacity, by definition, is the amount of thermal energy required to increase the temperature of an unit mass of a material; therefore, porosity which does not contribute to the total mass will play a minute role in changing the heat capacity value.
(C) Thermal diffusivity and thermal conductivity
The calculated thermal diffusivity and thermal conductivity for PZT95/5(1.8Nb) and PSZT ceramics are summarized respectively in Table VII(A), and Table VII(B) at temperatures ranging from -60°C to 100°C on a heating cycle, which only covers the FERL-to-FERH phase transformation. The results are re-plotted in Figure 6 and Figure 7 to illustrate the changes of these properties with respect to temperature. The thermal diffusivity and the thermal conductivity for these lead-based ferroelectric ceramics in this temperature range vary from 0.0046 to 0.0060 cm2/sec, and about 0.01240 W/(K*cm). At first glance, these values are relatively

17
low in comparison with most polycrystalline oxides, but are very close to those of heavily modified oxide solid solutions or amorphous silica.11 It is well known that lattice imperfections such as defects, solid solution, and impurities, as well as the strong anharmonicities in the spontaneous polarization direction can significantly enhance phonon-phonon interactions and dissipate the thermal elastic energy in the material; therefore, they can drastically reduce the thermal conductivity at low temperatures. However, at sufficiently high temperatures, generally far above the Debye temperature of the material (where Cv approaches 3R), the imperfection induced phonon scattering becomes independent of temperature. In this temperature range, the phonon mean free path decreases to a value near the lattice spacing, and the thermal conductivity is expected to be independent of temperature. Table VIII presents the calculated phonon mean free path in PZT95/5(1.8Nb) and PSZT ceramics, based on the elastic wave velocity measured in the longitudinal direction at room temperature.12 Again, these values (3.56 and 3.58 Å) are slightly smaller than the amorphous silica (~ 8 Å which is of the order of magnitude of the dimension of a silicon dioxide tetrahedron 7 Å), but much less than crystalline quartz (40 Å) and sodium chloride (23 Å) at room temperature. However, they are very close to the lattice spacing of low index planes in these lead based ceramics (~ 2.07215 to 4.14431 Å for PZT95/5(1.8Nb) ceramics at room temperature,13 see Appendix B). The thermal conductivity of these materials becomes relatively independent of temperature as predicted by the fundamental physics. The observation of such behavior in Figure 7 reassures that at temperatures above -60°C both ceramics are above their Debye temperatures as the data suggested in the previous (heat capacity) section. The average values of thermal conductivity for PZT95/5(1.8Nb) and PSZT ceramics at temperatures between -60 to 100 °C are calculated and given in Table IX. In addition, since the mean free path near room temperature is on the order of lattice spacing, the effect of microstructure such as grain size on thermal conductivity becomes insignificant.
Both thermal diffusivity and thermal conductivity data (illustrated in Figure 6 and Figure 7) show that these values for PSZT are generally greater than for PZT95/5(1.8Nb) and the difference in thermal conductivity slightly increases. This difference observed in the thermal conductivity can be attributed to the difference in density for these ceramics (Equation (1), where the densities of PZT95/5(1.8Nb) and PSZT are 7.36 and 7.72 g/cm3, respectively) since the heat capacities for these materials are very close (~ 3R). This observation immediately indicates the importance of density and/or porosity content in these ceramics on their thermal conductivity. When the theoretical density changes from 96.37% (PSZT) to 92.08% (PZT95/5(1.8Nb)), i.e., a 4.29% difference in density, the thermal diffusivity and the conductivity decrease 4.54% and 4.58%, respectively. Furthermore, Figure 6 shows that thermal diffusivity decreases with increasing temperature. In spite of the physics involved, mathematically when these values are multiplied by the constant volume heat capacity (ρCp (J/(K*cm3), Equation (1)) the linear increase in heat capacity with temperature compensates for the decrease in thermal diffusivity; therefore, it results in thermal conductivity that is relatively independent of temperature. Note, there is a slight shift in thermal diffusivity (change in slopes) and thermal conductivity (average values) near the FERL-to-FERH temperature at ~48°C and ~88°C for PZT95/5(1.8Nb) and PSZT ceramics. Apparently, these thermal properties are very sensitive to the

18
structural change in the crystalline materials. The thermal diffusivity anomaly (a drastic decrease) observed in PZT95/5(1.8Nb) ceramics at 48°C (see Figure 6) can be attributed to a large enthalpy change associated with a first order FERL-to-FERH phase transformation.
(D) Grüneisen constant
Grüneisen derived an important relation which relates the isothermal compressibility (βT), volumetric thermal expansion coefficient (αv ~ 3αl), and heat capacity (Cv) of a crystal through a temperature independent constant γ. The Grüneisen constant γ can be expressed as
vT
v
CV
βαγ = (3)
where V is the molar volume or volume per unit mass.8 The Grüneisen relationship is very useful for estimating the magnitude of a given thermodynamic quantity in equation (3) if values of the other three are know or can be estimated. Typically we know the molar volume for a substance. Above the Debye temperature Cv is about equal to 3R. Therefore, compressibility can be accurately estimated if αv is known, or vice versa. Using equation (3) and all the other thermodynamic values experimentally determined, the calculated Grüneisen constants for PZT95/5(1.8Nb) and PSZT ceramics are presented in Table X.
Thermodynamic relationships show that (αv/βT) = (∂p/∂T)v and Cv = (∂U/∂T)v, where p is the pressure and U is the total internal energy of the material, therefore equation (3) can be rewritten as
VV TpV
TU
⎟⎠⎞
⎜⎝⎛
∂∂=⎟
⎠⎞
⎜⎝⎛
∂∂γ (4).
This relationship indicates that under constant volume conditions the pressure change in the material due to a temperature variation from an external thermal excitation is correlated to the internal energy change through the Grüneisen constant. Therefore, the Grüneisen constant is an important coupling coefficient between the change of internal energy and the pressure (or mechanical stresses) development in the material due to a thermal stimulation. The Grüneisen constant for most metals is between one and two. The calculated values for both ceramics are 0.57 to 0.61 in the FERL phase region, which are relatively small in comparison with metals.8,14 Therefore, most thermal energy is assumed to increase the internal energy instead of coupling into the thermal stress near room temperature. From equation (4), it can also be seen that the Grüneisen constant should be independent of temperature. However, for most materials at lower temperatures, γ varies with temperature.15 In PZT95/5(1.8Nb) and PSZT ceramics, since the thermal compressibility does not change significantly with respect to different phases,12 the large variations in thermal expansion can lead to significant change in the Grüneisen constant (see Table X). Therefore, the drastic decreases in the Grüneisen constant for the FERH in the PSZT can be attributed to the low thermal expansion in the FERH phase region (see Table II).

19
From Equation (4), it is clear that the Grüneisen constant can only become negative when (∂p/∂T)v is negative. Since the thermal mechanical pressure generated under a constant volume condition, (∂p/∂T)v, is induced by the product of volumetric thermal expansion and bulk modulus, the Grüneisen constant becomes negative when there is a negative volume expansion on heating or a positive volume expansion on cooling. This behavior is especially pronounced upon the FERH-PE phase transformation (a large volumetric shrinkage on heating). Consequently, on this phase transformation, when the Grüneisen constant becomes negative, a hydrostatic tensile stress will develop in the ceramic bodies during heating cycle. The effect can cause serious damage in ceramic bodies since brittle fracture is much more sensitive to tensile stress.
V. Summary The thermal expansion behavior, heat capacity, and thermal diffusivity of
PZT95/5(1.8Nb) and PSZT ceramics were measured, and values of thermal conductivity and Grüneisen constant were calculated near room temperature. Results show that these ceramics possess a strong anisotropic thermal expansion behavior, a linear temperature dependent heat capacity, and a relatively low thermal conductivity in comparison to common oxide ceramics. The phase transformation temperature has a strong composition dependence but there is less effect on the heat capacity and thermal conductivity. A slight difference in porosity content can result in small variation in thermal conductivity. Implications of these results and impacts due to transformation behaviors on processing and handling of these ceramics have also been discussed.
Acknowledgement The authors would like to acknowledge Terry Aselage for many insightful
discussions on instrumentation and measurements and to express their thanks to the Active Ceramic Team for sample preparation. Funding provided by the Continuing Process Improvement program is greatly appreciated. Sandia is a multi-program laboratory operated by Sandia Corporation, a Lockheed Martin Company, for the United States Department of Energy’s National Nuclear Security Administration under Contract DE-AC04-94AL85000.

20
Appendix A – Heat capacity of a solid.
The experimentally determined heat capacity data (Cp) obtained from a thermal calorimetry measurement at constant pressure is related to a constant volume heat capacity (Cv) by the following relationship
βα VTcc v
vp
2
+= (4),
where αv is the volume thermal expansion coefficient (~2.1 X 10⁻⁵/K), V is the molar volume (~ 4.27 X 10⁻⁶ m3/mole), T is temperature (K), and β is compressibility (~ 1.29 to 1.46 X10⁻¹¹ m2/N) for PZT95/5(1.8Nb) and PSZT ceramics. As a result, the difference between Cp and Cv is negligible (~ 1.38 X 10⁻² J/(mole*K) or ~3.99 X10⁻⁵
J/(g*K)) and can be ignored. Therefore, Cp and Cv will be used interchangeably in discussion and are generally referred as heat capacity, unless rigor is required in the thermodynamic relationships. Strictly speaking, the heat capacity that follows the T3 relationship at low temperature is derived from a constant volume condition.
Appendix B – Lattice spacing of a few low index planes in PZT95/5(1.8Nb) ceramic at room temperature. Space group R3c (No. 161), hexagonal setting: a = 5.8486(4) Å, and c = 14.4171 Å.13
H K L d spacing (Å)
0 1 2 4.14431
1 0 4 2.93665
1 1 0 2.92432
1 1 3 2.49816
0 0 6 2.40285
2 0 2 2.38937
0 2 4 2.07215

21
References
1. B. Jaffe, W. R. Cook, Jr., and H. Jaffe, Piezoelectric Ceramics (Academic Press, New York 1971), Chapter 7.
2. W. Pan, Q. Zhang, A. Bhalla, and L. E. Cross, J. Am. Ceram. Soc., 72, 571 (1989).
3. P. Yang, and D. A. Payne, J. Appl. Phys., 71, 1361 (1992).
4. G. A. Samara, in High pressure Science and Technology, edited by K. D. Timmerhaus and M. S. Barber (Plenum Press, New York, 1979), Vol. 1, P. 177.
5. I. Fritz and J. Keck, J. Phys. Chem. Solids, 39, 1163 (1978).
6. P. Yang, M. A. Rodriguez, G. R. Burns, M. E. Stavig, and Roger H. Moore, J. Appl. Phys., 95, 3626 (2004).
7. F. Daniels, and R. A. Alberty, Physical Chemistry (John Wiley & Sons, Inc., 4th Edition, , New York 1975), Chapter 1.
8. R. A, Swalin, Thermodynamics of Solids (John Wiley & Sons, Inc., 2nd Edition, New York 1972), Chapter 4.
9. C. Kittel, Introduction to Solid State Physics (John Wiley and Sons, Inc., 5th Edition, New York, 1976), Chapter 5, Table 1.
10. T. Goto, O. L. Anderson, I. Ohno, and S. Yamamto, J. of Geophysical Research, 94, B6, 7588 (1989).
11. W. D. Kingery, H. K. Bowen, D. R. Uhlmann, Introduction to Ceramics (John Wiley and Sons, Inc., 2nd Edition, New York, 1976), Chapter 12.
12. John H. Gieske, Sandia Internal Memorandum – “Elastic Property Measurements of PSZT HF6104 Versus Temperature from 22 to 130°C”, (2002); P. Yang, R. H. Moore, S. J. Lockwood, B. A. Tuttle, J. A. Voigt, T. W. Scofield, Sandia Report, SAND2003-3866; and B. A. Tuttle, P. Yang, J. H. Gieske, J. A. Voigt, T. W. Scofield, D. H. Zeuch, and W. R. Olson, J. Am. Ceram. Soc., 84, 1260 (2001).
13. M. Avdeev, J. D. Jorgensen, S. Short, G. A. Samara, E. L. Venturini, P. Yang, and B. Morosin, Phys. Rev. B, 73, 064105 (2006).
14. K. A. Gschneidner, Jr., Solid State Physics – Advances in Research and Applications, 16, 275 (1964).
15. D. F. Gibbons, Phys. Rev., 112, 136 (1958), and R.F. Carr et. al., Phil. Mag., 12, 157 (1965).

22
Table I. Basic Information for PZT95/5(1.8Nb) and PSZT Ceramics.
Material Lot ID Density (g/cm3)
Remanent Polarization
P(A)
(µC/cm2)
Coercive Field
P©
(kV/cm)
Depoling Pressure
Ph
(Ksi)
Charge Release
Qh
(µC/cm2)
Breakdown Strength
Vb
(kV/cm)
PZT95/5
(1.8Nb)
HF1251 TSP119 QE#5
Lot 51
(15 µm Lucite)
7.361 31.27 10.19 36.70 32.14 85.78
PSZT HF6104 7.719 32.80 11.78 - - -
Table II. Coefficient of Thermal Expansion for PZT95/5(1.8Nb) and PSZT Ceramics.
(A) PZT 95/5 (1.8Nb) 15 micron Lucite (HF1251) Thermal
cycle Description Temperature Range Phase CTE
(10-6/°C) -90°C – 40°C FERL 7.8710 -93°C – -38°C FERL 6.6469 -27°C – 41°C FERL 7.4907 88°C -163°C FERH 2.6089
As sintered (random)
275°C – 360°C PE 6.4168 -90°C – 40°C FERL 8.6438
-102 °C – -45°C FERL 8.4384 -30°C – 38°C FERL 8.3934 88°C -163°C FERH -3.3451
Parallel to the poled axis
275°C – 360°C PE 7.9019 -90°C – 40°C FERL 7.0210 -102°C – 35°C FERL 6.4781 -22°C – 41°C FERL 7.5189 88°C -163°C FERH 4.6361
Heating (1°C/min)
Perpendicular to the poled axis
275°C – 360°C PE 8.1051 350°C – 275°C PE 8.2175 138°C – 52°C FERH 3.2092 As sintered (random) 35°C – -98°C FERL 8.0760
350°C – 275°C PE 8.1408 138°C – 52°C FERH 2.9668 Parallel to the poled
axis 35°C – -98°C FERL 7.3292 350°C – 275°C PE 8.2478 138°C – 52°C FERH 3.2599
Cooling (1°C/min)
Perpendicular to the poled axis 35°C – -98°C FERL 8.1332
23
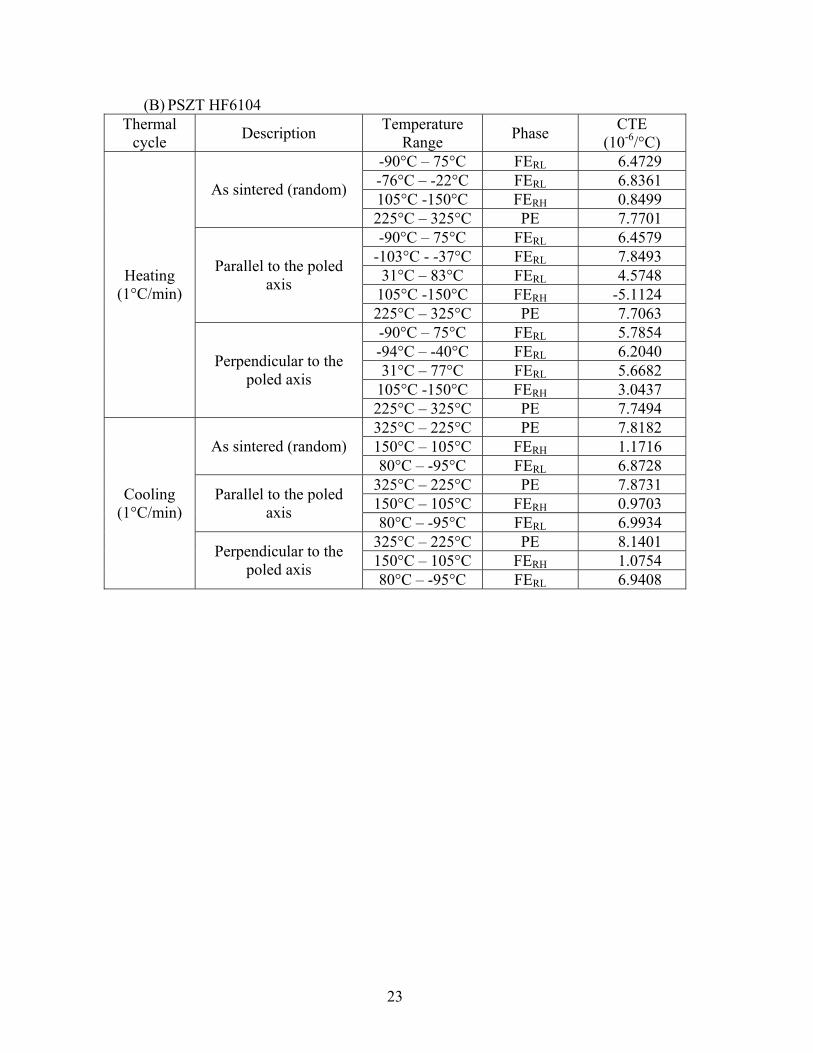
(B) PSZT HF6104 Thermal
cycle Description Temperature Range Phase CTE
(10-6/°C) -90°C – 75°C FERL 6.4729 -76°C – -22°C FERL 6.8361 105°C -150°C FERH 0.8499 As sintered (random)
225°C – 325°C PE 7.7701 -90°C – 75°C FERL 6.4579
-103°C - -37°C FERL 7.8493 31°C – 83°C FERL 4.5748
105°C -150°C FERH -5.1124
Parallel to the poled axis
225°C – 325°C PE 7.7063 -90°C – 75°C FERL 5.7854 -94°C – -40°C FERL 6.2040 31°C – 77°C FERL 5.6682
105°C -150°C FERH 3.0437
Heating (1°C/min)
Perpendicular to the poled axis
225°C – 325°C PE 7.7494 325°C – 225°C PE 7.8182 150°C – 105°C FERH 1.1716 As sintered (random) 80°C – -95°C FERL 6.8728
325°C – 225°C PE 7.8731 150°C – 105°C FERH 0.9703 Parallel to the poled
axis 80°C – -95°C FERL 6.9934 325°C – 225°C PE 8.1401 150°C – 105°C FERH 1.0754
Cooling (1°C/min)
Perpendicular to the poled axis 80°C – -95°C FERL 6.9408

24
Table III. Phase Transformation Temperature and Transformational Strain for PZT95/5(1.8Nb) and PSZT Ceramics.
(A) PZT 95/5 (1.8Nb) 15 micron Lucite (HF1251). Thermal
cycle Description Phase transformation
Transformation temperature
Transformation strain (10-3)
FERL - FERH 45.5°C 0.4890 As sintered (random) FERH - PE 228.2°C -0.7662
FERL - FERH 45.8°C 0.6323 Parallel to the poled axis FERH - PE 227.6°C -1.1741
FERL - FERH 45.1°C 0.2747
Heating (1°C/min)
Perpendicular to the poled axis FERH - PE 228.2°C -0.5706
PE - FERH 227.0°C 0.7204 As sintered FERH - FERL 46.5°C -0.5313 PE - FERH 227.4°C 0.6974 Parallel to the poled
axis FERH - FERL 46.4°C -0.5129 PE - FERH 227.1°C 0.6670
Cooling (1°C/min)
Perpendicular to the poled axis FERH - FERL 46.4°C -0.5208
(B) PSZT HF6104
Thermal cycle Description Phase
transformation Transformation
temperature Transformation
strain (10-3) FERL - FERH 88.3°C 0.3663 As sintered
(random) FERH - PE 185.8°C -0.5295 FERL - FERH 89.1°C 0.5081 Parallel to the poled
axis FERH - PE 186.2°C -1.5085 FERL - FERH 88.3°C 0.2958
Heating (1°C/min)
Perpendicular to the poled axis FERH - PE 187.5°C -0.3600
PE - FERH 184.9°C 0.5578 As sintered FERH - FERL 90.9°C -0.4046 PE - FERH 185.1°C 0.5811 Parallel to the poled
axis FERH - FERL 91.1°C -0.4028 PE - FERH 185.0°C 0.5651
Cooling (1°C/min)
Perpendicular to the poled axis FERH - FERL 90.8°C -0.4166

25
Tab le IV . (A ) H eat C ap acity fo r P ZT9 5 /5 (1 .8 N b ) C eramic .Tem p.
(°C ) C p (J/g*K )C p c a l/ (g -m ole*K )
Tem p. (°C ) C p (J/g*K )
C p c a l/ (g -m ole*K )
Tem p. (°C ) C p (J/g*K )
C p c a l/ (g -m ole*K )
-50.0 0.29054 4.74272 -1 .9 0.31356 5.11849 46.2 0.34696 5.66371-49.0 0.29098 4.74990 -0 .9 0.31367 5.12029 47.2 0.35909 5.86172-48.0 0.29186 4.76427 0 .1 0.31410 5.12731 48.2 0.37983 6.20027-47.0 0.29263 4.77684 1 .1 0.31434 5.13123 49.2 0.40421 6.59825-46.0 0.29335 4.78859 2 .1 0.31446 5.13319 50.2 0.41634 6.79626-45.0 0.29376 4.79528 3 .1 0.31434 5.13123 51.2 0.40868 6.67121-44.0 0.29427 4.80361 4 .1 0.31468 5.13678 52.2 0.39042 6.37314-43.0 0.29461 4.80916 5 .1 0.31496 5.14135 53.2 0.37256 6.08160-42.0 0.29480 4.81226 6 .1 0.31536 5.14788 54.2 0.35903 5.86074-41.0 0.29482 4.81259 7 .1 0.31588 5.15637 55.2 0.34963 5.70729-40.0 0.29489 4.81373 8 .1 0.31694 5.17367 56.2 0.34349 5.60707-39.0 0.29484 4.81291 9 .1 0.31854 5.19979 57.2 0.33910 5.53540-38.0 0.29499 4.81536 10 .1 0.31945 5.21464 58.2 0.33642 5.49166-37.0 0.29493 4.81438 11 .1 0.32047 5.23129 59.2 0.33450 5.46031-36.0 0.29461 4.80916 12 .1 0.32137 5.24598 60.2 0.33341 5.44252-35.0 0.29458 4.80867 13 .1 0.32114 5.24223 61.2 0.33304 5.43648-34.0 0.29376 4.79528 14 .1 0.32131 5.24500 62.2 0.33260 5.42930-33.0 0.29300 4.78288 15 .1 0.32154 5.24876 63.2 0.33222 5.42310-32.0 0.29289 4.78108 16 .1 0.32144 5.24713 64.2 0.33235 5.42522-31.0 0.29241 4.77325 17 .1 0.32132 5.24517 65.2 0.33200 5.41950-30.0 0.29246 4.77406 18 .1 0.32083 5.23717 66.2 0.33199 5.41934-29.0 0.29193 4.76541 19 .1 0.32073 5.23554 67.2 0.33238 5.42571-28.0 0.29176 4.76263 20 .1 0.32101 5.24011 68.2 0.33227 5.42391-27.0 0.29141 4.75692 21 .1 0.32134 5.24549 69.2 0.33223 5.42326-26.0 0.29108 4.75153 22 .1 0.32242 5.26312 70.2 0.33264 5.42995-25.0 0.29096 4.74958 23 .1 0.32361 5.28255 71.2 0.33318 5.43877-24.0 0.29205 4.76737 24 .1 0.32450 5.29708 72.2 0.33358 5.44530-23.0 0.29345 4.79022 25 .1 0.32494 5.30426 73.2 0.33415 5.45460-22.0 0.29485 4.81308 26 .1 0.32578 5.31797 74.2 0.33471 5.46374-21.0 0.29682 4.84523 27 .1 0.32643 5.32858 75.2 0.33534 5.47403-20.0 0.30161 4.92342 28 .1 0.32721 5.34131 76.2 0.33578 5.48121-19.0 0.31156 5.08585 29 .1 0.32761 5.34784 77.2 0.33625 5.48888-17.9 0.31643 5.16534 30 .1 0.32869 5.36547 78.2 0.33609 5.48627-16.9 0.31456 5.13482 31 .1 0.32868 5.36531 79.2 0.33646 5.49231-15.9 0.31087 5.07458 32 .1 0.32901 5.37070 80.2 0.33648 5.49264-14.9 0.30870 5.03916 33 .1 0.32923 5.37429 81.2 0.33642 5.49166-13.9 0.30771 5.02300 34 .1 0.32951 5.37886 82.2 0.33618 5.48774-12.9 0.30776 5.02382 35 .1 0.32961 5.38049 83.2 0.33579 5.48137-11.9 0.30858 5.03720 36 .1 0.32956 5.37967 84.2 0.33573 5.48039-10.9 0.31096 5.07605 37 .1 0.32949 5.37853 85.2 0.33541 5.47517
-9 .9 0.31396 5.12502 38 .1 0.32976 5.38294 86.2 0.33538 5.47468-8 .9 0.31463 5.13596 39 .1 0.33023 5.39061 87.2 0.33575 5.48072-7 .9 0.31438 5.13188 40 .1 0.33047 5.39453 88.2 0.33575 5.48072-6 .9 0.31433 5.13106 41 .1 0.33106 5.40416 89.2 0.33627 5.48921-5 .9 0.31380 5.12241 42 .1 0.33216 5.42212 90.2 0.33646 5.49231-4 .9 0.31360 5.11915 43 .1 0.33350 5.44399 91.2 0.33725 5.50521-3 .9 0.31353 5.11800 44 .2 0.33597 5.48431 92.2 0.33789 5.51565-2 .9 0.31348 5.11719 45 .2 0.33994 5.54912 93.2 0.33806 5.51843
S

26
Tem p. (°C ) C p (J/g*K )
C p c a l/ (g -m o le*K )
Tem p. (°C ) C p (J/g*K )
C p c a l/ (g -m ole*K )
Tem p. (°C ) C p (J/g*K )
C p c a l/ (g -m ole*K )
94.2 0 .33832 5.52267 142.3 0 .35268 5.75708 190.4 0 .37519 6.1245395.2 0 .33877 5.53002 143.3 0 .35287 5.76018 191.4 0 .37625 6.1418396.2 0 .33893 5.53263 144.3 0 .35326 5.76655 192.4 0 .37765 6.1646997.2 0 .33936 5.53965 145.3 0 .35395 5.77781 193.4 0 .37787 6.1682898.2 0 .34010 5.55173 146.3 0 .35433 5.78402 194.4 0 .37799 6.1702499.2 0 .34049 5.55809 147.3 0 .35469 5.78989 195.4 0 .37817 6.17318
100.2 0 .34088 5.56446 148.3 0 .35527 5.79936 196.4 0 .37838 6.17660101.2 0 .34131 5.57148 149.3 0 .35562 5.80507 197.4 0 .37927 6.19113102.2 0 .34179 5.57932 150.3 0 .35599 5.81111 198.4 0 .38035 6.20876103.2 0 .34210 5.58438 151.3 0 .35705 5.82842 199.4 0 .38105 6.22019104.2 0 .34217 5.58552 152.3 0 .35793 5.84278 200.4 0 .38183 6.23292105.2 0 .34237 5.58878 153.3 0 .35854 5.85274 201.4 0 .38293 6.25088106.3 0 .34262 5.59286 154.3 0 .35903 5.86074 202.4 0 .38393 6.26720107.3 0 .34325 5.60315 155.3 0 .35897 5.85976 203.4 0 .38508 6.28597108.3 0 .34355 5.60805 156.3 0 .35897 5.85976 204.4 0 .38649 6.30899109.3 0 .34400 5.61539 157.3 0 .35906 5.86123 205.4 0 .38835 6.33935110.3 0 .34447 5.62306 158.3 0 .35915 5.86270 206.4 0 .39011 6.36808111.3 0 .34465 5.62600 159.3 0 .35920 5.86351 207.4 0 .39190 6.39730112.3 0 .34487 5.62959 160.3 0 .35934 5.86580 208.4 0 .39330 6.42015113.3 0 .34519 5.63482 161.3 0 .36017 5.87935 209.4 0 .39462 6.44170114.3 0 .34528 5.63629 162.3 0 .36075 5.88881 210.4 0 .39524 6.45182115.3 0 .34543 5.63873 163.3 0 .36109 5.89436 211.4 0 .39518 6.45084116.3 0 .34578 5.64445 164.3 0 .36164 5.90334 212.4 0 .39496 6.44725117.3 0 .34634 5.65359 165.3 0 .36170 5.90432 213.4 0 .39573 6.45982118.3 0 .34663 5.65832 166.3 0 .36143 5.89991 214.4 0 .39745 6.48790119.3 0 .34720 5.66763 167.3 0 .36133 5.89828 215.4 0 .40014 6.53181120.3 0 .34747 5.67203 168.3 0 .36151 5.90122 216.4 0 .40375 6.59074121.3 0 .34790 5.67905 169.4 0 .36208 5.91053 217.4 0 .40852 6.66860122.3 0 .34839 5.68705 170.4 0 .36359 5.93517 218.4 0 .41320 6.74500123.3 0 .34892 5.69570 171.4 0 .36521 5.96162 219.4 0 .41849 6.83135124.3 0 .34922 5.70060 172.4 0 .36634 5.98006 220.4 0 .42490 6.93599125.3 0 .34937 5.70305 173.4 0 .36719 5.99394 221.4 0 .43219 7.05499126.3 0 .34972 5.70876 174.4 0 .36708 5.99214 222.4 0 .44012 7.18444127.3 0 .34995 5.71252 175.4 0 .36704 5.99149 223.4 0 .44951 7.33772128.3 0 .35015 5.71578 176.4 0 .36709 5.99231 224.4 0 .46116 7.52789129.3 0 .35056 5.72247 177.4 0 .36662 5.98464 225.4 0 .48626 7.93762130.3 0 .35081 5.72656 178.4 0 .36679 5.98741 226.4 0 .76613 12.50616131.3 0 .35121 5.73309 179.4 0 .36674 5.98659 227.4 1 .08586 17.72537132.3 0 .35150 5.73782 180.4 0 .36752 5.99933 228.4 0 .65497 10.69161133.3 0 .35147 5.73733 181.4 0 .36818 6.01010 229.4 0 .47818 7.80572134.3 0 .35151 5.73798 182.4 0 .36866 6.01794 230.4 0 .41313 6.74386135.3 0 .35155 5.73864 183.4 0 .36932 6.02871 231.5 0 .38680 6.31405136.3 0 .35186 5.74370 184.4 0 .36990 6.03818 232.5 0 .37498 6.12110137.3 0 .35220 5.74925 185.4 0 .37033 6.04520 233.5 0 .36924 6.02740138.3 0 .35253 5.75463 186.4 0 .37105 6.05695 234.5 0 .36558 5.96766139.3 0 .35253 5.75463 187.4 0 .37206 6.07344 235.5 0 .36287 5.92342140.3 0 .35239 5.75235 188.4 0 .37313 6.09090 236.5 0 .36119 5.89600141.3 0 .35254 5.75480 189.4 0 .37400 6.10511 237.5 0 .35926 5.86449
Tab le IV . (A ) H eat C ap acity fo r P ZT9 5 /5 (1 .8 N b ) C eramic (co ntinued ).

27
Tab le IV . (A ) H eat C ap acity fo r P ZT9 5 /5 (1 .8 N b ) C eramic (co ntinued ).Tem p.
(°C ) C p (J/g*K )C p c a l/ (g -m o le*K )
Tem p. (°C ) C p (J/g*K )
C p c a l/ (g -m ole*K )
238.5 0 .35800 5.84392 286.5 0 .34642 5.65489239.5 0 .35687 5.82548 287.5 0 .34675 5.66028240.5 0 .35632 5.81650 288.5 0 .34707 5.66550241.5 0 .35585 5.80883 289.5 0 .34717 5.66714242.5 0 .35559 5.80458 290.5 0 .34717 5.66714243.5 0 .35516 5.79756 291.5 0 .34712 5.66632244.5 0 .35482 5.79201 292.5 0 .34701 5.66453245.5 0 .35441 5.78532 293.5 0 .34712 5.66632246.5 0 .35384 5.77602 294.6 0 .34700 5.66436247.5 0 .35286 5.76002 295.6 0 .34731 5.66942248.5 0 .35233 5.75137 296.6 0 .34728 5.66893249.5 0 .35171 5.74125 297.6 0 .34680 5.66110250.5 0 .35109 5.73113 298.6 0 .34622 5.65163251.5 0 .35089 5.72786 299.6 0 .34626 5.65228252.5 0 .35033 5.71872253.5 0 .34981 5.71023254.5 0 .34975 5.70925255.5 0 .34938 5.70321256.5 0 .34882 5.69407257.5 0 .34901 5.69717258.5 0 .34863 5.69097259.5 0 .34903 5.69750260.5 0 .34915 5.69946261.5 0 .34924 5.70093262.5 0 .34899 5.69685263.5 0 .34828 5.68526264.5 0 .34852 5.68917265.5 0 .34852 5.68917266.5 0 .34803 5.68118267.5 0 .34781 5.67758268.5 0 .34705 5.66518269.5 0 .34691 5.66289270.5 0 .34670 5.65947271.5 0 .34667 5.65898272.5 0 .34636 5.65391273.5 0 .34640 5.65457274.5 0 .34691 5.66289275.5 0 .34704 5.66502276.5 0 .34744 5.67154277.5 0 .34779 5.67726278.5 0 .34771 5.67595279.5 0 .34763 5.67465280.5 0 .34747 5.67203281.5 0 .34689 5.66257282.5 0 .34655 5.65702283.5 0 .34622 5.65163284.5 0 .34605 5.64885

28
Tem p. (°C ) C p (J/ (g *K )
C p (c a l/ (g -m o le*K )
Tem p. (°C ) C p (J/ (g*K )
C p (c a l/ (g -m ole*K )
Tem p. (°C ) C p (J/ (g*K )
C p (c a l/ (g -m ole*K )
-50.0 0.28807 4 .74281 -1 .9 0 .30940 5 .09398 46 .2 0.32784 5.39758-49.0 0.28854 4 .75054 -0 .9 0 .30964 5 .09794 47 .2 0.32819 5.40334-48.0 0.28913 4 .76026 0 .1 0 .31028 5 .10847 48 .2 0.32883 5.41388-47.0 0.28995 4 .77376 1 .1 0 .31086 5 .11802 49 .2 0.32930 5.42162-46.0 0.28991 4 .77310 2 .1 0 .31111 5 .12214 50 .2 0.32976 5.42919-45.0 0.29026 4 .77886 3 .1 0 .31170 5 .13185 51 .2 0.33020 5.43644-44.0 0.29045 4 .78199 4 .1 0 .31213 5 .13893 52 .2 0.33084 5.44697-43.0 0.29040 4 .78117 5 .1 0 .31263 5 .14716 53 .2 0.33118 5.45257-42.0 0.29112 4 .79302 6 .1 0 .31340 5 .15984 54 .2 0.33150 5.45784-41.0 0.29077 4 .78726 7 .1 0 .31365 5 .16396 55 .2 0.33206 5.46706-40.0 0.29146 4 .79862 8 .1 0 .31467 5 .18075 56 .2 0.33246 5.47365-39.0 0.29129 4 .79582 9 .1 0 .31542 5 .19310 57 .2 0.33280 5.47924-38.0 0.29170 4 .80257 10 .1 0 .31623 5 .20643 58 .2 0.33296 5.48188-37.0 0.29151 4 .79944 11 .1 0 .31691 5 .21763 59 .2 0.33355 5.49159-36.0 0.29164 4 .80158 12 .1 0 .31730 5 .22405 60 .2 0.33366 5.49340-35.0 0.29194 4 .80652 13 .1 0 .31746 5 .22668 61 .2 0.33399 5.49884-34.0 0.29071 4 .78627 14 .1 0 .31737 5 .22520 62 .2 0.33406 5.49999-33.0 0.29038 4 .78084 15 .1 0 .31774 5 .23129 63 .2 0.33444 5.50624-32.0 0.29018 4 .77754 16 .1 0 .31836 5 .24150 64 .2 0.33451 5.50740-31.0 0.29067 4 .78561 17 .1 0 .31930 5 .25698 65 .2 0.33494 5.51448-30.0 0.29146 4 .79862 18 .1 0 .31962 5 .26225 66 .2 0.33492 5.51415-29.0 0.29269 4 .81887 19 .1 0 .32036 5 .27443 67 .2 0.33522 5.51909-28.0 0.29395 4 .83961 20 .1 0 .32063 5 .27888 68 .2 0.33541 5.52221-27.0 0.29570 4 .86843 21 .1 0 .32092 5 .28365 69 .2 0.33573 5.52748-26.0 0.29945 4 .93017 22 .1 0 .32095 5 .28414 70 .2 0.33650 5.54016-25.0 0.30614 5 .04031 23 .1 0 .32091 5 .28349 71 .2 0.33728 5.55300-24.0 0.30474 5 .01726 24 .1 0 .32134 5 .29056 72 .2 0.33803 5.56535-23.0 0.30516 5 .02418 25 .1 0 .32150 5 .29320 73 .2 0.33878 5.57770-22.0 0.30513 5 .02368 26 .1 0 .32157 5 .29435 74 .2 0.33952 5.58988-21.0 0.30199 4 .97198 27 .1 0 .32211 5 .30324 75 .2 0.34046 5.60536-20.0 0.30309 4 .99010 28 .1 0 .32226 5 .30571 76 .2 0.34107 5.61540-19.0 0.30336 4 .99454 29 .1 0 .32271 5 .31312 77 .2 0.34186 5.62841-17.9 0.30279 4 .98516 30 .1 0 .32290 5 .31625 78 .2 0.34213 5.63285-16.9 0.30417 5 .00788 31 .1 0 .32361 5 .32794 79 .2 0.34273 5.64273-15.9 0.30557 5 .03093 32 .1 0 .32411 5 .33617 80 .2 0.34307 5.64833-14.9 0.30582 5 .03504 33 .1 0 .32467 5 .34539 81 .2 0.34327 5.65162-13.9 0.30688 5 .05249 34 .1 0 .32524 5 .35477 82 .2 0.34400 5.66364-12.9 0.30722 5 .05809 35 .1 0 .32206 5 .30242 83 .2 0.34491 5.67862-11.9 0.30788 5 .06896 36 .1 0 .32600 5 .36729 84 .2 0.34587 5.69443-10.9 0.30806 5 .07192 37 .1 0 .32613 5 .36943 85 .2 0.34742 5.71995
-9 .9 0.30841 5 .07768 38 .1 0 .32645 5 .37470 86 .2 0.34982 5.75946-8 .9 0.30857 5 .08032 39 .1 0 .32672 5 .37914 87 .2 0.35332 5.81709-7 .9 0.30785 5 .06846 40 .1 0 .32714 5 .38606 88 .2 0.35835 5.89990-6 .9 0.30871 5 .08262 41 .1 0 .32708 5 .38507 89 .2 0.36679 6.03886-5 .9 0.30867 5 .08196 42 .1 0 .32715 5 .38622 90 .2 0.37873 6.23544-4 .9 0.30845 5 .07834 43 .1 0 .32726 5 .38803 91 .2 0.39285 6.46791-3 .9 0.30870 5 .08246 44 .2 0 .32747 5 .39149 92 .2 0.40200 6.61856-2 .9 0.30885 5 .08493 45 .2 0 .32741 5 .39050 93 .2 0.40001 6.58579
Tab le IV . (B) H eat C apacity o f P S ZT C eramic

29
Tem p. (°C )
C p (J/ (g*K )
C p (c a l/ (g -m ole*K )
Tem p. (°C )
C p (J/(g*K )
C p (c a l/ (g -m ole*K )
Tem p. (°C )
C p (J/(g*K )
C p (c a l/ (g -m o le*K )
94.2 0.38992 6.41967 142.3 0.35724 5.88162 190 .4 0.40075 6.5979895.2 0.37827 6.22786 143.3 0.35777 5.89035 191 .4 0.37768 6.2181596.2 0.36830 6.06372 144.3 0.35825 5.89825 192 .4 0.36796 6.0581297.2 0.36111 5.94534 145.3 0.35917 5.91340 193 .4 0.36319 5.9795998.2 0.35613 5.86335 146.3 0.35961 5.92064 194 .4 0.36030 5.9320099.2 0.35248 5.80326 147.3 0.36075 5.93941 195 .4 0.35833 5.89957
100.2 0.35012 5.76440 148.3 0.36129 5.94830 196 .4 0.35649 5.86928101.2 0.34842 5.73641 149.3 0.36223 5.96378 197 .4 0.35589 5.85940102.2 0.34723 5.71682 150.3 0.36287 5.97432 198 .4 0.35503 5.84524103.2 0.34640 5.70315 151.3 0.36416 5.99556 199 .4 0.35521 5.84820104.2 0.34549 5.68817 152.3 0.36537 6.01548 200 .4 0.35506 5.84573105.2 0.34523 5.68389 153.3 0.36607 6.02700 201 .4 0.35500 5.84475106.3 0.34495 5.67928 154.3 0.36718 6.04528 202 .4 0.35419 5.83141107.3 0.34481 5.67698 155.3 0.36751 6.05071 203 .4 0.35305 5.81264108.3 0.34478 5.67648 156.3 0.36794 6.05779 204 .4 0.35260 5.80523109.3 0.34481 5.67698 157.3 0.36814 6.06108 205 .4 0.35226 5.79963110.3 0.34492 5.67879 158.3 0.36847 6.06652 206 .4 0.35162 5.78910111.3 0.34541 5.68685 159.3 0.3691 6.07689 207 .4 0.35058 5.77197112.3 0.34585 5.69410 160.3 0.36998 6.09138 208 .4 0.34941 5.75271113.3 0.34629 5.70134 161.3 0.3709 6.10652 209 .4 0.34856 5.73872114.3 0.34662 5.70678 162.3 0.37202 6.12496 210 .4 0.34774 5.72522115.3 0.34694 5.71204 163.3 0.37317 6.14390 211 .4 0.34700 5.71303116.3 0.34753 5.72176 164.3 0.37498 6.17370 212 .4 0.34676 5.70908117.3 0.34796 5.72884 165.3 0.37624 6.19444 213 .4 0.34657 5.70595118.3 0.34840 5.73608 166.3 0.37731 6.21206 214 .4 0.34705 5.71386119.3 0.34912 5.74794 167.3 0.3786 6.23330 215 .4 0.34731 5.71814120.3 0.34965 5.75666 168.3 0.37997 6.25585 216 .4 0.34820 5.73279121.3 0.35029 5.76720 169.4 0.38131 6.27792 217 .4 0.34865 5.74020122.3 0.35074 5.77461 170.4 0.38279 6.30228 218 .4 0.34862 5.73970123.3 0.35133 5.78432 171.4 0.38444 6.32945 219 .4 0.34894 5.74497124.3 0.35173 5.79091 172.4 0.3857 6.35019 220 .4 0.34877 5.74217125.3 0.35227 5.79980 173.4 0.38704 6.37225 221 .4 0.34843 5.73658126.3 0.35236 5.80128 174.4 0.3888 6.40123 222 .4 0.34859 5.73921127.3 0.35304 5.81248 175.4 0.39069 6.43235 223 .4 0.34897 5.74547128.3 0.35331 5.81692 176.4 0.39305 6.47120 224 .4 0.34880 5.74267129.3 0.35382 5.82532 177.4 0.39585 6.51730 225 .4 0.34861 5.73954130.3 0.35389 5.82647 178.4 0.39867 6.56373 226 .4 0.34878 5.74234131.3 0.35443 5.83536 179.4 0.40212 6.62053 227 .4 0.34871 5.74119132.3 0.35493 5.84359 180.4 0.40696 6.70022 228 .4 0.34913 5.74810133.3 0.35504 5.84540 181.4 0.41304 6.80032 229 .4 0.34941 5.75271134.3 0.35530 5.84968 182.4 0.42101 6.93154 230 .4 0.35008 5.76374135.3 0.35543 5.85182 183.4 0.43409 7.14689 231 .5 0.35042 5.76934136.3 0.35586 5.85890 184.4 0.45884 7.55437 232 .5 0.35050 5.77066137.3 0.35621 5.86467 185.4 0.52272 8.60610 233 .5 0.35072 5.77428138.3 0.35643 5.86829 186.4 0.71566 11.78268 234 .5 0.35061 5.77247139.3 0.35669 5.87257 187.4 0.93508 15.39522 235 .5 0.35004 5.76308140.3 0.35678 5.87405 188.4 0.62671 10.31820 236 .5 0.34990 5.76078141.3 0.35704 5.87833 189.4 0.46118 7.59290 237 .5 0.34946 5.75353
Tab le IV (B) H eat C ap acity o f P S ZT C eramic (co ntinued ).

30
Tab le IV . (B) H eat C apacity fo r P S ZT C eramic (co ntinued ).Tem p.
(°C ) C p
(J/(g*K )C p (c a l/ (g -
m o le*K )Tem p.
(°C ) C p
(J/ (g*K )C p (c a l/ (g -
m ole*K )238 .5 0.34949 5 .75403 286.5 0.34539 5.68653239 .5 0.34918 5 .74892 287.5 0.34531 5.68521240 .5 0.34921 5 .74942 288.5 0.34466 5.67451241 .5 0.34896 5 .74530 289.5 0.34471 5.67533242 .5 0.34893 5 .74481 290.5 0.34456 5.67286243 .5 0.34891 5 .74448 291.5 0.34441 5.67039244 .5 0.34920 5 .74925 292.5 0.34457 5.67303245 .5 0.34855 5 .73855 293.5 0.34517 5.68290246 .5 0.34824 5 .73345 294.6 0.34529 5.68488247 .5 0.34767 5 .72406 295.6 0.34566 5.69097248 .5 0.34695 5 .71221 296.6 0.34613 5.69871249 .5 0.34635 5 .70233 297.6 0.34638 5.70283250 .5 0.34549 5 .68817 298.6 0.34646 5.70414251 .5 0.34549 5 .68817 299.6 0.34662 5.70678252 .5 0.34539 5 .68653253 .5 0.34551 5 .68850254 .5 0.34591 5 .69509255 .5 0.34552 5 .68867256 .5 0.34489 5 .67829257 .5 0.34419 5 .66677258 .5 0.34353 5 .65590259 .5 0.34334 5 .65277260 .5 0.34363 5 .65755261 .5 0.34439 5 .67006262 .5 0.34511 5 .68192263 .5 0.34580 5 .69328264 .5 0.34655 5 .70562265 .5 0.34705 5 .71386266 .5 0.34727 5 .71748267 .5 0.34728 5 .71764268 .5 0.34703 5 .71353269 .5 0.34613 5 .69871270 .5 0.34498 5 .67978271 .5 0.34442 5 .67056272 .5 0.34349 5 .65524273 .5 0.34342 5 .65409274 .5 0.34402 5 .66397275 .5 0.34442 5 .67056276 .5 0.34493 5 .67895277 .5 0.34595 5 .69575278 .5 0.34661 5 .70661279 .5 0.34700 5 .71303280 .5 0.34662 5 .70678281 .5 0.34599 5 .69640282 .5 0.34577 5 .69278283 .5 0.34553 5 .68883284 .5 0.34578 5 .69295285 .5 0.34588 5 .69459

31
Table V. (A) The Constant-Pressure Heat Capacity for Different Phases in PZT95/5(1.8Nb) ceramic. (Cp = a + b*T; Units: Cp: J/(g*K); T: K)
Phase Temperature range (°C)
a b R2
FERL -10 to 42 0.2073 0.0004 0.9551 FERH 66 to 192 0.2195 0.0003 0.9863 PE 256 to 300 0.3754 -0.00005 0.5137
Table V. (B) The Constant-Pressure Heat Capacity for Different Phases in PSZT Ceramic. (Cp = a + b*T; Units: Cp: J/(g*K); T: K)
Phase Temperature range (°C)
a b R2
FERL -20 to 82 0.2081 0.0004 0.9929 FERH 108 to 175 0.1695 0.0005 0.9727 PE 198 to 300 0.3847 -0.00007 0.5853
Table VI. (A) Enthalpy Change Associated with Phase Transformation in PZT95/5(1.8Nb) Ceramic.
Phase transformation Enthalpy (J/g) Enthalpy (cal/mole) FERL-to-FERH 0.5322 43.4377 FERH-to-PE 2.096 171.0735
Table VI. (B) Enthalpy Change Associated with Phase Transformation in PSZT Ceramic.
Phase transformation Enthalpy (J/g) Enthalpy (cal/mole) FERL-to-FERH 0.5091 41.9098 FERH-to-PE 2.1195 174.4803

32
Table VII. (A) Thermal Diffusivity and Thermal Conductivity for PZT95/5(1.8Nb) Ceramic at Different Temperatures.
Temperature (°C)
Thermal diffusivity
(cm2/s)
Heat capacity (J/(K*g))
Density (g/cm3)
Thermal conductivity (W/(K*cm))
-59 0.005833 0.28530 7.377 0.012276-33 0.005591 0.29300 7.374 0.012079-13 0.005395 0.30776 7.371 0.012239-1 0.005283 0.31670 7.369 0.0123301 0.005272 0.31434 7.369 0.01221122 0.005053 0.32242 7.366 0.01200141 0.004896 0.33106 7.366 0.01194048 0.004307 0.37983 7.364 0.01204750 0.004754 0.41634 7.329 0.01450774 0.004705 0.33534 7.328 0.01156187 0.004670 0.33575 7.328 0.01148989 0.004665 0.33646 7.328 0.01150198 0.004636 0.34010 7.328 0.011555
PZT95/5(1.8Nb)
Table VII. (B) Thermal Diffusivity and Thermal Conductivity for PSZT Ceramic at Different Temperatures.
Temperature (°C)
Thermal diffusivity
(cm2/s)
Heat capacity (J/(K*g))
Density (g/cm3)
Thermal conductivity (W/(K*cm))
-59 0.005820 0.28140 7.729 0.012658-13 0.005437 0.30614 7.723 0.012856-10 0.005404 0.30806 7.723 0.0128580 0.005319 0.30940 7.722 0.01270922 0.005169 0.32150 7.719 0.01282741 0.005060 0.32715 7.717 0.01277548 0.005020 0.32883 7.717 0.01273950 0.005009 0.32976 7.716 0.01274774 0.004828 0.33952 7.714 0.01264587 0.004786 0.37873 7.713 0.01397989 0.004788 0.36679 7.687 0.01349998 0.004734 0.35613 7.687 0.012958
PSZT
33
Table VIII. Calculated Phonon Mean Free Path in PZT95/5(1.8Nb) and PSZT Ceramics at Room Temperature (FERL; R3c).
Material Thermal diffusivity (αd, cm2/sec)
Average elastic wave velocity (v, m/sec)
Mean free path (Å)
l = 3 αd/v PZT95/5(1.8Nb) 0.005053 4332.9 3.58
PSZT 0.005171 4360.0 3.56 Table IX. Average Thermal Conductivity for PZT95/5(1.8Nb) and PSZT Ceramics.
Material Temperature range Phase Thermal conductivity (W/(K*cm))
-70°C – 48°C FERL 0.01214±0.00014 PZT95/5(1.8Nb)
60°C – 100°C FERH 0.01153±0.00004 PSZT -70°C – 80°C FERL 0.01276±0.00008
Table X. Calculated Grüneisen Constant for PZT95/5(1.8Nb) and PSZT Ceramics.
Material Volumetric
thermal expansion (1/K)
Volume per mass
(m3/Kg)
Heat capacity Cv (~ Cp) (J/(Kg*K)
Isothermal compressibility
(m2/N)
Grüneisen constant
PZT95/5 (1.8Nb)@ 25°C (FERL)
1.994 X 10⁻⁵
(based on as-sintered sample)
1.358 X 10⁻⁴ 3.249 X 10² 1.457 X 10⁻¹¹ 0.572
PSZT @ 25°C
(FERL)
1.942 X 10⁻⁵ (based on as-
sintered sample) 1.296 X 10⁻⁴ 3.215 X 10² 1.285 X 10⁻¹¹ 0.611
PSZT @ 98°C
(FERH)
2.550 X 10⁻⁶
(based on as-sintered sample)
1.301 X 10⁻⁴ 3.513 X 10² 1.156 X 10⁻¹¹ 0.082

34
-100 -50 0 50 100 150 200 250 300 350Temperature /°C
-1.0
-0.5
0.0
0.5
1.0
dL/Lo *10-3dL/Lo *10-3
1°C/min
PA
RN
PR
PEFEFE
RHRL
(R3m)(R3c)
PZT95/5(1.8Nb) - heating
Figure 1. Thermal expansion behavior of PZT95/5(1.8Nb) ceramics during a heating cycle. Thermal strains are reported for as-sintered sample (RN; black), as well as for parallel (PA; red) and perpendicular (PR; blue) to the spontaneous polarization direction [111]c.
-50 0 50 100 150 200 250 300 350Temperature /°C
-2.0
-1.5
-1.0
-0.5
0.0
0.5
1.0
dL/Lo *10-3dL/Lo *10-3
PZT95/5(1.8NB) - cooling1°C/min
PR
RN
PA
PE
FE
FE
RH
RL
(R3m)
(R3c)
Figure 2. Thermal expansion behavior of PZT95/5(1.8Nb) ceramics during a cooling cycle. Thermal strains are reported for as-sintered sample (RN; black), as well as for parallel (PA; red) and perpendicular (PR; blue) to the spontaneous polarization direction [111]c.

35
-100 -50 0 50 100 150 200 250 300 350Temperature /°C
-1.0
-0.5
0.0
0.5
1.0
1.5
dL/Lo *10-3dL/Lo *10-3
PSZT - heating1°C/min
PA
RN
PR
PEFE
FE
RH
RL
(R3m)
(R3c)
Figure 3. Thermal expansion behavior of PSZT ceramics during a heating cycle. Thermal strains are reported for as-sintered sample (RN; black), as well as for parallel (PA; red) and perpendicular (PR; blue) to the spontaneous polarization direction [111]c.
-50 0 50 100 150 200 250 300 350Temperature /°C
-2.0
-1.5
-1.0
-0.5
0.0
0.5
1.0
1.5
dL/Lo *10-3dL/Lo *10-3
1°C/min
PA
RN
PR
PEFE
FE
RH
RL
(R3m)
(R3c)
PSZT - cooling
Figure 4. Thermal expansion behavior of PSZT95/5 ceramics during a cooling cycle. Thermal strains are reported for as-sintered sample (RN; black), as well as for parallel (PA; red) and perpendicular (PR; blue) to the spontaneous polarization direction [111]c.

36
-100 -50 0 50 100 150 200 250 300Temperature /°C
0.300
0.400
0.500
0.600
0.700
0.800
0.900
1.000
1.100
Cp /(J/(g*K))
PEFE
FE RL
RH
Sapphire - reference
PZT95/5 (1.8Nb)
PSZT
[1.2]
[2][3]
Figure 5. The constant pressure heat capacity of PZT95/5(1.8Nb) and PSZT ceramics at different temperatures. The heat capacity of sapphire is used as a reference material for heat capacity calculation.
Temperature (°C)-80 -60 -40 -20 0 20 40 60 80 100 120
Ther
mal
Diff
usiv
ity (c
m2 /s
ec)
0.0042
0.0044
0.0046
0.0048
0.0050
0.0052
0.0054
0.0056
0.0058
0.0060PZT95/5 (1.8Nb) PSZT
Figure 6. Thermal diffusivity of PZT95/5(1.8Nb) and PSZT ceramics from -60°C to 100°C. Three measurements were made at each temperature.

37
Temperature (°C)-80 -60 -40 -20 0 20 40 60 80 100 120
Ther
mal
Con
duct
ivity
(W/(K
*cm
))
0.010
0.011
0.012
0.013
0.014
0.015
PZT95/5 (1.8Nb)PSZT
Figure 7. Calculated thermal conductivity of PZT95/5(1.8Nb) and PSZT ceramics.

38
Distribution:
1 MS1245 Christopher B. DiAntonio, 02454
1 MS1245 Timothy J. Gardner, 02454
1 MS1245 David M. Goy, 02454
1 MS1245 Steve J. Lockwood, 02454
1 MS1245 Roger H. Moore, 02454
1 MS0959 Ronnie G. Stone, 02454
1 MS1245 Chad S. Watson, 02454
3 MS1245 Pin Yang, 02454
1 MS0889 S. Jill Glass, 01825
1 MS0889 Rajan Tandon, 01825
1 MS1411 James A. Voigt, 01816
1 MS1411 Bruce A. Tuttle, 01816
1 MS1421 George A. Samara, 01130
1 MS0555 Steven J. Younghouse, 01522
1 MS1159 Scott C. Jones, 01344
1 MS0557 Todd W. Simmermacher, 01523
1 MS0335 Stephen T. Montgomery, 02725
1 MS0335 Timothy W. Scofield, 02725
1 MS0515 Todd A. Haverlock, 02723
1 MS0515 Alexander W. Roesler, 02723
1 MS0515 Luis A. Paz, 02723
1 MS0515 Robert J. Stiers, 02723
1 MS0515 Karen Shin, 02722
1 MS0634 Jeffrey D. Keck, 02951
2 MS9960 Central Technical Files, 08944
2 MS0899 Technical Library, 4536