Embed Size (px)
Citation preview

Montanuniversität Leoben
Lehrstuhl für Gießereikunde
Department für Metallurgie
Vorstand Univ.Prof.Dipl.-Ing.Dr. Peter Schumacher
Thermal physical and mechanical properties
of raw sands and sand cores for aluminum
casting
Submitted by
Xin Wang
Supervised by
Univ.-Prof. Dipl.-Ing. Dr.phil. Peter Schumacher,
Dipl.-Ing. Bernhard Stauder
Leoben, December 2014

ACKNOWLEDGEMENTS
2
Acknowledgements
My first deepest gratitude goes to Professor Peter Schumacher and Dipl.-Ing Bernhard
Stauder, my supervisors, for their constant encouragement and guidance during all the
stages of this thesis. Without this, the thesis could not be in its present form.
Secondly, I would like to express my gratitude to Dr. Jiehua Li, who help me improve the
writing of this thesis. I am also greatly indebted to the colleagues from Nemak Linz GmbH,
who have instructed and helped me a lot during the eight months.
Last but not least, my great thanks would go to my beloved family and friends for their
love and great confidence to me.

STATUTORY DECLARATION
3
Statutory Declaration
I declare that I have authored this thesis independently, that I have not used other than the
declared sources / resources and that I have explicitly marked all material which has been
quoted either literally or by content from the used sources.
Date signature
…………………………… ………………………………………………..

OUTLINE
4
Outline
Outline .................................................................................................................... 4
Abstract .................................................................................................................. 6
1 Introduction ................................................................................................... 10
2 Theory of sand cores ................................................................................... 12
2.1 Raw sands ............................................................................................................ 12
2.1.1 Natural sands ............................................................................................................. 12
2.1.2 Synthetic sands ......................................................................................................... 14
2.2 Raw sands properties ........................................................................................... 14
2.2.1 Physical properties .................................................................................................... 14
2.2.2 Chemical property...................................................................................................... 21
2.3 Binders ................................................................................................................. 21
2.3.1 Chemical composition of binders and promoters ...................................................... 22
2.3.2 Organic binders ......................................................................................................... 22
2.3.3 Inorganic binders ....................................................................................................... 25
2.3.4 Dehydration ............................................................................................................... 28
2.4 Thermal properties ............................................................................................... 28
2.5 Mechanical properties of sand cores .................................................................... 29
3 Experimental Methods.................................................................................. 31
3.1 Properties of raw sands ........................................................................................ 31
3.1.1 Grain size distribution ................................................................................................ 31
3.1.2 Grain morphology 2D-shape factor ........................................................................... 33
3.1.3 Optical microscopy .................................................................................................... 33
3.1.4 Scanning electron microscopy ................................................................................... 34
3.2 Technological investigation of thermal physical properties .................................. 34
3.2.1 Core making process ................................................................................................. 35
3.2.2 Dipping trials .............................................................................................................. 38

OUTLINE
5
3.2.3 Ring mould trials ........................................................................................................ 39
3.3 Mechanical properties .......................................................................................... 40
3.3.1 Semi-sealed mould test – casting box ....................................................................... 41
3.3.2 Shake out trials .......................................................................................................... 42
3.4 Simulation of dipping trial ..................................................................................... 43
4 Results ........................................................................................................... 45
4.1 Raw sands ............................................................................................................ 45
4.1.1 Grain size distribution ................................................................................................ 45
4.1.2 Grain morphology 2D-Shape factor ........................................................................... 49
4.1.3 Optical microscopy .................................................................................................... 51
4.1.4 Scanning electron microscopy ................................................................................... 52
4.2 Thermal properties ............................................................................................... 69
4.2.1 Dipping trials .............................................................................................................. 69
4.2.2 Ring mould test .......................................................................................................... 73
4.3 Decoring behaviour .............................................................................................. 81
4.4 Simulation of dipping trial ..................................................................................... 91
5 Conclusion .................................................................................................... 95
References ........................................................................................................... 98
FIGURE CAPTIONS ........................................................................................... 103
TABLE CAPTIONS ............................................................................................. 108
Appendixes ......................................................................................................... A-1

ABSTRACT
6
Abstract
A better understanding of the thermal physical and mechanical properties of raw sands
and sand cores is of great importance to optimize and improve the quality of the casting
productions in casting industry. By adjusting the properties of sand cores, higher efficiency
and lower cost of casting productions can be achieved. However, there is still a lack of the
detailed investigation on the thermo-physical and mechanical properties of raw sands and
sand cores.
This thesis is aimed to investigate the thermo-physical and mechanical properties of
different raw sands (natural and synthetic sands) bonded in cores with different binders.
Furthermore, the tested and optimized sand cores were used for experimental Al alloys
casting. Simulation was also employed to obtain thermal conductivity λ value of the sand
cores, with an aim to use accurate parameters for the real Al alloy castings and also to
improve the experimental accuracy of the simulation.
Five different raw sands, (MIN sand / Cerabreads sand / Zircon sand / H32 silica sand /
Kerphalite sand) were investigated. Their grain size distributions, microscopic surface,
roughness and morphology were obtained using sieve Analysis, granulometry, Scanning
Electron Microscopy (SEM) and optical microscopy.
The mechanical properties of sand cores were investigated with a special focus on the de-
coring ability of sand cores. Five different sand cores composed of the same silica sand but
with different binders and process parameters were tested. Silica sand cores were found to
be consistent with the observation using SEM. However, binder systems were found to have
different effects on decoring and the binder bridges between sand grains.
Thermal physical properties were determined indirectly using a ‘Dipping trial’ and a ‘Ring
mould’ with defined process parameters. Such types of instrumented experimental casting
can be indirectly related to the thermal behaviour in the inner core moulds, which are
surrounded by the molten Al alloy. Simulations were also performed to obtain a technological
thermal conductivity of the sand cores relative to SiO2 sand. A good agreement was obtained
between simulations and experiments is the ‘dipping trials’. The temperature transfer was
compared for different sand cores of various raw sands, which were bonded by organic
binders or inorganic binders. Especially, sand cores dried by microwave were also
investigated to elucidate the origin of the water peak during the experimental casting process.

ABSTRACT
7
In summary, this thesis provides a comprehensive experimental investigation on thermal
physical and mechanical properties of sand cores with different binders and raw sands. The
obtained results can be used to optimize the production of sand cores and the selection of
raw sands.
Key words: thermal physical properties, mechanical properties, raw sand, sand cores.
ABSTRACT
8
Ein besseres Verständnis der thermischen, physikalischen und mechanischen
Eigenschaften von Rohsanden und Sandkernen ist unabdingbar für die Verbesserung und
Optimierung der Produktionsqualität in der Gussindustrie. Die Anpassung der Sandkerne
ermöglicht eine effizientere Gussproduktion und eine Senkung der Kosten. Bisher wurden
die physikalischen und mechanischen Eigenschaften von Rohsanden und Sandkernen
jedoch noch nicht ausreichend untersucht.
Diese Arbeit analysiert die thermischen, physikalischen und mechanischen Eigenschaften
von verschiedenen (natürlichen und synthetischen) Rohsande gebundenen Sandkernen.
Außerdem wurden die geprüften und optimierten Sandkerne für den realen Guss von Al-
Legierungen eingesetzt zur Bestimmung der Temperaturleitfähigkeit λ der Sandkerne
wurden verschiedene Sande eingesetzt, um die genauen Parameter für den realen Al-Guss
zu ermitteln und auch die experimentelle Simulationsgenauigkeit zu verbessern.
Bei den Rohsanden wurden aufgrund ihrer unterschiedlichen Größe und Morphologie fünf
verschiedene Sande – MIN-Sand / Cerabeads Sand / Zirkonsand / H32 Quarzsand /
Kerphalite-Sand – untersucht. Korngrößenverteilungen, mikroskopische Rauheit,
Morphologie und andere Parameter dieser Rohsande wurden mithilfe von Siebanalysen-
Granulometrie und Untersuchungen mit Rasterelektronen- (SEM/EDX) und Lichtmikroskopen
analysiert. Die verwendeten Quarzsandkerne wurden mit SEM/EDX im Hinblick auf
Binderbrücken untersucht.
Die thermophysikalischen Eigenschaften der Sandkerne wurden unter Verwendung
definierter Parameter durch Tauchversuche sowie durch die Verwendung von
Ringgussformen gemessen. Diese Messungen können mit dem thermischen Verhalten der
inneren Kerne in Beziehung gesetzt werden, die von der Al-Schmelze umgeben sind.
Zwischen den Simulationen und dem in den "Tauchverfahren" mit denselben Parametern
durchgeführten Experiment wurde eine gute Übereinstimmung erzielt. Insbesondere wurden
auch mit Mikrowellen getrocknete Sandkerne untersucht, um den Ursprung der Wasserspitze
während des experimentellen Gießverfahrens zu klären.
Die mechanischen Eigenschaften der Sandkerne wurden im Hinblick auf die
Entkernungsfähigkeit von Sandkernen untersucht. Geprüft wurden fünf verschiedene
Sandkerne aus demselben Quarzsand, aber mit verschiedenen Bindern und
Verfahrensparametern, die in einer speziellen Entkernungsform abgegossen wurden. Die
Ergebnisse der Entkernung der Bindersysteme haben verschiedene Auswirkungen auf das
Entkernungsergebnis und die Bruchflächen zwischen den Sandkörnern. Die erzielten

ABSTRACT
9
Ergebnisse dienen der Optimierung der Produktion von Sandkernen und der Auswahl von
Rohsanden.
Schlagwörter: Thermophysikalische Eigenschaften von Sanden; mechanische
Eigenschaften von Sanden; Rohsande.

INTRODUCTION
10
1 Introduction
During the production of complex castings, such as cylinder heads, (see in Figure 1-1). It
is necessary to shape the inner cavities of the castings using sand cores. High demands on
surface quality and dimensional precision of sand cores are necessary to obtain a good
casting quality.
Figure 1-1: Complex casting parts.
During casting, sand cores play a decisive role of improving the performance of the casting
production. The control and optimization of sand core properties are of great importance to
the casting and subsequent de-coring process.
A better understanding of thermal and mechanical properties of sand cores is important
because thermal and mechanical properties of sand cores affect deformation, flowability,
shape retention, gas permeability, disintegration, high temperature resistance, etc. Therefore,
elucidating their properties is necessary to provide a theoretical basis for further production
development.
The physical and chemical properties of sand cores are significant parameters. Rao and
Bawa [1] [2] have proposed that grain size distributions, shapes and the surface morphology of
raw sands influence the flowability, permeability, adhesiveness, surface fineness and
strength of sand cores. These parameters of the sand cores affect the quality of aluminum
casting. Therefore, the investigation on sand grain size distributions, shapes and the surface
characterizations is necessary.
Furthermore, thermal properties of the sand cores significantly affect the thermal response
of the casting [3]. For a thorough understanding of the behaviour of foundry sand cores
mixtures, Solenicki G., Budic I., Ciglar D. [4] designed novel types of moulds which make it
possible to study the heat transfer coefficient over temperature.

INTRODUCTION
11
Mechanical properties of sand cores have been discussed by Klaushish [5], Beeley [6] with a
special focus on the yield strength and tensile strength. However, thermal shock strength and
effects of molten Al alloy on the casting process still remain to be explored. In the ‘shake out’
after casting, Elanchezhian C. and Vijaya Ramnath B. [7] have discussed the retained
strength, which can exhibit the abilities of sand cores to disintegrate during shake out
operation.
In this thesis, the investigation of mechanical properties will be focused on the influences
of retained strength of different sand cores after casting. In order to determine thermal
transfer, five different sands and binders were investigated with newly developed moulds.
THEORY OF SAND CORES
12
2 Theory of sand cores
2.1 Raw sands
Two types of raw sands, i.e. natural sand and blended sand, are mainly used in the
foundry industry. Natural sand consists of silica sand with organic and inorganic waste
material. Blended sand can also be called compounded formulated or synthetic sand.
Blended sand is made by adding a bond to a ‘washed and dried’ or unboned base sand. This
unbonded sand is sometimes called ’sharp sand’, however, the name has nothing about the
actual grain shape. The unbonded base sand may be silica, olivine, zircon and others. Each
sand has properties that make its use desirable in certain situations [8].
2.1.1 Natural sands
H32 Silica sand
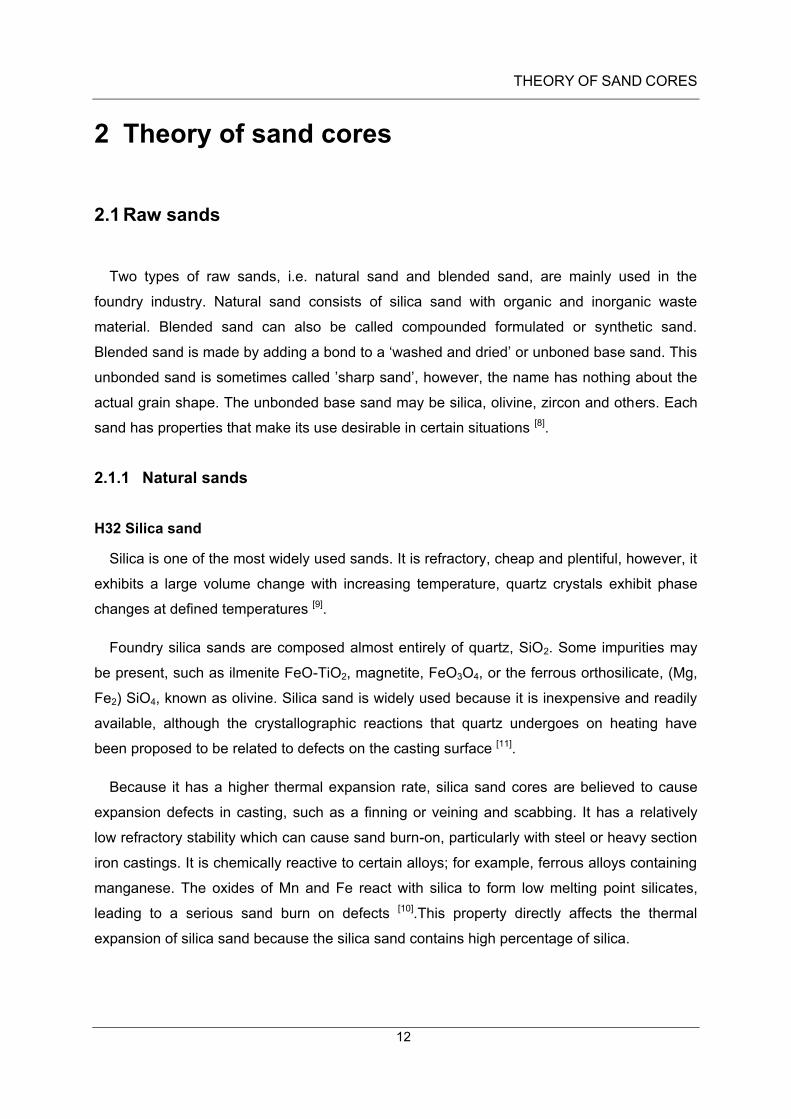
Silica is one of the most widely used sands. It is refractory, cheap and plentiful, however, it
exhibits a large volume change with increasing temperature, quartz crystals exhibit phase
changes at defined temperatures [9].
Foundry silica sands are composed almost entirely of quartz, SiO2. Some impurities may
be present, such as ilmenite FeO-TiO2, magnetite, FeO3O4, or the ferrous orthosilicate, (Mg,
Fe2) SiO4, known as olivine. Silica sand is widely used because it is inexpensive and readily
available, although the crystallographic reactions that quartz undergoes on heating have
been proposed to be related to defects on the casting surface [11].
Because it has a higher thermal expansion rate, silica sand cores are believed to cause
expansion defects in casting, such as a finning or veining and scabbing. It has a relatively
low refractory stability which can cause sand burn-on, particularly with steel or heavy section
iron castings. It is chemically reactive to certain alloys; for example, ferrous alloys containing
manganese. The oxides of Mn and Fe react with silica to form low melting point silicates,
leading to a serious sand burn on defects [10].This property directly affects the thermal
expansion of silica sand because the silica sand contains high percentage of silica.

THEORY OF SAND CORES
13
Figure 2-1: Thermal expansion of silica and silica sand, 1. Silica sand, 2. Silica [11]
.
The SiO2 modification results in a volume change, and a change of the thermal expansion
behaviour of silica sand and the binder situation in the sand mould systems [11], as shown in
Figure 2-1, the thermal expansion of silica sand has higher values than silica from about
300 °C to 573 °C, even silica sand has no ‘jump’ with increasing temperature, while silica has
obvious ‘jump’ at 573 °C.
Zirconium Sand
Zirconium sand has a lowest linear thermal expansion and a high temperature resistance.
However, its high bulk density of about 2.7 g / cm ³ has led to granular segregation defects,
especially for the resin coated sands which are often used in mixtures of silica and zirconium
(for cost reasons). Due to the big differences of the bulk densities between silica and
zirconium sand granular segregation effects and other defects during the core manufacturing
process are possible that lead to a rework and waste [12].
The castings are preferable to be of smooth surface finish and sound in metallurgical
properties. Therefore, the moulds are required to resist metal penetration and “burn in”. A low
thermal expansion and thereby a high dimensional accuracy and reduced cleaning is
preferable [13].
Kerphalite KF (Andalusit)
Kerphalite is characterized by its high temperature resistance and low linear thermal
expansion. Kerphalite KF is, therefore, used as a substitute for zirconium and chromite sand
in mixtures with silica sand from 30 % up to the pure mineral in the Cold Box, Warm Box and
Croning process, respectively. However, its biggest disadvantage is that Kerphalite KF is a
crushed grain and only one typical grain size is available. Due to the relative high dust
THEORY OF SAND CORES
14
loading and the large specific surface, a higher amount of binder (up to 25 %) is required to
obtain similar strengths compared with silica sand [14].
2.1.2 Synthetic sands
Cerabeads
Cerabeads is synthetically manufactured sand and consists of Mullite sintered above
1500 °C, resulting in a very high temperature resistance. Due to the round grains, the
Cerabeads has the highest flowability during core shooting. The very low thermal expansion
(similar to zirconium sand) makes their application fields comparable. Veining defects and
other sand expansion defects can be avoided. Mixtures of at least 30 % Cerabeads with
silica sand show good results and allow core sand mixtures at reasonable costs. Such
mixtures remain uniform during manufacturing. A reproducible gas permeability of the sand
material can be obtained when the grain size distribution is controlled, according to
reproducible sieve analyses. Additionally, the round grain helps to reduce the wear of the
core shooting machine [15].
Min sand
Minsand is synthetic sand produced via an alumina oxide rich mineral basis. Because of
its almost perfectly spherical particle shape, Minsand is widely used in the foundry industry
as mould and core sand. In the core production, binder savings of up to 50 % compared to
other sands are achievable without a loss in the core strength. At the same time, Minsand
cores show excellent surfaces and thus produce excellent casting surfaces [16].
2.2 Raw sands properties
The physical properties of raw sands are affected by grain shape, grain size distribution,
grain fineness, permeability, density, and coefficient of thermal expansion. The chemical
composition of raw sands has been reported to affect pH value and fusion point [17].
2.2.1 Physical properties
As noted above, the physical properties of raw sands are a vital factor in bonding raw
sands into sand mould in the core makings. The shape of sand particle, particle density, bulk
THEORY OF SAND CORES
15
density, grain size distribution and flowability of sands are the important parameters during
the core making process. Linear thermal expansion and phase transformation also affect the
quality of cores.
The particle density (also called specific density) of dense aggregates such as a core is a
particular property in the concrete mixture design. The bulk density of an aggregate, or its
unit mass, represents in part its void content at a given degree of compaction and it’s,
therefore, an indirect measurement of the grading and shape characteristics [18].
Table 2-1. Comparison of physic properties of raw sands [19]
.
The weight per unit volume of the solid portion of a granular mixture is called particle
density. The oven-dry weight of a unit volume of base sand without binders inclusive of pore
spaces is called bulk density, the values are shown in Table 2-1.
2.2.1.1 Shape
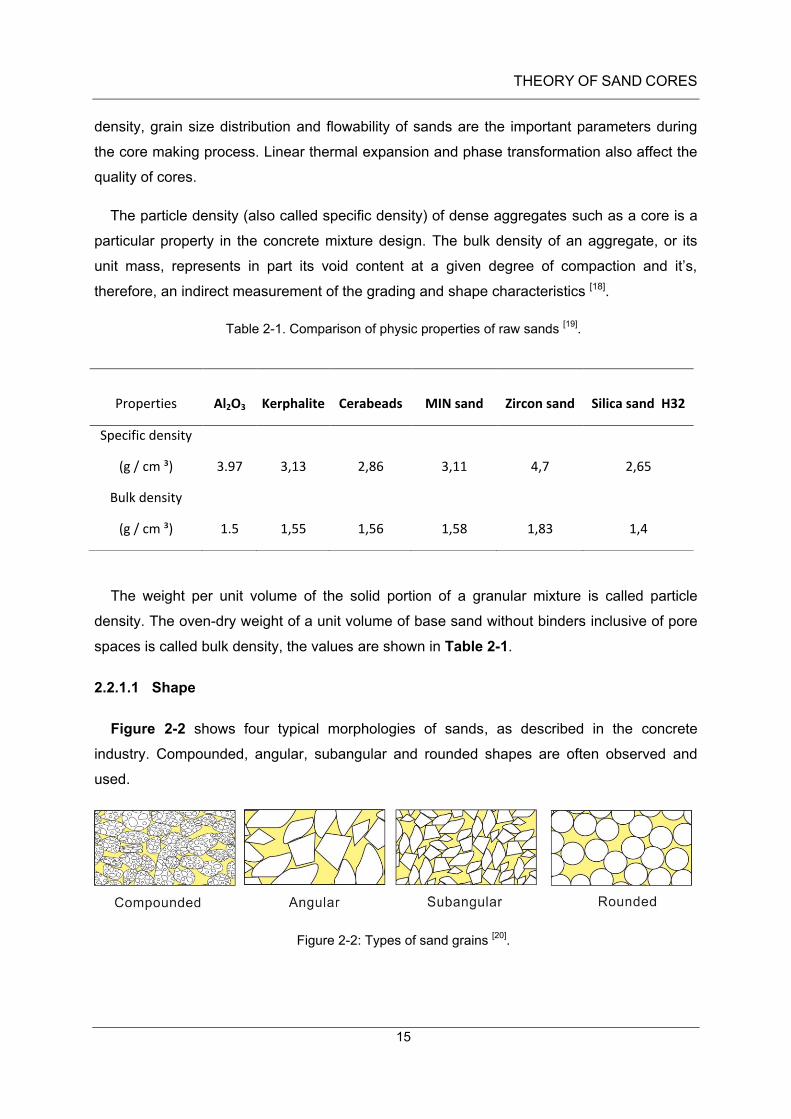
Figure 2-2 shows four typical morphologies of sands, as described in the concrete
industry. Compounded, angular, subangular and rounded shapes are often observed and
used.
Figure 2-2: Types of sand grains [20]
.
Properties Al2O3 Kerphalite Cerabeads MIN sand Zircon sand Silica sand H32
Specific density
(g / cm ³) 3.97 3,13 2,86 3,11 4,7 2,65
Bulk density
(g / cm ³) 1.5 1,55 1,56 1,58 1,83 1,4
THEORY OF SAND CORES
16
Rounded Grains The rounded grains have the least contact with each other in a compacted
structure, thereby making the sand highly permeable to gases. Sand having rounded grains,
however, lacks strength and does not pack up to the optimum extent. The binder requirement
is reduced.
Angular Grain The angular grains have defined edges, and their surfaces are nearly
faceted. They produce a higher strength and a lower permeability in the mould than
subangular grains. The binder consumption is likely to be higher.
Compounded Grains In some cases, the grains are cemented together so that they fail to
be separated when screened. They may be consisted of rounded, subangular, angular grains
or a combination of these three different types of grains. Such types of grains are called
compounded grains and are undesirable to most casting application due to their tendency to
breakdown at high temperatures.
Subangular Grains The subangular grains have a comparatively lower permeability and
greater strength than the rounded grains, because the contacting surfaces are flat and a
stronger bond respectively larger bond surface is possible.
In practice, a sand grain contains a mixture of grain shapes, depending on the origin of the
sand. A subangular-to-rounded grain mixture would be the best combination for sand cores
[21].
2.2.1.2 Grain size
The grain size of sand is defined by a grain fineness number, which is a concept that can
be used for comparing the fineness of different sands. The AFS (American Foundry Society)
number, which is defined as AFS Grain Fineness No. = Total product / Total % of Retained
Grains after the vibration in the sieve analysis, indicates the average grain size of the base
sand. Foundry sands usually fall into the range 150 – 400 µm, with 220 – 250 µm being the
most commonly used. Direct conversion between average grain size and AFS grain fineness
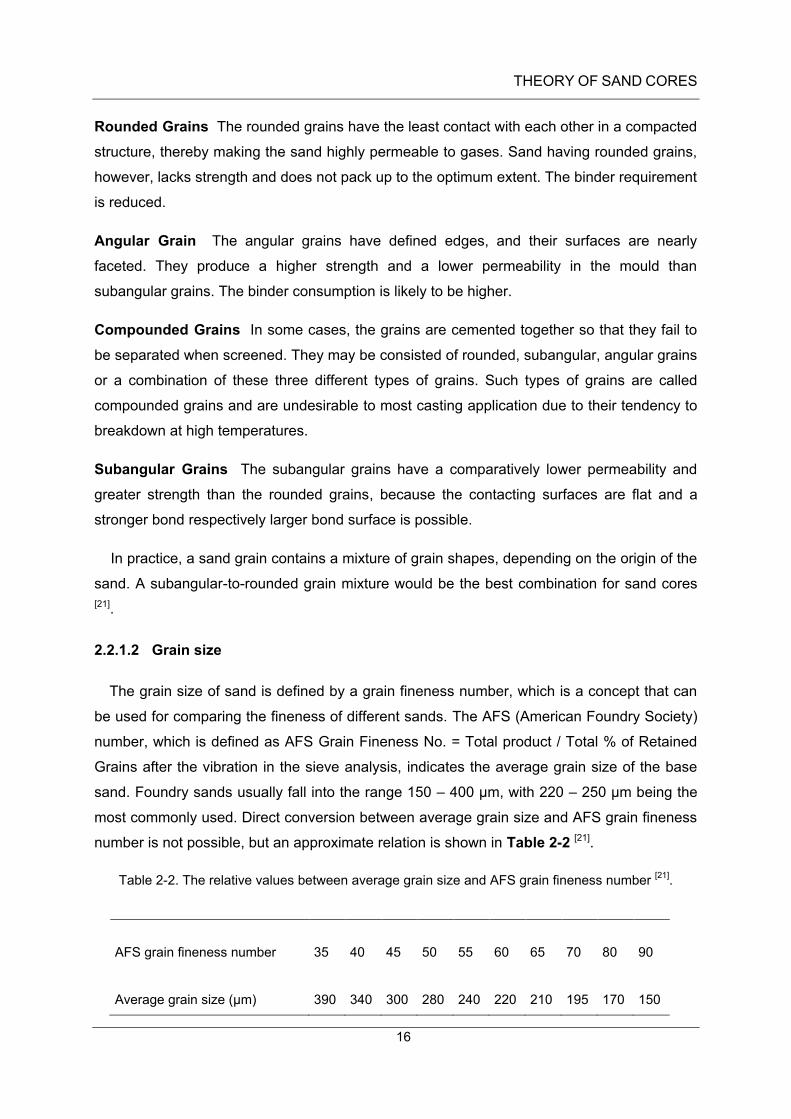
number is not possible, but an approximate relation is shown in Table 2-2 [21].
Table 2-2. The relative values between average grain size and AFS grain fineness number [21]
.
AFS grain fineness number 35 40 45 50 55 60 65 70 80 90
Average grain size (µm) 390 340 300 280 240 220 210 195 170 150
THEORY OF SAND CORES
17
There are different standards to measure the grain size distributions, such as, VDG 40 [22],
DIN ISO 3310 part 1 [23], ASTM D2487-11 [24]. The VDG – 40 video grader as introduced by
Prowell B. D., Zhang J. N., Brown E. R. [25], which can only measure two dimensions. Image
analysis techniques are used to extract information about grading, shape, angularity, in some
cases, texture. DIN ISO 3310 – 1 specifies the technical requirement and corresponding test
methods for test sieves of metal wire cloth, which is applied to test sieves having aperture
sizes [26].ASTM D2487-11 defines 12 terms after sieving the solid particles, which is the
ASTM version of the Unified Soil Classification System [24].In this thesis, the DIN ISO 3310
part 1 was used to test the grain size distribution of different sands.
The size distribution and shape of the sand grains are important in controlling the quality of
the mould. To determine the size, shape, and distribution of the sand grains, it is important to
point out that the grain shape contributes to the amount of sand surface area and the grain
size distribution controls the permeability of the sand cores.
As the sand surface area increases, the required amount of bonding material increases. A
change of surface area, perhaps due to a change of sand shape or the percentage of core
sand, will require a corresponding change in the amount of bonding agent.
Rounded grains have a low surface area to volume ratio and are therefore preferred for
making cores because the less binder is required and a better decoring is observed.
Angular sands have the largest surface area and therefore require higher binder amounts.
The angularity of a sand increases during recycling because the sands are broken down by
thermal and mechanical shock.
The porosity of the cores controls its permeability, which is an ability of the core to allow
gases generated during thermal decomposition of binder to escape through the core. The
highest porosity can be obtained from grains with approximately the same size.
As the size distribution broadens, there are more grains that are small enough to fill the
spaces between large grains. As grains break down through repeated reclamations, there
are smaller grains, and the porosity of the mould decreases. However, if the porosity of the
mould is too large, metal may penetrate sand grains and causes a burn-in defect.
Therefore, it is necessary to balance the sand distribution and continue to control the sand
during foundry operation. Dust collectors during recycling can remove fines and determine
the proper bond addition required for adjustment [27].
THEORY OF SAND CORES
18
2.2.1.3 Thermal linear expansion
The coefficient of thermal expansion is defined as the change in a unit measure of material
exposed to a change of 1 °C in temperature. The coefficient of linear expansion is thus the
slope of the dilation temperature curve. The instantaneous coefficient of linear expansion is
the slope at a specific temperature; while the mean coefficient is the mean slope between
two designated temperatures. Coefficients of expansion may be presented in either
volumetric or linear terms. The latter is most commonly used. To convert volumetric to linear
expansion, the approximate relation of the linear coefficient being equal to one - third of the
volumetric coefficient may be used [28]. The values for typical base sand are shown in Table
2-3.
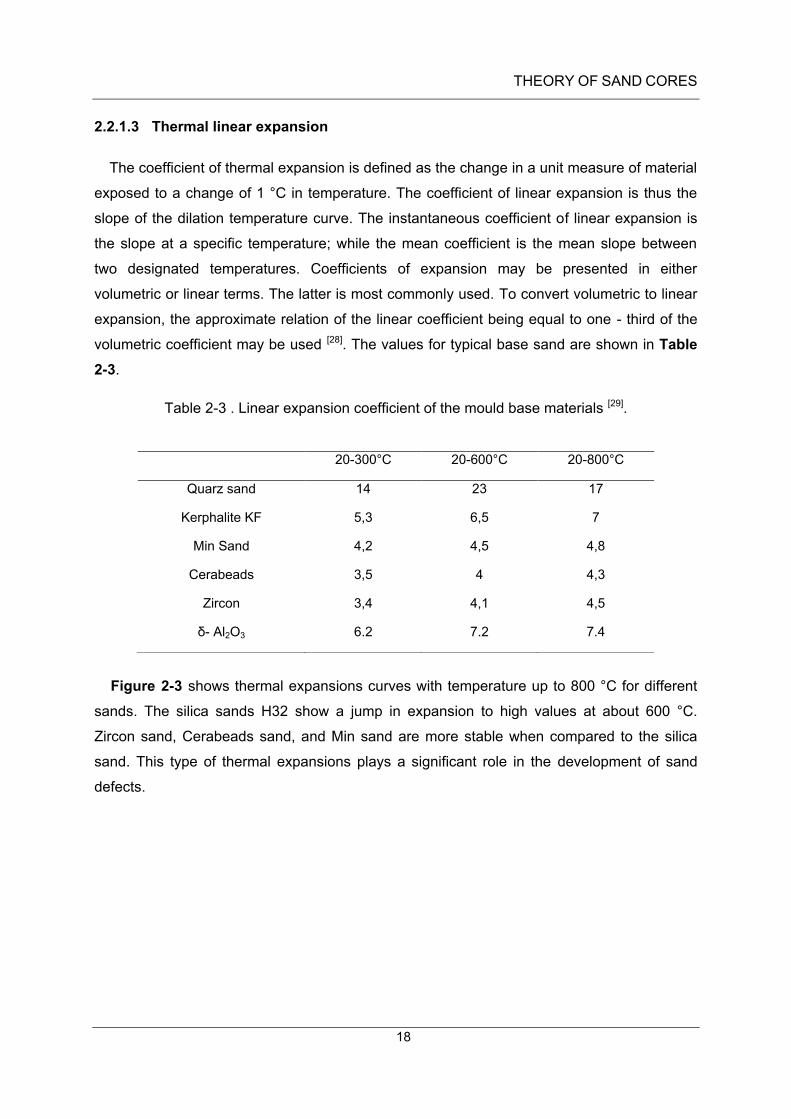
Table 2-3 . Linear expansion coefficient of the mould base materials [29].
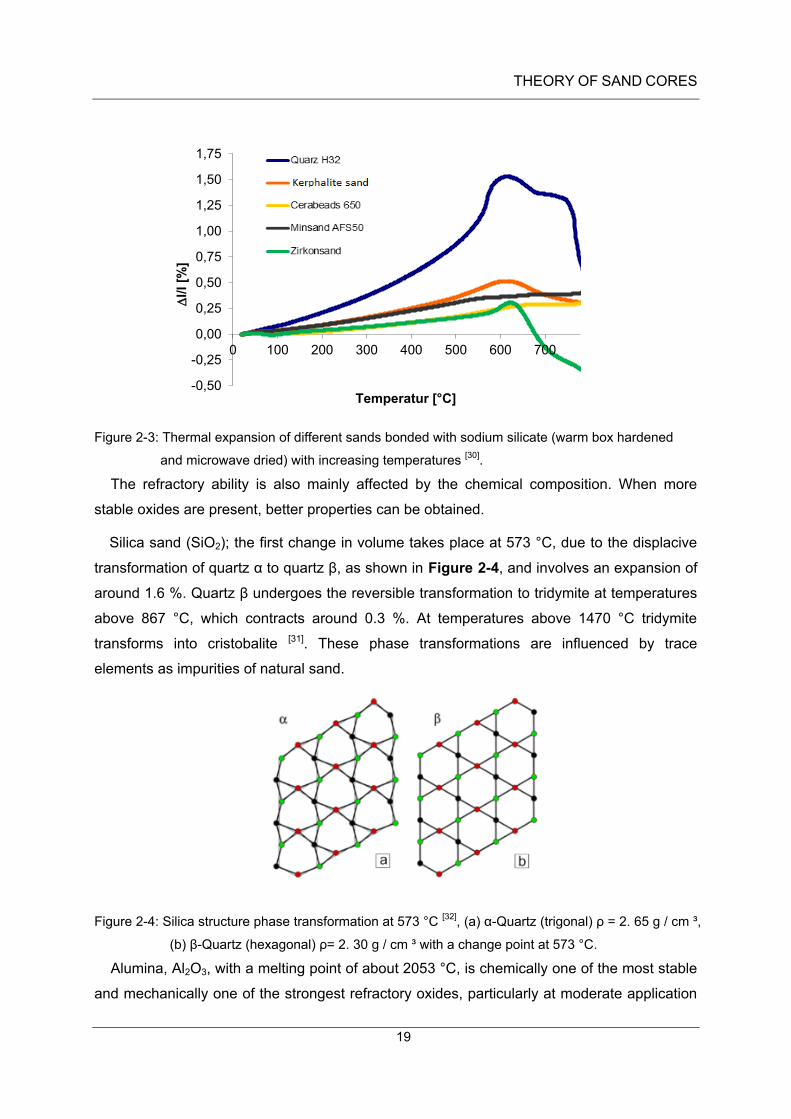
Figure 2-3 shows thermal expansions curves with temperature up to 800 °C for different
sands. The silica sands H32 show a jump in expansion to high values at about 600 °C.
Zircon sand, Cerabeads sand, and Min sand are more stable when compared to the silica
sand. This type of thermal expansions plays a significant role in the development of sand
defects.
20-300°C 20-600°C 20-800°C
Quarz sand 14 23 17
Kerphalite KF 5,3 6,5 7
Min Sand 4,2 4,5 4,8
Cerabeads 3,5 4 4,3
Zircon 3,4 4,1 4,5
δ- Al2O3 6.2 7.2 7.4
THEORY OF SAND CORES
19
Figure 2-3: Thermal expansion of different sands bonded with sodium silicate (warm box hardened
and microwave dried) with increasing temperatures [30]
.
The refractory ability is also mainly affected by the chemical composition. When more
stable oxides are present, better properties can be obtained.
Silica sand (SiO2); the first change in volume takes place at 573 °C, due to the displacive
transformation of quartz α to quartz β, as shown in Figure 2-4, and involves an expansion of
around 1.6 %. Quartz β undergoes the reversible transformation to tridymite at temperatures
above 867 °C, which contracts around 0.3 %. At temperatures above 1470 °C tridymite
transforms into cristobalite [31]. These phase transformations are influenced by trace
elements as impurities of natural sand.
Figure 2-4: Silica structure phase transformation at 573 °C [32]
, (a) α-Quartz (trigonal) ρ = 2. 65 g / cm ³,
(b) β-Quartz (hexagonal) ρ= 2. 30 g / cm ³ with a change point at 573 °C.
Alumina, Al2O3, with a melting point of about 2053 °C, is chemically one of the most stable
and mechanically one of the strongest refractory oxides, particularly at moderate application
-0,50
-0,25
0,00
0,25
0,50
0,75
1,00
1,25
1,50
1,75
0 100 200 300 400 500 600 700
Dl/l [%
]
Temperatur [°C]

THEORY OF SAND CORES
20
temperatures. Alumina is stable in oxidizing and highly reducing atmospheres and can be
used in atmospheres up to about 1800 °C. Alumina has a high thermal expansion coefficient,
as shown Table 2-3, and a relatively high thermal conductivity.
Zirconia, ZrO2, with a melting point of about 2770 °C, has an unusually low thermal
conductivity (2 W m -1 K -1) in contrast to Al2O3. It is also stable in oxidizing and moderately
reducing atmospheres and is stable in contact with many metals and oxides [33]. At a
temperature of 1200 °C and ambient pressure, a tetragonal structure becomes
thermodynamically stable. At 2377 °C, the tetragonal structure changes into a cubic calcium
fluoride structure. The mineral name zirconia is used for both the tetragonal and the cubic
structures [34].
Kerphalite (Andalusite) is a natural ore, as Hagen R., Lamy C., Myhre B. and Peng H. [35]
pointed out, it is composed of approximately 60 wt % Al2O3, and 38 wt % SiO2, plus some
inclusions containing iron and alkalis. Because of its contents of alumina and silica, this
mineral easily forms Mullite when fired at high temperature. Mullite is an attractive bonding
phase in alumina castable because its high melting point (1850 °C), and good mechanical
properties such as low thermal conductivity, low thermal expansion and good chemical
stability to be castables. Above 1280 °C, this mineral will yield 80 % of Mullite phase and 20 %
of silica glass phase. A part of this liquid phase is expelled, but most of it (around 80 %) is
confined in an interconnected capillary network in the Mullite [35].
Cerabeads (Mullite), is a refractory with chemical composition of 3Al2O3 2SiO2. Mullite is a
mineral with a very high melting temperature of 1840 °C. It is an acidic refractory mineral with
a low thermal expansion coefficient [36].
MIN sand (Bauxite) refractory as reported by Sharma B. K. [37], has quite high heat
resisting capacity, they are heat resistant from 1790 °C to 1880 °C, and can be heated up to
1700 °C 1750 °C. Min Sand is suitable as a mould material for these types of casting as it
has high refractoriness (sintering temperature > 1,950 °C), it is not prone to mould material-
metal reactions and is resistant to metal penetration even in highly thermally stressed
castings. The heat resistance of MINsand is attributed to its high alumina content [38].

THEORY OF SAND CORES
21
2.2.2 Chemical property
The pH value of a sample gives the water-soluble level of alkalinity or acidity of a given
sand. This pH value is determined by its reactivity with resins used in the casting process.
Sand with a pH value close to neutral (7.0) is the least reactive and therefore is best for core
production [39].
Figure 2-5: pH values of different base sands [40] [41]
.
The chemical properties are mainly manifested by chemical compositions, which can also
influence physical properties.
2.3 Binders
The function of the binder is to produce cohesion between the refractory grains in the
green or hardened state. Since most bonding materials are not highly refractory, the required
strength should be obtained with a minimum addition to avoid gaseous decomposition
products.
Organic binders in foundry industry are based on hot curing, gas curing and cold curing. In
hot curing, hot box and warm box can use Furan-/ Phenolic/ Urea Resin combined with
acidic hardener by heating to harden. In gas curing, epoxy with SO2 and resol with CO2 are
utilized. In cold curing, Furan/ Urea resin with acid, Phenol/ Urea resin with acid, alkaline
phenolic resin with high boiling ester are practiced [45]. The hardening of the organic binders
can be obtained by chemical hardening, this kind of hardening is by linking of molecules to
macromolecules that give the binder a fixed structure; this mechanism affects the organic
resin binders [42].
Inorganic binders are generating more interests in recent years because of their advantage
compared to commonly use organic binder systems. Their advantages include no emissions

THEORY OF SAND CORES
22
during the whole production process as well as potentially higher quality castings and less
rejects due to gas defects. Sodium silicates, also called “water glasses”, are most widely
used. Combined with the growing sensitivity to enhance environmental protection under
increasing restrictions for foundries, these advantages welcome a change from an organic
binder systems to an inorganic binder system [44].The hardening of the inorganic binders can
be obtained by drying the reaction products (crystals) [44].
2.3.1 Chemical composition of binders and promoters
In this section, the following materials will be presented: organic binders, inorganic binders,
including some promoters in the actual production process. Organic binders are focused on
resin, while inorganic binders are based on water glass with different modules. Furthermore,
water glass is discussed by different module (SiO2 / Na2O).
2.3.2 Organic binders
The established organic binder systems are based on resins with an aromatic polymer
framework. Aromatic compounds are unsaturated cyclic carbohydrates with a high thermal
stability. The aromatic backbone ensures sufficient thermal stability and a high dimensional
accuracy at a low binder addition into sands. However, aromatic compounds are also the
reason for critical emissions. Organic binder systems are used in the cold box, hot box and
warm box process.
The binder bridges exhibit distinct difference between cold box process, hot box process
and warm box process. In cold box process, binder bridges have linear structures and a
plastic behaviour, while in the warm box and hot box process binder bridges have cross-
inked structures and have a more brittle behaviour.
Cold box process
Numerous cold box processes are available and the main differences are in the chemical
binder and hardening systems, together with the sand mixing and dispensing practice
employed for both cores and block moulds. The setting time is sensitive to variations in sand
temperature, so that sand heating, sand cooling or additional adjustment may be required to
maintain the necessary process control.
THEORY OF SAND CORES
23
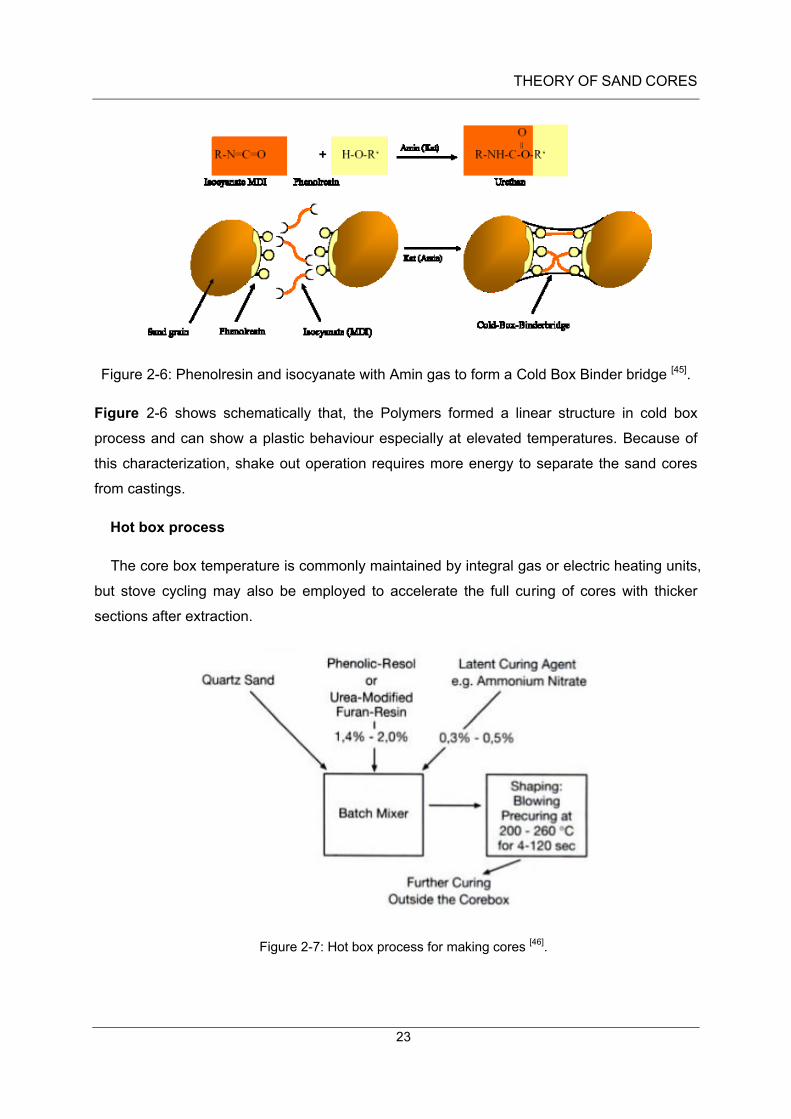
Figure 2-6: Phenolresin and isocyanate with Amin gas to form a Cold Box Binder bridge [45].
Figure 2-6 shows schematically that, the Polymers formed a linear structure in cold box
process and can show a plastic behaviour especially at elevated temperatures. Because of
this characterization, shake out operation requires more energy to separate the sand cores
from castings.
Hot box process
The core box temperature is commonly maintained by integral gas or electric heating units,
but stove cycling may also be employed to accelerate the full curing of cores with thicker
sections after extraction.
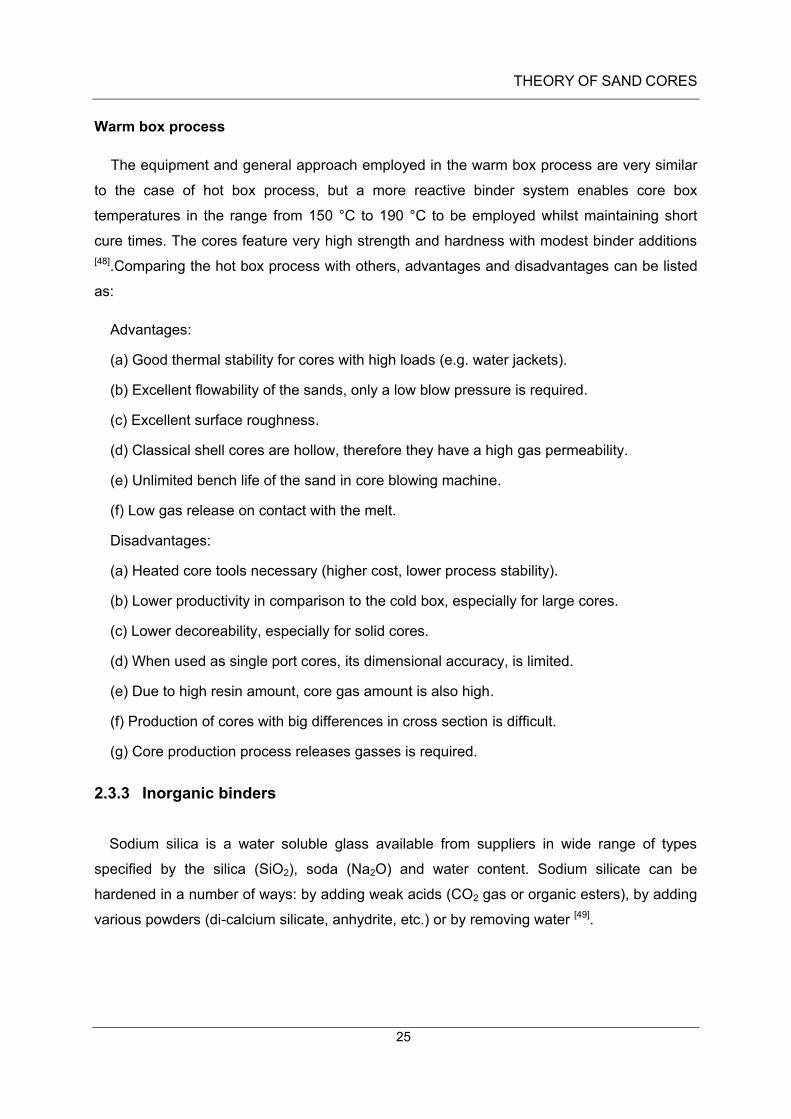
Figure 2-7: Hot box process for making cores [46]
.

THEORY OF SAND CORES
24
Figure 2-7 shows hot box core making process. The binder is an aqueous Phenolic –
Resol or Urea – modified Furan – Resin, the catalyst is an aqueous solution of ammonium
salts, usually chloride and bromide. Sand is mixed with the liquid resin and catalyst and
blown into a heated core box. The heat liberates acid vapour from the catalyst which triggers
the hardening reaction. Hardening continues after removal of the core from the box causing
the sand to be cured throughout. As reported by Brown J. [47], in Aluminum casting, special
hot box resins are available which beak down readily at aluminum casting temperature. And
in ferrous casting, cores are usually coated to prevent burn – on. The rather high nitrogen
can cause gas holes and fissures in iron casting and additions of 1 – 3 % of a coarse grained
form of iron oxide are often used to minimize N – defects.
Figure 2-8: Urea and formaldehyde with phenol/furan resin and ammonium isolate as a latent coring
agent under heating to form a Hot Box Binder Bridge [45]
.
Figure 2-8 points out that, formed Polymers have a cross-inked structure and have a
brittle behaviour but higher stability at elevated temperatures. Because of this
characterization, shake out operation needs less energy to separate the sand cores from
casting.
THEORY OF SAND CORES
25
Warm box process
The equipment and general approach employed in the warm box process are very similar
to the case of hot box process, but a more reactive binder system enables core box
temperatures in the range from 150 °C to 190 °C to be employed whilst maintaining short
cure times. The cores feature very high strength and hardness with modest binder additions
[48].Comparing the hot box process with others, advantages and disadvantages can be listed
as:
Advantages:
(a) Good thermal stability for cores with high loads (e.g. water jackets).
(b) Excellent flowability of the sands, only a low blow pressure is required.
(c) Excellent surface roughness.
(d) Classical shell cores are hollow, therefore they have a high gas permeability.
(e) Unlimited bench life of the sand in core blowing machine.
(f) Low gas release on contact with the melt.
Disadvantages:
(a) Heated core tools necessary (higher cost, lower process stability).
(b) Lower productivity in comparison to the cold box, especially for large cores.
(c) Lower decoreability, especially for solid cores.
(d) When used as single port cores, its dimensional accuracy, is limited.
(e) Due to high resin amount, core gas amount is also high.
(f) Production of cores with big differences in cross section is difficult.
(g) Core production process releases gasses is required.
2.3.3 Inorganic binders
Sodium silica is a water soluble glass available from suppliers in wide range of types
specified by the silica (SiO2), soda (Na2O) and water content. Sodium silicate can be
hardened in a number of ways: by adding weak acids (CO2 gas or organic esters), by adding
various powders (di-calcium silicate, anhydrite, etc.) or by removing water [49].

THEORY OF SAND CORES
26
Sodium silicate as binder
Sodium silicate is one of the most common binders used in air setting or self-hardening
processes for moulding and core making. The CO2 process, ferrosilicon process, cement
process, dicalcium silicate process, and others make use of sodium silicate as binder, along
with a solid or gaseous hardener. The water glass consist of three basic compounds: H2O,
SiO2 and Na2O (or K2O). With increasing ratios of SiO2 to Na2O (SiO2 / Na2O), the viscosity of
water glass increases [52].The varieties suitable for the CO2 process should contain total
soluble silica (SiO2) of 26 to 32%; total alkalinity (as Na2O) of 11 to 13%, mass
ratio( SiO2/Na2O) of about 2.2. [50].Water glass is an aqueous solution with alkali silicate, with
the chemical composition of xSiO2·yM2O·zH2O. For M, alkali ions can be Li+, K+, or Na+ [51].
As listed in Table 2-4, a module (SiO2 / Na2O) under 2.5 reduces the beginning strength,
but increases the ultimate strength of the cores and thus making decoring more difficult.
A module over 2.5 increases the beginning strength, but reduces the ultimate strength,
thus favoring the disintegration during decoring. In practice, therefore, a modulus of about
2.5 is used as a compromise value [52].
Table 2-4: Properties of water glass module in the sand core [52]
.
Properties Water glass module(SiO2 : Na2O)
> 2.5 < 2.5
Viscosity ↑ ↓
Reactivity ↑ ↓
Alkali amount ↓ ↑
CO2 consumptions ↓ ↑
Over hardened ↑ ↓
Beginning strength ↑ ↓
Ultimate strength ↓ ↑
Disintegration ↑ ↓
THEORY OF SAND CORES
27
Water glass-CO2-Process
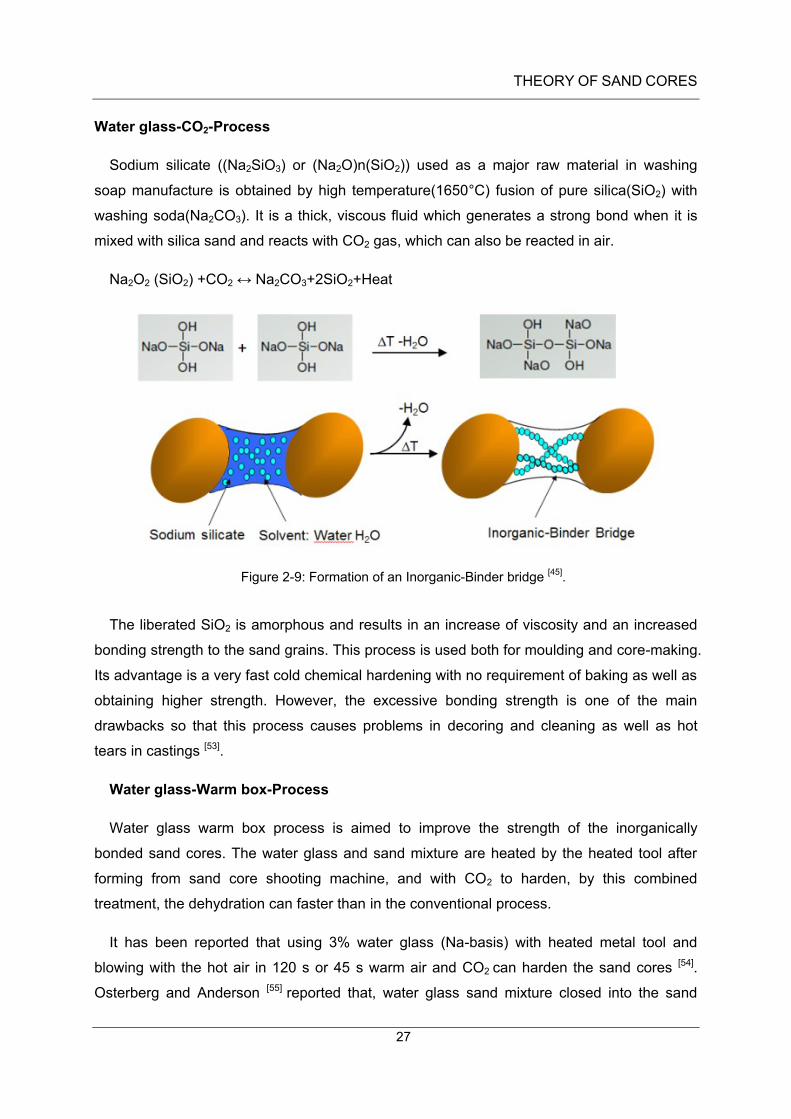
Sodium silicate ((Na2SiO3) or (Na2O)n(SiO2)) used as a major raw material in washing
soap manufacture is obtained by high temperature(1650°C) fusion of pure silica(SiO2) with
washing soda(Na2CO3). It is a thick, viscous fluid which generates a strong bond when it is
mixed with silica sand and reacts with CO2 gas, which can also be reacted in air.
Na2O2 (SiO2) +CO2 ↔ Na2CO3+2SiO2+Heat
Figure 2-9: Formation of an Inorganic-Binder bridge [45]
.
The liberated SiO2 is amorphous and results in an increase of viscosity and an increased
bonding strength to the sand grains. This process is used both for moulding and core-making.
Its advantage is a very fast cold chemical hardening with no requirement of baking as well as
obtaining higher strength. However, the excessive bonding strength is one of the main
drawbacks so that this process causes problems in decoring and cleaning as well as hot
tears in castings [53].
Water glass-Warm box-Process
Water glass warm box process is aimed to improve the strength of the inorganically
bonded sand cores. The water glass and sand mixture are heated by the heated tool after
forming from sand core shooting machine, and with CO2 to harden, by this combined
treatment, the dehydration can faster than in the conventional process.
It has been reported that using 3% water glass (Na-basis) with heated metal tool and
blowing with the hot air in 120 s or 45 s warm air and CO2 can harden the sand cores [54].
Osterberg and Anderson [55] reported that, water glass sand mixture closed into the sand

THEORY OF SAND CORES
28
mould box with temperature from 130°C-150°C, meanwhile, blowing 120 seconds hot air or
CO2, the strength can obviously be improved.
2.3.4 Dehydration
In all these processes, binders, which own the water solubility, have the reactions with
additives or thermal energy. After the hardening process, moisture still exist in the sand
cores. This results to less strength, compared to organic binder systems.
A drying process gives the possibility to improve the strength by dehydration. Dehydration
can be achieved by many different mechanisms: drying by hot air, drying by a hot tool and
drying by a microwave oven, etc. [56].
2.4 Thermal properties
Thermal conductivity
Thermal conductivity of the mould material is particularly crucial for the cooling rate of a
casting part. Besides other factors (e.g. melt cleaning, degassing, grain refinement,
modification, a correct fluid flow and the feeding technique) cooling rate has a large influence
on the obtained microstructure. In general, higher cooling rates generate fine grains, small
secondary dendrite arms in the microstructure, and thereby improved which in turn cause
superior mechanical properties.
The thermal conductivity of the mould determines the heat removal from the solidifying
casting when inaccurate data are used, the observed microstructure may develop quite
differently to that expected from the simulation [57].
Temperature diffusivity
Thermal diffusivity α (m 2 s -1) is another value to measure the heat removal velocity. It
indicates the time interval of the temperature, which can be described by
𝛼 = 𝜆
𝜌∗𝐶𝑝 (eq. 1)
𝑏 = √𝜆 ∗ 𝐶𝑝 ∗ 𝜌 (eq. 2)

THEORY OF SAND CORES
29
The heat penetration coefficient b (J / m2s 0.5 K) is the measurement for the rate of amount
of heat flow, which influences the solidification in the foundry process [58].
After pouring a pure metal into an insulating mould (sand or ceramic) at pouring
temperature TP, the temperature along a line perpendicular to the mould- metal interface can
be described as shown in Figure 2-10.
Figure 2-10: Temperature along a line perpendicular to the mould-metal interface [59]
.
In this case, the high thermal conductivity of the solidified metal results in the temperature of
the metal at the interface dropping to Tm instantly upon pouring and staying there until
solidification is complete. Intimate contact between the metal and mould means that the
mould at the interface will also remain at Tm until solidification is complete [59].
2.5 Mechanical properties of sand cores
After a casting has been solidified and cooled down sufficiently in an expendable mould,
the first step is freeing the casting from the mould. This operation is called as the ‘shake out
operation’. Because a great deal of heat and dust are involved in this operation. Shake out is
usually done by means of vibratory knockouts, jolting grids and vibrators [60]. The mould is
intensively jolted and broken up. The various cleaning operation usually performed on a
casting are enumerated and discussed below: (1) rough cleaning (2) surface cleaning (3)
trimming (4) finishing [61].

THEORY OF SAND CORES
30
Due to the reasons mentioned above ‘shake out operation’ or ‘Decoring’ is done
mechanically in closed atmosphere. Hammering and vibrating will loosen and break up cores.
Stationary or portable vibrators are employed for this purpose. To knockout cores from heavy
castings, it is advantageous to use air drills [62].
The energy required for successfully shake out of cores depends on the type of binder
bridges between the sand particles, which will be part of the investigation here.

EXPERIMENTAL METHODS
31
3 Experimental Methods
This chapter illustrates the methods to determine raw sands properties and sand cores
properties, as well as technological tests of thermal physical properties obtained by iterated
reverse simulation. These technological tests are ‘dipping trail’, ’ring mould’ and ‘Semi-sealed
mould test’, which can be related to actual casting processes. Magma 5 software was used
to simulate the heat conductivity in quartz sand and compare those with the ‘dipping trail’
experiments for different sand cores. A method is described to measure the decoring and
shake out behaviour of different sand cores after solidification. In order to further investigate
the morphology of raw sands and the characterizations of binders’ bridges of sand cores,
optical microscopy and scanning electron microscopy equipped with energy-dispersive X-ray
spectroscopy (SEM / EDX) were used.
3.1 Properties of raw sands
The grain size distribution of sands was measured by the granulometry using a sieve
analysis. The shapes and the surface morphology of raw sands were investigated separately
with optical microscopy (NIS-Elements 3.0) and SEM / EDX.
3.1.1 Grain size distribution
The size distribution is often of critical importance to cores and moulding sands. A sieve
analysis (or gradation test) is a procedure used to assess the particle size distribution (also
called gradation) of a granular material [63]. A sieve shaker with parameters in Table 3-1 was
used. In this experiment, the meshes are according to DIN ISO 3310/1 with a mesh size of
63 µm, 90 µm, 125 µm, 180 µm, 250 µm, 250 µm, 355 µm, 500 µm, 710 µm, 1000 µm and
1400 µm, respectively.
EXPERIMENTAL METHODS
32
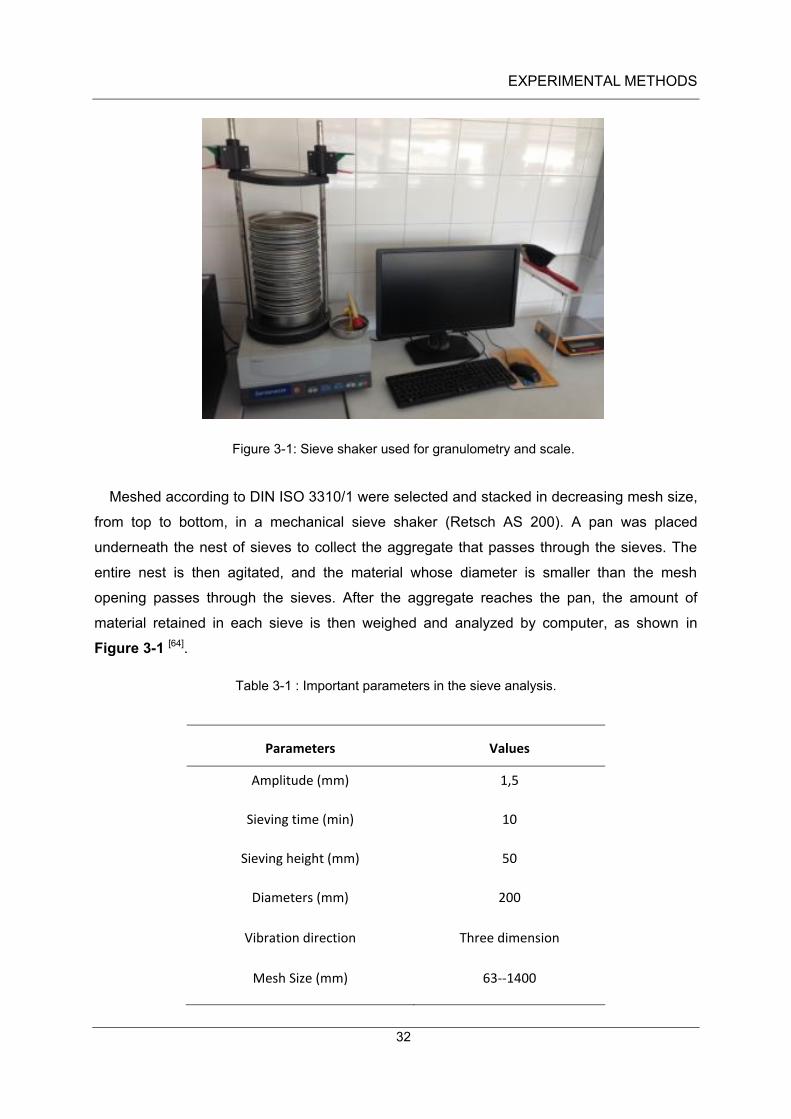
Figure 3-1: Sieve shaker used for granulometry and scale.
Meshed according to DIN ISO 3310/1 were selected and stacked in decreasing mesh size,
from top to bottom, in a mechanical sieve shaker (Retsch AS 200). A pan was placed
underneath the nest of sieves to collect the aggregate that passes through the sieves. The
entire nest is then agitated, and the material whose diameter is smaller than the mesh
opening passes through the sieves. After the aggregate reaches the pan, the amount of
material retained in each sieve is then weighed and analyzed by computer, as shown in
Figure 3-1 [64].
Table 3-1 : Important parameters in the sieve analysis.
Parameters Values
Amplitude (mm) 1,5
Sieving time (min) 10
Sieving height (mm) 50
Diameters (mm) 200
Vibration direction Three dimension
Mesh Size (mm) 63--1400

EXPERIMENTAL METHODS
33
3.1.2 Grain morphology 2D-shape factor
This parameter is used to define the roundness of an object. When the value is less than 1,
this indicates a less rounded particle. A 2D-shape factor according to Sf = 4π (area) /
(convex hull perimeter) 2. NIS-Elements 3.0 was used to measure the values.
Figure 3-2: Binary shape of zircon sand particels.
Figure 3-2 shows the image analysis method used highlighting the morphology and size of
an imported REM image REM. The shape factor values were determined by NIS-Elements
3.0 software, particles are more rounded if these values are close to 1.0.
3.1.3 Optical microscopy
Optical microscopy together with the stereomicroscopy (Leica Discovery. V 2.0 (Figure
3-3 (a)) with a version of Axiovison Rel.4.8) was used to analyze the surface, colour, shape
and glossiness of sands in order to differentiate between sands.

EXPERIMENTAL METHODS
34
Figure 3-3: (a) Optical microscopy equipment (Zeiss discovery 2.0), (b) SEM / EDX equipment.
3.1.4 Scanning electron microscopy
SEM / EDX (FEI-Qanta 200), as shown in Figure 3-3 (b), was used to observe the surface
and shape of raw sands, and also to measure the chemical composition by EDX in order to
distinguish the classifications and properties. Furthermore, SEM / EDX was also used to
observe the bond methods and fracture surfaces of ‘binder bridges’, which has a significant
influence on thermal properties and mechanical properties.
3.2 Technological investigation of thermal physical properties
Technological investigation of thermal physical properties were performed by ‘ring mould
tests’, ‘dipping trial’ and ‘semi-sealed moulding test’. The dipping trials were performed to test
the temperature distributions over time in sand cores submerged into a melt to compare
thermal conductivities in different sand cores. An infinite heat supply was experimentally
established as a boundary condition. With a steel ring mould at about 200 °C as a starting
temperature, the temperature distribution over time during the ‘ Ring mould test’ can be
expected to be very close to the casting process such as in the Rotacast process, with the
aim to optimize cooling rates at central cores of cylinder heads. In the semi-sealed moulding
test experiments, it is also necessary to obtain the temperature over time in the centre of
different sand cores obtained during solidification, which can be used to calibrate simulation
models. Thereby, the temperature distribution in the sand cores with the subsequent
decoring behaviour can be compared.

EXPERIMENTAL METHODS
35
3.2.1 Core making process
Cylindrical sand cores for dipping trials and ring mould tests and trapezoidal sand cores
were formed by a core shooting machine (Roperwerk Type: H11) in a preheated mould
(warm box process at 150 °C). Outer cores were formed in a wooden mould using the
inorganically cold box process (water glass+CO2).
Cylindrical sand cores: H32 silica sands / Cerabeads sands / MIN sands / Kerphalite
sands / Zircon sands were separately mixed with 2.5 wt. % water glass Betol® 39 T (see in
Table 3-2) in a batch mixture (Zimmerman) for 2 minutes. A cylindrical shaped mould
(Diameter 50mm and Height 25mm) was fixed on the core shooting machine and preheated
before shooting operation at 6-8 bar. After 5 minutes, the cylindrical shaped mould was held
for the sufficient hardening (Figure 3-4 (b)).
Trapezoidal sand cores: H32 silica sand was mixed wither with two organic (see in Table
3-2) and three different inorganic binders (see in Table 3-2) in a batch mixture
(Zimmermann). The trapezoidal shaped mould was fixed on the core shooting machine and
preheated before shooting. After shooting, the trapezoidal shape mould was held for 5
minutes to harden the cores (Figure 3-4 (c)).
Figure 3-4: (a) Core shooting machine with the preheated mould (b). Installed cylindrical shape mould
(c) Installed trapezoidal shape mould.
The mixed sands were shoot by a core shooting machine with 6-8 bars into the trapezoidal
mould, which was preheated to the required parameters (Table 3-2). After 5 minutes drying
in preheated mould, a trapezoidal sand core was formed.
a b c
EXPERIMENTAL METHODS
36
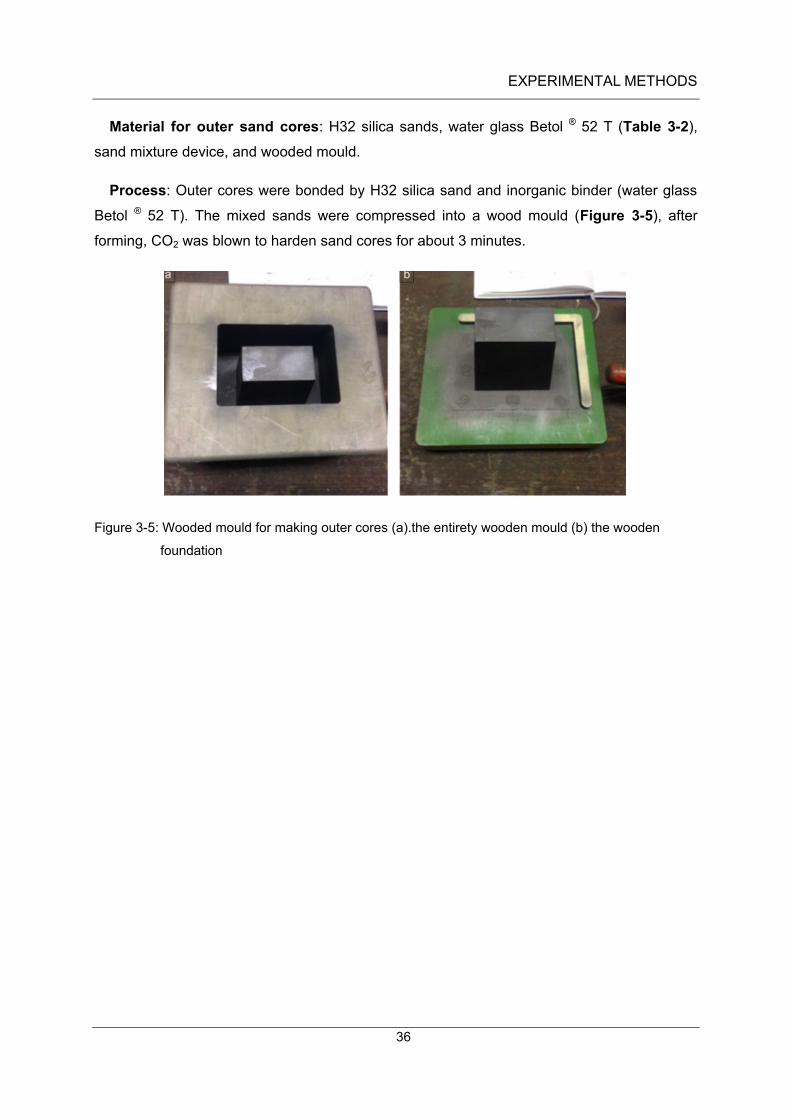
Material for outer sand cores: H32 silica sands, water glass Betol ® 52 T (Table 3-2),
sand mixture device, and wooded mould.
Process: Outer cores were bonded by H32 silica sand and inorganic binder (water glass
Betol ® 52 T). The mixed sands were compressed into a wood mould (Figure 3-5), after
forming, CO2 was blown to harden sand cores for about 3 minutes.
Figure 3-5: Wooded mould for making outer cores (a).the entirety wooden mould (b) the wooden
foundation

EXPERIMENTAL METHODS
37
Table 3-2: The parameters of producing five investigated internal cores.
Sand core Base sand Binder Temperature Time
Organically bonded sand core with modified urea-furan-phenolic resin using the warm box
process H32 silica sand 0.35 % urea-furan-phenolic resin 190 ± 10 °C 5 mins
Organically bonded sand core with an aqueous solution of phenol sulfonic acid, aluminum salts,
sulfuric acid using warm box process H32 silica sand
0.25 % aqueous solution of phenol sulfonic acid, aluminum salts, sulfuric acid
195 ± 10 °C 5 mins
Inorganically bonded sand core with modified silicate binder mixture and promoter (INOTEC
TM -
Promoter WJ 4000) using the warm box process H32 silica sand
2.2 % modified silicate binder mixture and promoter (INOTECTM - Promoter WJ 4000)
180 ± 25 °C 5 mins
Inorganically bonded sand core with modified silicate binder mixture and promoter (Inotec
Promoter EP 4174) using warm box process H32 silica sand
2.2 % silicate binder mixture and promoter (Inotec Promoter EP 4174)
190 ± 25 °C 5 mins
Inorganically bonded sand core with water glass 39T
@ using the warm box process
H32 silica sand 2.5 % water glass 39T @ 190 ± 25 °C 5 mins
Inorganically bonded sand core with water glass 52T @ using water glass CO2 process
H32 silica sand 3.0 % water glass 52T @ - 5 mins
EXPERIMENTAL METHODS
38
3.2.2 Dipping trials
3.2.2.1 Dipping trial of cylindrical sand core
Dipping trials were used to test the heat transport behavior of different sands submerged
in an Al melt at constant temperatures.
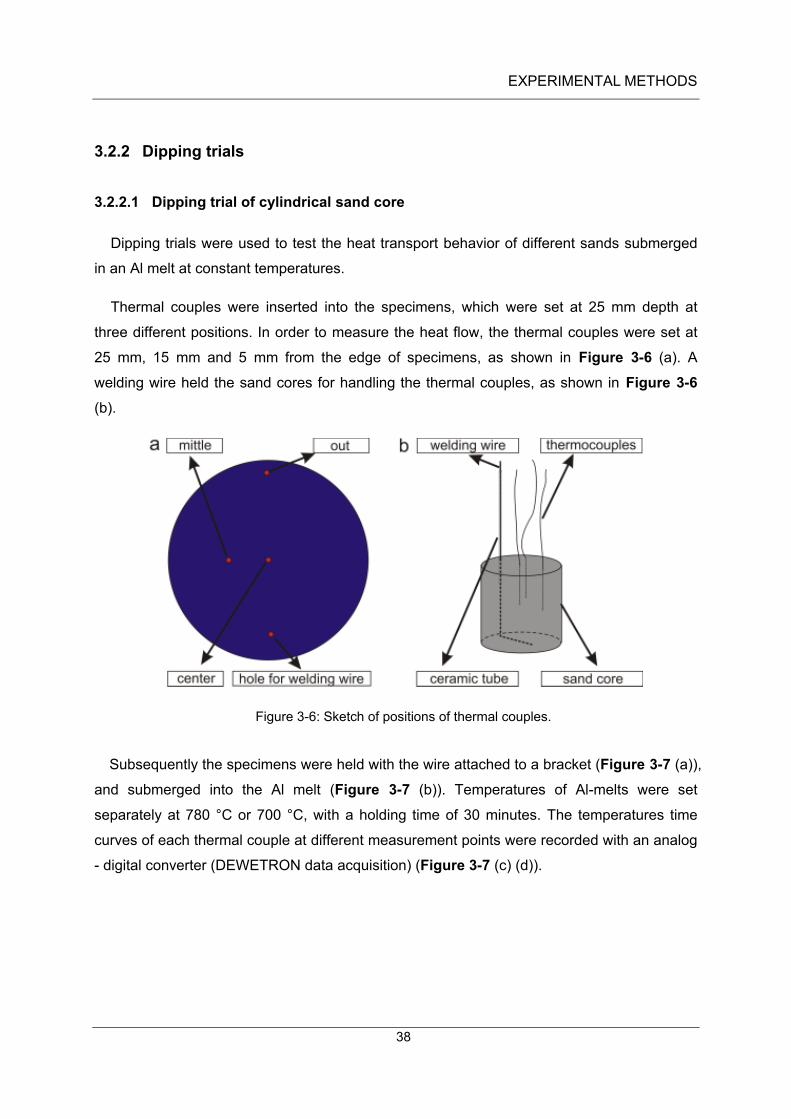
Thermal couples were inserted into the specimens, which were set at 25 mm depth at
three different positions. In order to measure the heat flow, the thermal couples were set at
25 mm, 15 mm and 5 mm from the edge of specimens, as shown in Figure 3-6 (a). A
welding wire held the sand cores for handling the thermal couples, as shown in Figure 3-6
(b).
Figure 3-6: Sketch of positions of thermal couples.
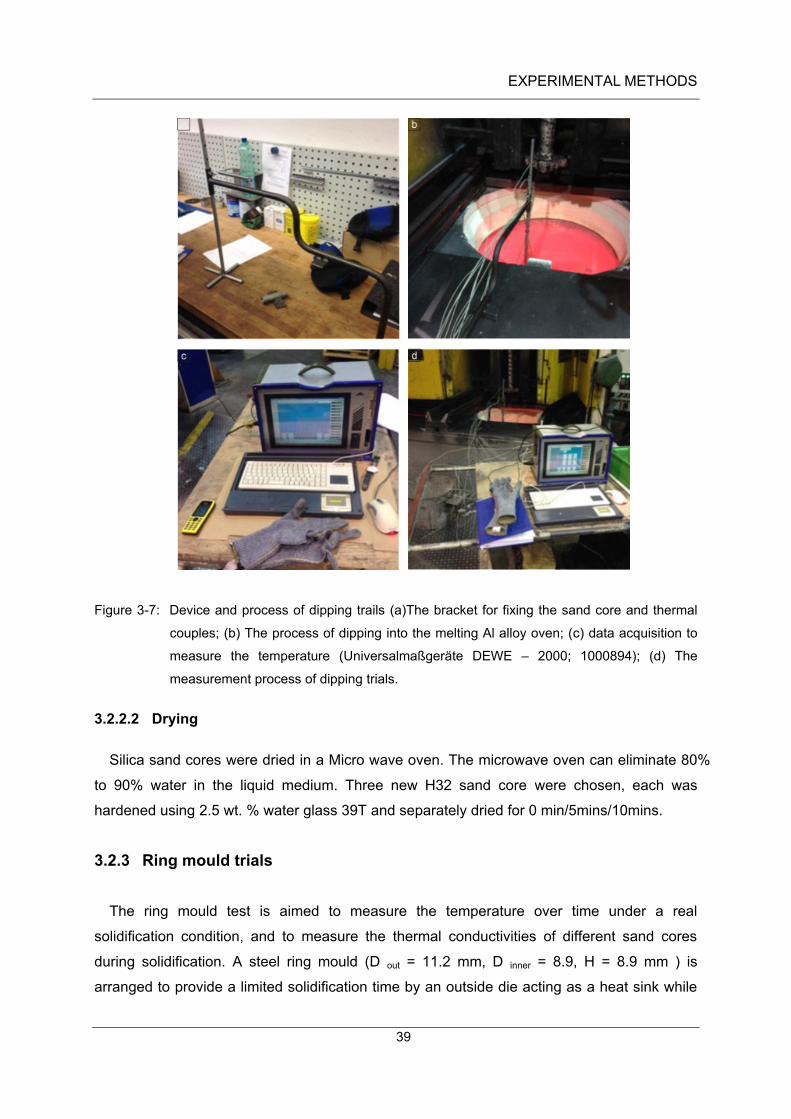
Subsequently the specimens were held with the wire attached to a bracket (Figure 3-7 (a)),
and submerged into the Al melt (Figure 3-7 (b)). Temperatures of Al-melts were set
separately at 780 °C or 700 °C, with a holding time of 30 minutes. The temperatures time
curves of each thermal couple at different measurement points were recorded with an analog
- digital converter (DEWETRON data acquisition) (Figure 3-7 (c) (d)).
EXPERIMENTAL METHODS
39
Figure 3-7: Device and process of dipping trails (a)The bracket for fixing the sand core and thermal
couples; (b) The process of dipping into the melting Al alloy oven; (c) data acquisition to
measure the temperature (Universalmaßgeräte DEWE – 2000; 1000894); (d) The
measurement process of dipping trials.
3.2.2.2 Drying
Silica sand cores were dried in a Micro wave oven. The microwave oven can eliminate 80%
to 90% water in the liquid medium. Three new H32 sand core were chosen, each was
hardened using 2.5 wt. % water glass 39T and separately dried for 0 min/5mins/10mins.
3.2.3 Ring mould trials
The ring mould test is aimed to measure the temperature over time under a real
solidification condition, and to measure the thermal conductivities of different sand cores
during solidification. A steel ring mould (D out = 11.2 mm, D inner = 8.9, H = 8.9 mm ) is
arranged to provide a limited solidification time by an outside die acting as a heat sink while

EXPERIMENTAL METHODS
40
the temperature distribution was measured in a cylindrical core located in the centre of the
ring mould. Thereby these tests can be used to simulate a real casting condition, for example,
the Rotacast process. The design of the cores was similar to that used in ‘dipping trials’,
however without welding wires.
Figure 3-8: Sketch of the ring mould test with thermal couples. (a) Three thermal couples fixed into
sand core and linked one thermal couples between steel ring mould and sand core
The sand cores with three thermal couples at 5 mm, 15 mm and 25 mm were set at the
centre of a preheated ring steel ring (Figure 3-8 (a)) to 200 °C. A further thermal couple to
measure the ring mould temperature during solidification was implemented. Figure 3-8 (b)
shows the sand cores and the steel ring placed on the top of a refractory plate, and the Al –
melt poured into the semi – enclosed space between ring mould and sand core. Figure 3-8
(c) shows the device during the solidification.
The temperature of the casting alloy was set at about 720 °C-740 °C, while the ring mould
temperature was preheated to 200 °C. Experiments were stopped after 30 minutes. The
temperatures over time in the core and the steel ring were recorded with a data acquisition
system.
3.3 Mechanical properties
Shake out operation after casting is a significant process, which can impact the production
efficiency in foundries. The retained strength of sand moulds is related to the base sand,
binder, additives, and temperature exposure.
EXPERIMENTAL METHODS
41
3.3.1 Semi-sealed mould test – casting box
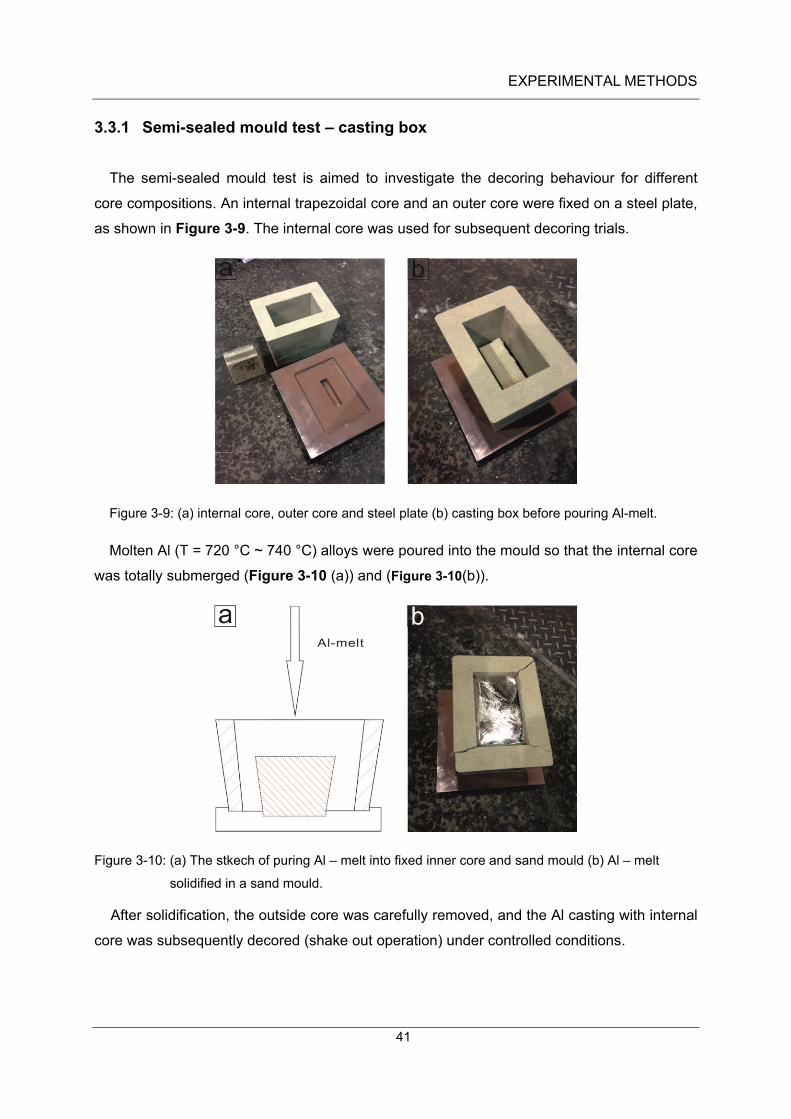
The semi-sealed mould test is aimed to investigate the decoring behaviour for different
core compositions. An internal trapezoidal core and an outer core were fixed on a steel plate,
as shown in Figure 3-9. The internal core was used for subsequent decoring trials.
Figure 3-9: (a) internal core, outer core and steel plate (b) casting box before pouring Al-melt.
Molten Al (T = 720 °C ~ 740 °C) alloys were poured into the mould so that the internal core
was totally submerged (Figure 3-10 (a)) and (Figure 3-10(b)).
Figure 3-10: (a) The stkech of puring Al – melt into fixed inner core and sand mould (b) Al – melt
solidified in a sand mould.
After solidification, the outside core was carefully removed, and the Al casting with internal
core was subsequently decored (shake out operation) under controlled conditions.
EXPERIMENTAL METHODS
42
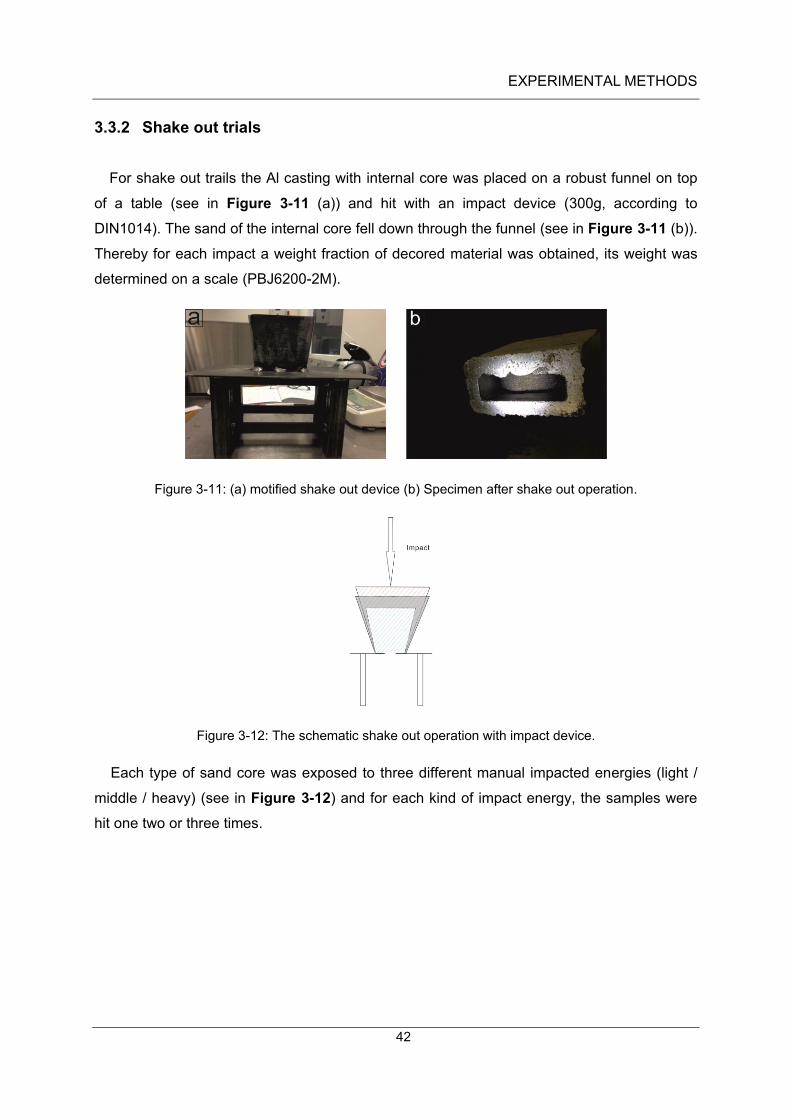
3.3.2 Shake out trials
For shake out trails the Al casting with internal core was placed on a robust funnel on top
of a table (see in Figure 3-11 (a)) and hit with an impact device (300g, according to
DIN1014). The sand of the internal core fell down through the funnel (see in Figure 3-11 (b)).
Thereby for each impact a weight fraction of decored material was obtained, its weight was
determined on a scale (PBJ6200-2M).
Figure 3-11: (a) motified shake out device (b) Specimen after shake out operation.
Figure 3-12: The schematic shake out operation with impact device.
Each type of sand core was exposed to three different manual impacted energies (light /
middle / heavy) (see in Figure 3-12) and for each kind of impact energy, the samples were
hit one two or three times.
EXPERIMENTAL METHODS
43
3.4 Simulation of dipping trial
MAGMA 5 has well-developed thermal and fluid dynamic codes which can be used to
predict shrinkage and gas porosity as well as stresses during solidification. Thermal
properties correction and boundary condition justification can be performed due to the
solidification simulation results [65]. MAGMA5 software was used to obtain thermal
conductivity λ values for different sand cores. Thereby the temperature time curves at
defined locations can be calculated for quartz sand and related to other sand based on their
thermal physical properties (thermal conductivity λ, density ρ, and heat capacity Cp).
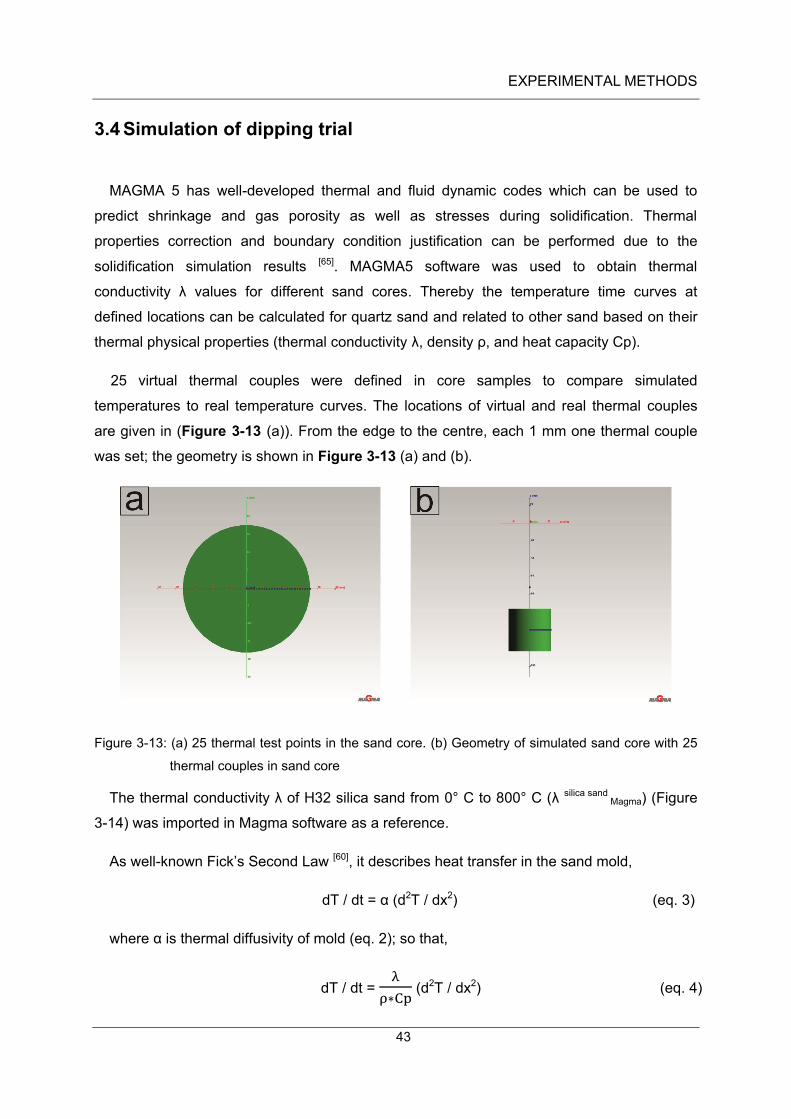
25 virtual thermal couples were defined in core samples to compare simulated
temperatures to real temperature curves. The locations of virtual and real thermal couples
are given in (Figure 3-13 (a)). From the edge to the centre, each 1 mm one thermal couple
was set; the geometry is shown in Figure 3-13 (a) and (b).
Figure 3-13: (a) 25 thermal test points in the sand core. (b) Geometry of simulated sand core with 25
thermal couples in sand core
The thermal conductivity λ of H32 silica sand from 0° C to 800° C (λ silica sand Magma) (Figure
3-14) was imported in Magma software as a reference.
As well-known Fick’s Second Law [60], it describes heat transfer in the sand mold,
dT / dt = α (d2T / dx2) (eq. 3)
where α is thermal diffusivity of mold (eq. 2); so that,
dT / dt = λ
ρ∗Cp (d2T / dx2) (eq. 4)

EXPERIMENTAL METHODS
44
A quotient Q was defined as a coefficient to adjust the thermal conductivity λ sand cores till the
simulated and experimental dT / dt (temperature time curves) overlapped. So eq. 4 shorted
as
(dT / dt) silica sand in Magma = Q ∗ λ silica sand in Magma
ρ∗Cp (d2T / dx2) (eq. 5)
where Q * λ silica sand in Magma was defined as the thermal conductivity of the investigated sand
cores, density ρ and specific (Table A - 21) heat capacity Cp (from Table A – 16 to Table -
20) were as given values, according to (eq. 5), thermal conductivities of the investigated
sand cores were defined as λ MIN sand = Q MIN sand × λ silica sand Magma, λ Cerabeads sand = Q Cerabeads sand ×
λ silica sand Magma, λ Kerphalite sand = Q Kerphalite sand × λ silica sand
Magma, λ Zircon sand = Q Zircon sand × λ silica sand
Magma, λ silica sand = Q silica sand × λ silica sand Magma, so if the (dT / dt) simulation and (dT / dt) experiment
overlapped by controlling Q values, the thermal conductivities of investigated sand cores
were obtained.
Figure 3-14: λ silica sand value with temperature.
0,4
0,5
0,6
0,7
0,8
0,9
1,0
0 100 200 300 400 500 600 700 800
Lam
bd
a[W
/mK
]
Temperature[°C]

RESULTS
45
4 Results
In this chapter the morphology of the raw sands and the binder bridges in sand cores were
investigated using optical microscopy and SEM. The thermal and mechanical experiment
results were obtained by ‘dipping trials’, ‘ring mould trials’ and ‘semi-sealed mould tests’ in
thermal experiments and by a scaled down mechanical shake out operation in decoring
experiments.
4.1 Raw sands
4.1.1 Grain size distribution
Grain size distributions of five different sands were obtained by sieve analysis described in
Chapter 3. The grain size distributions are shown in Table A-1, Table A-2, Table A-3, Table
A-4 and Table A-5 and are illustrated in Figure 4-1.
Figure 4-1: Grain size distribution of five different base sands.

RESULTS
46
Figure 4-2: Grain size distribution by weight in five investigated raw sands. (a) H32 silica sand grain
size distribution (b) Cerabeads sand grain size distribution (c) Kerphalite sand grain size
distribution (d) MIN sand grain size distribution (e) Zircon sand grain size distribution.
As shown in Figure 4-1 and Figure 4-2, grain sizes in these five sands were mainly
distributed between 90 µm and 710 µm. For the silica sand H32, the grain size distribution
ranged from 125 µm to 180 µm at 17.9 wt. %, from 180 µm to 250 µm at 45.4 wt. %, from
250 µm to 355 µm at 26.6 wt. %, larger than 355 µm over 6 wt. %. For the dark spheroidal
Min sand, the grain size distribution ranged from 125 µm to 180 µm at 29.8 wt. %, from 180
RESULTS
47
µm to 250 µm at 30.3 wt. %, from 250 µm to 355 µm at 31.1 wt. %, and over 355 µm, or
smaller 125 µm at 4 wt. %. For the yellowish spheroidal Cerabeads sand, the grain size
distribution ranged from 125 µm to 180 µm at 33.3 wt. %, from 180 µm to 250 µm at 43.8
wt. %, from 250 µm to 355 µm at 18.6 wt. %. For the synthetic gray Kerphalite sand, the
grain size distribution ranged from 125 µm to 180 µm at 33.9 wt. %, from 180 µm to 250 µm
at 27.0 wt. %, from 250 µm to 355 µm at 20.3 wt. %, below 125 µm at about 10 wt. %. For
the Zircon sand, the grain size distribution ranged from 125 µm to 180 µm at 36.82 wt. %,
from 180 µm to 250 µm at 49.39 %, from 250 µm to 355 µm at 8.9 wt. %, below 125 µm of
about 5 wt. %.
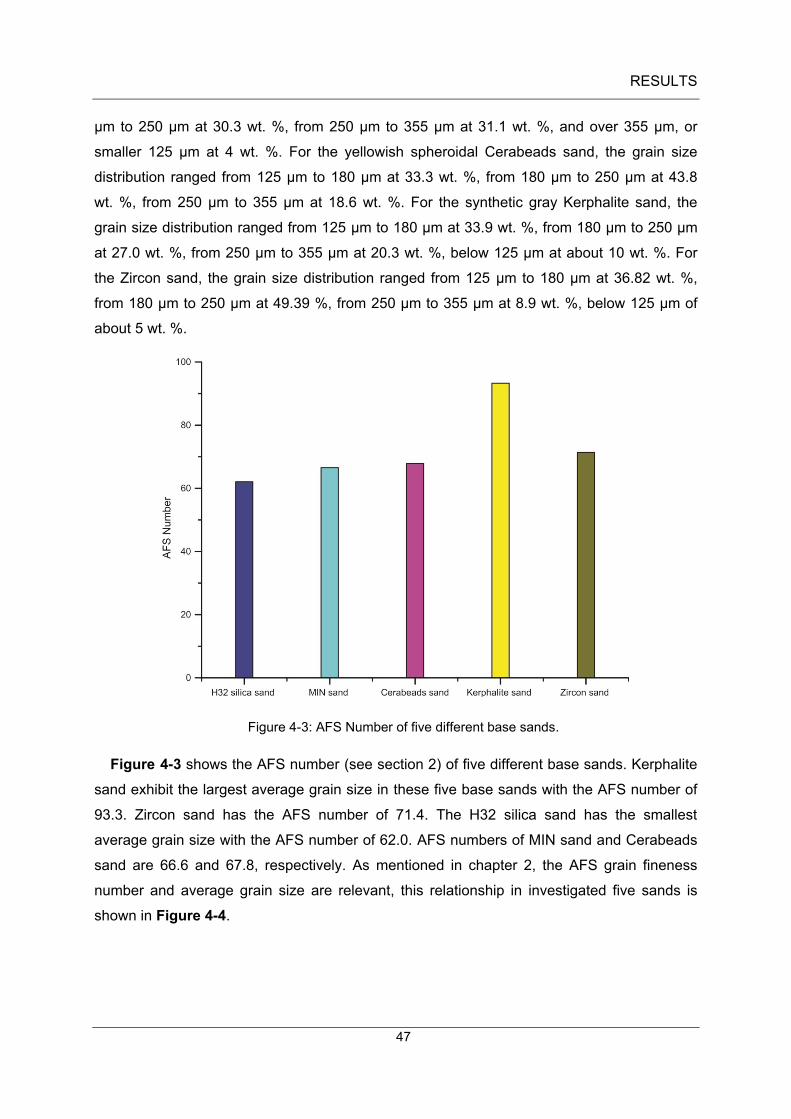
Figure 4-3: AFS Number of five different base sands.
Figure 4-3 shows the AFS number (see section 2) of five different base sands. Kerphalite
sand exhibit the largest average grain size in these five base sands with the AFS number of
93.3. Zircon sand has the AFS number of 71.4. The H32 silica sand has the smallest
average grain size with the AFS number of 62.0. AFS numbers of MIN sand and Cerabeads
sand are 66.6 and 67.8, respectively. As mentioned in chapter 2, the AFS grain fineness
number and average grain size are relevant, this relationship in investigated five sands is
shown in Figure 4-4.
RESULTS
48
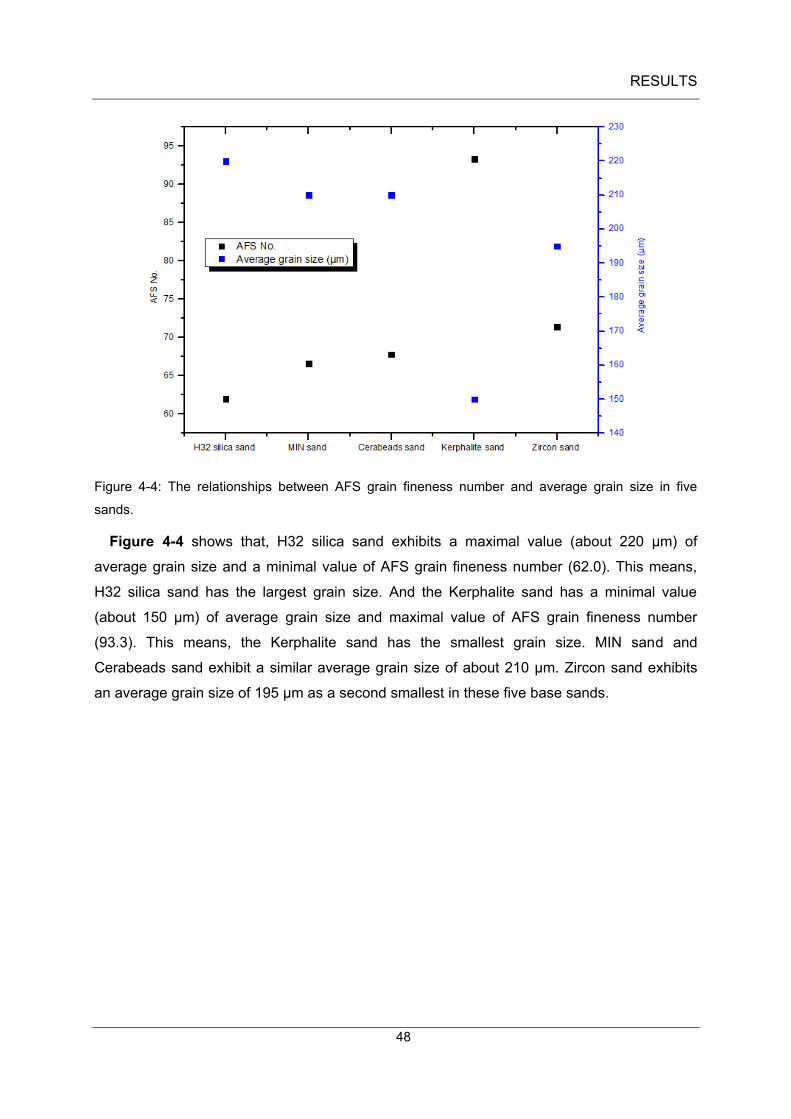
Figure 4-4: The relationships between AFS grain fineness number and average grain size in five
sands.
Figure 4-4 shows that, H32 silica sand exhibits a maximal value (about 220 μm) of
average grain size and a minimal value of AFS grain fineness number (62.0). This means,
H32 silica sand has the largest grain size. And the Kerphalite sand has a minimal value
(about 150 μm) of average grain size and maximal value of AFS grain fineness number
(93.3). This means, the Kerphalite sand has the smallest grain size. MIN sand and
Cerabeads sand exhibit a similar average grain size of about 210 μm. Zircon sand exhibits
an average grain size of 195 μm as a second smallest in these five base sands.

RESULTS
49
4.1.2 Grain morphology 2D-Shape factor
2D-shape factors of five base sands were measured manually of scanning electronic
micrograph as described in Chapter 3. Red zones covered the manually chosen sand
particles. The shape factor was calculated for each highlighted red zone, as shown in Figure
4-5.
Figure 4-5: Tested sand particles in each base sand to measure shape factor (a) Cerabeads sand (b)
H32 silica new sand (c) Kerphalite sand (d) MIN sand (e) Zircon sand.
In Figure 4-5, examples of sand particles in each base sand to measure shape factor are
shown. The covered red areas are the manually chosen sand particles for roundness
analysis.
RESULTS
50
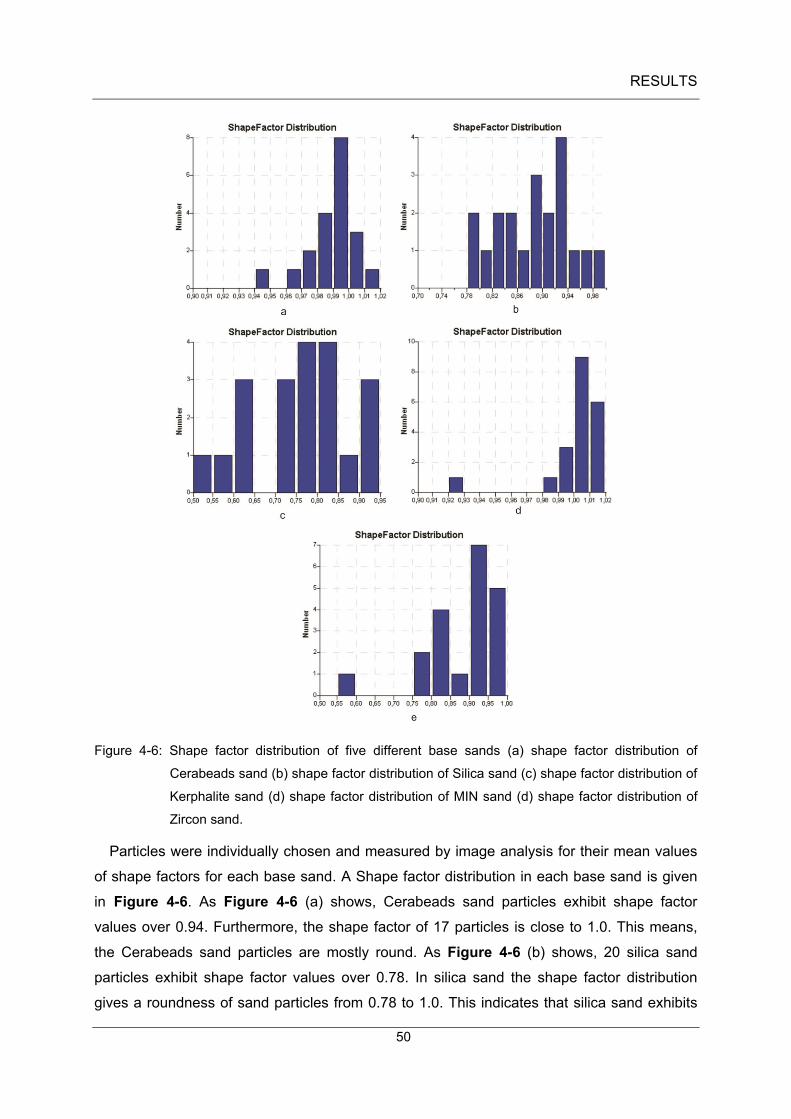
Figure 4-6: Shape factor distribution of five different base sands (a) shape factor distribution of
Cerabeads sand (b) shape factor distribution of Silica sand (c) shape factor distribution of
Kerphalite sand (d) shape factor distribution of MIN sand (d) shape factor distribution of
Zircon sand.
Particles were individually chosen and measured by image analysis for their mean values
of shape factors for each base sand. A Shape factor distribution in each base sand is given
in Figure 4-6. As Figure 4-6 (a) shows, Cerabeads sand particles exhibit shape factor
values over 0.94. Furthermore, the shape factor of 17 particles is close to 1.0. This means,
the Cerabeads sand particles are mostly round. As Figure 4-6 (b) shows, 20 silica sand
particles exhibit shape factor values over 0.78. In silica sand the shape factor distribution
gives a roundness of sand particles from 0.78 to 1.0. This indicates that silica sand exhibits
RESULTS
51
also some irregular sand particles. As Figure 4-6 (c) shows, Kerphalite sand particles have
shape factor values less than 0.65, others are distributed between 0.75 and 0.95. As Figure
4-6 (d) shows, one MIN sand particle has a shape factor value less than 0.60, others are all
around 1.0. These values indicate that, MIN sand exhibit mostly regular round particles, with
some exception. As Figure 4-6 (d) shows, Zircon sand particle exhibits a shape factor value
less than 0.60. Others are unevenly distributed from 0.75 to 1.0.
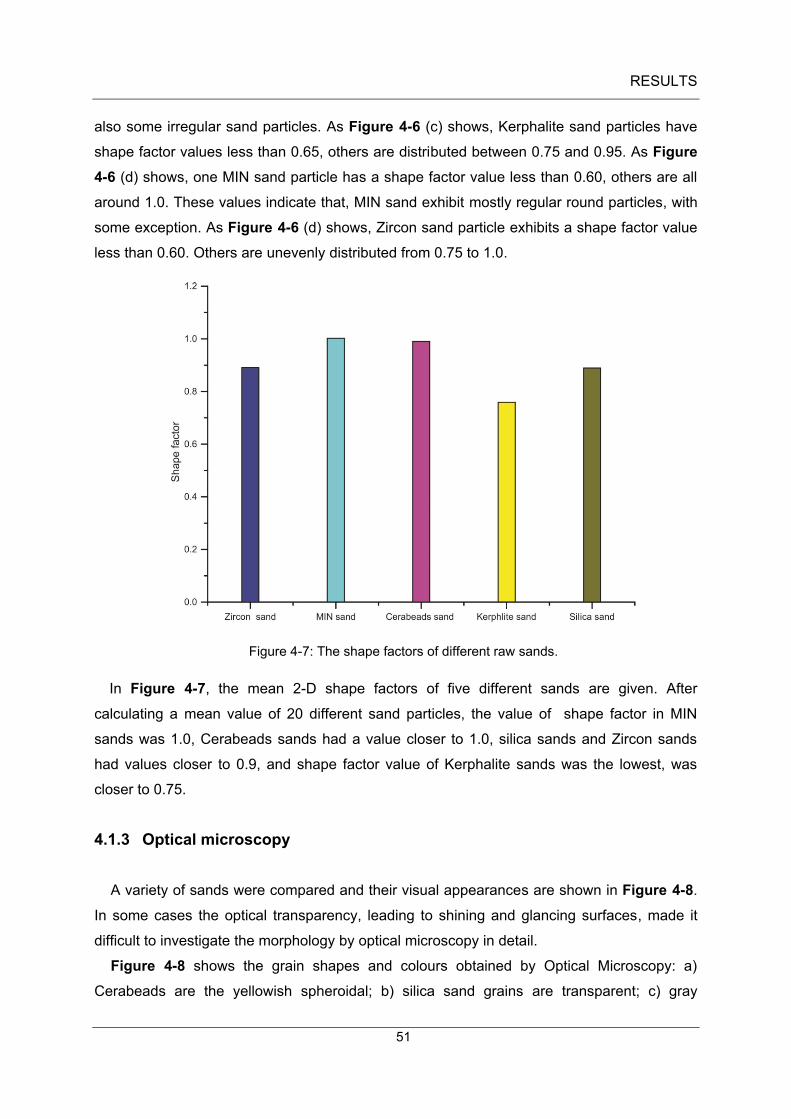
Figure 4-7: The shape factors of different raw sands.
In Figure 4-7, the mean 2-D shape factors of five different sands are given. After
calculating a mean value of 20 different sand particles, the value of shape factor in MIN
sands was 1.0, Cerabeads sands had a value closer to 1.0, silica sands and Zircon sands
had values closer to 0.9, and shape factor value of Kerphalite sands was the lowest, was
closer to 0.75.
4.1.3 Optical microscopy
A variety of sands were compared and their visual appearances are shown in Figure 4-8.
In some cases the optical transparency, leading to shining and glancing surfaces, made it
difficult to investigate the morphology by optical microscopy in detail.
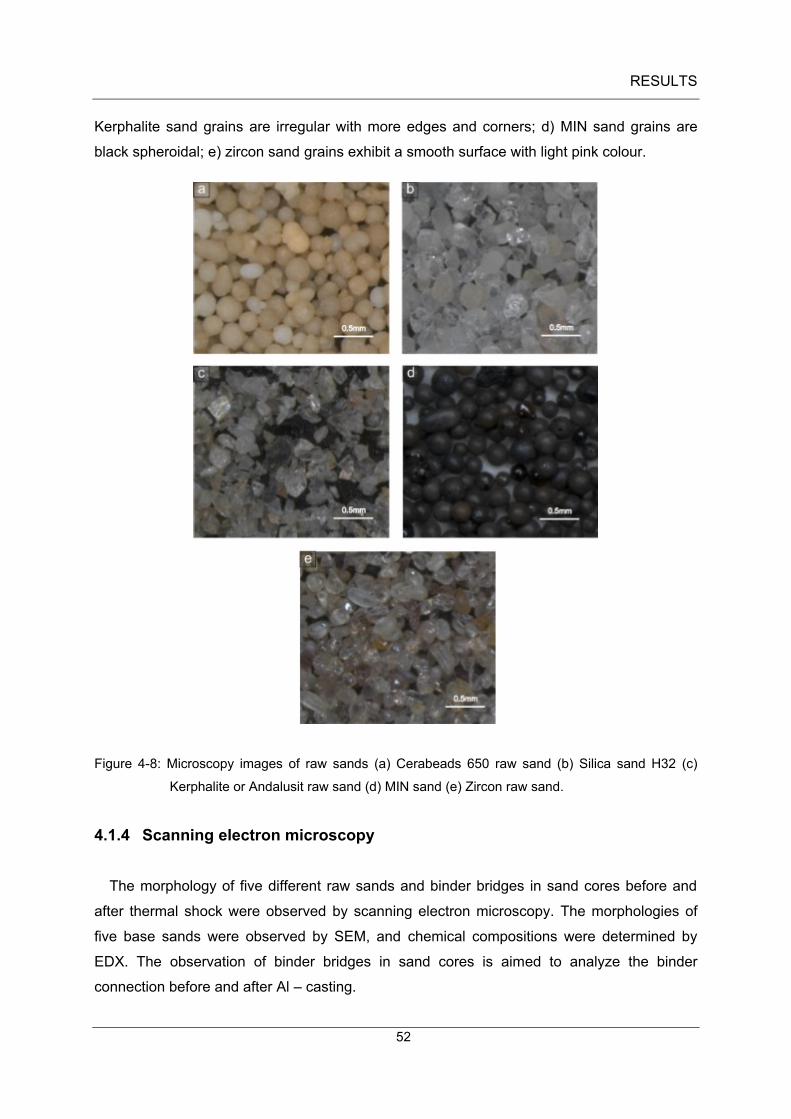
Figure 4-8 shows the grain shapes and colours obtained by Optical Microscopy: a)
Cerabeads are the yellowish spheroidal; b) silica sand grains are transparent; c) gray
RESULTS
52
Kerphalite sand grains are irregular with more edges and corners; d) MIN sand grains are
black spheroidal; e) zircon sand grains exhibit a smooth surface with light pink colour.
Figure 4-8: Microscopy images of raw sands (a) Cerabeads 650 raw sand (b) Silica sand H32 (c)
Kerphalite or Andalusit raw sand (d) MIN sand (e) Zircon raw sand.
4.1.4 Scanning electron microscopy
The morphology of five different raw sands and binder bridges in sand cores before and
after thermal shock were observed by scanning electron microscopy. The morphologies of
five base sands were observed by SEM, and chemical compositions were determined by
EDX. The observation of binder bridges in sand cores is aimed to analyze the binder
connection before and after Al – casting.

RESULTS
53
4.1.4.1 Raw sands
Figure 4-9 (a) and Figure 4-9 (b) show synthetic Cerabeads sand grains exhibiting a
rounder shape than silica sand grains as illustrated by the shape factor (Figure 4-7). The
morphology was mainly round and in some cases agglomerates led to irregular particles, as
shown in Figure 4-9 (c). The surface of Cerabeads sand shows a microstructure with a fine
surface roughness (Figure 4-9(d)).
Figure 4-9: Different sand particles of Cerabeads raw sand (a) Different size of rounded sand particles
(b) Single particles and bonded particles (c) morphology of sand particle (d) surface of
Cerabeads sand particle.
RESULTS
54
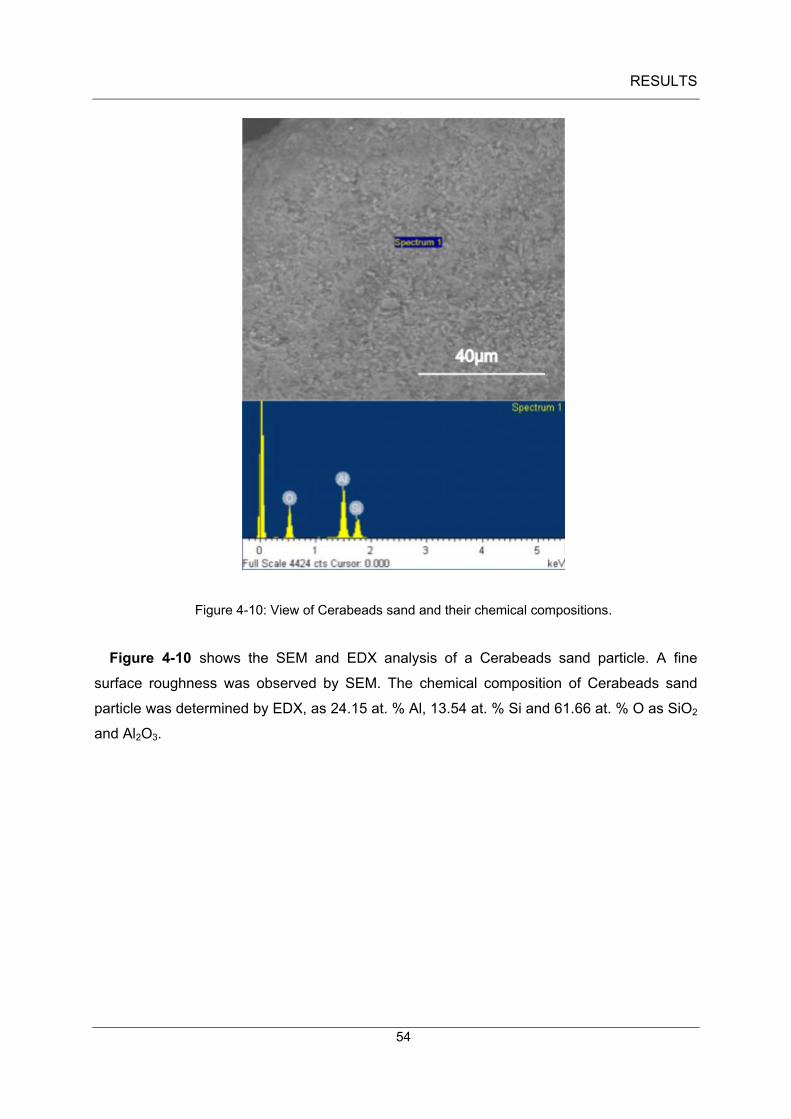
Figure 4-10: View of Cerabeads sand and their chemical compositions.
Figure 4-10 shows the SEM and EDX analysis of a Cerabeads sand particle. A fine
surface roughness was observed by SEM. The chemical composition of Cerabeads sand
particle was determined by EDX, as 24.15 at. % Al, 13.54 at. % Si and 61.66 at. % O as SiO2
and Al2O3.

RESULTS
55
Figure 4-11 shows the observed smooth surfaces with some fractured rough areas of
silica sand. The irregular shape is shown in Figure 4-11 (a). Figure 4-11 (b) shows some
rough fractured surface on the silica sand particle surface. Figure 4-11 (c) shows an irregular
sand particle with distinct faces. Figure 4-11 (d) shows a round grain with a smooth surface.
Figure 4-11: Different sand particles of H32 raw sand (a) Shapes of H32 silica sands (b) rough surface
and fracture (c) the particle with distinct faces (d) smooth round surface.

RESULTS
56
Figure 4-12: The fractured surface and groove on silica sand particle and its chemical compositions.
Figure 4-12 shows SEM and EDX analysis of a silica sand particle. A fracture on the
surface was observed by SEM. The chemical composition of silica sand particle was
determined by EDX, as Si of 36.15 at. % and O of 63.85 at. %, silica sand H32 contains
mostly SiO2.
RESULTS
57
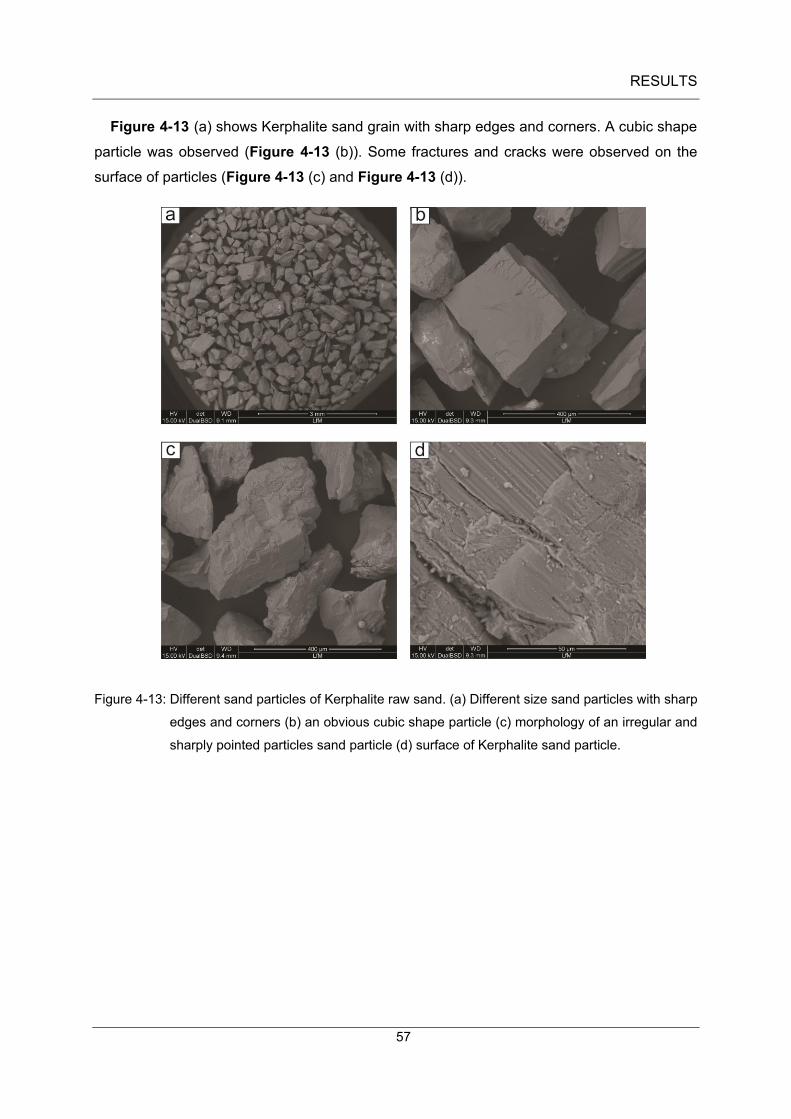
Figure 4-13 (a) shows Kerphalite sand grain with sharp edges and corners. A cubic shape
particle was observed (Figure 4-13 (b)). Some fractures and cracks were observed on the
surface of particles (Figure 4-13 (c) and Figure 4-13 (d)).
Figure 4-13: Different sand particles of Kerphalite raw sand. (a) Different size sand particles with sharp
edges and corners (b) an obvious cubic shape particle (c) morphology of an irregular and
sharply pointed particles sand particle (d) surface of Kerphalite sand particle.
RESULTS
58
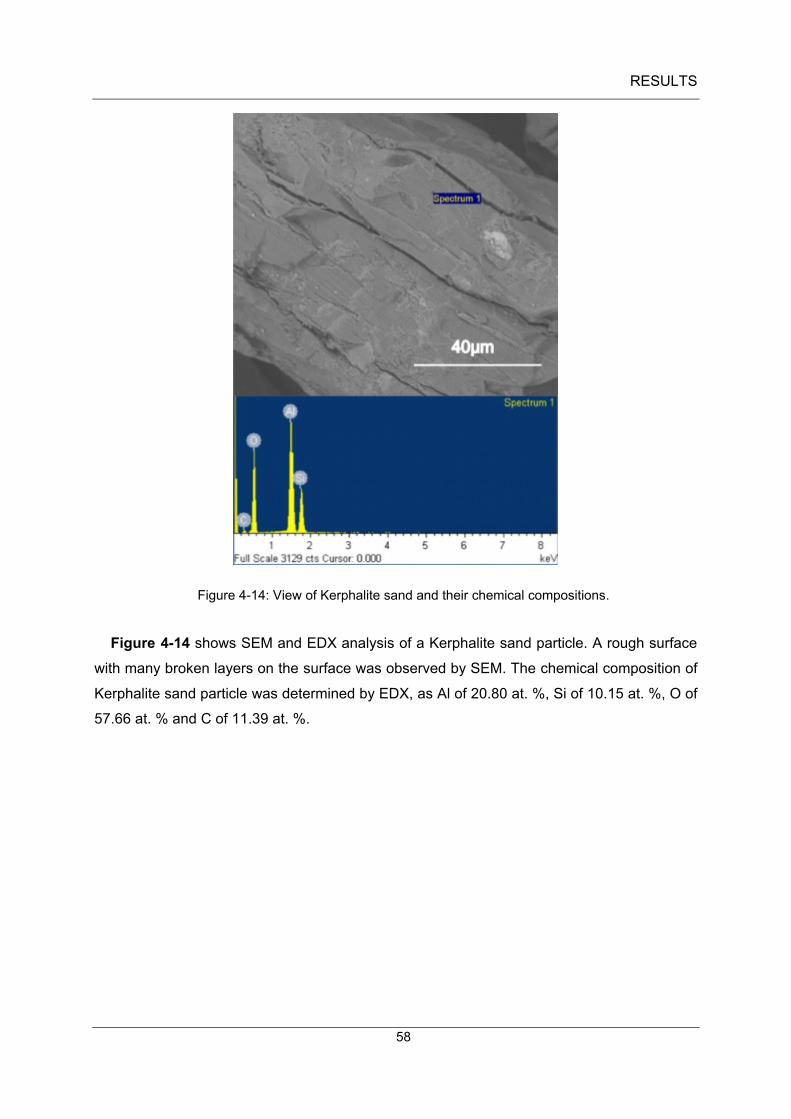
Figure 4-14: View of Kerphalite sand and their chemical compositions.
Figure 4-14 shows SEM and EDX analysis of a Kerphalite sand particle. A rough surface
with many broken layers on the surface was observed by SEM. The chemical composition of
Kerphalite sand particle was determined by EDX, as Al of 20.80 at. %, Si of 10.15 at. %, O of
57.66 at. % and C of 11.39 at. %.

RESULTS
59
Figure 4-15 (a) shows different sizes of round MIN sand particles. Figure 4-15 (b) shows
different surface morphologies of MIN sand particles, which were observed near to perfect
spheroidal. Agglomerated particles were also observed as shown in Figure 4-15 (c). Also a
dendrite structure resulting from some Al2O3 growth was observed on the surface (Figure
4-15 (d)).
Figure 4-15: Different sand particles of MIN raw sand. (a) Different size sand particles with round
particles (b) some spheroidal particles (c) Agglomeration of two particles (d) surface of
MIN sand particle
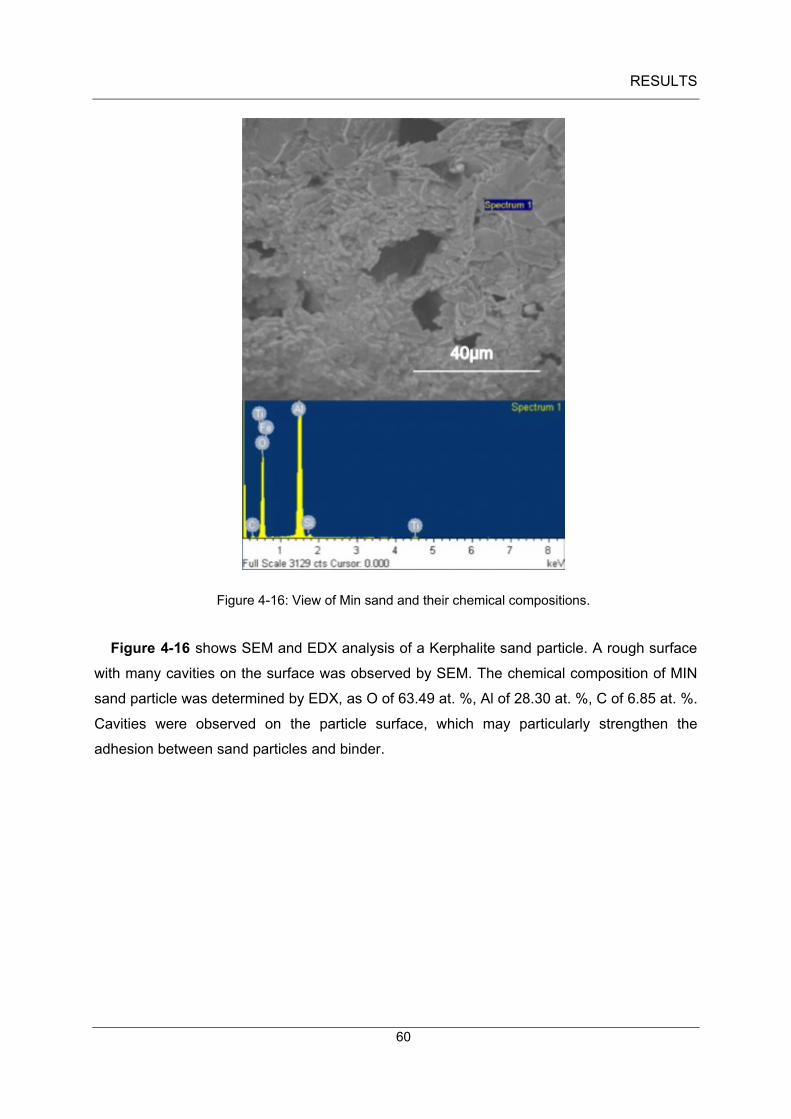
RESULTS
60
Figure 4-16: View of Min sand and their chemical compositions.
Figure 4-16 shows SEM and EDX analysis of a Kerphalite sand particle. A rough surface
with many cavities on the surface was observed by SEM. The chemical composition of MIN
sand particle was determined by EDX, as O of 63.49 at. %, Al of 28.30 at. %, C of 6.85 at. %.
Cavities were observed on the particle surface, which may particularly strengthen the
adhesion between sand particles and binder.

RESULTS
61
Figure 4-17 (a) shows irregular shaped zircon sand particles with rounded edges. Zircon
sand grains exhibit pre-fractures and grooves on the surfaces as shown in Figure 4-17 (b),
some particles exhibit round edges and cleaved fracture surface as shown in Figure 4-17 (c)
and smooth surface was observed as shown in Figure 4-17 (d).
Figure 4-17: Different sand particles of Zircon raw sand (a) Rounded edges irregular particles (b) pre-
fractures and grooves on the surfaces (c) fractures on the surface (d) smooth surface.

RESULTS
62
Figure 4-18: the Micro view of zircon sand and chemical compositions.
Figure 4-18 show shows SEM and EDX analysis of a zircon sand particle. A smooth
surface with the broken edges was observed by SEM. The chemical composition of the
zircon sand particle was determined by EDX, as Zr of 10.8 at. %, Si of 9.91 at. %, O of 65.30
at. % and C of 14 at. %.

RESULTS
63
4.1.4.2 Organically bonded sand cores
Organically bonded sand cores were produced with modified urea-furan-phenolic resin (as
shown in Fehler! Verweisquelle konnte nicht gefunden werden. and Fehler! Verweisquelle
konnte nicht gefunden werden.) using the warm box process. A second batch of organically
bonded sand cores were produced with an aqueous solution of phenol sulfonic acid,
aluminum salts, sulfuric acid (Fehler! Verweisquelle konnte nicht gefunden werden. and
Fehler! Verweisquelle konnte nicht gefunden werden.) using the warm box process. The
rganic binder bridges exhibit different morphologies before and after contact with the Al melt.
Figure 4-19: (a) and (b) Organically bonded sand core with modified urea-furan-phenolic resin using
the warm box process before casting, (c) a crack in the binder bridge between two sand
particles after Al casting (d) broken binder bridges with fully covered intersection and
partly covered intersection.
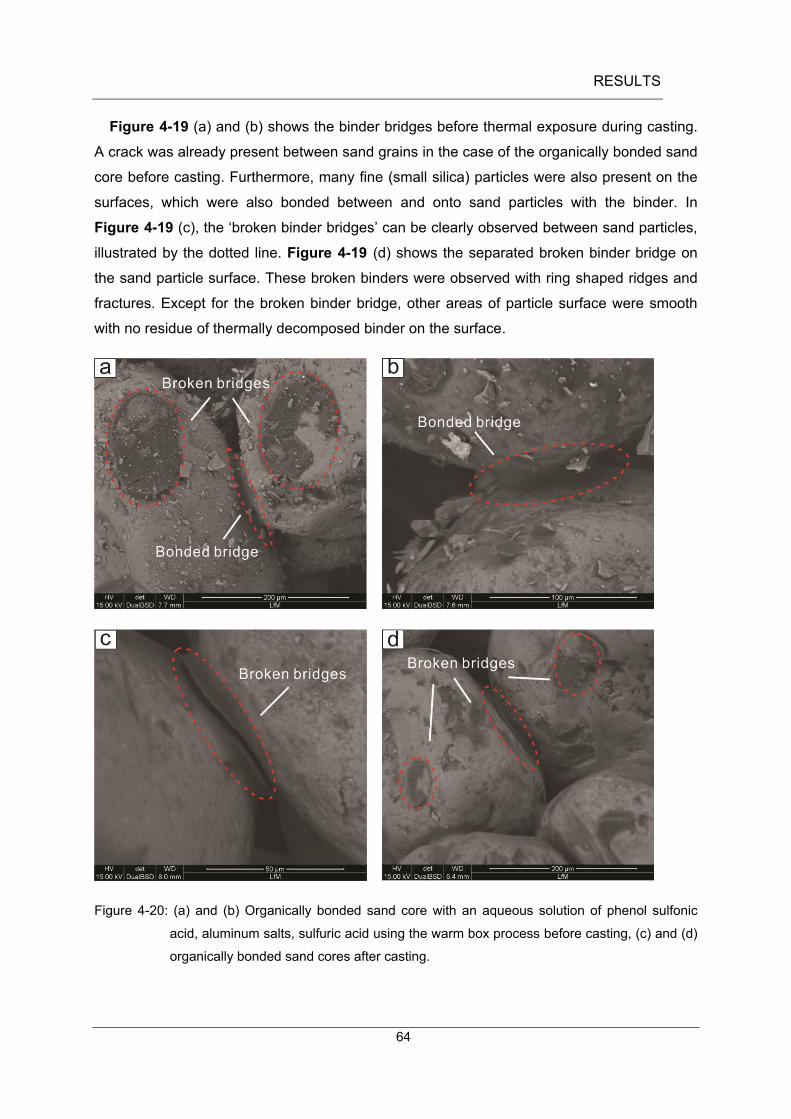
RESULTS
64
Figure 4-19 (a) and (b) shows the binder bridges before thermal exposure during casting.
A crack was already present between sand grains in the case of the organically bonded sand
core before casting. Furthermore, many fine (small silica) particles were also present on the
surfaces, which were also bonded between and onto sand particles with the binder. In
Figure 4-19 (c), the ‘broken binder bridges’ can be clearly observed between sand particles,
illustrated by the dotted line. Figure 4-19 (d) shows the separated broken binder bridge on
the sand particle surface. These broken binders were observed with ring shaped ridges and
fractures. Except for the broken binder bridge, other areas of particle surface were smooth
with no residue of thermally decomposed binder on the surface.
Figure 4-20: (a) and (b) Organically bonded sand core with an aqueous solution of phenol sulfonic
acid, aluminum salts, sulfuric acid using the warm box process before casting, (c) and (d)
organically bonded sand cores after casting.

RESULTS
65
Figure 4-20 (a) and (b) shows the organically bonded sand cores before thermal exposure.
It can clearly be seen that, two binder bridges were broken in Figure 4-20 (a). While in
Figure 4-20 (b), the binder bridges between particles are still holding the particles together.
Otherwise, SiO2 fine particles (many small particles on the surface) were also observed.
Figure 4-20 (c) shows the obviously broken binder bridge between two particles. In Figure
4-20 (d), surfaces were cleaner after thermal exposure with smooth surface without binder
bridges, while the binder bridges were broken into two parts. Some binder bridges are
connected to the sand; the other one is adhered to other sands, which was similar to
organically bonded sand cores with modified urea-furan-phenolic resin in warm box process.
4.1.4.3 Inorganically bonded sand cores
Two types of inorganically bonded sand cores were both bonded with same modified
silicate binder mixture but with different promoters (see chapter 3, in Fehler! Verweisquelle
konnte nicht gefunden werden. ). The inorganically binder was pure water glass (39T). All
these inorganic binder cores were produced by the warm box process. The binder bridge
connection before and after casting were observed by SEM. They exhibit distinct differences
from the organically bonded cores.
Figure 4-21: (a) and (b) Inorganically bonded sand core with modified silicate binder mixture and
promoter (INOTECTM
- Promoter WJ 4000) using the warm box process before casting.
Figure 4-21 (a) shows that inorganic binder covered the sand particles. At a contact point
between two sand grains the excess binder resulted into the formation of a binder bridge
smaller in cross section compared to organically bonded sand cores, shown in Figure 4-21
(b).
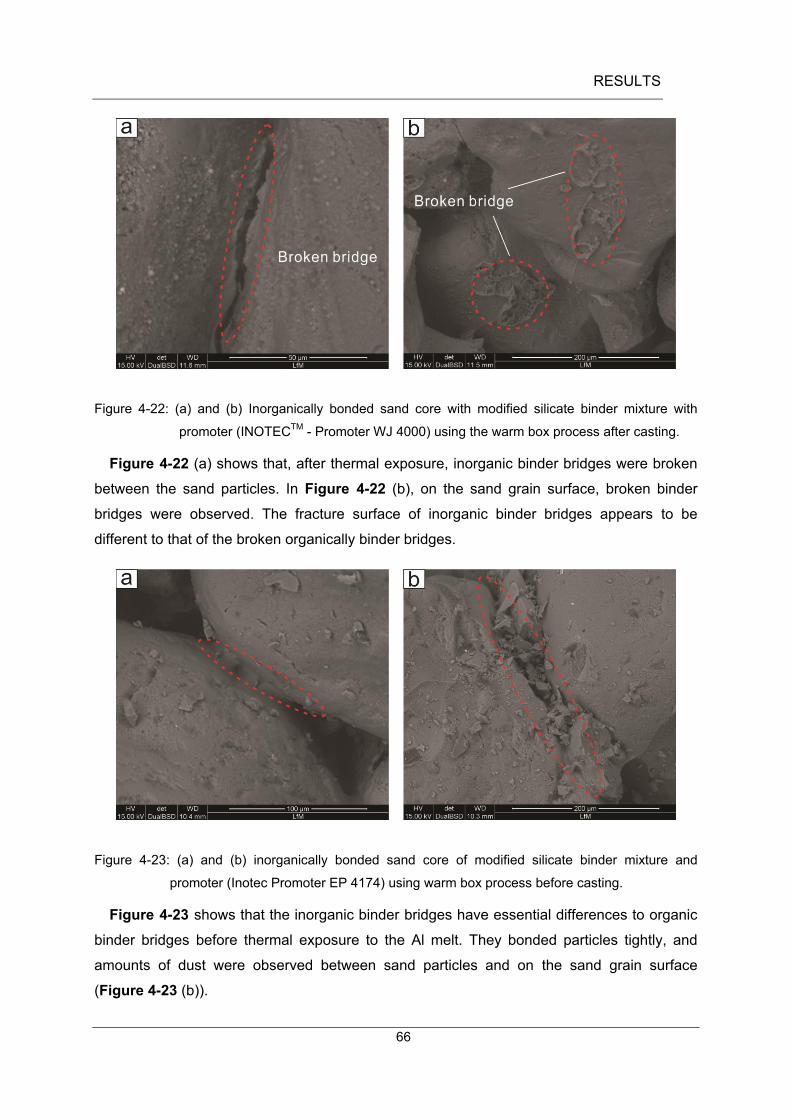
RESULTS
66
Figure 4-22: (a) and (b) Inorganically bonded sand core with modified silicate binder mixture with
promoter (INOTECTM
- Promoter WJ 4000) using the warm box process after casting.
Figure 4-22 (a) shows that, after thermal exposure, inorganic binder bridges were broken
between the sand particles. In Figure 4-22 (b), on the sand grain surface, broken binder
bridges were observed. The fracture surface of inorganic binder bridges appears to be
different to that of the broken organically binder bridges.
Figure 4-23: (a) and (b) inorganically bonded sand core of modified silicate binder mixture and
promoter (Inotec Promoter EP 4174) using warm box process before casting.
Figure 4-23 shows that the inorganic binder bridges have essential differences to organic
binder bridges before thermal exposure to the Al melt. They bonded particles tightly, and
amounts of dust were observed between sand particles and on the sand grain surface
(Figure 4-23 (b)).

RESULTS
67
Figure 4-24: (a) and (b) inorganically bonded sand core of modified silicate binder mixture and
promoter (Inotec Promoter EP 4174) using warm box process after casting showing an
unbroken binder bridge and a typical inorganic fracture surface indicating a brittle
behaviour.
Figure 4-24 (a) shows that, after thermal exposure, bonded bridges were observed
between sand particles. In Figure 4-24 (b), a broken bridge exhibited river patten on the
surface of sand particle.
Figure 4-25: (a) and (b) inorganically bonded sand core with water glass 39T @
using the warm box
process before casting.
Before casting, bonded bridges were bonded tightly between particles as shown in Figure
4-25 (a) and (b). The binder covered sand particles, and many dust particles were bonded
onto the surface.

RESULTS
68
Figure 4-26: (a) and (b) inorganically bonded sand core with water glass 39T @
using the warm box
process after casting.
After casting, binder bridges using water glass 39T @ were connected like a ring or ‘suction
pad’ in between sand grains (Figure 4-26 (a)). The binder formed a ring in which a cavity
between sand particles were found. After casting, some binder bridges were still bonded, as
shown in Figure 4-26 (b).
Inorganic binder bridges and organic binder bridges have different morphologies and
structures between sand particles. Inorganically bonded binder bridges formed Figure 4-26
(a) in case of pure water glass only a ring or (b) a ring with riverine pattern (Figure 4-24 (b))
between sand particles in case of addition of silicic acid, sodium salt and Sodium hydroxide.
In contrast organically bonded binder bridges formed either a fully covered cross-section
(Figure 4-19 (d)). Or a partly covered cross-section between sand grains after thermal
exposure (Figure 4-20 (a)). These different features become distinctly apparent after thermal
exposure once the fracture surface of the binder bridges are exposed.
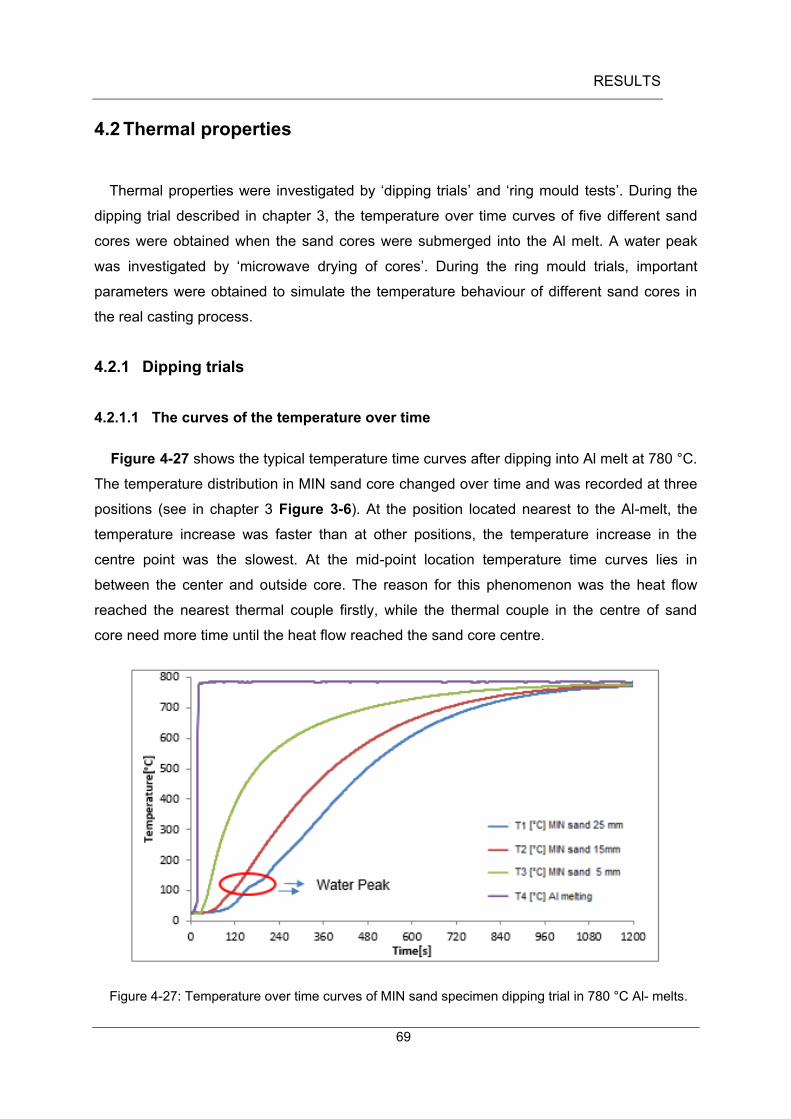
RESULTS
69
4.2 Thermal properties
Thermal properties were investigated by ‘dipping trials’ and ‘ring mould tests’. During the
dipping trial described in chapter 3, the temperature over time curves of five different sand
cores were obtained when the sand cores were submerged into the Al melt. A water peak
was investigated by ‘microwave drying of cores’. During the ring mould trials, important
parameters were obtained to simulate the temperature behaviour of different sand cores in
the real casting process.
4.2.1 Dipping trials
4.2.1.1 The curves of the temperature over time
Figure 4-27 shows the typical temperature time curves after dipping into Al melt at 780 °C.
The temperature distribution in MIN sand core changed over time and was recorded at three
positions (see in chapter 3 Figure 3-6). At the position located nearest to the Al-melt, the
temperature increase was faster than at other positions, the temperature increase in the
centre point was the slowest. At the mid-point location temperature time curves lies in
between the center and outside core. The reason for this phenomenon was the heat flow
reached the nearest thermal couple firstly, while the thermal couple in the centre of sand
core need more time until the heat flow reached the sand core centre.
Figure 4-27: Temperature over time curves of MIN sand specimen dipping trial in 780 °C Al- melts.
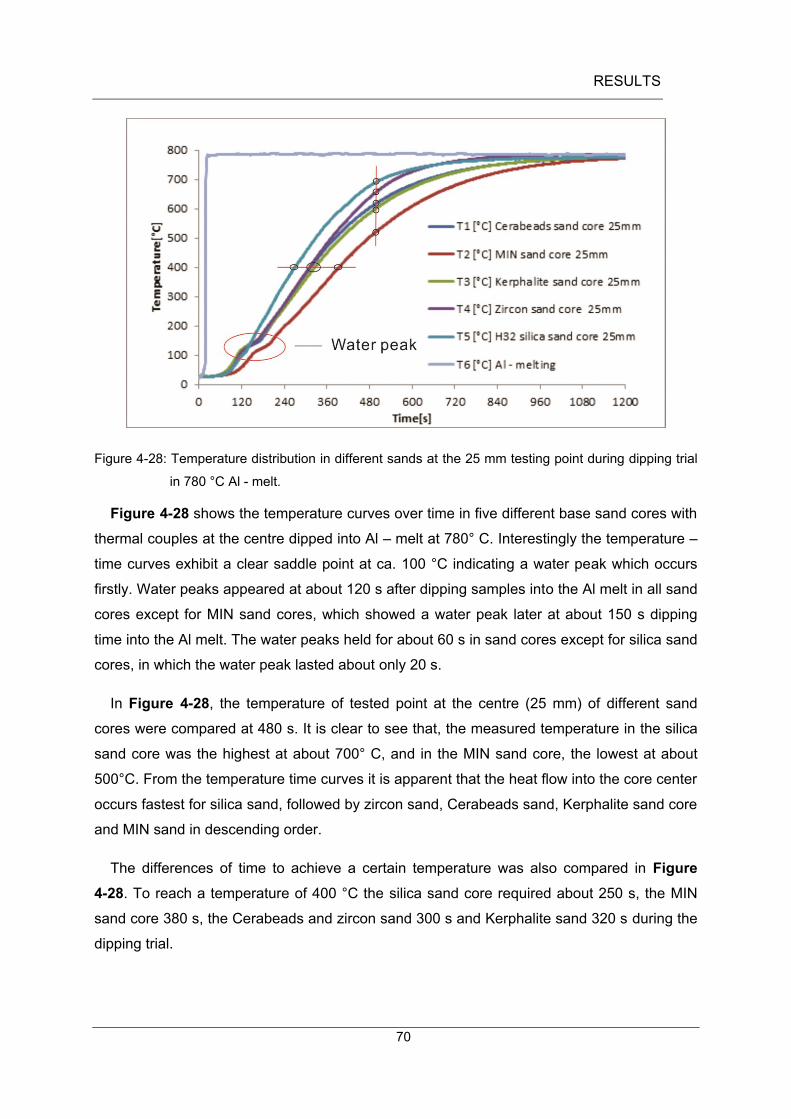
RESULTS
70
Figure 4-28: Temperature distribution in different sands at the 25 mm testing point during dipping trial
in 780 °C Al - melt.
Figure 4-28 shows the temperature curves over time in five different base sand cores with
thermal couples at the centre dipped into Al – melt at 780° C. Interestingly the temperature –
time curves exhibit a clear saddle point at ca. 100 °C indicating a water peak which occurs
firstly. Water peaks appeared at about 120 s after dipping samples into the Al melt in all sand
cores except for MIN sand cores, which showed a water peak later at about 150 s dipping
time into the Al melt. The water peaks held for about 60 s in sand cores except for silica sand
cores, in which the water peak lasted about only 20 s.
In Figure 4-28, the temperature of tested point at the centre (25 mm) of different sand
cores were compared at 480 s. It is clear to see that, the measured temperature in the silica
sand core was the highest at about 700° C, and in the MIN sand core, the lowest at about
500°C. From the temperature time curves it is apparent that the heat flow into the core center
occurs fastest for silica sand, followed by zircon sand, Cerabeads sand, Kerphalite sand core
and MIN sand in descending order.
The differences of time to achieve a certain temperature was also compared in Figure
4-28. To reach a temperature of 400 °C the silica sand core required about 250 s, the MIN
sand core 380 s, the Cerabeads and zircon sand 300 s and Kerphalite sand 320 s during the
dipping trial.

RESULTS
71
Figure 4-29:Temperature time curves in different sands at 15 mm testing point during dipping trial in
780 °C Al- melt.
Figure 4-29 shows the temperature curves over time for five different sand cores of
different base sands with a water glass binder at the 15mm test point after dipping into the Al
melt at 780° C. A saddle point was observed for each sand core during dipping trials in
temperature over time curves, indicating also a water peak at the 15 mm point which
occurred earlier and held for less time compared to the water peaks in the centre of sand
cores. Figure 4-30 shows temperature time curves in different sands at the 5 mm testing
point in dipping trials at 780 °C in the Al melt. Here, the water peak is not clearly apparent
during the dipping trials.
In Figure 4-28, Figure 4-29 and Figure 4-30, it can clearly be seen that, the gradient of
the temperature time curves are different for different base sands. The gradient of
temperature time curve at 25 mm testing point in dipping trial is larger than at 15 mm testing
point, which is larger than at 5 mm testing point. This means, the cooling rate (𝑑𝑇
𝑑𝑡) for all three
testing points arrange as 𝑑𝑇
𝑑𝑡(at 5 mm) >
𝑑𝑇
𝑑𝑡(at 15 mm) >
𝑑𝑇
𝑑𝑡(at 25 mm).
0
100
200
300
400
500
600
700
800
0 120 240 360 480 600 720 840 960 1080 1200
Tem
pe
ratu
re[°
C]
Time[s]
T1 [°C] Cerabeads sand core 15mm
T2 [°C] MIN sand core 15mm
T3 [°C] Kerphalite sand core 15mm
T4 [°C] Zircon sand core 15mm
T5 [°C] H32 silica sand core 15mm
T6 [°C] Al - meltingWater peak

RESULTS
72
Figure 4-30: Temperature time curves in different sands at 5 mm testing point in dipping trial in 780 °C
Al - melt alloys.
In Figure 4-28, Figure 4-29, the temperature curves over time during the dipping trials in
silica sand core are over the curves of other sand cores, and the temperature curves in MIN
sand core are below the curves of other sand cores. These curves are resulted by cooling
rate differences in different sand cores, it is apparent that the cooling rate is fastest for the
silica sand core, followed by zircon sand, Cerabeads sand, Kerphalite sand and MIN sand in
descending order as 𝑑𝑇
𝑑𝑡(silica sand) >
𝑑𝑇
𝑑𝑡(zircon sand) >
𝑑𝑇
𝑑𝑡(Cerabeads sand) >
𝑑𝑇
𝑑𝑡(Kerphalite sand) >
𝑑𝑇
𝑑𝑡(MIN sand).The
results are shown in Table 4-1.
Table 4-1: Comparison of dT / dt in different base sands.
Sand type
dT / dt (° C / s) at 480°C
MIN Sand 1.05
Kerphalite sand 1.22
Cerabeads Sand 1.25
Zircon Sand 1.32
H32 Silica sand 1.41
0
100
200
300
400
500
600
700
800
0 120 240 360 480 600 720 840 960 1080 1200
Tem
pe
ratu
re[°
C]
Time[s]
T1 [°C] Cerabeads sand core 5mm
T2 [°C] MIN sand core 5mm
T3 [°C] Kerphalite sand core 5mm
T4 [°C] Zircon sand core 5mm
T5 [°C] H32 silica sand core 5mm
T6 [°C] Al - melting
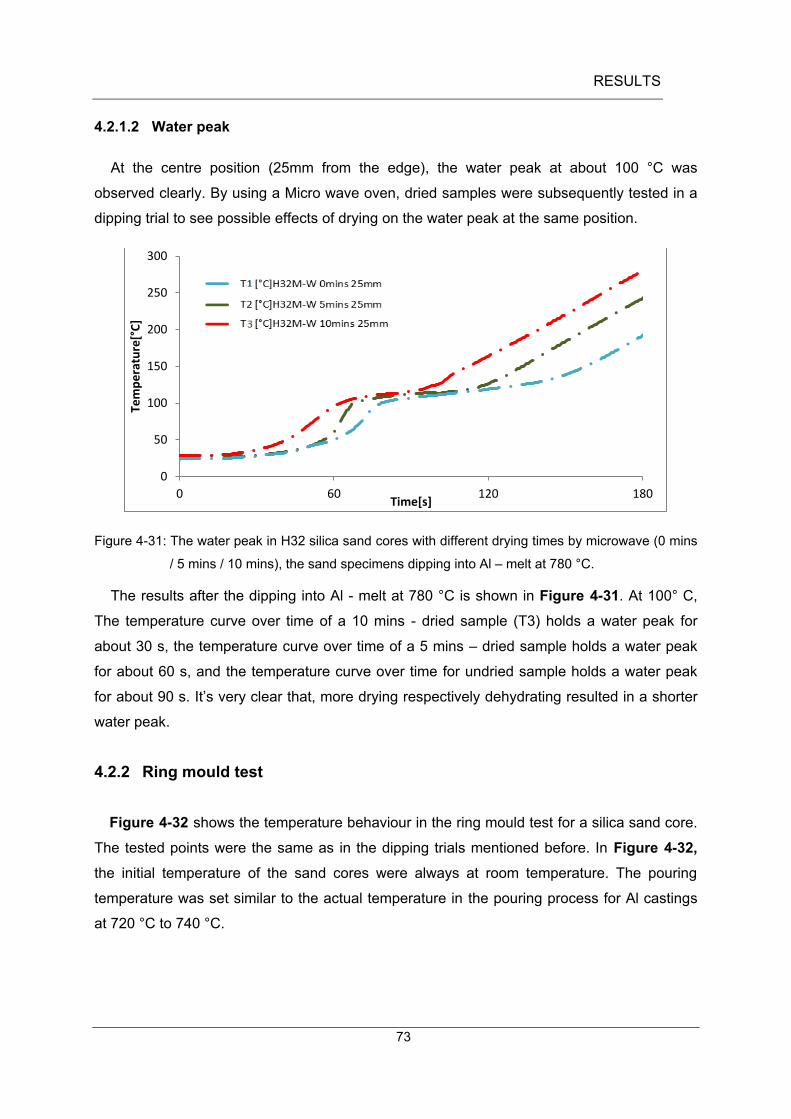
RESULTS
73
4.2.1.2 Water peak
At the centre position (25mm from the edge), the water peak at about 100 °C was
observed clearly. By using a Micro wave oven, dried samples were subsequently tested in a
dipping trial to see possible effects of drying on the water peak at the same position.
Figure 4-31: The water peak in H32 silica sand cores with different drying times by microwave (0 mins
/ 5 mins / 10 mins), the sand specimens dipping into Al – melt at 780 °C.
The results after the dipping into Al - melt at 780 °C is shown in Figure 4-31. At 100° C,
The temperature curve over time of a 10 mins - dried sample (T3) holds a water peak for
about 30 s, the temperature curve over time of a 5 mins – dried sample holds a water peak
for about 60 s, and the temperature curve over time for undried sample holds a water peak
for about 90 s. It’s very clear that, more drying respectively dehydrating resulted in a shorter
water peak.
4.2.2 Ring mould test
Figure 4-32 shows the temperature behaviour in the ring mould test for a silica sand core.
The tested points were the same as in the dipping trials mentioned before. In Figure 4-32,
the initial temperature of the sand cores were always at room temperature. The pouring
temperature was set similar to the actual temperature in the pouring process for Al castings
at 720 °C to 740 °C.
0
50
100
150
200
250
300
0 60 120 180
Tem
pe
ratu
re[°
C]
Time[s]

RESULTS
74
Figure 4-32: The significant points in the curves in the ring mould test.
In the foundry process, measuring the temperature time curve and thereby the thermal
conductivity in the sand cores are of great importance to control the properties of Al casting
during the solidification.
The significant test points are the beginning temperature of ring moud and sand cores /
Al-melt;the maximal values of different positions in sand cores; and the highest cooling rate
(at 200°C) in the sand core during solidification, as shown in Table 4-2.
Table 4-2: The process parameters during the ring mould test.
0
100
200
300
400
500
600
700
-240 -120 0 120 240 360 480 600 720 840 960 1080 1200
tem
pe
ratu
re [
°C]
time [s]
T1 [°C] ring chill
T2 [°C] sand core 25mm
T3 [°C] sand core 15mm
T4 [°C] sand core 5mm
T5 [°C] Melting between chill and core
T Ring mould T air in mould T Core centre T at 15mm T at 5mm
T Pouring time ° C 200 113 49 52 66
dT / dt 200°C °C/s - - 0,52 0,61 1,94
t 200°C s - 287,5 242,0 69,0
T Max. ° C 397 633 302 °C 300 °C 326
t Max Temp. s 95,0 3,5 761,0 684,5 416,0
T Casting melting ° C 734 Core size H: 50 mm D: 50 mm
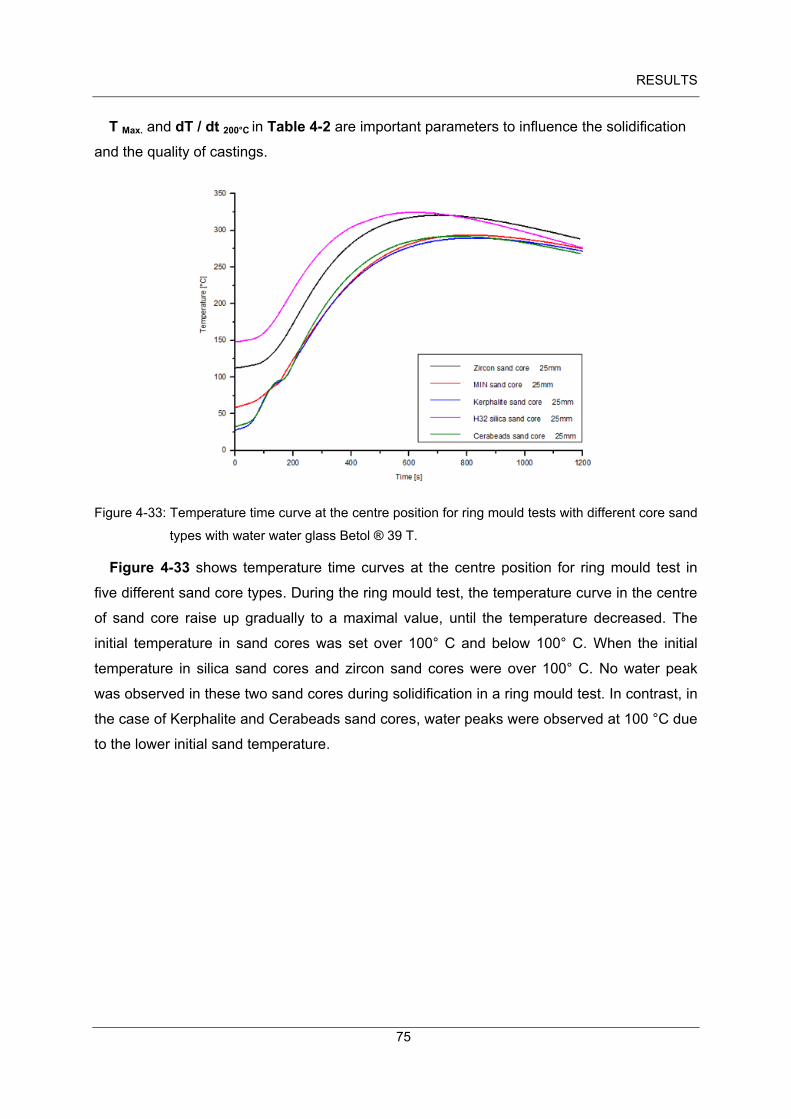
RESULTS
75
T Max. and dT / dt 200°C in Table 4-2 are important parameters to influence the solidification
and the quality of castings.
Figure 4-33: Temperature time curve at the centre position for ring mould tests with different core sand
types with water water glass Betol ® 39 T.
Figure 4-33 shows temperature time curves at the centre position for ring mould test in
five different sand core types. During the ring mould test, the temperature curve in the centre
of sand core raise up gradually to a maximal value, until the temperature decreased. The
initial temperature in sand cores was set over 100° C and below 100° C. When the initial
temperature in silica sand cores and zircon sand cores were over 100° C. No water peak
was observed in these two sand cores during solidification in a ring mould test. In contrast, in
the case of Kerphalite and Cerabeads sand cores, water peaks were observed at 100 °C due
to the lower initial sand temperature.
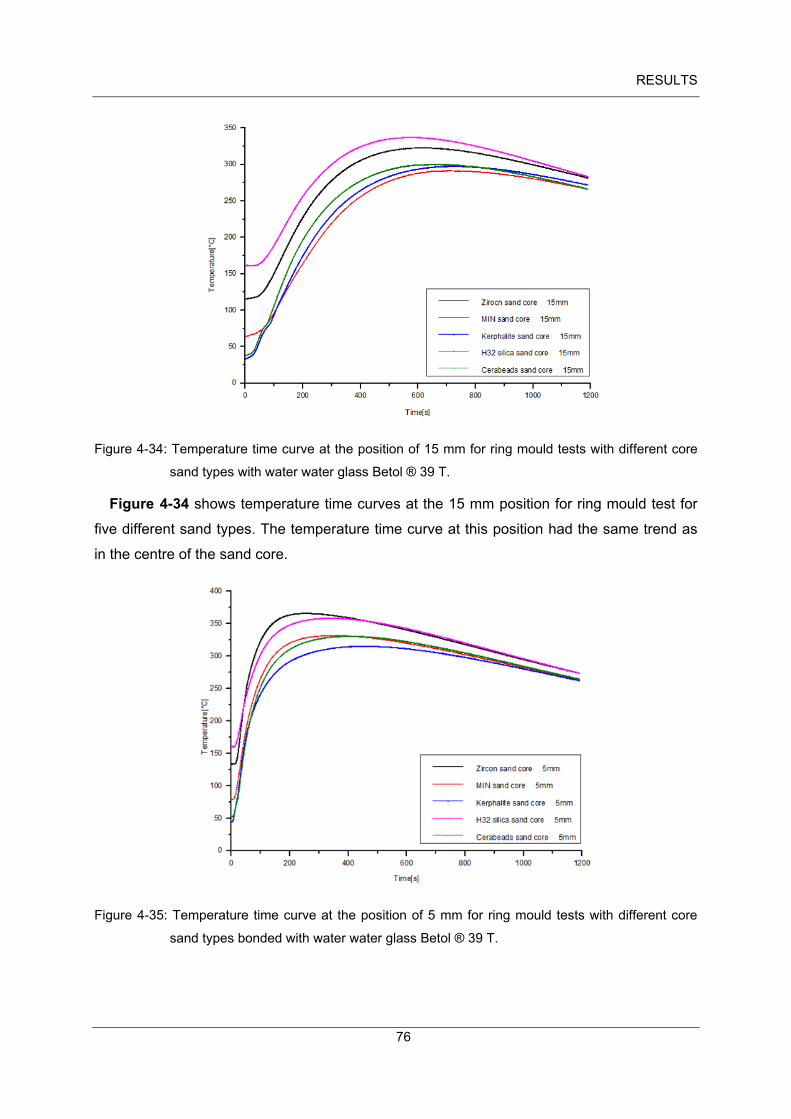
RESULTS
76
Figure 4-34: Temperature time curve at the position of 15 mm for ring mould tests with different core
sand types with water water glass Betol ® 39 T.
Figure 4-34 shows temperature time curves at the 15 mm position for ring mould test for
five different sand types. The temperature time curve at this position had the same trend as
in the centre of the sand core.
Figure 4-35: Temperature time curve at the position of 5 mm for ring mould tests with different core
sand types bonded with water water glass Betol ® 39 T.

RESULTS
77
Figure 4-35 shows temperature time curves at the 5 mm position for ring mould test for
five different sand types. No water peak in this position in five sand cores (Figure 4-33,
Figure 4-34 and Figure 4-35) was observed. This demonstrate clearly, high temperatures
were present at the location nearest the edge of sand cores resulting in an immediate
evaporation of the water. The testing point at 5mm to the edge had the highest temperature
gradient. Furthermore, a higher starting temperature of the cores resulted into a higher
absolute maximal temperature. This can be an important factor affecting the casting quality.
Figure 4-36: Comparison of dT / dt (0-250°C) in different sands and different position.
Figure 4-36 shows a comparison of cooling rate dT / dt (0-250°C) in different sands at
different positions. At the 5 mm testing point, the dT / dt had higher values than at the 15 mm
and 25 mm testing point. The maximal value of 3.0 (°C / s) is at the 5 mm testing point in
zircon sand. The cooling rate dT / dt of the 25 mm testing point had a higher values than at
15 mm, but both values are very close. The minimal values of 0.28 (° C / s) occurred at the
25 mm test point in the Kerphalite sand core.

RESULTS
78
4.2.2.1 Comparison with different initial temperatures
As discussed in the previous section, the water peak was very sensitive to a core
temperature at 100°C during the casting process. The initial temperature of sand cores was
set differently, which led to differences of holding times of the water peak. In order to reduce
the water peak holding time, two different trials were employed: (a) to dry the sand samples
(b) and to keep sand samples in ring mould until their temperature was over 100°C.
Figure 4-37: Ring mould test of with water glass 39T bonded H32 silica sand with an initial
temperature over 100 °C with micro wave oven treatment.
Figure 4-37 points out that, the holding time of water peak was sharply reduced by using
the micro-oven to dry the sand core for 10 minutes.
0
100
200
300
400
500
600
700
0 200 400 600 800 1000 1200
Tem
pe
ratu
re[°
C]
Time[s]
T1 [°C] Melting in the ringT2 [°C] Ring mouldT3 [°C] H32 silica sand core in 25mmT4 [°C] H32 silica sand core in 15mmT5 [°C] H32 silica sand core in 5mm
Eutectic holding
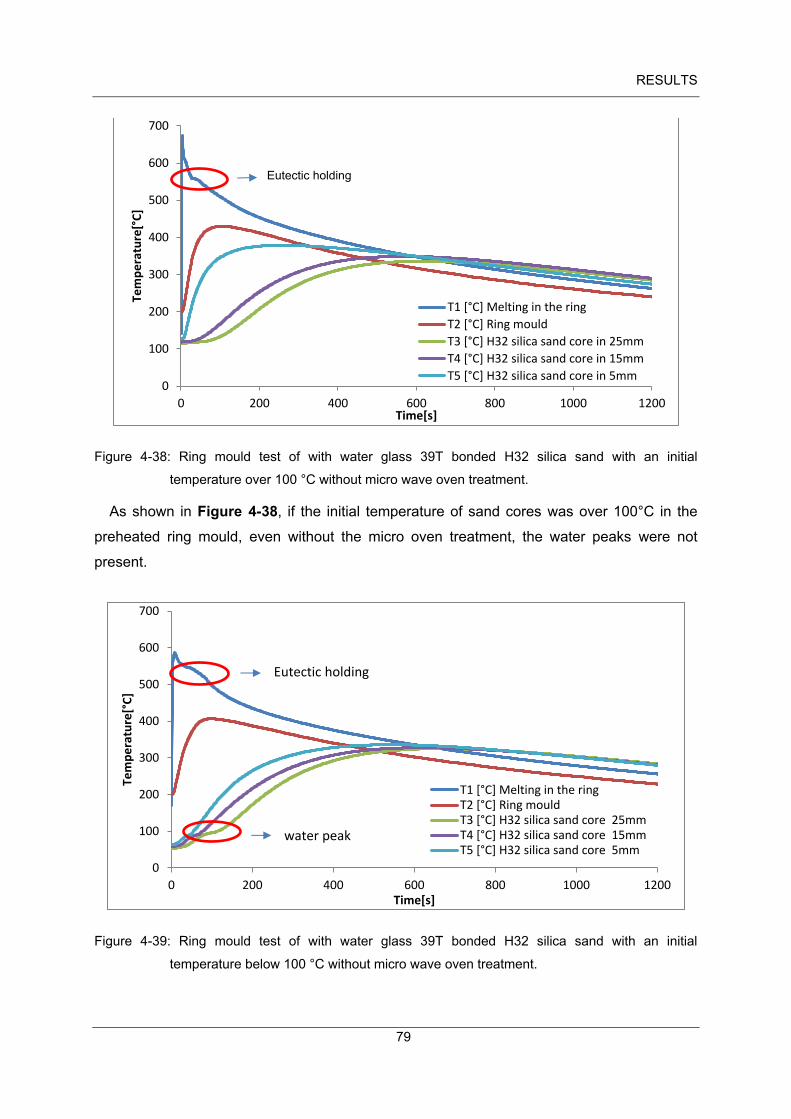
RESULTS
79
Figure 4-38: Ring mould test of with water glass 39T bonded H32 silica sand with an initial
temperature over 100 °C without micro wave oven treatment.
As shown in Figure 4-38, if the initial temperature of sand cores was over 100°C in the
preheated ring mould, even without the micro oven treatment, the water peaks were not
present.
Figure 4-39: Ring mould test of with water glass 39T bonded H32 silica sand with an initial
temperature below 100 °C without micro wave oven treatment.
0
100
200
300
400
500
600
700
0 200 400 600 800 1000 1200
Tem
pe
ratu
re[°
C]
Time[s]
T1 [°C] Melting in the ring
T2 [°C] Ring mould
T3 [°C] H32 silica sand core in 25mm
T4 [°C] H32 silica sand core in 15mm
T5 [°C] H32 silica sand core in 5mm
0
100
200
300
400
500
600
700
0 200 400 600 800 1000 1200
Tem
pe
ratu
re[°
C]
Time[s]
T1 [°C] Melting in the ringT2 [°C] Ring mouldT3 [°C] H32 silica sand core 25mmT4 [°C] H32 silica sand core 15mmT5 [°C] H32 silica sand core 5mm
Eutectic holding
water peak
Eutectic holding

RESULTS
80
In Figure 4-39, the water peak was observed to be at about 100 °C, which was measured
by thermal couples at three different positions in the sand cores. With micro wave oven
treatment of 10 minutes, the water peaks were still present.
Figure 4-40: Ring mould test of with water glass 39T bonded H32 silica sand with an initial
temperature below 100 °C with micro wave oven treatment.
In Figure 4-40, the water peak was still observed at 100 °C in the centre of sand sample
with micro oven treatment of 10 minutes. However the water peak was not obvious at other
test points.
0
100
200
300
400
500
600
700
0 200 400 600 800 1000 1200
Tem
pe
ratu
re[°
C]
Time[s]
T1 [°C] Melting in the ringT2 [°C] Ring mouldT3 [°C] H32 silica sand core 25mmT4 [°C] H32 silica sand core 15mmT5 [°C] H32 silica sand core 5mm
Eutectic holding
water peak

RESULTS
81
4.3 Decoring behaviour
Mechanical experiments which have been explained in detail in the experimental methods
have been performed to distinguish the de-coring behaviour among the different sand
bonded cores. Experimental results indicate that the organically bonded sand cores were
easily shaken out. In contrast, inorganically bonded sand cores were more difficult to be de-
cored. The experiments have been repeated three times for each type of sand core with
different impact energy. The de-cored sand was gathered and the weight determined.
Figure 4-41: (a) and (b) Features of three different impact energies and times by impact device in
organically bonded internal core.
Figure 4-42 shows schematically, that with the repeated impacts, the amount of fallen
sand was increased, while the residual sand adhered to the Al – casting.
Figure 4-42: Schematic cross section of specimens after the decored sand removed Al casting (a) one
impact (b) two impacts (c) three impacts.
After the experiments, the shapes of the residual sand agglomerates in the casting box
were examined with increasing impacts. Repeated impacts, resulted in more agglomerates
as well as fine sand, and a deeper decoring crater in the core, as shown schematically in
Figure 4-42. It is to note that the core has a tenancy to adhere to the casting for all sands
investigated.
(a)
(b)
(c)
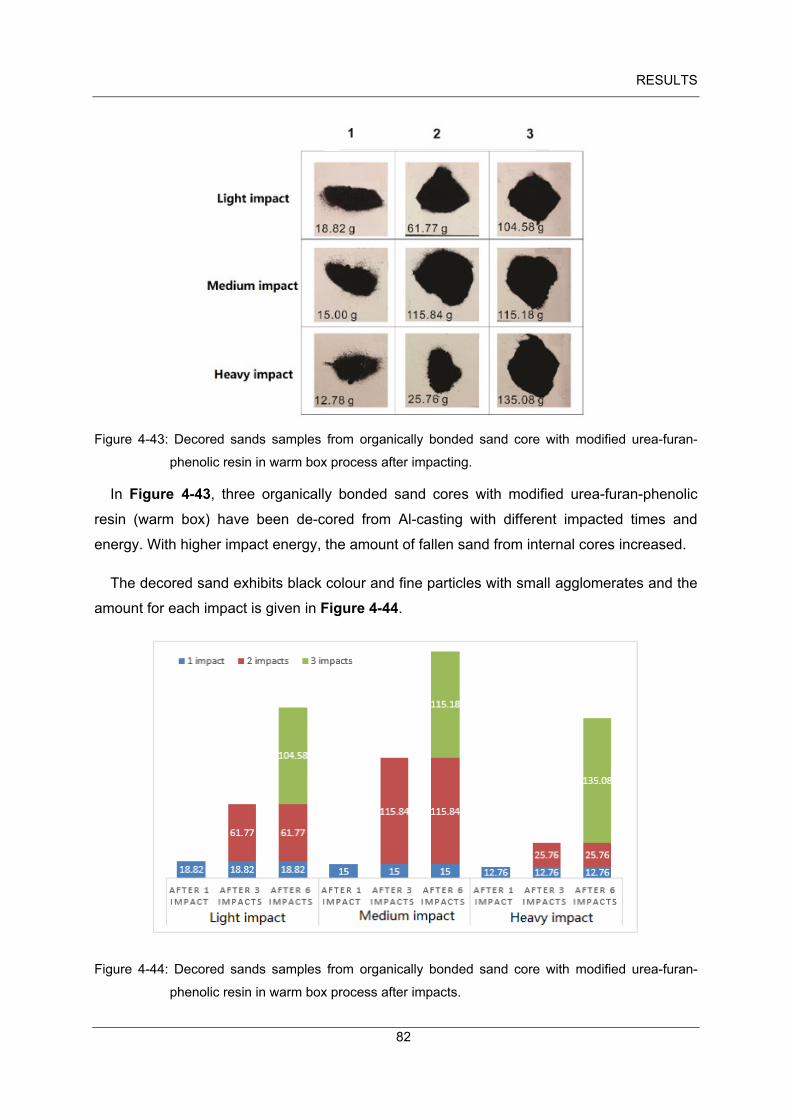
RESULTS
82
Figure 4-43: Decored sands samples from organically bonded sand core with modified urea-furan-
phenolic resin in warm box process after impacting.
In Figure 4-43, three organically bonded sand cores with modified urea-furan-phenolic
resin (warm box) have been de-cored from Al-casting with different impacted times and
energy. With higher impact energy, the amount of fallen sand from internal cores increased.
The decored sand exhibits black colour and fine particles with small agglomerates and the
amount for each impact is given in Figure 4-44.
Figure 4-44: Decored sands samples from organically bonded sand core with modified urea-furan-
phenolic resin in warm box process after impacts.

RESULTS
83
Figure 4-44 shows the amount by weight of decored sand for different impact energies
and number of impacts. A maximal value of 135.08 g was obtained by heavy impacts
repeated three times. For the medium impact energies, the weight of fallen sand after two
times impacts and three times impacts have nearly same value of 115 g.
Figure 4-45: Decored sands samples from organically bonded sand core with an aqueous solution of
phenol sulfonic acid, aluminum salts, sulfuric acid (warm box) after impact.
Figure 4-45 shows the decoring behaviour of three organic sand cores bonded with an
aqueous solution of phenol sulfonic acid, aluminum salts, sulfuric acid (warm box). The
amount of fallen sand from cores increased with more impact energy similar to organically
bonded sand cores with modified urea-furan-phenolic resin (warm box). The decored sands
exhibit black colour resulting from the decomposed binder but also more agglomerates.
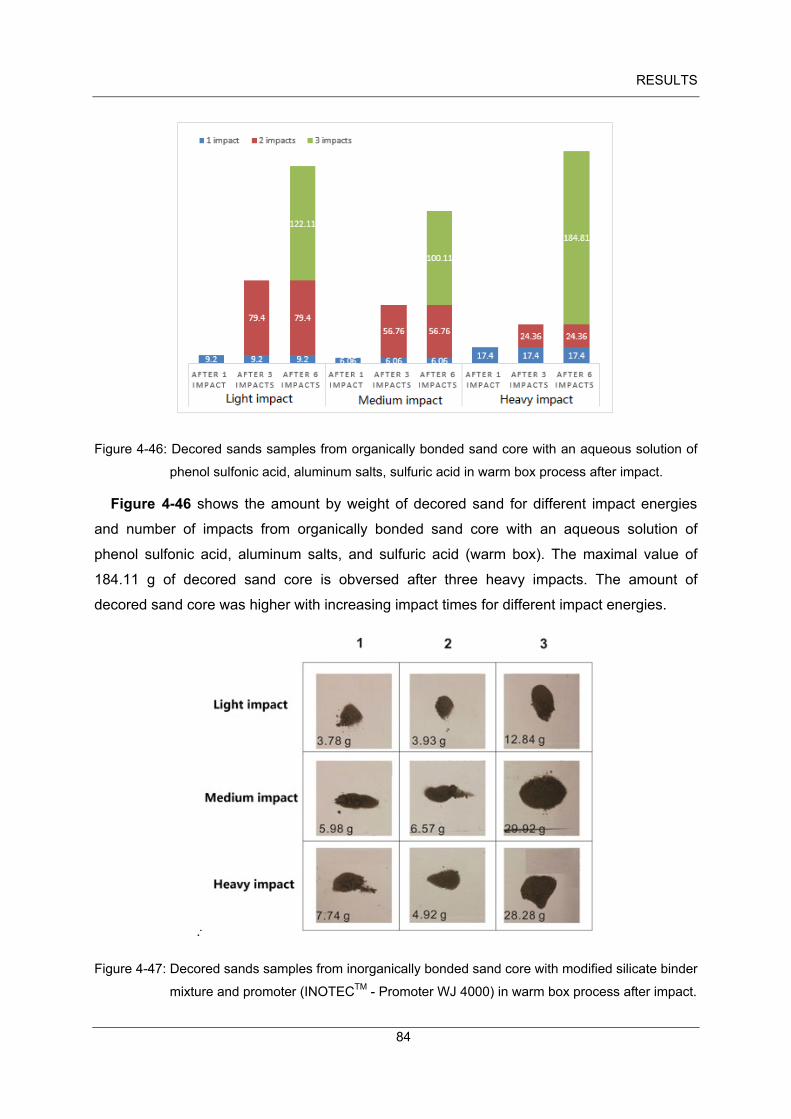
RESULTS
84
Figure 4-46: Decored sands samples from organically bonded sand core with an aqueous solution of
phenol sulfonic acid, aluminum salts, sulfuric acid in warm box process after impact.
Figure 4-46 shows the amount by weight of decored sand for different impact energies
and number of impacts from organically bonded sand core with an aqueous solution of
phenol sulfonic acid, aluminum salts, and sulfuric acid (warm box). The maximal value of
184.11 g of decored sand core is obversed after three heavy impacts. The amount of
decored sand core was higher with increasing impact times for different impact energies.
.
Figure 4-47: Decored sands samples from inorganically bonded sand core with modified silicate binder
mixture and promoter (INOTECTM
- Promoter WJ 4000) in warm box process after impact.

RESULTS
85
Figure 4-47 shows three inorganically bonded sand cores with modified silicate binder
mixture and promoter (INOTECTM - Promoter WJ 4000) (warm box) de-cored from Al-casting
with different impacted times and energy.
The amount of decored sand from cores increased with more impact energy similar to
organically bonded sand cores (warm box), except for the amount of 29.92 g obtained by
medium energy for three repeated impacts compared to the amount of 28.28 g obtained by
three repeated heavy impacts.
The decored sands exhibited gray colour as a result of the decomposed promoters and
fine sand without agglomerates, the amount is shown in Figure 4-48.
Figure 4-48: Decored sands samples from inorganically bonded sand core with modified silicate binder
mixture and promoter (INOTECTM
- Promoter WJ 4000) in warm box process after impact.
Figure 4-48 shows the amount by weight of decored sand for different impact energies
and number of impacts from inorganically bonded sand core with modified silicate binder
mixture and promoter (INOTECTM - Promoter WJ 4000) (warm box). A maximal value of
29.92g for decored sand was obtained by a medium impact energy for three times, which is
only 1.64 g more than by heavy impacts for three times. All the values for different impacts
numbers and energies were much less than obtained in organically bonded sand cores.

RESULTS
86
Figure 4-49: Decored sands samples from inorganically bonded sand core of modified silicate binder
mixture and promoter (INOTEC TM
Promoter EP 4174) in warm box process after impact.
In Figure 4-49, three inorganically bonded sand cores of modified silicate binder mixture
and promoter (INOTEC TM Promoter EP 4174) (warm box) de-cored from Al-casting with
different impacted times and energy are shown. The amount of decored sand from cores
increased with more impact energy similar to organically bonded sand cores (warm box). The
decored sands exhibit gray colour and fine sand with obvious agglomerates.
Figure 4-50: Decored sands samples from inorganically bonded sand core of modified silicate binder
mixture and promoter (INOTEC TM
Promoter EP 4174) in warm box process after impact.

RESULTS
87
Figure 4-50 shows the amount by weight of decored sand for different impact energies
and number of impacts from inorganically bonded sand core of modified silicate binder
mixture and promoter (INOTEC TM Promoter EP 4174) (warm box). A maximal value of 51.43
g was obtained by heavy impact for three times, the amount of decored sand was increased
by increasing the number of impacts and impact energy. The decored sand obtained by each
single impact from inorganically bonded sand core of modified silicate binder mixture and
promoter (INOTEC TM Promoter EP 4174) (warm box) was more than for inorganically
bonded sand cores with modified silicate binder mixture and promoter (INOTECTM - Promoter
WJ 4000) (warm box).
Figure 4-51: Decored sands samples from inorganically bonded sand core with water glass 39T @
using the warm box process after impact.
In Figure 4-51, the decored sand of three inorganic sand cores bonded with water glass
39T @ using the warm box process is shown for different impacts and energy. The amount of
decored sand from cores increased with more impacts energy similar to organically bonded
sand cores (warm box), except for the maximal amount of 244.52 g obtained by a medium
energy. The decored sand exhibited a white colour as no decomposition of additives took
place. Also the amount of agglomerates increased with the increasing input energy.

RESULTS
88
Figure 4-52 : Agglomerates form a bridge structure and hinder fine sand to fall down during decoring.
During impacting, water glass bonded cores formed more agglomerates. These
agglomerates gathered and formed a bridge during decoring and blocked up fine sands. With
increasing impact energy, the agglomerates disintegrated and fell down together with the fine
sand, which led to a sudden increase of the weight of the decored sand.
Figure 4-53: Decored sands samples from inorganically bonded sand core with water glass 39T @
using the warm box process after impact.

RESULTS
89
Figure 4-53 shows the amount by weight of decored sand for different impact energies
and number of impacts from inorganically bonded sand cores with pure water glass – Betol ®
39 T using the warm box process. A maximal value of 244.52 g was obtained by medium
impact energy repeated for three times. The amount of decored sand from the inorganically
bonded pure water glass (Betol® 39 T) hardened with a hot tool were larger than that of
inorganically bonded sand cores.
Interestingly, for each impact energy with increasing number of impacts the amount of
agglomerates and fine sand increases. However, the highest impact energy does not result
in the largest amount of decored sand. Only for the highest energy and three impacts the
largest amount is observed.
Figure 4-54: Comparison of decoring abilities for five different internal cores, No.1 is the organically
bonded sand core with modified urea-furan-phenolic resin (warm box), Nr. 2 is the
organically bonded sand core with an aqueous solution of phenol sulfonic acid, aluminum
salts, sulfuric acid (warm box), No. 3 is the inorganically bonded sand core with water
glass 39T @
(warm box), Nr. 4 is the inorganically bonded sand core of modified silicate
binder mixture and promoter (INOTEC TM
Promoter EP 4174), Nr. 5 is the inorganically
bonded sand core with modified silicate binder mixture and promoter (INOTECTM
-
Promoter WJ 4000) (warm box).
Figure 4-54 shows that organically bonded sand cores can be easily shaken out after
contact with the Al melting and subsequent solidification compared to inorganically bonded
cores. However, warm box hardened Betol ® 39 T sand core showed a similar decoring

RESULTS
90
behaviour compared to organically bonded cores. From Figure 4-54, it is apparent that
organically bonded sand core with modified urea-furan-phenolic resin in warm box process
obtained most decored sand after impacting, followed by organically bonded sand core with
an aqueous solution of phenol sulfonic acid, aluminum salts, sulfuric acid (warm box),
inorganically bonded sand core with water glass 39T @ (warm box), inorganically bonded
sand core of modified silicate binder mixture and promoter (INOTEC TM Promoter EP 4174),
and inorganically bonded sand core with modified silicate binder mixture and promoter
(INOTECTM - Promoter WJ 4000) (warm box) in descending order.
As mentioned before, the organically bonded sand cores were more easily to be de-cored.
Therefore, the residual amount of sand in the casting box was less than that for the
inorganically bonded sand cores. It was observed that after impact some of organically
bonded cores were nearly de-cored. In particular for the inorganically bonded sand core with
water glass 39T @ using the warm box process total decoring was achieved.

RESULTS
91
4.4 Simulation of dipping trial
The simulated curves are compared to the experimental curves obtained in experiments of
dipping trials. The proportional constant Q sand of the thermal conductivity was systematically
iterated until the two temperature time curves of experiment and simulation overlapped. If the
simulated temperature curves for each testing point overlapped those obtained in
experiments, the proportional constant Q sand was chosen and λ sand core can be calculated
from the Q sand and thermal conductivity λ ratio of sand used in Magma software (see
Chapter 3).
The parameters such as density ρ and specific heat capacity Cp were known for different
sands, so that only λ sand core was iterated using the Magma software.
Figure 4-55: Comparison between simulation curve and experiment curve of Zircon sand at the same
parameter of 780 °C with the proportional constant Q Quartz
Magma = 1.0.
During the iteration of Q zircon sand, Q zircon sand = 1.0 was firstly was set into λ Zircon sand = Q Zircon
sand × λ silica sand Magma, in this case, λ Zircon sand (Q zircon sand = 1.0) = λ sand core Magma. Dipping trails (into
Al melt) was simulated with the obtained λ Zircon sand at 780 °C, temperature time curves were
obtained in three test points with virtual thermal couples. Based on this principle, ±10%
tolerances were added to Q zircon sand = 1.0, in these cases, λ Zircon sand (Q zircon sand = 1.1) = 1.1 * λ
sand core Magma and λ Zircon sand (Q zircon sand = 0.9) = 0.9 * λ sand core Magma were set as parameters to
simulate dipping trials, temperature time curves were obtained with Q zircon sand = 1.1 and Q
0
100
200
300
400
500
600
700
800
0 200 400 600 800 1000 1200 1400 1600 1800
Tem
pe
ratu
re[°
C]
Time[s]

RESULTS
92
zircon sand = 0.9. The experimental temperature time curves in three testing points were
proposed to compare simulated temperature time curves with Q zircon sand = 0.9 / 1.0 /1.1. If the
temperature time curves of three testing points in experimental and simulated dipping trials
were overlapped, Q zircon sand was confirmed for λ Zircon sand (Q zircon sand).
In Figure 4-55, the proportional constant Q zircon sand was about 1.0 of λ sand core Magma at
780°C. The temperature distributions were close to each other, except the water peak at the
centre position and 15mm’s position between experiment and simulation, the Q zircon sand was
fixed by comparison.
Therefore, λ zircon sand of Zircon sand core bonded with a specific water glass e.g. Betol® 39
T can be calculated. According to the same principle, other Q sand values were simulated.
When the water peak occurred, the temperature time curve was extended to longer time by
the amount of time during which the water peak was active.
After iteration simulated curves and experimental curves overlapped except the outside
position at which a water peak occurred. These values were obtained by five different base
sands bonded by water glass Betol® 39 T at 780°C in dipping trials. Another situation was
simulated by the same cores at 700°C for additional confirmation, the simulated λ zircon sand core
and known ρ zircon sand core and Cp zircon sand core were imported into the simulation, and the
obtained curves are shown in Figure 4-56.
Figure 4-56: Comparison between simulation curves and experiment curves of Zircon sand at the
same parameters at 700 °C with the proportional constant Q Quartz
Magma = 1.0.
0
100
200
300
400
500
600
700
800
0 200 400 600 800 1000 1200 1400 1600 1800
Tem
pe
ratu
re[°
C]
Time[s]
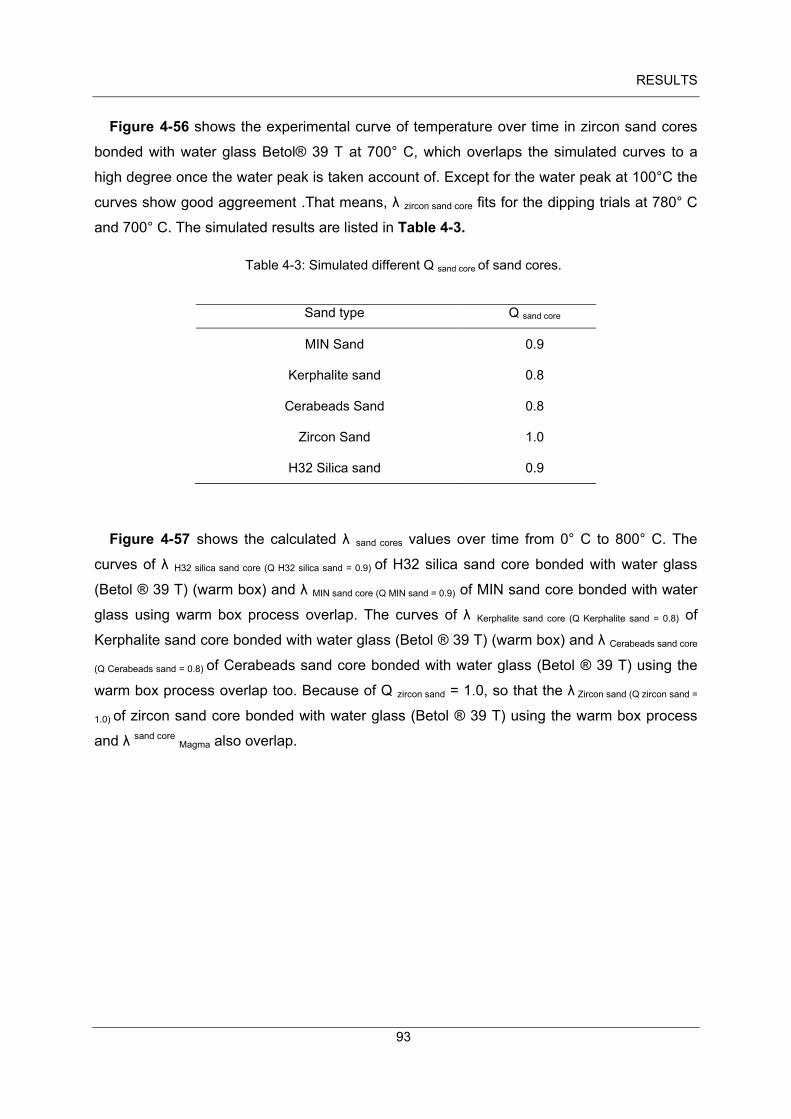
RESULTS
93
Figure 4-56 shows the experimental curve of temperature over time in zircon sand cores
bonded with water glass Betol® 39 T at 700° C, which overlaps the simulated curves to a
high degree once the water peak is taken account of. Except for the water peak at 100°C the
curves show good aggreement .That means, λ zircon sand core fits for the dipping trials at 780° C
and 700° C. The simulated results are listed in Table 4-3.
Table 4-3: Simulated different Q sand core of sand cores.
Sand type Q sand core
MIN Sand 0.9
Kerphalite sand 0.8
Cerabeads Sand 0.8
Zircon Sand 1.0
H32 Silica sand 0.9
Figure 4-57 shows the calculated λ sand cores values over time from 0° C to 800° C. The
curves of λ H32 silica sand core (Q H32 silica sand = 0.9) of H32 silica sand core bonded with water glass
(Betol ® 39 T) (warm box) and λ MIN sand core (Q MIN sand = 0.9) of MIN sand core bonded with water
glass using warm box process overlap. The curves of λ Kerphalite sand core (Q Kerphalite sand = 0.8) of
Kerphalite sand core bonded with water glass (Betol ® 39 T) (warm box) and λ Cerabeads sand core
(Q Cerabeads sand = 0.8) of Cerabeads sand core bonded with water glass (Betol ® 39 T) using the
warm box process overlap too. Because of Q zircon sand = 1.0, so that the λ Zircon sand (Q zircon sand =
1.0) of zircon sand core bonded with water glass (Betol ® 39 T) using the warm box process
and λ sand core Magma also overlap.

RESULTS
94
Figure 4-57: Five λs values over time in different sand cores, λ H32 silica sand and λ MIN sand are overlapped,
λ Kerphalite sand and λ Cerabeads sand are overlapped.
CONCLUSION
95
5 Conclusion
Five raw sand properties were investigated for their grain size distribution, shape factor, by
optical microcopy and scanning electronic mic11roscopy and granulometry. The results of
dipping trials and ring mould test allowed to estimate the thermal properties of sand cores
relative to Quartz sand. The decoring behaviour (mechanical properties) was investigated by
shake out trials.
Raw sand properties
Raw sand properties were investigated by granulometry to analyze grain size distribution,
grain morphology 2D – shape factor, optical microscopy, scanning electron microscopy.
Cerabeads sand grains exhibit yellow colour. Their size distribution gives an average grain
size of 210 µm and an AFS number of 67.8. Relatively regular spheroidal particles and fine
roughness surface were observed. The 2 – D shape factor of Cerabeads sand grains is 1.0,
indicating a round shape.
H32 silica sand grains are irregular and transparent. Their size distribution gives an
average grain size of 220 µm and an AFS number of 62.0. H32 silica sand exhibits rough
surface and fractures. The 2 – D shape factor of H32 silica sand grains is 0.9, indicating an
angular shape.
Kerphalite sand grains exhibit gray colour. An average grain size of 150 µm and the
largest AFS number of 93.3 were obtained. Kerphalite grains exhibit a sharp morphology with
irregular edges and corners, some particles were observed as cubic. The 2 – D shape factor
of Kerphalite sand grains is 0.75, indicating a subangular shape.
MIN sand grains are black spheroidal. Their size distribution gives an average grain size of
210 µm and an AFS number of 66.6. MIN sand grains exhibit rough surface with observed
dendrite structure resulting from Al2O3 growth. The 2 – D shape factor of MIN sand grains is
1.0, indicating a round shape.
Zircon sand particles have smoother surfaces with rounded edges. Their size distribution
gives an average grain size of 195 µm and an AFS number of 71.4, Zircon sand grains
exhibit per – fractures and groove on the smooth surface. The 2 – D shape factor of Zircon
sand grains is 0.9, indicating an angular shape.
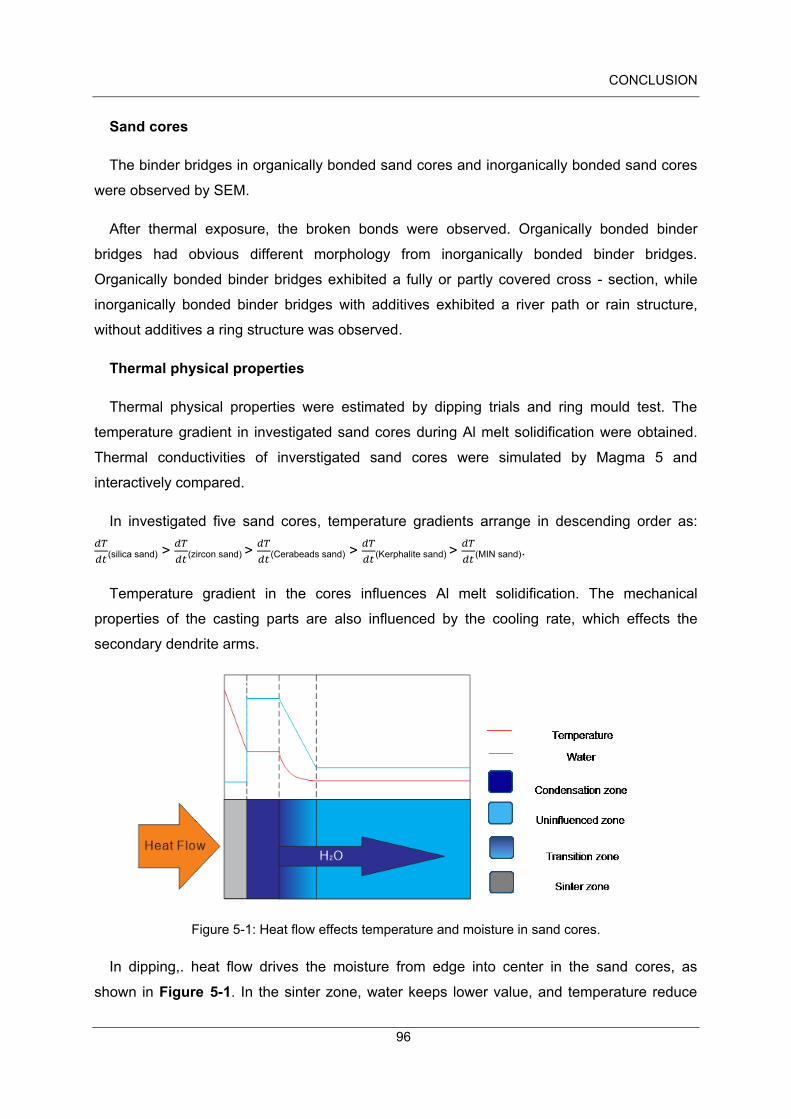
CONCLUSION
96
Sand cores
The binder bridges in organically bonded sand cores and inorganically bonded sand cores
were observed by SEM.
After thermal exposure, the broken bonds were observed. Organically bonded binder
bridges had obvious different morphology from inorganically bonded binder bridges.
Organically bonded binder bridges exhibited a fully or partly covered cross - section, while
inorganically bonded binder bridges with additives exhibited a river path or rain structure,
without additives a ring structure was observed.
Thermal physical properties
Thermal physical properties were estimated by dipping trials and ring mould test. The
temperature gradient in investigated sand cores during Al melt solidification were obtained.
Thermal conductivities of inverstigated sand cores were simulated by Magma 5 and
interactively compared.
In investigated five sand cores, temperature gradients arrange in descending order as:
𝑑𝑇
𝑑𝑡(silica sand) >
𝑑𝑇
𝑑𝑡(zircon sand) >
𝑑𝑇
𝑑𝑡(Cerabeads sand) >
𝑑𝑇
𝑑𝑡(Kerphalite sand) >
𝑑𝑇
𝑑𝑡(MIN sand).
Temperature gradient in the cores influences Al melt solidification. The mechanical
properties of the casting parts are also influenced by the cooling rate, which effects the
secondary dendrite arms.
Figure 5-1: Heat flow effects temperature and moisture in sand cores.
In dipping,. heat flow drives the moisture from edge into center in the sand cores, as
shown in Figure 5-1. In the sinter zone, water keeps lower value, and temperature reduce
CONCLUSION
97
gradually to the constant value. In condensation zone, water content hold the constant value
at 100°C, and temperature value is constant. In the tansition zone, locating between
condensation zone and uninfluenced zone, the water content reduce rapidly to a constant
value, and temperature slowly goes down till a constant value. In the situation of a core the
condensation zone moves from the outside to the centre so that the transition zone will
impinge to form a condensation zone in the centre.
Decoring behaviour
Decoring behaviour was investigated controlled impacts, which can distinguish the
behaviours between organically bonded sand cores and inorganically bonded sand core.
Organically bonded sand core with modified urea-furan-phenolic resin using the warm box
process obtained most decored sand after impacting, followed by organically bonded sand
core with an aqueous solution of phenol sulfonic acid, aluminum salts, sulfuric acid using the
warm box process, inorganically bonded sand core with water glass 39T @ using the warm
box process, inorganically bonded sand core of modified silicate binder mixture and promoter
(INOTEC TM - Promoter EP 4174), and inorganically bonded sand core with modified silicate
binder mixture and promoter (INOTECTM - Promoter WJ 4000) using the warm box process
in descending order.
REFERENCES
98
References
[1] Rao P.N., Manufacturing Technology: Foundry, Forming & Welding, 2nd Eidttion, Tata
McGraw-Hill Education, (2001), 97.
[2] Bawa H.S., Manufacturing Processes-II, Tata McGraw-Hill Education, (2004), 26.
[3] Yu K. O., Modeling for Casting and Solidification Processing, CRC Press, (2001), 313.
[4] Solenicki G., Budic I., Ciglar D., Determination of thermal conductivitiy in foundry mould
mixtures, Metalugija 49 (1), (2010), 3.
[5] J.P. Klaushish, Manufacturing processes, PHI Learning Private Limited, Second edition,
(2013), 194.
[6] Peter Beeley, Foundry technology, First published 1972, reprinted 1979, 1980, 1982,
second edition, (2001), 206.
[7] Elanchezhian C., Vijaya Ramnath B., Manufacturing Technology I, 2nd Edition, (2006), 37.
[8] Stehpan D.Chastain, Metall castiny: A Sand Casting Mannual for the Small Foundry Vol.1
America (2004) 126.
[9] Chastain S., Metal Casting: A Sand Casting Manual for the Small Foundry, Band 1, USA,
(2004), 137.
[10] Brown J., Ferrous Foundyman’s handbook, Foseco International Ltd, (2000), 150.
[11] Flemming E., Tilch W., Formstoffe und Formverfahren, Deutscher Verlag für
Grundstoffindustrie, Leipzig·Stuttgart Germany. (1993), 41.
[12] Zircon sand properties, http://www.aomevents.com/conferences/afi/papers/Dahlman.pdf;
24-03-2014.
[13] Sheidi Haruna Maihankuri, Investigation on properties of local zircon sand for sand
casting, Research Journal in Engineering and Applied Sciences 1(6), (2012), 404.
[14] Resin Coated Special Minerals and their Application in Foundries,
http://www.aomevents.com/conferences/afi/papers/Dahlman.pdf; 24-03-2014.
[15] Cerebeads sand properties,
http://www.aomevents.com/conferences/afi/papers/Dahlman.pdf; 24-03-2014.
REFERENCES
99
[16] Minsand properties, http://www.lkabminerals.com/en/Products/MinSand/, 04-04-2014.
[17] Wang L. K., Hung Y. T., Shammas N. K., Handbook of Advanced Industrial and
Hazardous Wastes Treatment, (2009), 157.
[18] West G., Fookes P. G., Lay J., Sims I., Smith M. R., Collis L., Aggregates: Sand, Gravel
and Crushed Rock Agregates for Construction Purposes(Geological Society Engineering
Geology Special Pub.No.17), Hardcover, (2001), 205.
[19] Aluminum Oxide Nanopowder / Nanoparticles, http://www.us-nano.com/inc/sdetail/690.
[20] Jain P. L., Principles of foundry technology-fourth edition, Tata McGraw-Hill publishing
company Limited, India, (2003) 56.
[21] Brown J. R., Ferrous Foundyman’s handbook, Foseco International Ltd, ISBN: 978-0-
7506-4284-2, (2000), 16.
[22] Mishellany A., Delalande G., Descantes Y., Use of the VDG 40 videograder as a grading
control device for French highway construction, USA, 2000.
[23] The standards in germen and international form,
http://www.diedrahtweber.de/de/anwendungen-produkte/drahtgewebe-allgemein/deutsche-u-
internationale-normen.html, 09 -11 – 2014.
[24] Huang A.B., Mayne P.W., Geotechnical and Geophysical Site Characterization 4, (2013),
1288.
[25] Prowell B. D., Zhang J. N., Brown E. R., Aggregate properties and the performance of
superpave-designed hot mix asphalt, Transportation Research Board - Report 539, USA
(2005), 38.
[26] International standard ISO 3310, Test sieves – technical requirements and testing – part
1: test sieves of metal wire cloth, fourth edition, (2000).
[27] Altan T, Sand, sand additives, sand properties, and sand reclamation, Marmara
University Turkey, http://mimoza.marmara.edu.tr/~altan.turkeli/files/cpt-2-sand_sand.pdf, 03-
11-2014.
[28] Steel castings handbook, sixth edition Steel founders’ of society of America, (1995) 27-6
[29] Spezialsande - Formgrundstoffe für die moderne Kern- und Formherstellung,
http://www.google.de/url?sa=t&rct=j&q=&esrc=s&source=web&cd=2&ved=0CCYQFjAB&url=
REFERENCES
100
http%3A%2F%2Fwww.huettenes-
albertus.com%2Fno_cache%2Fdownloads%2Findex.html%3Fcid%3D300%26did%3D556%
26sechash%3D7d104cac&ei=JHOBVP7dNJCp7AbZ-
4DwAQ&usg=AFQjCNFazoyNSnXShIvB5rpsSrY-xyYYMg&bvm=bv.81177339,bs.1,d.bGQ.
[30] Stauder B., Thermophysikalische Daten Zusammenfassung der Messergebnisse,
Nemak, Austria, (2005).
[31] Bradley R. Schrotenboer, Alan F. Arbogast, Locating alternative sand sources for
Michigan’s foundry industry:A geographical approach, Applied Geography 30, (2010), 697.
[32] Polzin, H., Anorganische Binder zur Form- und Kernherstellung in der Gießerei, Media-
Print Informationstechnologie GmbH, Paderborn, (2012), 160.
[33] Elam J. W., Londergan A., Gendt S. D. Bent S. F., Straten O., Roozeboom F., Delabie
A., Atomic layer depositoion applications 6, vol.33, No.2, USA, (2010), 48.
[34] Totten G.E., MacKenzie D.S., Handbook of Aluminum: Vol.1: Physical Metallurgy and
Processes. CRC Press, (2003), 615.
[35] Prass, I., Moulding Sand Casting College Core Manufacturing, Nemak, Austria, (2009).
[36] Saruhan B., Oxide-Based Fiber-Reinforced Ceramic-Matrix Composites: Principles and
Materials; Kluwer academic publishers, USA, (2003), 28.
[37] Temperature-Dependent Phase Transitions of ZrO2, Material design application note
(2009), 1
[38] Hagen R., Lamy C., Myhre B. and Peng H., Mullite formation, high – temperature
properties of Andalusit – alumina based LCC and ULCC, Presented at UNITECR´09 in
Salvador de Bahia, Brazil, (2009), 13
[39]The introduction of Mullite as a refractory material,
http://www.kyanite.com/assets/Mullite_SpecSheet.pdf, 15-11-2014.
[40] Sharma B. K., Industry chemistry including chemical engineering, chapter 32 – refractory,
GOEL Publishing House, (1997), 641.
[41] The introduction of MINsand as a refractory material,
http://www.lkabminerals.com/en/News/News/Small-beads-big-impact/, 15-11-2014.

REFERENCES
101
[42] Brümmer G., Döpp R., Trocken statt Begasen mit CO2 beim Wasserglassverfahren-
neue Ansätze bei alten Bindermitteln, Giesserei 84, (1997), Nr.13, 12.
[43] Sáenz A., Velasco A., Talamantes J., Colás R., Development of inorganic binders for the
manufacture of sand cores used in the automotive casting Industry. (2012).
[44] Brümmer G., Döpp R., Trocken statt Begasen mit CO2 beim Wasserglassverfahren-
neue Ansätze bei alten Bindermitteln, Giesserei 84, (1997), Nr.13, 13.
[45] Prass I., Comparison of organic core production processes, Nemak Linz GmbH (2012).
[46] Gardziella A., Pilato L. A., Knop A., Phenolic Resins: Chemistry, Applications,
Standardization, Safety and Ecology Springer; Auflage: 2nd completely rev. ed. 2000 (15.
Oktober 1999), 303.
[47] Brown R. J., Foseco Ferrous Foundrymans Handbook 11 th Edition, Butterworth
Heinemann, (2000), 189.
[48] Peter Beeley, Foundry technology, first published 1972, reprinted 1979, 1980, 1982,
second edition (2001), 198.
[49] Brown R. J., Foseco foundryman’s handbook, Butterworth-Heinemann; 10 th Edition,
Butterworth Heinemann, (1994), 71.
[50] Jain P. L., Principles of foundry technology-fourth edition, Tata McGraw-Hill publishing
company Limited, India, (2003) 91.
[51] Flemming E., Tilch W., Formstoffe und Formverfahren, Deutscher Verlag für
Grundstoffindustrie, Leipzig·Stuttgart Germany. (1993), 78.
[52] Döpp R., Deike R., Gettwert G,. Beitrag zum Wasserglass-CO2-verfahren, Giesserei 72,
(1985), Nr. 22, 628.
[53] T.V. Ramana Rao, Metal Casting Principles and practice, new age international (p) Ltd.,
New Delhi, (2010), 24.
[54] Kleinheyer U., Jahreübersicht Formstoffe (23.Folge) Teil 2: Formverfahren mit nicht
tongebundenen Formstoffen; Zusatzstoffe; Überzugstoffe, Giesserei 73, (1986), Nr. 22, 657.
[55] Osterberg L., Anderson W., Stoberiet 62, 1985, Nr.6, S, 8-16 and Giesserei 73, 1986 Nr.
22, S. 657.

REFERENCES
102
[56] Polzin H,. Untersuchungen zur Mikrowellenverfahren von wasserglasgebundenen
Gießereiformstoffen, Technische Universität Bergakademie Freiberg. Freiberg, (2000), 11.
[57] Kaschnitz E., The influence of the quality of thermal conductivity and thermal expansion
data on the numerical simulation in metal part production, Thermal Conductivity 30: Thermal
Expansion 18: Joint Conferences: August 29-September 2, 2009, Pittsburgh, Pennsylvania,
USA, (2010), 133.
[58] Voss D., Charakterisierung eines neuen entgasungsarmen und verbrennbaren
Formstoffes für Gießereianwendungen Kohlenstoff AeroSande, (2004).
[59] Eman J. Abed, The influence of different casting method on solidification time and
mechanical properties of AL- Sn castings, International Journal of Engineering & Technology
IJET-IJENS Vol: 11 No: 06, (2011).
[60] The Metal Casting and Heat Treating Industry: Guide to Pollution Prevention, DInae
publishing company, (1996), 60.
[61] Rajput R. K., A textbook of manufacturing technology: Manufacturing process, Firewall
Media, (2007), 108.
[62] Sharma P. C., A Textbook of Production Technology: Manufacturing Processes, India
(2007), 177.
[63] Sieve analysis, http://en.wikipedia.org/wiki/Sieve_analysis, 23 – 03 – 2014.
[64] Pavement Interactive. Gradation Test. (2007).
[65] Pati S., Drelich J., Jha A., Neelameggham N.R., Prentice L., Wang C., Energy
Technology 2013: Carbon Dioxide Management and Other Technologies, (2013), 40.
FIGURE CAPTIONS
103
FIGURE CAPTIONS
FIGURE 1-1: COMPLEX CASTING PARTS. ............................................................................................................... 10
FIGURE 2-1: THERMAL EXPANSION OF SILICA AND SILICA SAND, 1. SILICA SAND, 2. SILICA [11]. .......................... 13
FIGURE 2-2: TYPES OF SAND GRAINS [20]. .............................................................................................................. 15
FIGURE 2-3: THERMAL EXPANSION OF DIFFERENT SANDS BONDED WITH SODIUM SILICATE (WARM BOX
HARDENED AND MICROWAVE DRIED) WITH INCREASING TEMPERATURES [30]. ......................................... 19
FIGURE 2-4: SILICA STRUCTURE PHASE TRANSFORMATION AT 573 °C [32], (A) Α-QUARTZ (TRIGONAL) Ρ = 2. 65 G
/ CM ³, (B) Β-QUARTZ (HEXAGONAL) Ρ= 2. 30 G / CM ³ WITH A CHANGE POINT AT 573 °C. ....................... 19
FIGURE 2-5: PH VALUES OF DIFFERENT BASE SANDS [40] [41]. ................................................................................. 21
FIGURE 2-6: PHENOLRESIN AND ISOCYANATE WITH AMIN GAS TO FORM A COLD BOX BINDER BRIDGE [45]. ..... 23
FIGURE 2-7: HOT BOX PROCESS FOR MAKING CORES [46]. .................................................................................... 23
FIGURE 2-8: UREA AND FORMALDEHYDE WITH PHENOL/FURAN RESIN AND AMMONIUM ISOLATE AS A LATENT
CORING AGENT UNDER HEATING TO FORM A HOT BOX BINDER BRIDGE [45]. ............................................. 24
FIGURE 2-9: FORMATION OF AN INORGANIC-BINDER BRIDGE [45]. ...................................................................... 27
FIGURE 2-10: TEMPERATURE ALONG A LINE PERPENDICULAR TO THE MOULD-METAL INTERFACE [59]. ............. 29
FIGURE 3-1: SIEVE SHAKER USED FOR GRANULOMETRY AND SCALE. .................................................................. 32
FIGURE 3-2: BINARY SHAPE OF ZIRCON SAND PARTICELS. ................................................................................... 33
FIGURE 3-3: (A) OPTICAL MICROSCOPY EQUIPMENT (ZEISS DISCOVERY 2.0), (B) SEM / EDX EQUIPMENT. ........ 34
FIGURE 3-4: (A) CORE SHOOTING MACHINE WITH THE PREHEATED MOULD (B). INSTALLED CYLINDRICAL SHAPE
MOULD (C) INSTALLED TRAPEZOIDAL SHAPE MOULD. ................................................................................ 35
FIGURE 3-5: WOODED MOULD FOR MAKING OUTER CORES (A).THE ENTIRETY WOODEN MOULD (B) THE
WOODEN FOUNDATION ............................................................................................................................... 36
FIGURE 3-6: SKETCH OF POSITIONS OF THERMAL COUPLES. ............................................................................... 38
FIGURE 3-7: DEVICE AND PROCESS OF DIPPING TRAILS (A)THE BRACKET FOR FIXING THE SAND CORE AND
THERMAL COUPLES; (B) THE PROCESS OF DIPPING INTO THE MELTING AL ALLOY OVEN; (C) DATA
ACQUISITION TO MEASURE THE TEMPERATURE (UNIVERSALMAßGERÄTE DEWE – 2000; 1000894); (D) THE
MEASUREMENT PROCESS OF DIPPING TRIALS. ............................................................................................ 39
FIGURE 3 - 8: SKETCH OF THE RING MOULD TEST WITH THERMAL COUPLES. (A) THREE THERMAL COUPLES
FIXED INTO SAND CORE AND LINKED ONE THERMAL COUPLES BETWEEN STEEL RING MOULD AND SAND
CORE ............................................................................................................................................................. 40
FIGURE 3-9: (A) INTERNAL CORE, OUTER CORE AND STEEL PLATE (B) CASTING BOX BEFORE POURING AL-MELT.
...................................................................................................................................................................... 41
FIGURE 3-10: (A) THE STKECH OF PURING AL – MELT INTO FIXED INNER CORE AND SAND MOULD (B) AL – MELT
SOLIDIFIED IN A SAND MOULD. .................................................................................................................... 41
FIGURE 3-11: (A) MOTIFIED SHAKE OUT DEVICE (B) SPECIMEN AFTER SHAKE OUT OPERATION. ........................ 42
FIGURE CAPTIONS
104
FIGURE 3-12: THE SCHEMATIC SHAKE OUT OPERATION WITH IMPACT DEVICE. ................................................. 42
FIGURE 3-13: (A) 25 THERMAL TEST POINTS IN THE SAND CORE. (B) GEOMETRY OF SIMULATED SAND CORE
WITH 25 THERMAL COUPLES IN SAND CORE ............................................................................................... 43
FIGURE 3-14: Λ SILICA SAND VALUE WITH TEMPERATURE. ......................................................................................... 44
FIGURE 4-1: GRAIN SIZE DISTRIBUTION OF FIVE DIFFERENT BASE SANDS. .......................................................... 45
FIGURE 4-2: GRAIN SIZE DISTRIBUTION BY WEIGHT IN FIVE INVESTIGATED RAW SANDS. (A) H32 SILICA SAND
GRAIN SIZE DISTRIBUTION (B) CERABEADS SAND GRAIN SIZE DISTRIBUTION (C) KERPHALITE SAND GRAIN
SIZE DISTRIBUTION (D) MIN SAND GRAIN SIZE DISTRIBUTION (E) ZIRCON SAND GRAIN SIZE DISTRIBUTION.
...................................................................................................................................................................... 46
FIGURE 4-3: AFS NUMBER OF FIVE DIFFERENT BASE SANDS. ............................................................................... 47
FIGURE 4-4: THE RELATIONSHIPS BETWEEN AFS GRAIN FINENESS NUMBER AND AVERAGE GRAIN SIZE IN FIVE
SANDS. .......................................................................................................................................................... 48
FIGURE 4-5: TESTED SAND PARTICLES IN EACH BASE SAND TO MEASURE SHAPE FACTOR (A) CERABEADS SAND
(B) H32 SILICA NEW SAND (C) KERPHALITE SAND (D) MIN SAND (E) ZIRCON SAND. ................................... 49
FIGURE 4-6: SHAPE FACTOR DISTRIBUTION OF FIVE DIFFERENT BASE SANDS (A) SHAPE FACTOR DISTRIBUTION
OF CERABEADS SAND (B) SHAPE FACTOR DISTRIBUTION OF SILICA SAND (C) SHAPE FACTOR DISTRIBUTION
OF KERPHALITE SAND (D) SHAPE FACTOR DISTRIBUTION OF MIN SAND (D) SHAPE FACTOR DISTRIBUTION
OF ZIRCON SAND. ......................................................................................................................................... 50
FIGURE 4-7: THE SHAPE FACTORS OF DIFFERENT RAW SANDS. ........................................................................... 51
FIGURE 4-8: MICROSCOPY IMAGES OF RAW SANDS (A) CERABEADS 650 RAW SAND (B) SILICA SAND H32 (C)
KERPHALITE OR ANDALUSIT RAW SAND (D) MIN SAND (E) ZIRCON RAW SAND. ........................................ 52
FIGURE 4-9: DIFFERENT SAND PARTICLES OF CERABEADS RAW SAND (A) DIFFERENT SIZE OF ROUNDED SAND
PARTICLES (B) SINGLE PARTICLES AND BONDED PARTICLES (C) MORPHOLOGY OF SAND PARTICLE (D)
SURFACE OF CERABEADS SAND PARTICLE. .................................................................................................. 53
FIGURE 4-10: VIEW OF CERABEADS SAND AND THEIR CHEMICAL COMPOSITIONS. ............................................ 54
FIGURE 4-11: DIFFERENT SAND PARTICLES OF H32 RAW SAND (A) SHAPES OF H32 SILICA SANDS (B) ROUGH
SURFACE AND FRACTURE (C) THE PARTICLE WITH DISTINCT FACES (D) SMOOTH ROUND SURFACE. ........ 55
FIGURE 4-12: THE FRACTURED SURFACE AND GROOVE ON SILICA SAND PARTICLE AND ITS CHEMICAL
COMPOSITIONS. ........................................................................................................................................... 56
FIGURE 4-13: DIFFERENT SAND PARTICLES OF KERPHALITE RAW SAND. (A) DIFFERENT SIZE SAND PARTICLES
WITH SHARP EDGES AND CORNERS (B) AN OBVIOUS CUBIC SHAPE PARTICLE (C) MORPHOLOGY OF AN
IRREGULAR AND SHARPLY POINTED PARTICLES SAND PARTICLE (D) SURFACE OF KERPHALITE SAND
PARTICLE. ..................................................................................................................................................... 57
FIGURE 4-14: VIEW OF KERPHALITE SAND AND THEIR CHEMICAL COMPOSITIONS. ............................................ 58
FIGURE 4-15: DIFFERENT SAND PARTICLES OF MIN RAW SAND. (A) DIFFERENT SIZE SAND PARTICLES WITH
ROUND PARTICLES (B) SOME SPHEROIDAL PARTICLES (C) AGGLOMERATION OF TWO PARTICLES (D)
SURFACE OF MIN SAND PARTICLE ................................................................................................................ 59

FIGURE CAPTIONS
105
FIGURE 4-16: VIEW OF MIN SAND AND THEIR CHEMICAL COMPOSITIONS. ........................................................ 60
FIGURE 4-17: DIFFERENT SAND PARTICLES OF ZIRCON RAW SAND (A) ROUNDED EDGES IRREGULAR PARTICLES
(B) PRE-FRACTURES AND GROOVES ON THE SURFACES (C) FRACTURES ON THE SURFACE (D) SMOOTH
SURFACE. ...................................................................................................................................................... 61
FIGURE 4-18: THE MICRO VIEW OF ZIRCON SAND AND CHEMICAL COMPOSITIONS. .......................................... 62
FIGURE 4-19: (A) AND (B) ORGANICALLY BONDED SAND CORE WITH MODIFIED UREA-FURAN-PHENOLIC RESIN
USING THE WARM BOX PROCESS BEFORE CASTING, (C) A CRACK IN THE BINDER BRIDGE BETWEEN TWO
SAND PARTICLES AFTER AL CASTING (D) BROKEN BINDER BRIDGES WITH FULLY COVERED INTERSECTION
AND PARTLY COVERED INTERSECTION. ........................................................................................................ 63
FIGURE 4-20: (A) AND (B) ORGANICALLY BONDED SAND CORE WITH AN AQUEOUS SOLUTION OF PHENOL
SULFONIC ACID, ALUMINUM SALTS, SULFURIC ACID IN WARM BOX PROCESS BEFORE CASTING, (C) AND (D)
ORGANICALLY BONDED SAND CORES AFTER CASTING. ............................................................................... 64
FIGURE 4-21: (A) AND (B) INORGANICALLY BONDED SAND CORE WITH MODIFIED SILICATE BINDER MIXTURE
AND PROMOTER (INOTECTM - PROMOTER WJ 4000) USING THE WARM BOX PROCESS BEFORE CASTING. 65
FIGURE 4-22: (A) AND (B) INORGANICALLY BONDED SAND CORE WITH MODIFIED SILICATE BINDER MIXTURE
WITH PROMOTER (INOTECTM - PROMOTER WJ 4000) USING THE WARM BOX PROCESS) AFTER CASTING. 66
FIGURE 4-23: (A) AND (B) INORGANICALLY BONDED SAND CORE OF MODIFIED SILICATE BINDER MIXTURE AND
PROMOTER (INOTEC PROMOTER EP 4174) USING WARM BOX PROCESS BEFORE CASTING. ..................... 66
FIGURE 4-24: (A) AND (B) INORGANICALLY BONDED SAND CORE OF MODIFIED SILICATE BINDER MIXTURE AND
PROMOTER (INOTEC PROMOTER EP 4174) USING WARM BOX PROCESS AFTER CASTING SHOWING AN
UNBROKEN BINDER BRIDGE AND A TYPICAL INORGANIC FRACTURE SURFACE INDICATING A BRITTLE
BEHAVIOUR. ................................................................................................................................................. 67
FIGURE 4-25: (A) AND (B) INORGANICALLY BONDED SAND CORE WITH WATER GLASS 39T @ USING THE WARM
BOX PROCESS BEFORE CASTING. .................................................................................................................. 67
FIGURE 4-26: (A) AND (B) INORGANICALLY BONDED SAND CORE WITH WATER GLASS 39T @ USING THE WARM
BOX PROCESS AFTER CASTING. .................................................................................................................... 68
FIGURE 4-27: TEMPERATURE OVER TIME CURVES OF MIN SAND SPECIMEN DIPPING TRIAL IN 780 °C AL- MELTS.
...................................................................................................................................................................... 69
FIGURE 4-28: TEMPERATURE DISTRIBUTION IN DIFFERENT SANDS AT THE 25 MM TESTING POINT DURING
DIPPING TRIAL IN 780 °C AL - MELT. ............................................................................................................. 70
FIGURE 4-29:TEMPERATURE TIME CURVES IN DIFFERENT SANDS AT 15 MM TESTING POINT DURING DIPPING
TRIAL IN 780 °C AL- MELT. ............................................................................................................................ 71
FIGURE 4-30: TEMPERATURE TIME CURVES IN DIFFERENT SANDS AT 5 MM TESTING POINT IN DIPPING TRIAL IN
780 °C AL - MELT ALLOYS.............................................................................................................................. 72
FIGURE 4-31: THE WATER PEAK IN H32 SILICA SAND CORES WITH DIFFERENT DRYING TIMES BY MICROWAVE (0
MINS / 5 MINS / 10 MINS), THE SAND SPECIMENS DIPPING INTO AL – MELT AT 780 °C. ........................... 73
FIGURE 4-32: THE SIGNIFICANT POINTS IN THE CURVES IN THE RING MOULD TEST. .......................................... 74

FIGURE CAPTIONS
106
FIGURE 4-33: TEMPERATURE TIME CURVE AT THE CENTRE POSITION FOR RING MOULD TESTS WITH DIFFERENT
CORE SAND TYPES WITH WATER WATER GLASS BETOL ® 39 T. ................................................................... 75
FIGURE 4-34: TEMPERATURE TIME CURVE AT THE POSITION OF 15 MM FOR RING MOULD TESTS WITH
DIFFERENT CORE SAND TYPES WITH WATER WATER GLASS BETOL ® 39 T. ................................................ 76
FIGURE 4-35: TEMPERATURE TIME CURVE AT THE POSITION OF 5 MM FOR RING MOULD TESTS WITH
DIFFERENT CORE SAND TYPES BONDED WITH WATER WATER GLASS BETOL ® 39 T. ................................. 76
FIGURE 4-36: COMPARISON OF DT / DT (0-250°C) IN DIFFERENT SANDS AND DIFFERENT POSITION. ...................... 77
FIGURE 4-37: RING MOULD TEST OF WITH WATER GLASS 39T BONDED H32 SILICA SAND WITH AN INITIAL
TEMPERATURE OVER 100 °C WITH MICRO WAVE OVEN TREATMENT. ....................................................... 78
FIGURE 4-38: RING MOULD TEST OF WITH WATER GLASS 39T BONDED H32 SILICA SAND WITH AN INITIAL
TEMPERATURE OVER 100 °C WITHOUT MICRO WAVE OVEN TREATMENT. ................................................ 79
FIGURE 4-39: RING MOULD TEST OF WITH WATER GLASS 39T BONDED H32 SILICA SAND WITH AN INITIAL
TEMPERATURE BELOW 100 °C WITHOUT MICRO WAVE OVEN TREATMENT. ............................................. 79
FIGURE 4-40: RING MOULD TEST OF WITH WATER GLASS 39T BONDED H32 SILICA SAND WITH AN INITIAL
TEMPERATURE BELOW 100 °C WITH MICRO WAVE OVEN TREATMENT. .................................................... 80
FIGURE 4-41: (A) AND (B) FEATURES OF THREE DIFFERENT IMPACT ENERGIES AND TIMES BY IMPACT DEVICE IN
ORGANICALLY BONDED INTERNAL CORE. .................................................................................................... 81
FIGURE 4-42: SCHEMATIC CROSS SECTION OF SPECIMENS AFTER THE DECORED SAND REMOVED AL CASTING (A)
ONE IMPACT (B) TWO IMPACTS (C) THREE IMPACTS. .................................................................................. 81
FIGURE 4-43: DECORED SANDS SAMPLES FROM ORGANICALLY BONDED SAND CORE WITH MODIFIED UREA-
FURAN-PHENOLIC RESIN IN WARM BOX PROCESS AFTER IMPACTING. ....................................................... 82
FIGURE 4-44: DECORED SANDS SAMPLES FROM ORGANICALLY BONDED SAND CORE WITH MODIFIED UREA-
FURAN-PHENOLIC RESIN IN WARM BOX PROCESS AFTER IMPACTS. ........................................................... 82
FIGURE 4-45: DECORED SANDS SAMPLES FROM ORGANICALLY BONDED SAND CORE WITH AN AQUEOUS
SOLUTION OF PHENOL SULFONIC ACID, ALUMINUM SALTS, SULFURIC ACID (WARM BOX) AFTER IMPACT.
...................................................................................................................................................................... 83
FIGURE 4-46: DECORED SANDS SAMPLES FROM ORGANICALLY BONDED SAND CORE WITH AN AQUEOUS
SOLUTION OF PHENOL SULFONIC ACID, ALUMINUM SALTS, SULFURIC ACID IN WARM BOX PROCESS AFTER
IMPACT. ........................................................................................................................................................ 84
FIGURE 4-47: DECORED SANDS SAMPLES FROM INORGANICALLY BONDED SAND CORE WITH MODIFIED
SILICATE BINDER MIXTURE AND PROMOTER (INOTECTM - PROMOTER WJ 4000) IN WARM BOX PROCESS
AFTER IMPACT. ............................................................................................................................................. 84
FIGURE 4-48: DECORED SANDS SAMPLES FROM INORGANICALLY BONDED SAND CORE WITH MODIFIED
SILICATE BINDER MIXTURE AND PROMOTER (INOTECTM - PROMOTER WJ 4000) IN WARM BOX PROCESS
AFTER IMPACT. ............................................................................................................................................. 85

FIGURE CAPTIONS
107
FIGURE 4-49: DECORED SANDS SAMPLES FROM INORGANICALLY BONDED SAND CORE OF MODIFIED SILICATE
BINDER MIXTURE AND PROMOTER (INOTEC TM PROMOTER EP 4174) IN WARM BOX PROCESS AFTER
IMPACT. ........................................................................................................................................................ 86
FIGURE 4-50: DECORED SANDS SAMPLES FROM INORGANICALLY BONDED SAND CORE OF MODIFIED SILICATE
BINDER MIXTURE AND PROMOTER (INOTEC TM PROMOTER EP 4174) IN WARM BOX PROCESS AFTER
IMPACT. ........................................................................................................................................................ 86
FIGURE 4-51: DECORED SANDS SAMPLES FROM INORGANICALLY BONDED SAND CORE WITH WATER GLASS 39T
@ USING THE WARM BOX PROCESS AFTER IMPACT. .................................................................................... 87
FIGURE 4-52 : AGGLOMERATES FORM A BRIDGE STRUCTURE AND HINDER FINE SAND TO FALL DOWN DURING
DECORING. ................................................................................................................................................... 88
FIGURE 4-53: DECORED SANDS SAMPLES FROM INORGANICALLY BONDED SAND CORE WITH WATER GLASS 39T
@ USING THE WARM BOX PROCESS AFTER IMPACT. .................................................................................... 88
FIGURE 4-54: COMPARISON OF DECORING ABILITIES FOR FIVE DIFFERENT INTERNAL CORES, NO.1 IS THE
ORGANICALLY BONDED SAND CORE WITH MODIFIED UREA-FURAN-PHENOLIC RESIN (WARM BOX), NR. 2
IS THE ORGANICALLY BONDED SAND CORE WITH AN AQUEOUS SOLUTION OF PHENOL SULFONIC ACID,
ALUMINUM SALTS, SULFURIC ACID (WARM BOX), NO. 3 IS THE INORGANICALLY BONDED SAND CORE
WITH WATER GLASS 39T @ (WARM BOX), NR. 4 IS THE INORGANICALLY BONDED SAND CORE OF
MODIFIED SILICATE BINDER MIXTURE AND PROMOTER (INOTEC TM PROMOTER EP 4174), NR. 5 IS THE
INORGANICALLY BONDED SAND CORE WITH MODIFIED SILICATE BINDER MIXTURE AND PROMOTER
(INOTECTM - PROMOTER WJ 4000) (WARM BOX). ........................................................................................ 89
FIGURE 4-55: COMPARISON BETWEEN SIMULATION CURVE AND EXPERIMENT CURVE OF ZIRCON SAND AT THE
SAME PARAMETER OF 780 °C WITH THE PROPORTIONAL CONSTANT Q QUARTZ MAGMA = 1.0. ....................... 91
FIGURE 4-56: COMPARISON BETWEEN SIMULATION CURVES AND EXPERIMENT CURVES OF ZIRCON SAND AT
THE SAME PARAMETERS AT 700 °C WITH THE PROPORTIONAL CONSTANT Q QUARTZ MAGMA = 1.0. .............. 92
FIGURE 4-57: FIVE ΛS VALUES OVER TIME IN DIFFERENT SAND CORES, Λ H32 SILICA SAND AND Λ MIN SAND ARE
OVERLAPPED, Λ KERPHALITE SAND AND Λ CERABEADS SAND ARE OVERLAPPED. .......................................................... 94
FIGURE 5-1: HEAT FLOW EFFECTS TEMPERATURE AND MOISTURE IN SAND CORES. .......................................... 96

TABLE CAPTIONS
108
TABLE CAPTIONS
TABLE 2-1. COMPARISON OF PHYSIC PROPERTIES OF RAW SANDS [19]. ............................................................... 15
TABLE 2-2. THE RELATIVE VALUES BETWEEN AVERAGE GRAIN SIZE AND AFS GRAIN FINENESS NUMBER [21]. .... 16
TABLE 2-3 . LINEAR EXPANSION COEFFICIENT OF THE MOULD BASE MATERIALS [29]. ......................................... 18
TABLE 2-4: PROPERTIES OF WATER GLASS MODULE IN THE SAND CORE [52]. ...................................................... 26
TABLE 3-1 : IMPORTANT PARAMETERS IN THE SIEVE ANALYSIS [65]. ..................................................................... 32
TABLE 3-2: THE PARAMETERS OF PRODUCING FIVE INVESTIGATED INTERNAL CORES. ....................................... 37
TABLE 4-1: COMPARISON OF DT / DT IN DIFFERENT BASE SANDS. ...................................................................... 72
TABLE 4-2: THE PROCESS PARAMETERS DURING THE RING MOULD TEST. .......................................................... 74
TABLE 4-3: SIMULATED DIFFERENT Q SAND CORE OF SAND CORES. .......................................................................... 93

APPENDIXES
A-1
Appendixes
TABLE A- 1: GRAIN SIZE SIEVE ANALYSIS H32 SILICA SAND ..................................................................................... 1
TABLE A- 2: GRAIN SIZE SIEVE ANALYSIS CERABEADS SAND ................................................................................... 2
TABLE A- 3: GRAIN SIZE SIEVE ANALYSIS KERPHALITE SAND .................................................................................. 3
TABLE A- 4: GRAIN SIZE SIEVE ANALYSIS MIN SAND ............................................................................................... 4
TABLE A- 5: GRAIN SIZE SIEVE ANALYSIS ZIRCON SAND .......................................................................................... 5
TABLE A- 6: THE KEY PARAMETERS IN THE RING MOULD TEST IN ZIRCON SAND CORE 1 # ................................... 6
TABLE A- 7: THE KEY PARAMETERS IN THE RING MOULD TEST IN ZIRCON SAND CORE SAMPLE 2 # ..................... 7
TABLE A- 8: THE KEY PARAMETERS IN THE RING MOULD TEST IN MIN SAND CORE 1 # ........................................ 8
TABLE A- 9: THE KEY PARAMETERS IN THE RING MOULD TEST IN MIN SAND CORE 2 # ........................................ 9
TABLE A- 10: THE KEY PARAMETERS IN THE RING MOULD TEST IN KERPHALITE SAND CORE-1 .......................... 10
TABLE A- 11: THE KEY PARAMETERS IN THE RING MOULD TEST IN KERPHALITE SAND CORE 2 # ........................ 11
TABLE A- 12: THE KEY PARAMETERS IN THE RING MOULD TEST IN H32 SAND CORE 1 # ..................................... 12
TABLE A- 13: THE KEY PARAMETERS IN THE RING MOULD TEST IN H32 SAND CORE 2 # ..................................... 13
TABLE A- 14: THE KEY PARAMETERS IN THE RING MOULD TEST IN CERABEADS SAND CORE 1 # ........................ 14
TABLE A- 15: THE KEY PARAMETERS IN THE RING MOULD TEST IN CERABEADS SAND CORE 2 # ........................ 15
TABLE A- 16 : SPECIAL HEAT CAPACITY OF H32 SILICA SAND OVER TEMPERATURE............................................. 16
TABLE A- 17 : SPECIAL HEAT CAPACITY OF KERPHALITE SAND OVER TEMPERATURE .......................................... 17
TABLE A- 18 : SPECIAL HEAT CAPACITY OF CERABEADS SAND OVER TEMPERATURE ........................................... 18
TABLE A- 19 : SPECIAL HEAT CAPACITY OF MIN SAND OVER TEMPERATURE ....................................................... 19
TABLE A- 20 : SPECIAL HEAT CAPACITY OF ZIRCON SAND OVER TEMPERATURE ................................................. 20
TABLE A- 21 : THE DENSITY OVER TEMPERATURE OF FIVE BASE SAND ................................................................ 21
FIGURE A- 1: THE ILLUSTRATION OF THE CASTING BOX MOULD BOTTOM PLATE ............................................... 22
FIGURE A- 2: THE ILLUSTRATION OF THE CASTING BOX MOULD INSIDE CORE .................................................... 23
FIGURE A- 3: THE ILLUSTRATION OF THE CASTING BOX MOULD OUTSIDE CORE ................................................. 24
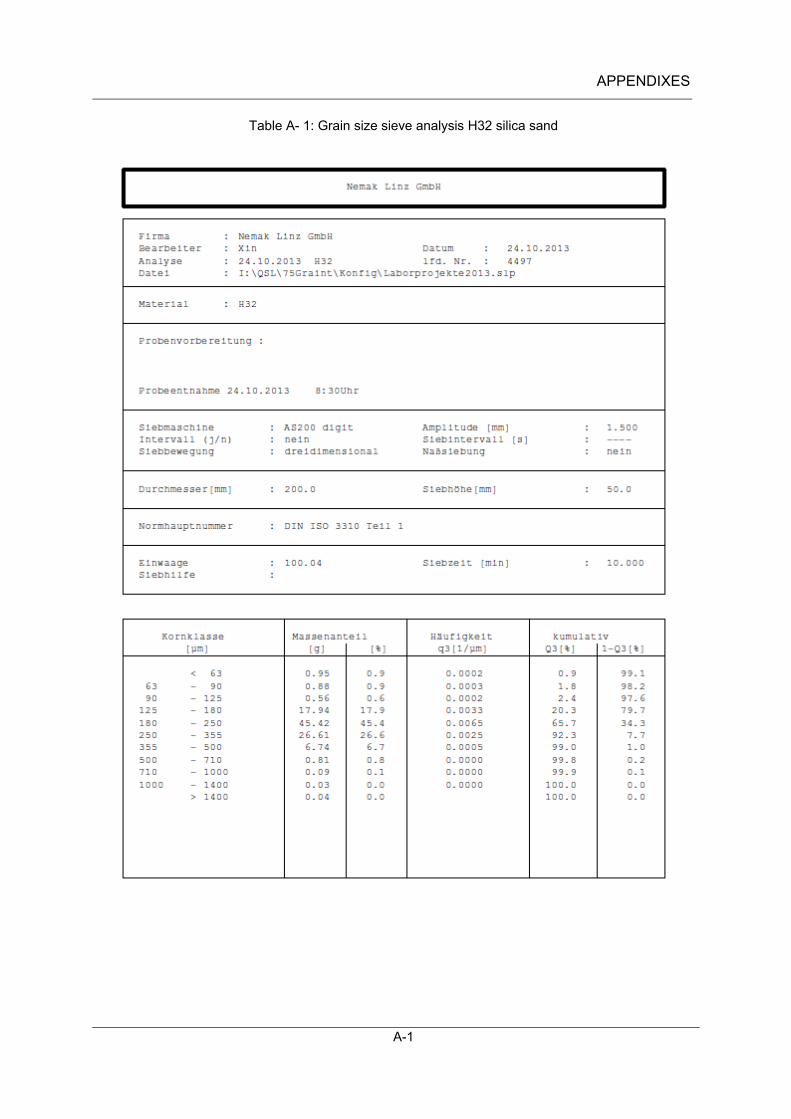
APPENDIXES
A-1
Table A- 1: Grain size sieve analysis H32 silica sand

APPENDIXES
A-2
Table A- 2: Grain size sieve analysis Cerabeads sand

APPENDIXES
A-3
Table A- 3: Grain size sieve analysis Kerphalite sand
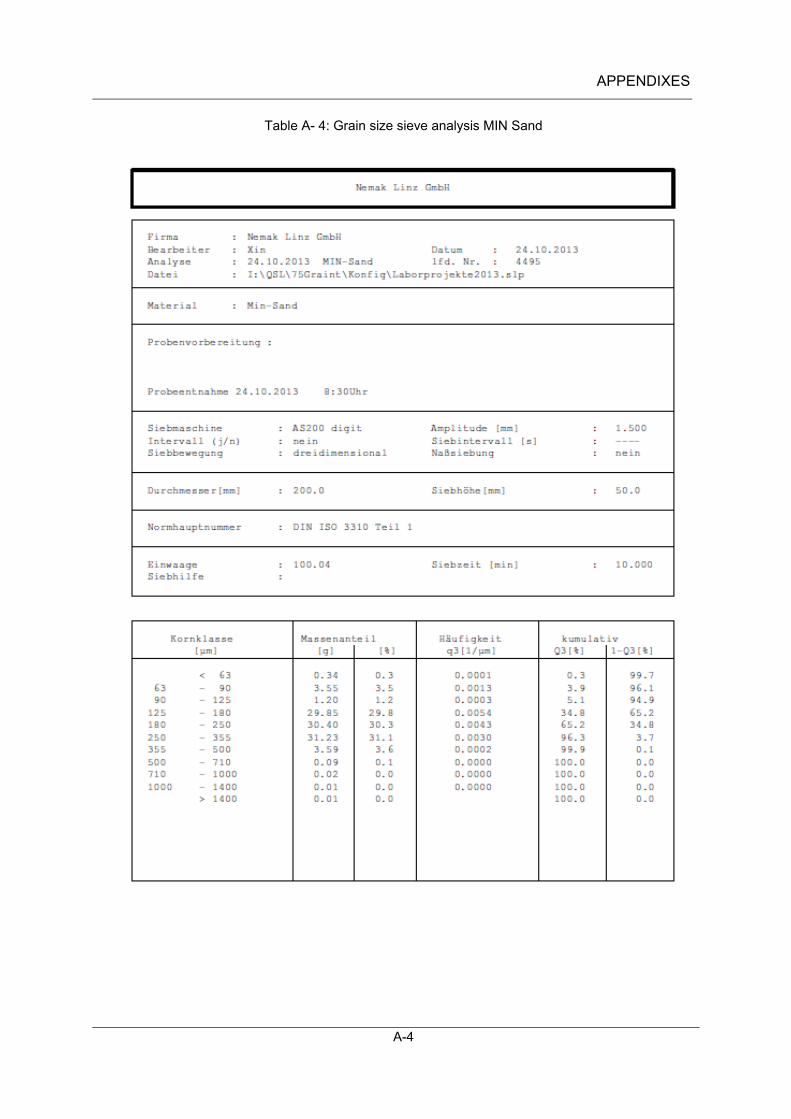
APPENDIXES
A-4
Table A- 4: Grain size sieve analysis MIN Sand

APPENDIXES
A-5
Table A- 5: Grain size sieve analysis Zircon Sand

APPENDIXES
A-6
Table A- 6: The key parameters in the ring mould test in Zircon sand core 1 #
Ring mold T air in mold Core center Core side 15mm Core side 5mm
Pouring time Temp. 200 160 113 116 134
Gradient at 200°C(dT / dt) - - 0.37 0.55 2.27
Time at 200°C(s) - 6,0-6,5 233,0 154 29,0
Max. Temperature 397,07 638 320 323 366
Time at Max Temp.(s) 125,0 3,0 674,0 582,0 236,0
Casting melting 739°C Core size H: 50mm D: 50mm

APPENDIXES
A-7
Table A- 7: The key parameters in the ring mould test in Zircon sand core sample 2 #
Ring mold T air in mold Core center Core side 15mm Core side 5mm
Pouring time Temp. 200,36 105,74 31,38 35,58 42,47
Gradient at 200°C(dT / dt) - - 0.54 0.69 1.75
Time at 200°C(s) - 0,5-1,0 311,0 237,0 90,0
Max. Temperature 408,28 638 301 306 320
Time at Max Temp.(s) 85,5 2,0 754,5 696,0 488,5
Casting melting 730°C Core size H: 50mm D: 50mm
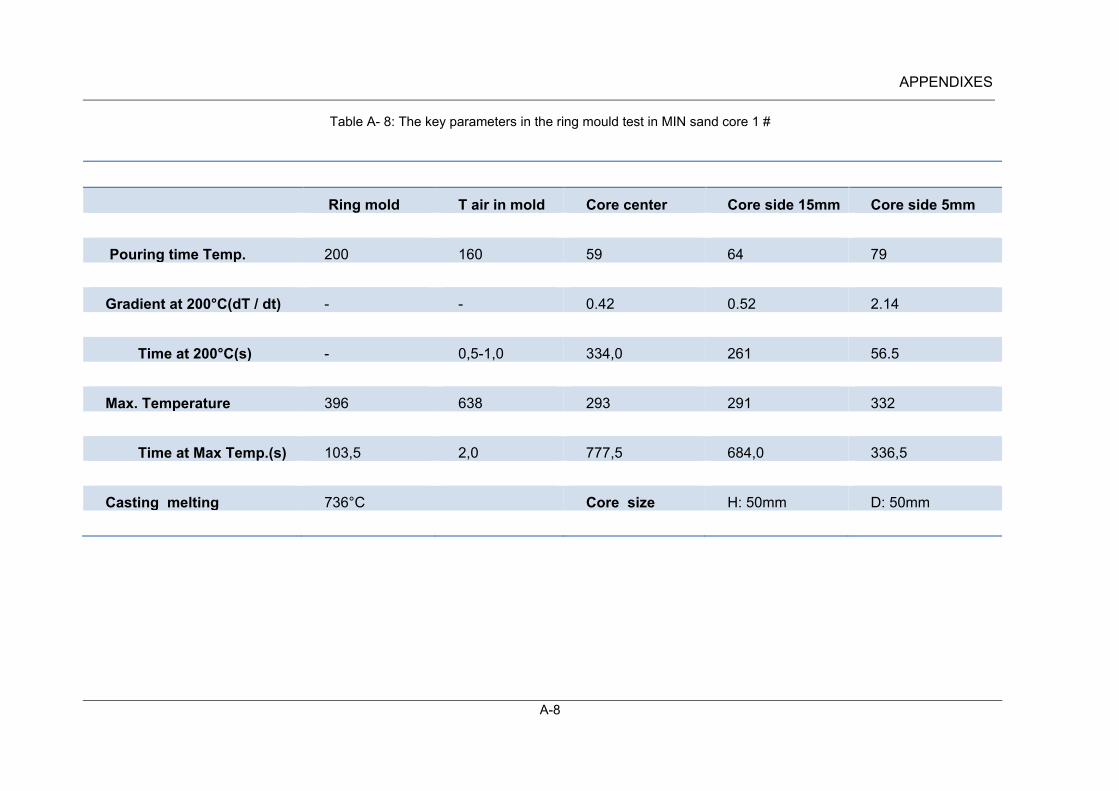
APPENDIXES
A-8
Table A- 8: The key parameters in the ring mould test in MIN sand core 1 #
Ring mold T air in mold Core center Core side 15mm Core side 5mm
Pouring time Temp. 200 160 59 64 79
Gradient at 200°C(dT / dt) - - 0.42 0.52 2.14
Time at 200°C(s) - 0,5-1,0 334,0 261 56.5
Max. Temperature 396 638 293 291 332
Time at Max Temp.(s) 103,5 2,0 777,5 684,0 336,5
Casting melting 736°C Core size H: 50mm D: 50mm

APPENDIXES
A-9
Table A- 9: The key parameters in the ring mould test in MIN sand core 2 #
Ring mold T air in mold Core center Core side 15mm Core side 5mm
Pouring time Temp. 200°C 131°C 137°C 146°C 147°C
Gradient at 200°C(dT / dt) - - 0.24 0.40 1.05
Time at 200°C(s) - 1,0-1,5 263,0 135,0 50,5
Max. Temperature 406°C 626°C 312°C 321°C 345°C
Time at Max Temp.(s) 113,5 4,5 764,0 612,5 368,0
Casting melting 725°C Core size H: 50mm D: 50mm

APPENDIXES
A-10
Table A- 10: The key parameters in the ring mould test in Kerphalite sand core-1
KF SAND _1
Ring mold T air in mold Core center Core side 15mm Core side 5mm
Pouring time Temp. 200°C 104°C 28°C 33°C 44°C
Gradient at 200°C(dT / dt) - - 0.51 0.67 2.44
Time at 200°C(s) - 2,0-2,5 335,0 239,5 64,0
Max. Temperature 398 610°C 289°C 298°C 315°C
Time at Max Temp.(s) 99,0 8,0 795,0 720,5 420,0
Casting melting 719°C Core size H: 50mm D: 50mm

APPENDIXES
A-11
Table A- 11: The key parameters in the ring mould test in Kerphalite sand core 2 #
Ring mold T air in mold Core center Core side 15mm Core side 5mm
Pouring time Temp. 200°C 119°C 28°C 31°C 38°C
Gradient at 200°C(dT / dt) - - 0.55 0-63 1.54
Time at 200°C(s) - 1,0-1,5 312,0 266,5 105,5
Max. Temperature 412°C 640°C 312°C 304°C 333°C
Time at Max Temp.(s) 96,0 5,5 769,5 711,0 501,0
Casting melting 748°C Core size H: 50mm D: 50mm

APPENDIXES
A-12
Table A- 12: The key parameters in the ring mould test in H32 sand core 1 #
Ring mold T air in mold Core center Core side 15mm Core side 5mm
Pouring time Temp. 200°C 129°C 149°C 161°C 161°C
Gradient at 200°C(dT / dt) - - 0.30 0.34 1.16
Time at 200°C(s) - 172,0 116,0 33,5
Max. Temperature 412°C 324°C 337°C 358°C
Time at Max Temp.(s) 95,5 635°C 586,0 554 315,5
Casting melting 741°C 4,0 Core size H: 50mm D: 50mm

APPENDIXES
A-13
Table A- 13: The key parameters in the ring mould test in H32 sand core 2 #
Ring mold T air in mold Core center Core side 15mm Core side 5mm
Pouring time Temp. 200°C 111°C 36°C 39°C 53°C
Gradient at 200°C(dT / dt) - - 0.57 0.71 3.27
Time at 200°C(s) - 285,5 226,0 45,0
Max. Temperature 408°C 628°C 296°C 306°C 342°C
Time at Max Temp.(s) 105,0 3,5 718,0 643,5 325,5
Casting melting 733°C Core size H: 50mm D: 50mm

APPENDIXES
A-14
Table A- 14: The key parameters in the ring mould test in Cerabeads sand core 1 #
Ring mold T air in mold Core center Core side 15mm Core side 5mm
Pouring time Temp. 200°C 114°C 33°C 38°C 52°C
Gradient at 200°C(dT / dt) - - 0.53 0.79 2.29
Time at 200°C(s) - 315,0 205,5 64,5
Max. Temperature 385°C 619°C 292°C 300°C 330°C
Time at Max Temp.(s) 102,0 2,0 744,5 637,5 386,5
Casting melting 720°C Core size H: 50mm D: 50mm

APPENDIXES
A-15
Table A- 15: The key parameters in the ring mould test in Cerabeads sand core 2 #
Ring mold T air in mold Core center Core side 15mm Core side 5mm
Pouring time Temp. 200°C 102°C 41°C 46°C 64°C
Gradient at 200°C(dT / dt) - - 0.52 0.70 2.00
Time at 200°C(s) - 307,0 221,0 68,0
Max. Temperature 403°C 616°C 303°C 310°C 333°C
Time at Max Temp.(s) 117,0 7,5 756,0 665,5 415,0
Casting melting 730°C Core size H: 50mm D: 50mm
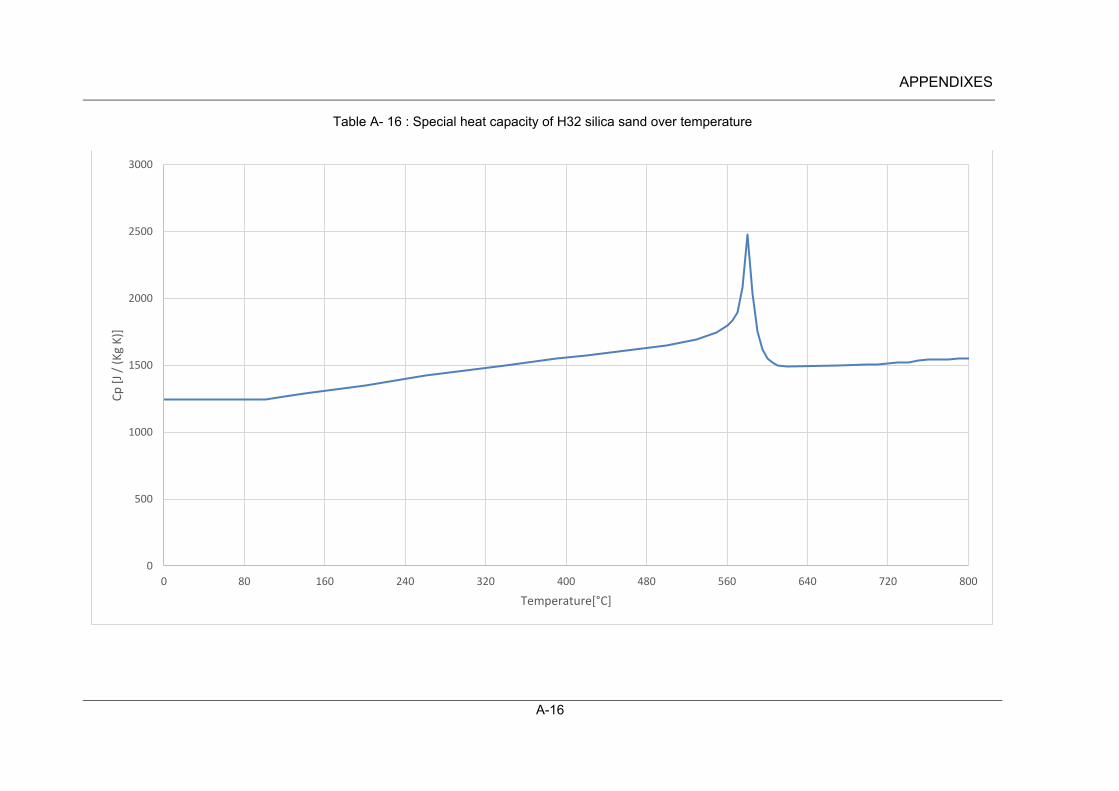
APPENDIXES
A-16
Table A- 16 : Special heat capacity of H32 silica sand over temperature
0
500
1000
1500
2000
2500
3000
0 80 160 240 320 400 480 560 640 720 800
Cp
[J
/ (K
g K
)]
Temperature[°C]
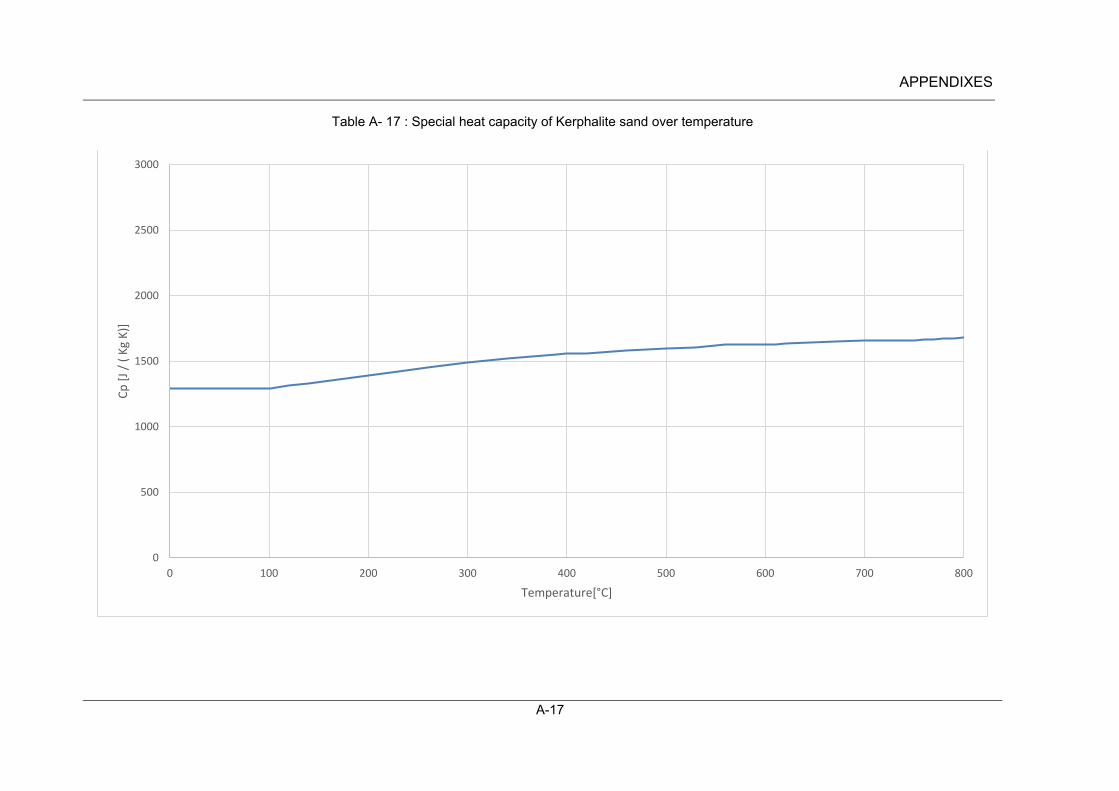
APPENDIXES
A-17
Table A- 17 : Special heat capacity of Kerphalite sand over temperature
0
500
1000
1500
2000
2500
3000
0 100 200 300 400 500 600 700 800
Cp
[J
/ (
Kg
K)]
Temperature[°C]
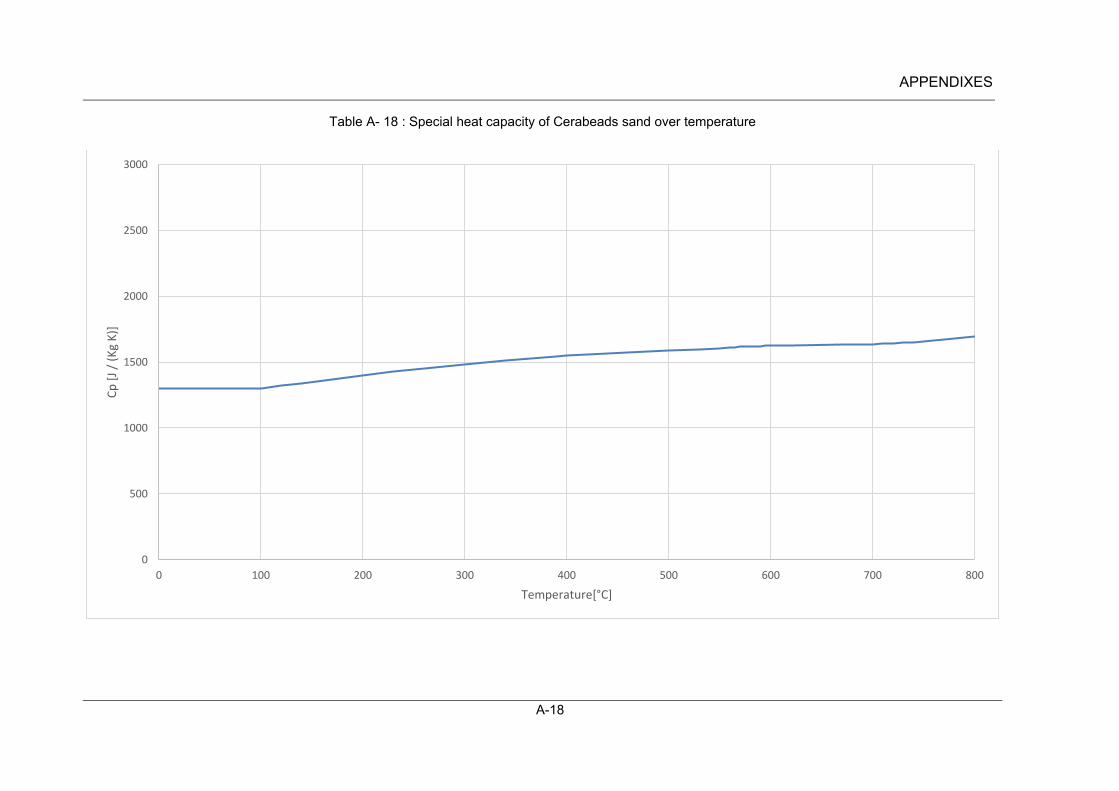
APPENDIXES
A-18
Table A- 18 : Special heat capacity of Cerabeads sand over temperature
0
500
1000
1500
2000
2500
3000
0 100 200 300 400 500 600 700 800
Cp
[J
/ (K
g K
)]
Temperature[°C]

APPENDIXES
A-19
Table A- 19 : Special heat capacity of MIN sand over temperature
0
500
1000
1500
2000
2500
3000
0 100 200 300 400 500 600 700 800
Cp
[J
/ (K
g K
)]
Temperature[°C]
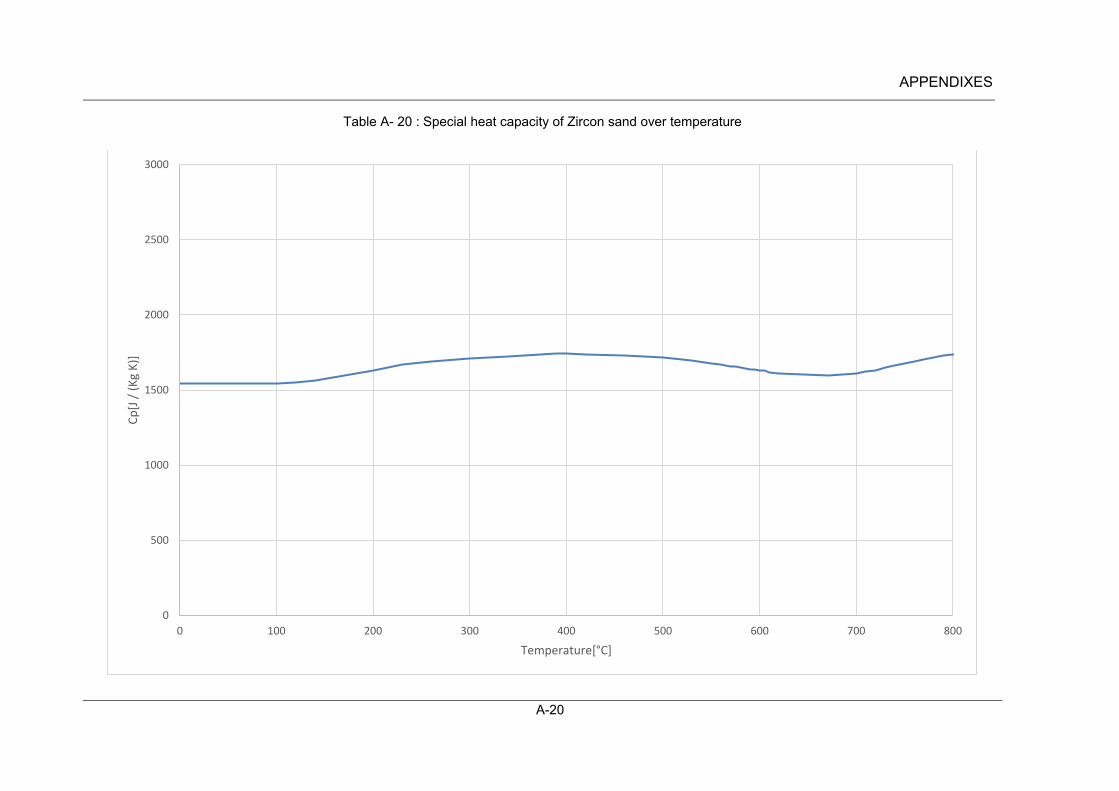
APPENDIXES
A-20
Table A- 20 : Special heat capacity of Zircon sand over temperature
0
500
1000
1500
2000
2500
3000
0 100 200 300 400 500 600 700 800
Cp
[J /
(K
g K
)]
Temperature[°C]
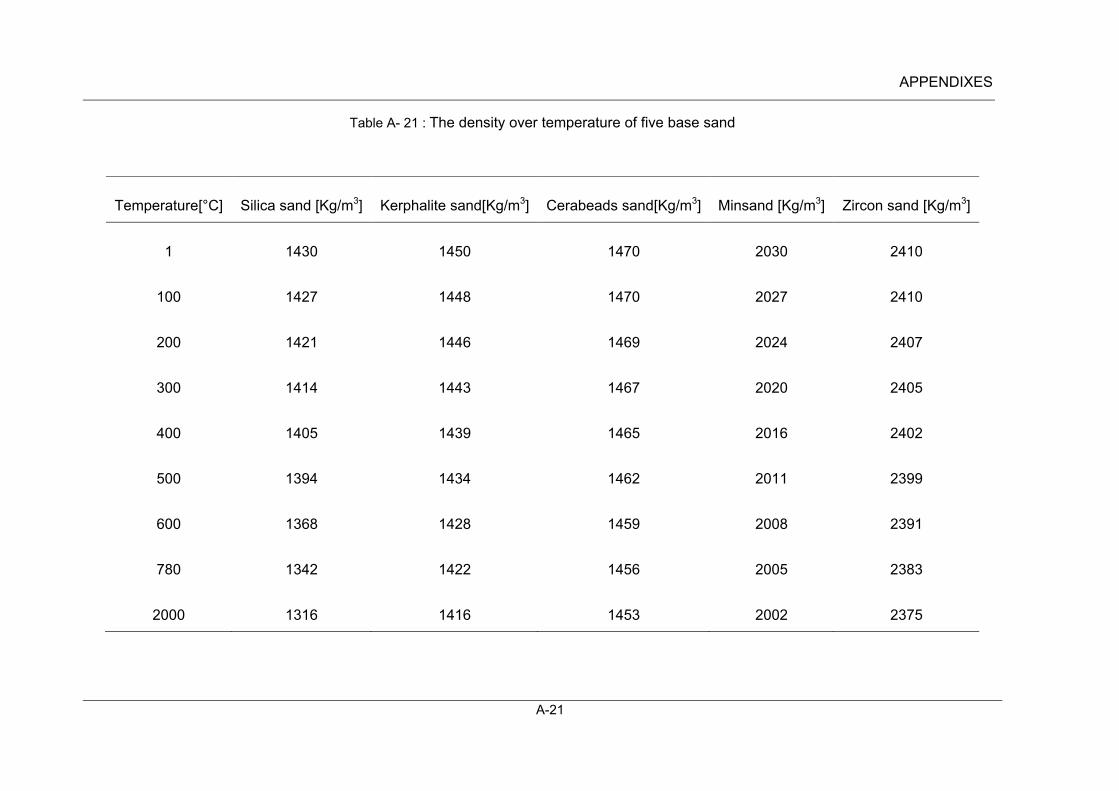
APPENDIXES
A-21
Table A- 21 : The density over temperature of five base sand
Temperature[°C] Silica sand [Kg/m3] Kerphalite sand[Kg/m3] Cerabeads sand[Kg/m3] Minsand [Kg/m3] Zircon sand [Kg/m3]
1 1430 1450 1470 2030 2410
100 1427 1448 1470 2027 2410
200 1421 1446 1469 2024 2407
300 1414 1443 1467 2020 2405
400 1405 1439 1465 2016 2402
500 1394 1434 1462 2011 2399
600 1368 1428 1459 2008 2391
780 1342 1422 1456 2005 2383
2000 1316 1416 1453 2002 2375
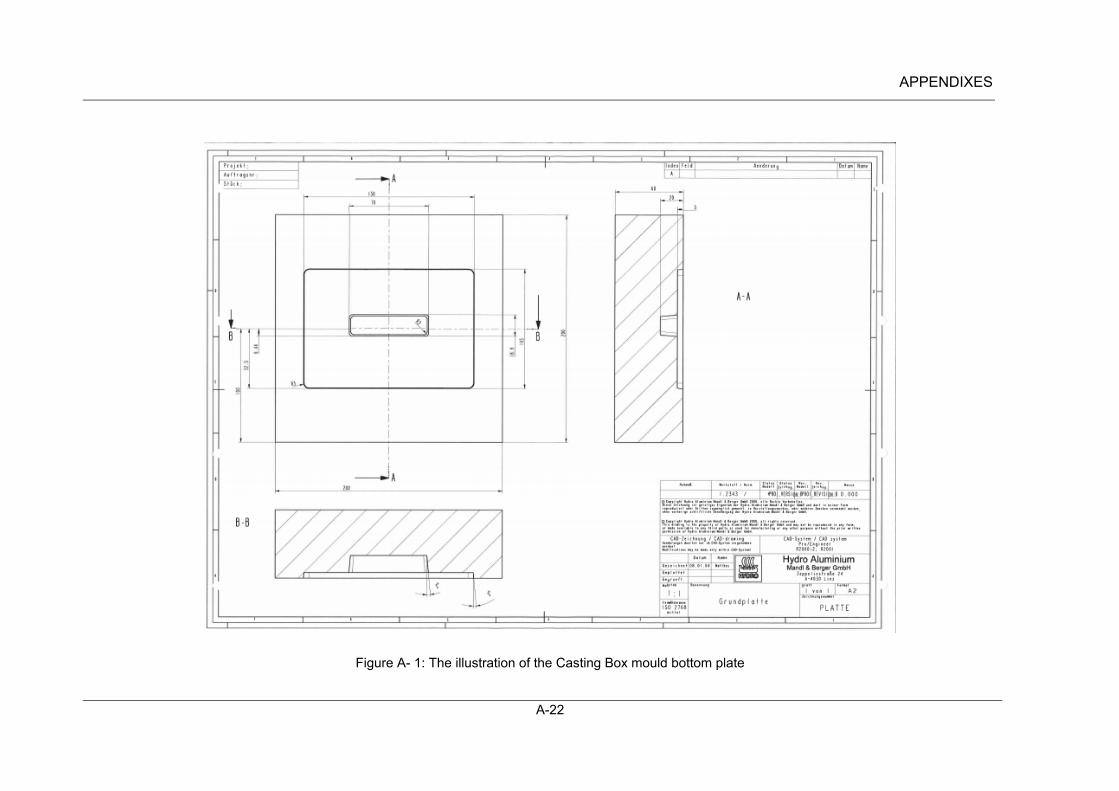
APPENDIXES
A-22
Figure A- 1: The illustration of the Casting Box mould bottom plate

APPENDIXES
A-23
Figure A- 2: The illustration of the Casting Box mould inside core

APPENDIXES
A-24
Figure A- 3: The illustration of the Casting Box mould outside core

APPENDIXES
A-25


![Averroës decisive treatise [butterworth]](https://img.dokumen.tips/doc/110x75/5790572f1a28ab900c9c525b/averroes-decisive-treatise-butterworth.jpg)


![TAR-SANDS (ARENAS BITUMINOSAS) [OIL-SANDS]](https://img.dokumen.tips/doc/110x75/546e6d60b4af9faa268b468b/tar-sands-arenas-bituminosas-oil-sands.jpg)


