Embed Size (px)
Citation preview

Master Level Thesis
European Solar Engineering School
No.186, June 2014
Thermal Performance of a Solarus CPC-Thermal Collector
Master thesis 30 hp, 2014 Solar Energy Engineering
Author: Mersiha Šumić, 900516-8365
Supervisor: Mats Rönnelid
Examiner: Ewa Wäckelgård
Course Code: MÖ3032
Examination date: 2014-06-24
Dalarna University
Energy and Environmental
Technology

I
Abstract
The aim of this master thesis is an investigation of the thermal performance of a thermal compound parabolic concentrating (CPC) collector from Solarus. The collector consists of two troughs with absorbers which are coated with different types of paint with unknown properties. The lower and upper trough of the collector have been tested individually. In order to accomplish the performance of the two collectors, a thorough literature study in the fields of CPC technology, various test methods, test standards for solar thermal collectors as well as the latest articles relating on the subject were carried out. In addition, the set‐up of the thermal test rig was part of the thesis as well. The thermal performance was tested according to the steady state test method as described in the European standard 12975‐2. Furthermore, the thermal performance of a conventional flat plate collector was carried out for verification of the test method. The CPC‐Thermal collector from Solarus was tested in 2013 and the results showed four times higher values of the heat loss coefficient (8.4 W/m²K) than what has been reported for a commercial collector from Solarus. This value was assumed to be too large and it was assumed that the large value was a result of the test method used that time. Therefore, another aim was the comparison of the results achieved in this work with the results from the tests performed in 2013. The results of the thermal performance showed that the optical efficiency of the lower trough of the CPC‐T collector is 77±5% and the corresponding heat loss coefficient 4.84±0.20 W/m²K. The upper trough achieved an optical efficiency of 75±6 % and a heat loss coefficient of 6.45±0.27 W/m²K. The results of the heat loss coefficients are valid for temperature intervals between 20°C and 80°C. The different absorber paintings have a significant impact on the results, the lower trough performs overall better. The results achieved in this thesis show lower heat loss coefficients and higher optical efficiencies compared to the results from 2013.
Keywords: Solar Thermal Collector, Compound parabolic concentrator, MaReCo
design, Thermal optical efficiency, Heat loss coefficient

II
Contents
Abstract ...................................................................................................................... I
List of Figures ............................................................................................................ III
List of Tables ............................................................................................................ IV
Nomenclature ........................................................................................................... V
Glossary .................................................................................................................. VII
1. Introduction ........................................................................................................... 1
1.1 Motivation .............................................................................................................. 1
1.2 Aim.......................................................................................................................... 1
1.3 Method ................................................................................................................... 2
1.4 Organization of this Thesis ..................................................................................... 3
2. Literature survey .................................................................................................... 4
2.1 CPC Technology ................................................................................................. 4
2.2 The roof‐integrated MaReCo design ...................................................................... 5
2.3 State of Research in thermal performance of CPC‐Thermal collectors ................. 6
2.4 State of Research in thermal performance of PV/T collectors .............................. 8
2.5 Overall heat losses of a collector ......................................................................... 11
3. Measuring Equipment .......................................................................................... 15
3.1 Test‐rig and test stand ..................................................................................... 15
3.2 Equipment ............................................................................................................ 16
3.3 Flat Plate Collector ............................................................................................... 19
3.4 Solarus CPC‐T Collector ........................................................................................ 20
4. Methodology ....................................................................................................... 22
4.1 European Standard 12975‐2 ............................................................................ 22
4.2 Test procedure ..................................................................................................... 26
4.3 Multiple linear regression .................................................................................... 27
5. Results ................................................................................................................. 29
5.1 Uncertainty ..................................................................................................... 29
5.2 Evaluation of the CPC‐T‐Collector ........................................................................ 30
5.3 Comparison of the two troughs with earlier performed tests in 2013 ................ 31
5.4 Evaluation of the Flat‐Plate Collector .................................................................. 32
6 Discussion ............................................................................................................. 34
7 Conclusion and Outlook ........................................................................................ 39

III
List of Figures
2.1 Cross section of a symmetrical non‐truncated CPC .............................................. 4
2.2 Cross‐section of the Solarus CPC‐Collector .............................................................. 6
2.3 Experimental set‐up of the CPC‐Collector ............................................................... 7
2.4 Cross sections of two covered flat‐plate PVT water collectors ............................... 9
3.1 Outdoor test stand on the roof of Dalarna University in Borlänge ....................... 15
3.2 Thermal test rig in the solar laboratory at Dalarna University in
Borlänge, Sweden .................................................................................................. 16
3.3 PT 100 Temperature Sensor ate the collector outlet of the CPC‐T‐Collector ........ 17
3.4 Pyranometers mounted on a metal sheet above the collector ............................. 18
3.5 Pyranometer of type CM 11 combined with a shadow ring .................................. 18
3.6 Flat plate collector K420‐EM .................................................................................. 19
3.7 CPC‐T‐Collector with two troughs .......................................................................... 20
3.8 Dimensions of the CPC‐T‐Collector ....................................................................... 21
4.1 Summary output from the regression ................................................................... 28
5.1 Thermal Efficiency versus the Reduced Temperature on 22nd of April 2014 ....... 31
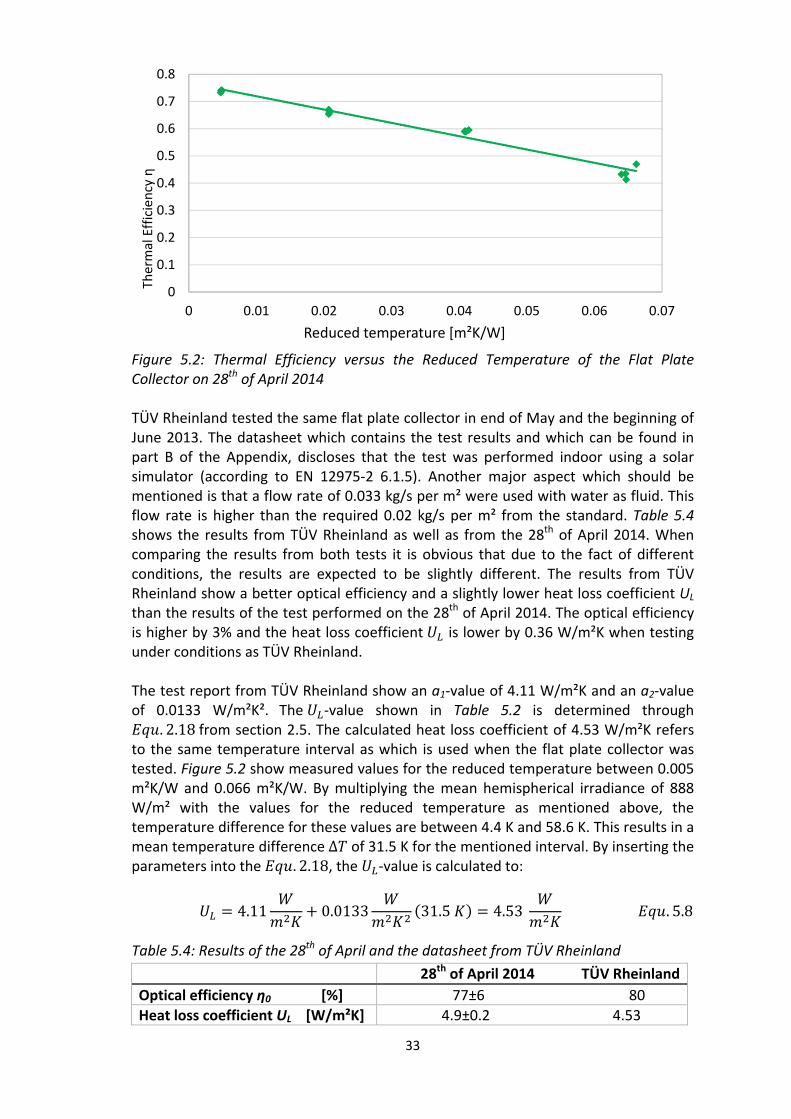
5.2 Thermal Efficiency versus the Reduced Temperature of the Flat Plate Collector
on 28th of April 2014……………………………………………………………………………………………33
6.1 Fraction of useful diffuse radiation ........................................................................ 37

IV
List of Tables
2.1 Measured CPC collector parameters and assumed typical flat plate collector
parameters ............................................................................................................... 6
2.2 Optical thermal efficiencies and heat loss coefficients of the prototypes PVT‐A,
PVT‐B and of a conventional thermal collector ...................................................... 10
3.1 Dimensions of the Solarus CPC‐T‐Collector ........................................................... 20
4.1 Test conditions for steady‐state method .............................................................. 23
4.2 Test conditions and allowed deviations for the steady‐state method .................. 24
4.3 Data points for the Regression............................................................................... 27
5.1 Uncertainties of the used equipment .................................................................... 29
5.2 Results of the two troughs ..................................................................................... 31
5.3 Results of the two troughs compared to 2013 ...................................................... 32
5.4 Results of the 28th of April and the datasheet from TÜV Rheinland ..................... 33
6.1 Comparison of thermal performance of different collectors ................................ 34

V
Nomenclature
Collector area [m²]
Heat loss coefficient at (Tm‐Ta) = 0 [W/m²K]
Temperature dependence of the heat losses [W/m²K²]
b0 Parameter for the characterization of the incidence angle
modifier of the beam irradiance [‐]
C Concentration factor [‐]
Wind speed dependence of the heat losses [J/m³K]
Long‐wave irradiance dependence of the heat losses [‐]
Effective thermal capacitance [J/m²K]
Wind dependence of the zero loss efficiency [s/m]
Specific heat capacity [J/kgK]
/ Time derivative of Tm in the collector [K/s]
Collector efficiency factor [‐]
Zero loss efficiency of the collector [‐]
View factor between surface 1 and 2 [‐]
G Global solar irradiance at the collector aperture [W/m²]
GbT Beam solar irradiance at the collector aperture [W/m²]
GdT Diffuse solar irradiance at the collector aperture [W/m²]
Total radiation on a tilted surface [W/m²]
Convection heat transfer coefficient [W/m²K]
Radiation coefficient for the cover to the air [W/m²K]
Convection heat transfer coefficient [W/m²K]
Radiation heat transfer coefficient [W/m²K]
Thermal conductivity [W/mK]
Incidence angle modifier for diffuse radiation [‐]
Incidence angle modifier (IAM) for direct (beam) radiation [‐]
Insulation thickness [m]
Efficiency [‐]

VI
Optical Efficiency [‐]
η0d Diffuse zero‐loss efficiency [‐]
η0b Beam zero‐loss efficiency [‐]
Useful output power [W]
Absorbed Power [W]
Heat loss [W]
Qu Useful energy [W]
R² Coefficient of determination [‐]
Solar radiation absorbed by the collector [W/m²]
Surrounding air temperature [°C]
Inlet temperature [°C]
Mean temperature of the heat transfer fluid [°C]
Outlet temperature [°C]
Reduced temperature [m²K/W]
Mean absorber fluid temperature [°C]
∆ Temperature difference between outlet and inlet [°C]
Transmittance‐absorptance product [‐]
u Surrounding air speed [m/s]
Edge loss coefficient‐area product [W/K]
Back loss coefficient [W/m²K]
Edge loss coefficient [W/m²K]
Top loss coefficient [W/m²K]
Overall heat loss coefficient [W/m²K]
Acceptance half‐angle [°]
Incidence angle [‐]
Tilt angle to the horizon [°]
Emittance [‐]
Ground reflection (albedo) [‐]
τ Transmission [‐]

VII
Glossary
ANOVA Analysis of Variance
ASHRAE 93‐77 American Standard – Method for Testing to Determine the Thermal
Performance of Solar Collectors
CdTe Cadmium‐Telluride
c‐Si Crystalline silicon
CPC Compound Parabolic Concentrator
ESES European Solar Engineering School
EN 12975 European standard for solar collector testing
FP‐PVT Flat Plate – Photovoltaic/Thermal
IEC 61215 International Electrotechnical Commission ‐ Photovoltaic Solar Testing
Specifications for Crystalline silicon terrestrial photovoltaic (PV)
modules
ISE Fraunhofer Institute for Solar Energy Systems (ISE) in Germany
ISO 9806‐1 International Organization for Standardization – Thermal Performance
of Glazed Liquid Heating Collectors
MaReCo Maximum Reflector Collector
MATLAB Numerical‐mathematical software (Matrix Laboratory)
MLR Multiple Linear Regression
TRNSYS Transient system simulation tool
PV/T Photovoltaic/Thermal systems which produce electricity and heat
QDT Quasi‐dynamic testing method according to the European Standard
EN 12975‐2
SP Technical Research Institute of Sweden
SS Steady‐state testing method according to the European Standard
EN 12975‐2

1
1 Introduction 1.1 Motivation
Without the Sun there would be no life on Earth. The Sun heats the ground, the atmosphere, the oceans, and even the climate and the weather is controlled by the Sun. The humankind is dependent from the Sun. For plants, the sun's rays are necessary for survival since thereby their energy is produced. The potential of the sun is immense, its energy source is inexhaustible and free of charge. It provides an annual amount of energy which far exceeds the energy needs worldwide. The solar energy is very successfully utilized in the photovoltaic and solar thermal industry. Through flat‐plate collectors and concentrating systems, solar energy can be collected. The core of a flat‐plate collector is the selective absorber. The selective surface reduces the heat losses from the absorber and the collector performance increases. Due to the special selective coating of the absorber, the collector is able to absorb as much energy from the sun as possible and it re‐radiate as low as possible into the environment. More energy can be absorbed due to the high absorptance for short‐wave radiation and the low emissivity for long‐wave radiation. Photovoltaic systems generate electricity from sunlight, solar heating systems supply heat for hot water. A combination of generated heat and electricity arises when these two techniques are combined. A product in which heat and electricity will be produced simultaneously is called PV/T collector. A big advantage of this system is that the system produces heat and electricity from one and the same collector as well as on one surface area. Solarus AB is a Swedish SME (Small‐Medium Enterprise) company that is located in Älvkarleby and which develops PV, thermal and hybrid (PV/T) solar panels. Collectors developed by Solarus are based on the roof‐integrated MaReCo (Maximum‐Reflector‐Collector) reference design, which is explained in chapter 2.2. The thermal collector used in the present work is the thermal asymmetric Compound Parabolic Concentrator (CPC) collector developed by Solarus. This collector consists of two absorbers whereby the coating performance is unknown. The manufactured CPC‐T collector from Solarus is low concentrating in order to reduce the collector material and make it useful for stationary, non‐tracking, applications. The used collector will be described more detailed in section 3.3.
1.2 Aim
The aim of this thesis is to characterize and analyse the thermal performance of a prototype thermal CPC collector from the company Solarus. This collector consists of two troughs which have different absorber paintings. Furthermore, the thermal performance of a flat plate collector from KBB Kollektorbau GmbH will be tested for verification of the test method. The tests will be carried out according to the steady state test method, which is described in the European standard EN 12975‐2. Furthermore, the test method, its benefits and drawbacks are explained in section 4.1. This thermal CPC collector from the company Solarus has been tested in 2013 from a former ESES student [Haddi, 2013]. The thermal performance was carried out with

2
varying the flow rate, in this work the test is performed with varying the inlet temperature and constant flow rate in accordance with EN 12975‐2. Therefore, another aim is to compare the results of the thermal performance with the results which are presented in earlier work. Another focus is the comparison between commercial standard collectors and the tested collector of this work by comparing the thermal performances.
1.3 Method
In order to accomplish the performance of the collector a thorough literature study in the fields of CPC technology, various test methods, test standards for solar thermal collectors as well as the research of latest articles relating on the subject were carried out. In the following, the methods used for this thesis work are described. o Literature study on CPC and PV/T technology The abbreviation PV/T stands for Photovoltaic/Thermal hybrid collector. The CPC as well as the PV/T technology will generally be described in chapter two of the thesis. Application for the performance from other companies as well as products and available applications on the market will be studied as well. o Test methods and test standards of collectors The thermal performance of solar thermal collectors can be characterized using two different methods, the steady state method and the quasi dynamic method. These methods are obtainable in the European standard for solar collector testing EN 12975‐2 and their benefits and drawbacks will be explained in chapter 4.1. o Set‐up of the thermal test rig In order to measure the performance of the collector, the set‐up of the thermal test rig was done with the help of another master student. His main focus was on verification of the test rig for the test methods. o Thermal characterization of two different absorber surfaces in a thermal Solarus
collector The CPC‐Thermal‐Collector from Solarus consists of two troughs with identical geometry but which have absorbers with different absorber paintings. A thermal performance test is carried out in order to see which trough performs better and to analyse the impact of absorber paint on the thermal performance. o Comparison with earlier performed tests in 2013 Tests on this collector have already been done last year but with varying the flow rate. In this thesis the flow rate is constant and does not vary as in accordance to the test standard and thus a comparison between the results of these two parameters can be characterized. o Thermal characterization of a flat plate collector The thermal performance of a conventional flat plate collector is tested in order for verification of the test method and the test rig performance.

3
1.4 Organization of this Thesis
The present thesis is divided into seven chapters. Chapter 2 describes the theoretical background of the CPC Technology as well as the roof‐integrated MaReCo design. Furthermore, this chapter contains a literature review of literature and earlier work that this thesis will be based on. The overall heat losses in a collector are described in chapter 2 as well. Chapter 3 gives the reader an overview of the set‐up of the test rig and the used equipment. The description of the tested Solarus thermal CPC collector and the flat plate collector from KBB are presented as well in Chapter 3. The measurement method including the description of the European standard for solar collector testing EN 12975‐2, are introduced to the reader in Chapter 4. The test procedure and the multiple linear regression are described in Chapter 4 as well. The evaluation of the CPC‐T collector and the flat plate collector are presented in the fifth chapter. Additionally, the comparison with previous test results from 2013 including the uncertainty calculation of the results are described in Chapter 5. The results are discussed in Chapter 6. A conclusive summary and outlook for future work are given in Chapter 7.

4
2 Literature survey 2.1 CPC Technology
The abbreviation CPC stands for "Compound Parabolic Concentrator" and a CPC is a type of non‐imaging concentrators. Imaging optics form an image of the source on the receiver, a non‐imaging concentrator does not form an image of the source, but transfers the radiation from source to receiver over a larger distance. [Winston et al., 2005] The three most important components in a CPC are the receiver, the reflector and the cover. High absorptance of the receiver is very important in order to absorb as much solar radiation as possible. As seen in Figure 2.1, a CPC consists of two parabolic reflectors. Reflectors for solar concentrators should have the highest reflectance as possible. Its function is to focus beam‐solar radiation onto the receiver. [Mansi et al., 2013]
Figure 2.1: Cross section of a symmetrical non‐truncated CPC. Source: [Duffie & Beckman] The incident angle of the sun to the collector surface is constantly changing through the motion of the earth. Therefore, the majority of the sun’s rays fall obliquely on the collector. Collectors with CPC technology have the great advantage that the aforesaid rays of the sun can be very well utilized. The maximal concentration for a two dimensional trough CPC as in Figure 2.1 shown, is calculated as follows:
1
. 2.1
Where is the acceptance half‐angle as seen in the Figure 2.1. A high concentration can be reached with a smaller acceptance angle. General concentration ratios for CPC’s are around 2‐10, the lower ratio if they should be mounted as stationary
5
concentrators and higher rations if they should be used as movable concentrators. [Rönnelid, 2014] The main use of CPC´s in solar applications is for use in thermal collectors or together with PV cells. In thermal collectors, the use of CPC technology reduces the absorber area relative to the aperture area and this can reduce the overall heat loss coefficient since the absorber area is reduced [Rönnelid and Karlsson, 1996]. On the other hand the use of CPC in thermal collectors reduce the optical efficiency due to increased reflector losses, and the optimal use of CPC reflectors in thermal collectors is the trade of between these two parameters. In PVC applications, use of CPC reflectors reduce the PV cell area and can be cost effective since a PV cell normally cost more than a reflector per area unit.
2.2 The roof-integrated MaReCo design
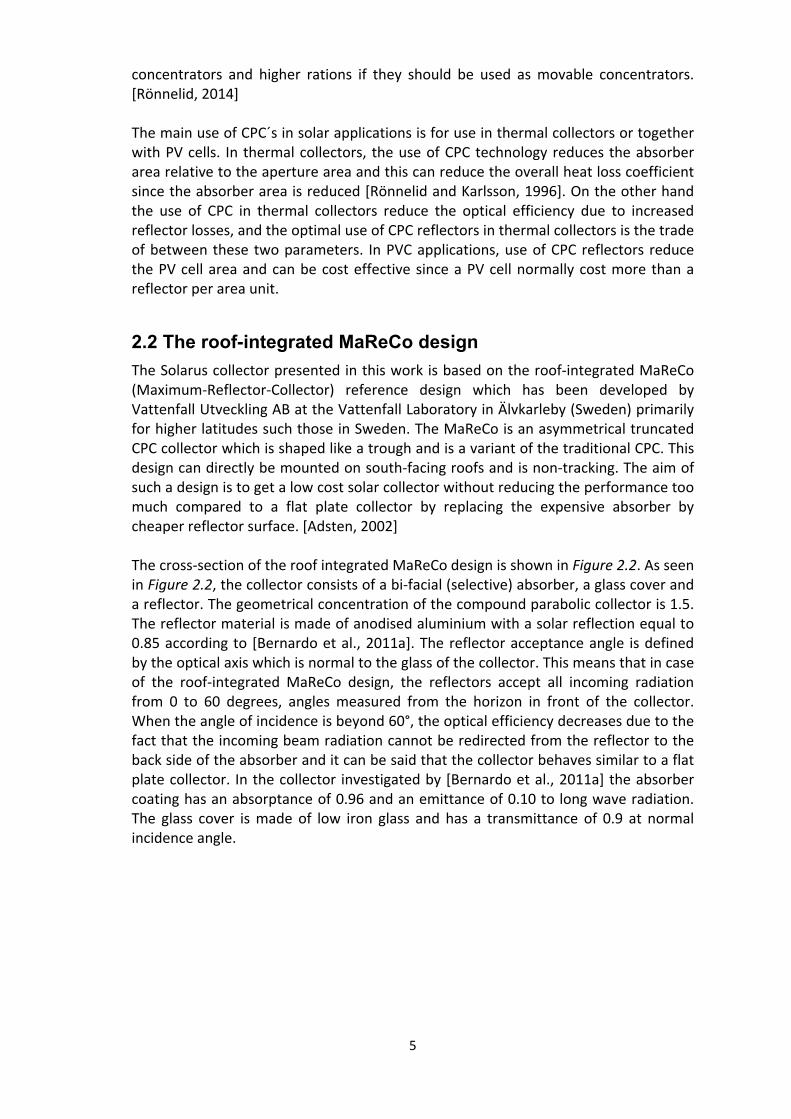
The Solarus collector presented in this work is based on the roof‐integrated MaReCo (Maximum‐Reflector‐Collector) reference design which has been developed by Vattenfall Utveckling AB at the Vattenfall Laboratory in Älvkarleby (Sweden) primarily for higher latitudes such those in Sweden. The MaReCo is an asymmetrical truncated CPC collector which is shaped like a trough and is a variant of the traditional CPC. This design can directly be mounted on south‐facing roofs and is non‐tracking. The aim of such a design is to get a low cost solar collector without reducing the performance too much compared to a flat plate collector by replacing the expensive absorber by cheaper reflector surface. [Adsten, 2002] The cross‐section of the roof integrated MaReCo design is shown in Figure 2.2. As seen in Figure 2.2, the collector consists of a bi‐facial (selective) absorber, a glass cover and a reflector. The geometrical concentration of the compound parabolic collector is 1.5. The reflector material is made of anodised aluminium with a solar reflection equal to 0.85 according to [Bernardo et al., 2011a]. The reflector acceptance angle is defined by the optical axis which is normal to the glass of the collector. This means that in case of the roof‐integrated MaReCo design, the reflectors accept all incoming radiation from 0 to 60 degrees, angles measured from the horizon in front of the collector. When the angle of incidence is beyond 60°, the optical efficiency decreases due to the fact that the incoming beam radiation cannot be redirected from the reflector to the back side of the absorber and it can be said that the collector behaves similar to a flat plate collector. In the collector investigated by [Bernardo et al., 2011a] the absorber coating has an absorptance of 0.96 and an emittance of 0.10 to long wave radiation. The glass cover is made of low iron glass and has a transmittance of 0.9 at normal incidence angle.

6
Figure 2.2: Cross‐section of the Solarus CPC‐Collector. Source: [Adsen, 2002]
2.3 State of Research in thermal performance of CPC-Thermal collectors
[Bernardo et al., 2011a] evaluated the performance of the above mentioned low concentrating thermal CPC collector system and compared it with a traditional flat plate collector system. The compound parabolic collector which has a geometrical concentration of 1.5, was tested according to the quasi dynamic method, which is explained in section 4.2 in this thesis. The absorber of the investigated collector has a selective coating. The collector was tested between the 20th and the 29th of September in 2009 with the dynamic test method in order to determine the thermal and optical characteristics. The measured average data were recorded every 6 minutes. The experimental set‐up of the CPC collector is given in Figure 2.3. Table 2.1 shows the CPC collector parameters which were determined by multiple linear regression. The second column shows parameters for a conventional flat plate collector, these parameters were not measured but assumed by [Bernardo et al., 2011a]. Table 2.1: Measured CPC collector parameters and assumed typical flat plate collector parameters [Bernardo et al., 2011a]
Parameters and units CPC Collector Flat Plate Collector
η0b [‐] 0.64 0.80
η0d [‐] 0.31 0.72
a1 [W/m2K] 2.8 3.6
a2 [W/m2K²] 0.035 0.014

7
Figure 2.3: Experimental set‐up of the CPC‐Collector. Source: [Bernardo et al., 2011a] The solar collector system which is shown in Figure 2.3 and the determined parameters in Table 2.1 were fed into a simulation model in TRNSYS in order to estimate the system performance of the CPC collector and compare it afterwards with a conventional flat plate collector system. TRNSYS is a transient system simulation tool which is used to simulate buildings and solar heating systems. The main components of the simulation model are the CPC thermal collector, a circulation pump, a radiation processor and a storage tank including an auxiliary heater and an internal heat exchanger. In [Adsten, 2002] six different types of MaReCo collectors, including the roof‐integrated MaReCo prototype described in Chapter 2.2, were evaluated in an outdoor system at the Vattenfall Laboratory in Älvkarleby (Sweden) according to the dynamic testing model. The same amount of liquid flow, in this case water‐glycol mixture were used in all six collectors in order to have as low uncertainties as possible. The collector testing lasted several days and during these days irradiation, temperatures and the flow were measured and recorded. A data logger recorded all data every ten seconds. The collector parameters were obtained using Multiple Linear Regression (MLR). The standard roof‐integrated MaReCo design as shown in Figure 2.2 is designed for roofs facing south with a tilt of 30°. During testing, this collector had no thermal insulation but still, due to the bifacial absorber and the low concentration, the heat loss factor

8
was low. The study showed that the roof‐integrated prototype has a first order heat loss coefficient of 2.4 W/m²K, the corresponding optical beam efficiency is 0.69, the optical diffuse efficiency is 0.56 and an incident angle modifier coefficient b0 of 0.29. The second order heat loss coefficient was evaluated as well according to [Adsten, M. 2002] but the parameter fits were much better when just the first order heat loss coefficient was determined and therefore there is no parameter value for . The first order heat loss coefficient does not differ much with the one found by [Bernardo et al., 2011a] which is shown in Table 2.1. The coefficient of determination R², which describes the correlation between the model and the measured data, should be close to one in order to have perfect correlation. The roof‐integrated type has a R² of 0.9994, therefore a good correlation occurs. A previous work [Haddi, 2013] in which the thermal performance of the Solarus CPC‐PV/T collector and a new prototype of the Solarus CPC‐Thermal collector was determined, showed significantly high values of the heat loss coefficient . This prototype of the CPC‐Thermal collector has unknown absorber coatings and is therefore not direct comparable with the commercial CPC‐Thermal collector. The tests were carried out by varying the flow rate from 20 l/h to 90 l/h with a step of 10 l/h in order to get different values for the reduced temperature as well as the corresponding efficiencies. The determined heat loss coefficients of the two different troughs of the new prototype CPC‐Thermal collector showed four times higher values of the heat loss coefficient (around 8.4 W/m²K) than what has been reported by Solarus for their commercial CPC‐T collector (1.9 W/m²K from data sheet in Appendix A). Due to the high values, the thermal performance of the new prototype of the CPC‐T collector will be tested again in this present work, but this time with varying the inlet temperature and a constant flow rate which is more correct according to the standardized test procedures from the [EN 12975‐2].
2.4 State of Research in thermal performance of PV/T collectors
PV/T collectors exist in different configurations, both as low‐concentrating collectors, concentrating collectors as collectors from Solarus or in the form of flat plate collectors like shown in Figure 2.4. The new prototype of the CPC‐Thermal collector which is investigated in this work, has the same geometrical design as the Solarus PV/T collector. The paints of the CPC‐T prototype which are examined, are candidates for utilization as background paint in the PV/T collector. Solarus is therefore interested in the properties of these paints in order to decide whether they want to use these paints for their PV/T collector or not. Through these paints the thermal performance of the PV/T collector will be affected. Furthermore, the emittance of the solar cells is of importance for the heat loss coefficient. [Bernardo et al., 2013] investigated the performance of the asymmetrical CPC PV/T collector from Solarus. This collector system which is based on the roof‐integrated MaReCo reference design such as the prototype CPC‐T collector presented in this work, was tested in Maputo, Mozambique. The module is water‐cooled and works thereby as a thermal absorber. The absorber generates both, electricity and heat. The total of 152 solar cells, which are made of mono‐crystalline silicon, were laminated on

9
the front side as well as of the back side of the aluminium thermal absorber. This PV/T system includes a photovoltaic module, a parabolic reflector, thermal absorber, cover glass including protection and a supporting structure. The geometrical concentration ratio of the reflector is C=1.5. Anodised aluminium is used as reflector material which has a solar reflection of around 95 %. [Diwan, 2013] analysed the data of the measurements carried out in Mozambique and it was found that this PV/T collector has an optical efficiency of 54±2% and a corresponding of 4.1 ±1.0 W/m²K when electricity is extracted. Unfortunately, an official test report of the commercial CPC PV/T from Solarus could not be found. In the datasheet from this particular collector it is written, that the heat loss coefficient is 1.9 W/m²K but it is not mentioned if this value corresponds to the overall heat loss coefficient or the first order heat loss coefficient . But due to the fact that this value is rather low for the overall heat loss coefficient, it is assumed that this value corresponds to . Recent advances in the development and testing of hybrid PV‐thermal collectors have been published from the Fraunhofer Institute for Solar Energy Systems (ISE) in Germany. Two different types of flat‐plate PVT collectors were developed and tested. The following Figure 2.4 shows two prototypes of flat‐plate PVT collectors which were manufactured for the testing. On the left side the PVT‐A collector with laminated c‐Si solar cells shown. In order to ensure good thermal insulation, an air layer was established between the glass cover and the absorber plate. The layer had a thickness of 20 mm and the glass cover had a high transmission of τ > 0.93. [Dupeyrat et al., 2011] Since there is no standard for the test procedure for PVT collectors, the thermal and electrical performance of these collectors was tested according to the European standard EN 12975‐2 for solar thermal collectors and the IEC 61215 (International Electrotechnical Commission) for PV modules. The thermal performance of the two collectors were carried out in the indoor test facilities of Fraunhofer ISE. The tilt angle of the collector was 45° and the thermal performance of the collector has been tested using a solar irradiance simulator. Since the performance measurements were taken in the simulator, it was necessary according to the European standard, that the simulator has an artificial wind and artificial sky, so all the losses could be determined.
Figure 2.4: Cross sections of two covered flat‐plate PVT water collectors. Left: (PVT‐A) with laminated c‐Si solar cells. Right: (PVT‐B) with CdTe thin film solar cells. Source: [Dupeyrat et al., 2011] Measurements on both collectors were first carried out in open‐circuit mode, which means that the collector behaves like a normal “thermal” collector since the collector is not connected to an electric load. To determine the electrical and thermal

10
performances of the collector, measurements in “hybrid‐mode” have been conducted when the collectors were connected to an electric load. The results of the measurements for collector PVT‐A showed optical thermal efficiencies in ‘thermal only mode’ of 0.82 and in ‘hybrid mode’ of 0.72. Compared to a conventional thermal collector, with a selective coated absorber and an optical thermal efficiency of =0.82, the prototype PVT‐A attained the same thermal efficiency. The prototype PVT‐B has in both measurement modes lower values. The thermal efficiency for the ‘thermal only mode’ is 0.67 and for the ‘hybrid mode’ 0.61. The following Table 2.2 shows the thermal efficiencies and the heat loss coefficients of the two prototypes as well as of a conventional thermal collector. As shown, the heat loss coefficient is the lowest for a conventional thermal collector. PVT‐A has the highest heat loss coefficients, even though there is not a huge difference between the heat loss coefficients in both the prototypes. The reason for the larger heat loss coefficient in the PVT collectors is most probably due to the non‐selective characteristics of the PV cells situated at the absorbers. The values of the optical efficiency in hybrid mode are reduced due to the fact that a part of the incoming irradiance is used to produce electricity. The electrical output increases due to the fact that water, which circulates trough the collector, reduces the cell temperatures of the solar cell. When high temperatures occur, the efficiency of the photovoltaic module decreases and this loss which corresponds in electricity production, is compensated by thermal production. When electrical and thermal power are produced from the collector at the same time, the performance of the collector decreases. Table 2.2: Optical thermal efficiencies and heat loss coefficients of the prototypes PVT‐A, PVT‐B and of a conventional thermal collector. Source: [Dupeyrat et al., 2011]
[W/m2.K]
Thermal Collector 0.82 3.60
PVT‐A in ‘thermal only’ mode 0.82 6.45
PVT‐A in ‘hybrid’ mode 0.72 5.52
PVT‐B in ‘thermal only’ mode 0.67 6.14
PVT‐B in ‘hybrid’ mode 0.61 5.46

11
2.5 Overall heat losses of a collector
Due to radiation, convection and conduction energy is lost in a collector. These losses are included in the overall heat loss coefficient of a collector which is described as . Furthermore, the overall heat loss coefficient is composed of the top, back and the edge losses of a collector. [Duffie and Beckman, 2006] Convection heat transfer
Convective heat transfer occurs as natural convection at the gap between the glass and the absorber. Due to differences of the air in the gap in the solar collector, an air flow is generated by natural convection. The difference is concluded by heated air which is nearest to the surface and thereby the density decreases. Thus, the cold air decreases and the warm air rises and subsequently an air flow is generated. The convection heat transfer coefficient can be calculated with the following formula:
. 2.2
defines the Nusselt number which is dependent on the angle of inclination of the gap, the plate spacing, the volumetric coefficient of expansion, the kinematic viscosity, and the temperature difference between the plates. Additionally, the coefficient is described by the thermal conductivity and the insulation thickness L. Radiation heat transfer
The general radiation which exchanges between two surfaces (here the absorber and the glazing) is according to [Duffie and Beckman, 2006] described as:
. 2.3
The radiation heat transfer coefficient is therefore expressed as:
1 1 1
. 2.4
Whereby describes the emittance of the plate and the corresponding temperature, defines the emittance of the glass cover and the corresponding temperature. and and are the corresponding areas. describes the view factor between the two surfaces. The radiation heat transfer coefficient increases by increased temperature. The convection heat transfer coefficient does not change much, therefore radiation losses are a much larger part of the overall losses. Conduction heat transfer
Conduction heat transfer is described between two substances or materials which are in direct contact to one another. By the transfer of kinetic energy, the heat from the hot to the cold medium of the material is conducted. The heat transfer depends on how good the conductor is. With a good conductor, the heat is transferred more quickly.

12
As described above, the overall heat loss coefficient is composed of the top, the back and the edge losses of a collector:
. 2.5
Through the top of the collector arises most of heat losses according to [Adsen M., 2001]. The top losses of a collector can be calculated according to [Duffie and Beckman, 2006] as:
1 1
. 2.6
describes the convection coefficient between the plate and the cover, describes the radiation coefficient from the plate to the cover. The convection heat transfer coefficient is defined by and the radiation coefficient for the cover to the air by . In [Duffie and Beckman, 2006] the back loss coefficient can be calculated as the ratio of the insulation thermal conductivity and the thickness as:
. 2.7
The ratio of the edge loss coefficient‐area product to the collector area
describe the edge loss coefficient according to [Duffie and Beckman, 2006]:
. 2.8
The edge loss in a good designed system should not be high because the evaluation of the edge losses is rather complicated. Derivation of the first and second order heat loss coefficient
The incident solar radiation is only partially converted into useful energy. The power loss in a collector is divided into optical and thermal losses. The heat losses in a collector occur through heat losses through side and back wall and the glass, as well as through conduction, radiation and convection. Absorbed Power
The absorbed power is a product of the solar radiation per unit area of collector . The absorbed radiation on the other hand describes the product of the incident solar radiation and the transmittance‐absorptance product . The effective
transmittance‐absorptance product describes the optical losses of a collector.
. 2.9
Thermal power loss
The thermal power loss occurs as heat flow from the absorber to the surroundings at a temperature difference between the average absorber temperature and ambient temperature. Due to the fact of absorbed heat by the collector and the corresponding increased mean absorber fluid temperature , heat is lost to the surroundings by
convection, conduction as well as infrared radiation. This heat loss is described as the overall heat loss coefficient multiplied with the difference of the mean

13
absorber fluid temperature to the ambient temperature . The greater the absorber temperature is, the larger is the heat loss of the collector, which decreases the power output according to:
. 2.10
Since it is not easy to define the mean absorber plate temperature from Equ.
2.10, the useful power of the collector is therefore conveniently related to the mean fluid temperature. The temperature difference Δ (Equ. 2.11) is therefore described between the mean fluid temperature and ambient temperature since these quantities are experimentally easier to measure. The mean fluid temperature is determined by the average of the inlet and outlet temperature as shown in the following equation:
Δ2
. 2.11
Useful energy
The useful energy which is extracted by a solar collector, is therefore defined as the absorbed solar radiation , less the heat losses of the collector which are lost to the surroundings. The useful energy is expressed as follow:
. 2.12
It is furthermore known that the power output is calculated by the product of mass flow rate that flows through the collector, the specific heat capacity of the liquid and the temperature difference between inlet and outlet temperature of the fluid in the collector: . 2.13
The collector efficiency factor describes the ratio between the useful energy as in Equ. 2.13 described and the maximum possible useful energy gain as in Equ. 2.12. Furthermore it describes a portion of heat transfer from the absorber to the fluid. This factor is expressed as:
. 2.14
The surrounding heat losses are the smallest when the whole collector surface is at the fluid inlet temperature and the highest possible useful energy occurs then. The actual useful energy can then be calculated as:
. 2.15
The efficiency of a collector is derived from the ratio of the useful energy gain and the energy supplied as hemispherical radiation. The instantaneous thermal efficiency can therefore be calculated as:
. 2.16

14
With Equ. 2.11, the instantaneous efficiency is expressed as:
. 2.17
[Cooper and Dunkle, 1981] assumed that the overall loss coefficient has a linear temperature dependence which is shown in form of:
. 2.18
describes the first order heat loss coefficient at 0 and the second order coefficient defines the temperature dependence of the heat losses. The heat loss coefficient of a collector is dependent from the temperature and occurs due to the fact that the radiation heat loss coefficient is not constant and increases with increasing temperature. The instantaneous efficiency can now be calculated as:
. 2.19
The optical efficiency , which occurs when the mean fluid inlet temperature is equal to the ambient temperature, can be written as:
. 2.20
The coefficients , as well as the optical efficiency are the parameters which have to be determined in order to describe the thermal performance of a collector according to the European standard EN 12975‐2.
15
3 Measuring Equipment 3.1 Test-rig and test stand
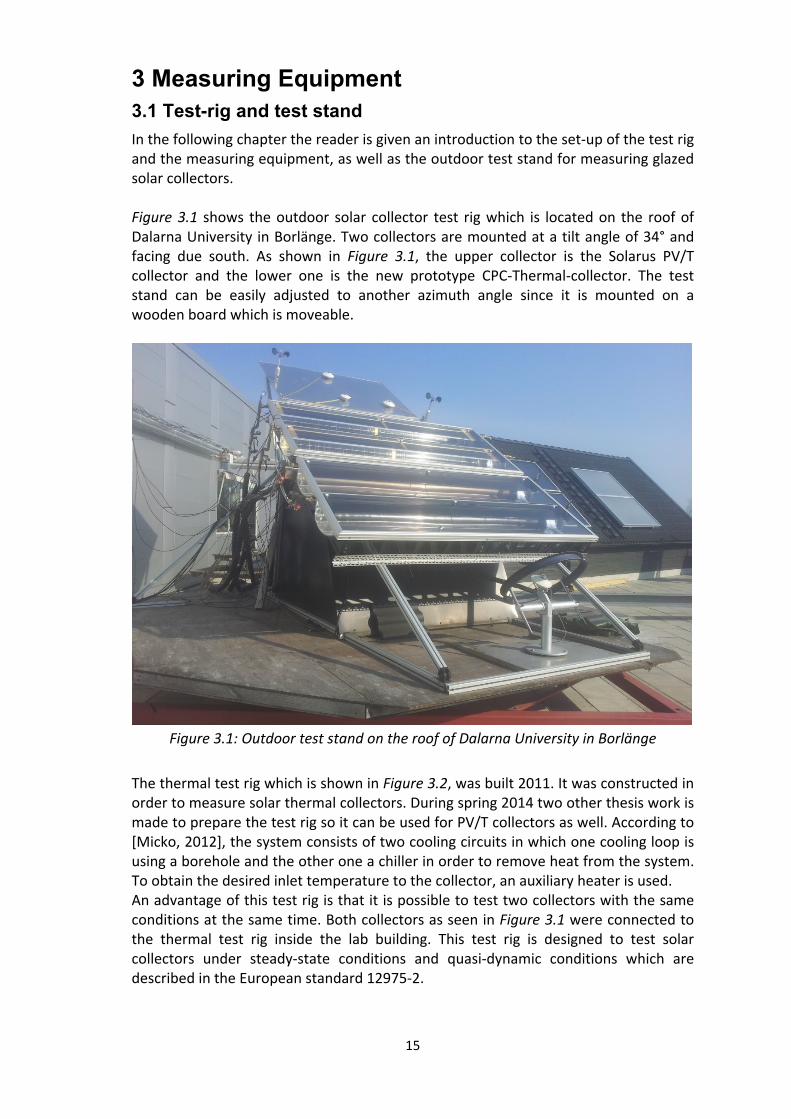
In the following chapter the reader is given an introduction to the set‐up of the test rig and the measuring equipment, as well as the outdoor test stand for measuring glazed solar collectors. Figure 3.1 shows the outdoor solar collector test rig which is located on the roof of Dalarna University in Borlänge. Two collectors are mounted at a tilt angle of 34° and facing due south. As shown in Figure 3.1, the upper collector is the Solarus PV/T collector and the lower one is the new prototype CPC‐Thermal‐collector. The test stand can be easily adjusted to another azimuth angle since it is mounted on a wooden board which is moveable.
Figure 3.1: Outdoor test stand on the roof of Dalarna University in Borlänge
The thermal test rig which is shown in Figure 3.2, was built 2011. It was constructed in order to measure solar thermal collectors. During spring 2014 two other thesis work is made to prepare the test rig so it can be used for PV/T collectors as well. According to [Micko, 2012], the system consists of two cooling circuits in which one cooling loop is using a borehole and the other one a chiller in order to remove heat from the system. To obtain the desired inlet temperature to the collector, an auxiliary heater is used. An advantage of this test rig is that it is possible to test two collectors with the same conditions at the same time. Both collectors as seen in Figure 3.1 were connected to the thermal test rig inside the lab building. This test rig is designed to test solar collectors under steady‐state conditions and quasi‐dynamic conditions which are described in the European standard 12975‐2.

16
Figure 3.2: Thermal test rig in the solar laboratory at Dalarna University in Borlänge, Sweden
3.2 Equipment
Temperature Sensors
A total of ten temperature sensors of the type PT 100 were used. All sensors were calibrated by Pentronic AB and mounted at no more than 200 mm from the inlet of the collector according to the EN 12975‐2. Additionally, the pipes in which the sensors are placed, should be insulated in order to decrease heat losses. The inlet and outlet temperatures of the two mounted collectors were measured with eight sensors. Additionally, two sensors measured the ambient temperature. These two sensors were placed in the shade, both under the collectors as it is required in the standard. One sensor at the collector outlet which is mounted horizontally is shown in Figure 3.3. According to [Diwan, 2013] these PT 100 sensors have an accuracy of ± 0.3°C at 0°C.

17
Figure 3.3: PT 100 Temperature Sensor ate the collector outlet of the CPC‐T‐Collector
Flow Meters
Two electromagnetic Optiflux 5000 flow meters from Krohne were used to measure the flow rate in each trough of the collector. The EN 12975‐2 requires that the standard uncertainty of the measured liquid flow rate should be within ± 1 % of the measured value. [EN 12975‐2] These flow meters have an accuracy of less than ± 0.15 % of the measured values. [Optiflux 5000, Datasheet]
Pyranometer
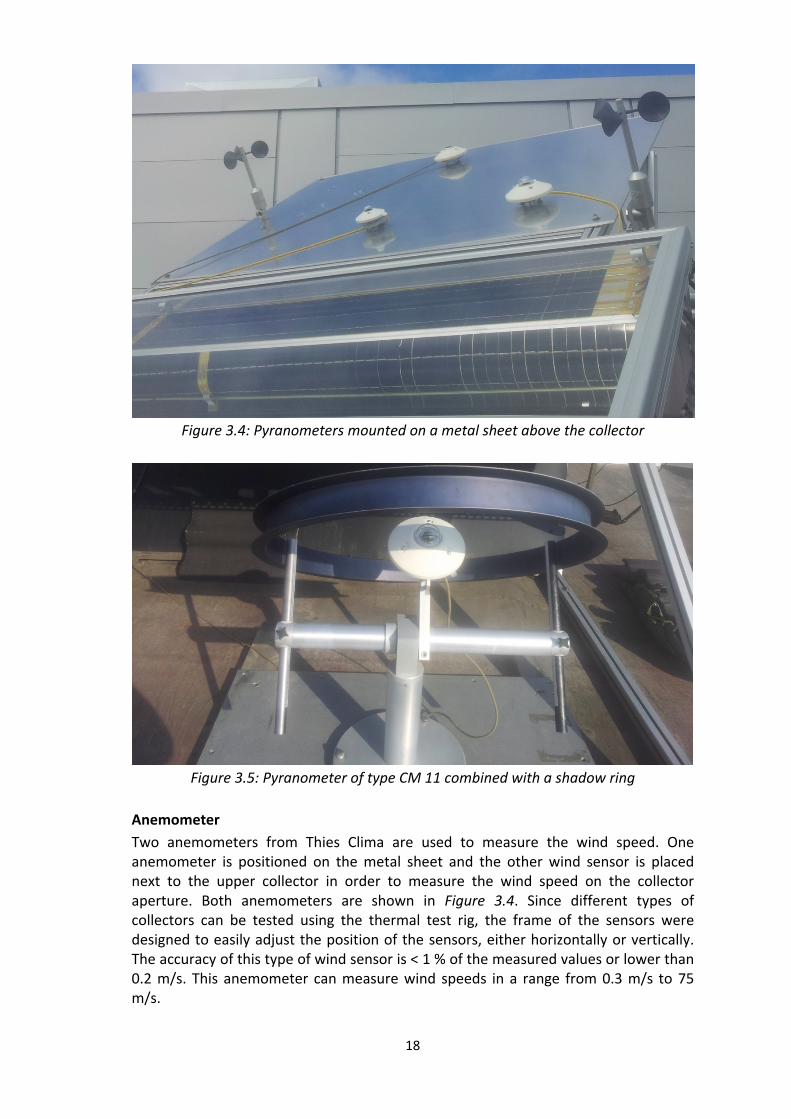
The global solar radiation is measured by two types of pyranometers from Kipp & Zonen, CM3 and CM 6. The type CM 6 has an accuracy of ± 2 % and is a first class pyranometer as required in EN 12975‐2. This pyranometer is mounted above the upper collector on a metal sheet which is aligned parallel to the collectors, as seen in Figure 3.4. In this figure are two pyranometers and one pyrgeometer shown. A pyranometer of type CM 11 which is combined with a shadow ring, measures the diffuse irradiance. As seen in Figure 3.5, the dome of the pyranometer is shaded through the shadow ring and is therefore shielded from beam radiation. Using the two sliding bars which are connected to the shadow ring, the shade on the dome can easily be adjusted. This pyranomter CM 11 has an accuracy of ± 1%.
18
Figure 3.4: Pyranometers mounted on a metal sheet above the collector
Figure 3.5: Pyranometer of type CM 11 combined with a shadow ring
Anemometer
Two anemometers from Thies Clima are used to measure the wind speed. One anemometer is positioned on the metal sheet and the other wind sensor is placed next to the upper collector in order to measure the wind speed on the collector aperture. Both anemometers are shown in Figure 3.4. Since different types of collectors can be tested using the thermal test rig, the frame of the sensors were designed to easily adjust the position of the sensors, either horizontally or vertically. The accuracy of this type of wind sensor is < 1 % of the measured values or lower than 0.2 m/s. This anemometer can measure wind speeds in a range from 0.3 m/s to 75 m/s.

19
Data Logger
All sensors which are mentioned in this chapter are connected to a data acquisition unit from National Instruments of the type Agilent 34972A, to record data (from the pyranometers, temperature sensors, etc.) in an interval of ten seconds.
LabVIEW
The recorded data from the data acquisition unit are shown in LabVIEW, where a program is written in order to collect all the data. The recorded data’s are saved in an excel‐file and can be used later on to determine the collector coefficients.
3.3 Flat Plate Collector
The used flat plate collector in this work is the K420‐EM from the German company KBB Kollektorbau GmbH and is shown in Figure 3.6. The gross area of this collector is 2.17 m² and the aperture area is 1.97 m². The absorber coating is highly selective, the absorptance is 95 % and the emittance 5 %. The cover of the collector has a structured low iron solar safety glass and its transmission is 91 %. [KBB datasheet, part B in Appendix] This collector was tested in 2013 by TÜV Rheinland according to the European standard 12975‐2 and was awarded with the Solar Keymark certificate. The test method was performed indoor, under steady‐state conditions using a solar irradiance simulator (EN 12975‐2, 6.1.5). According to the test results related to the aperture area, the optical efficiency was found to be 0.802, the first order heat loss coefficient
is 4.11 W/m²K and the second order heat loss coefficient is 0.0133 W/m²K². TÜV tested the collector with a flow rate of 0.033 kg/s per m² as specified from the manufacturer. The stagnation temperature is 209°C and this value is related to a global irradiance of 1000 W/m² and an ambient temperature of 30°C.
Figure 3.6: Flat plate collector K420‐EM. Source: [KBB datasheet can be found in Appendix B]

20
3.4 Solarus CPC-T Collector
The CPC‐T‐1500W is an asymmetrical low‐concentrating thermal collector from Solarus. The collector which is shown in Figure 3.7 is a new prototype which consists of two troughs with different absorber surfaces. In [Haddi, 2013] it is said that one absorber paint is dull and the other one is glossy and that the surface of the absorber with the glossy paint is selective. Unfortunately, there are no further information regarding the type of paints of the different absorber and according to Solarus it is not known if the absorber surfaces of those two troughs are selective. However, those troughs have been treated and tested separately. The cover of a commercial CPC‐T collector has an antireflective surface, is transparent as well as hailstone safe, the safety glass is 4 mm thick and the maximal stagnation temperature is 200 °C. The support structure of the collector is made of light wood with empty spaces in between in order to reduce its weight, wind obstruction and material costs. [Solarus datasheet can be found in Appendix A] The dimensions of the commercial Solaurs CPC‐T‐collector are the same as for the tested collector with two different absorbers in this work. The size of the collector area are given below in Table 3.1 and the dimensions of the collector are shown in Figure 3.8. Table 3.1: Dimensions of the Solarus CPC‐T‐Collector
Collector gross area 2.40 m²
Collector aperture area 2.20 m²
Absorber surface area 0.68 m²
Reflector aperture area 1.86 m²
Dimension (L x W x H) 2374 mm x 1027 mm x 231 mm
Figure 3.7: The CPC‐T‐Collector with two troughs used in the test

21
Figure 3.8: Dimensions of the CPC‐T‐Collector. Source: [Solarus datasheet can be found in Appendix A]
Further information about the commercial CPC‐T collector can be taken from the data sheet contained in Part A of the Appendix.

22
4 Methodology 4.1 European Standard 12975-2
AHSRAE 93‐77, ISO 9806‐1 and EN 12975‐2 are the three most commonly used standards for testing of glazed and unglazed solar thermal collectors. The first standard which was widely used was the American ASHRAE standard 93‐77. With regard to that, the ISO 9806‐1 was developed and from this arose the European standard EN 12975‐2. The EN 12975‐2 can be applied to glazed and unglazed flat plate collectors as well as to tube collectors and its scope is much wider than to the previously mentioned standards. The major benefit of the European standard is that the thermal performance can either be investigated under steady state (SS) conditions or quasi‐dynamic test (QDT) conditions. According to ASHRAE 93‐77 and ISO 9806‐1, the performance of solar collectors is tested only with the steady state method. The quasi dynamic method has lots of advantages compared to steady state method, which will be explained later on in this chapter. In this work, the testing methodology for the thermal performance of the flat plate and the CPC‐Thermal collector was adopted from the European standard (EN 12975‐2). By introducing the European standard 12975‐2, all national standards for testing solar collectors have been replaced. This standard covers durability, reliability and performance testing of almost all collector types available in the market, which include tests for high temperature resistance, exposure, external thermal shock, internal thermal shock, rain penetration, impact resistance and mechanical load. Only collectors which are covered by the EN 12975‐2 can obtain the Solar Keymark certificate. The location and the mounting of the collector is very important in order to not influence the results. Since the test rig is mounted on the roof of the University it should be taken into account, that the collectors should be placed according to EN 12975‐2 at least 2 meters away from the roof edge. The mounted test rig can be moved, this allows to manually track the sun in azimuth and due to the fact that the rig is moveable, the available time to test is not restricted. The tilt angle of the test rig is 34°. In the standard it is written, that “the collector shall be tested at tilt angles such that the incidence angle modifier for the collector varies by no more than ± 2% from its value at normal incidence.”[EN 12975‐2] The steady state method was performed outdoor and its requirements are explained below. Preconditioning of the collector
Before starting the testing, some preconditions of the collector have to be carried out. If any damage is seen on the collector, it should be reported immediately and if the aperture cover of the collector is dirty, it should be cleaned carefully. Another precondition of the collector is, that “the empty collector shall be exposed to irradiation for 5 h at the level of more than 700 W/m²” before testing. [EN 12975‐2] Test conditions
The test conditions for an outdoor steady‐state performance test are shown in Table 4.1. According to that, the hemispherical solar irradiance should be greater than 700

23
W/m². The angle of incidence is restricted, it is written that the angle should be within ± 20 ° variation from normal. The diffuse fraction shall not be greater than 30 %, if the diffuse irradiance level is greater than 30 %, these measurements should not be used. During the test period, the surrounding air speed shall be between 2 m/s and 4 m/s. If no recommended fluid flow rate is given by the manufacturer, then the fluid flow rate should be 0.02 kg/s m² of the aperture area of the collector. Table 4.1: Test conditions for steady‐state method according to the EN 12975‐2
Parameter Value
Global solar irradiance G > 700 W/m²
Incidence angle of direct solar radiation < 20°
Diffuse fraction Gd/G < 30 %
Surrounding air speed u 3 m/s ± 1 m/s
Surrounding air temperature Ta ‐
Fluid flow rate 0.02 kg/s m²
Collector inlet temperature Tin ‐
Test procedure The performance characteristics of the collector can be determined under clear sky conditions. The standard has no specific value condition for the inlet temperature, it is said that the collector should be tested at four different inlet temperatures and that the maximum temperature should be at least around 80 °C if water is used as heat transfer fluid. The lowest inlet temperature should lie near the ambient air temperature, so the zero loss efficiency can be obtained precisely. For the surrounding air temperature are no value conditions set as well. Regarding the measurements of the surrounding air temperature , it had to be taken into account that the sensors which measure the air temperature, had to be shaded from reflected and direct solar radiation. In the measurements performed for this study, the temperature sensor was set behind the collectors where it was perfectly shaded. Measurements
Following parameters shall be measured in order to evaluate the thermal performance of a collector:
‐ Temperature of the heat transfer fluid at the collector inlet
‐ Temperature of the heat transfer fluid at the collector outlet
‐ Surrounding air temperature
‐ Flow rate of the heat transfer fluid
‐ Air speed parallel to the collector aperture
‐ Hemispherical solar irradiance at the collector aperture
‐ Diffuse solar irradiance at the collector aperture
Test period
A collector is considered to have been operating in steady‐state conditions over a given measurement period if none of the experimental parameters deviate from their mean values over the measurement period by more than the limits given in Table 4.2. [EN 12975‐2]

24
Table 4.2: Test conditions and allowed deviations for the steady‐state method according to [EN 12975‐2]
Parameter Value Deviation from the mean
Global solar irradiance G > 700 W/m² ± 50 W/m²
Fluid flow rate 0.02 kg/s m² ± 1 %
Surrounding air temperature Ta ‐ ± 1.5 K
Collector inlet temperature Tin ‐ ± 0.1 K
Computation of collector output:
The actual useful power which is extracted, can be calculated according to the European standard from:
∗ ∗ . 4.1
To calculate the instantaneous efficiency , the reduced temperature difference has to be known first. The reduced temperature difference is calculated as:
. 4.2
Where the mean temperature of the heat transfer fluid is calculated as:
2
. 4.3
With those two equations, the instantaneous efficiency can be calculated as:
. 4.4
The zero loss efficiency and the heat loss coefficient a1 as well as the temperature dependence of the heat losses a2 can be determined using the least squares method or the multiple linear regression tool (MLR) in Excel. This method is the most common mathematical tool which is used to identify the parameters of the collector. As mentioned before, there is another method to test the thermal performance of glazed and unglazed solar collectors, this method is called the quasi‐dynamic test method (QDT). QDT has many advantages over the steady‐state method and is used by approximately one third of laboratories in Europe. [Kovacs, 2012] For the SS‐testing very stable weather conditions are required where for the QDT, collectors can be tested when the weather conditions are varying. Thus, collectors can be tested during the whole day since the range of irradiance values that are accepted for this method, are between 300 and 1100 W/m². The angle of incidence was restricted in the steady‐state method, it is said that the angle should be within ± 20° variation from normal. Testing with QDT removes this restriction and due to this it is possible to test collectors when the incidence angle is beyond ± 20° variation from normal. Another advantage of QDT is that it removes the boundary condition for diffuse fraction of 30 % and therefore, collectors can be tested also during cloudy days. The range for the wind speed has been extended and is now between 1 m/s and 4 m/s.

25
To determine the thermal performance, 4‐5 days are enough for testing outdoor using the quasi‐dynamic method. The collector model for quasi‐dynamic testing is based on the steady‐state method, but is more complex compared to the SS method. The QDT model has an incidence angle modifier for direct ( ) and for diffuse ( ) irradiance. In this model, correction terms for dependence of direct and diffuse radiation, wind speed, sky temperature, incidence angle effects and effective thermal capacitance are included. The useful output power of the QDT collector model and its coefficients which have to be determined, are shown in the Equ. 4.5 below. By applying the Multiple Linear Regression (MLR) tool in Excel, the coefficients of the collector model can be determined. [Kovacs, 2012]
/ . 4.5
The coefficients in equation 5 are explained below:
= Heat loss coefficient at (Tm‐Ta) = 0 [W/m²K]
= Temperature dependence of the heat losses [W/m²K²]
= Wind speed dependence of the heat losses [J/m³K]
= Long‐wave irradiance dependence of the heat losses [‐]
= Effective thermal capacitance [J/m²K]
= Wind dependence of the zero loss efficiency, a collector constant [s/m]
= Incidence angle modifier for diffuse radiation, a collector constant [‐]
= Incidence angle modifier (IAM) for direct (beam) radiation [‐]
= Zero loss efficiency [‐]
The steady state method is applied in this work for testing the thermal performance of the new prototype CPC‐Thermal collector because earlier tests performed in 2013 have been carried out using the steady state method as well and the results achieved in this work can therefore be compared one by one with results from 2013. Furthermore in parallel with this thesis, another Master Thesis by Narasimman Sami is written in which the main focus was on verification of the test rig for the test methods by using the quasi dynamic test method.

26
4.2 Test procedure
In the following chapter the reader is given an introduction to the test procedure. First of all cold water is supplied to the system as collectors are generally tested with water as liquid. After the water is supplied as a liquid, it is heated to about 80 °C in the system. When the inlet temperature is about 80 °C, the system is turned off and after a few minutes the air is released from the system. This process is repeated a few times until it is certain that air no longer exists in the system. Furthermore, the entire test stand is inspected for leaks. In order to have the correct fluid flow through the system, it must be first calculated. From the EN 12975‐2 is apparent that the liquid flow is supposed to be 0.02 kg/s per m² unless other specified. This will now be calculated using the example of the used flat‐plate collector. The aperture area of the collector is 1.97 m². The predetermined fluid flow is multiplied by the aperture surface and the second is converted into hours:
0.02∗ ²
∗ 3600 ∗ 1.97 141.84 . 4.6
The calculated mass flow of 141.84 kg/h is set manually by hand. Another important point which should be taken into account is that the pressure in the system does not ascend more than 2 bar. The next step is to insulate the sensor cables and the pipes to avoid heat losses and decrease the uncertainty of the measurement. Before each test procedure, the glass dome of the pyranometer should be cleaned with a microfiber cloth. The test stand cannot automatically track the sun, therefore the test stand is turned manually towards the direction of the sun. After everything was cleaned and no other defects have been noticed, the first inlet temperature can be set manually and the test process can be started. The first inlet temperature should be as equal as possible to the ambient temperature. The system needs only a few minutes in order to reach the set temperature. In between, the mass flow must be checked constantly so that it does not differ much. Additionally, the shadow ring from the pyranometer which blocks the direct radiation, is adjusted approximately every 15 to 20 minutes. When steady state conditions are reached, the data are recorded another 10‐15 minutes with the set inlet temperature in order to have enough data to evaluate the thermal performance of the collector. Then the temperature was increased to the second inlet temperature and all of the above mentioned intermediate steps have to be carried out as well. The testing procedure is terminated when four different inlet temperatures were set and tested in approximately equal intervals. Subsequently, the temperature in the system is reduced to approximately 9 degrees so that it is ensured that the liquid in the collector does not freeze in the night.
4.3 Multiple linear regression
Once the measurements are complete and all the necessary data have been recorded from the numerical‐mathematical software MATLAB, the evaluation can be carried out using the Multiple Linear Regression (MLR) tool in Excel. The MLR‐tool predicts the

27
intercept and thus the optical efficiency and furthermore, it predicts the value which is described by the heat loss coefficient. When performing the regression, not only the required parameter are determined but as well the coefficient of determination which is called R² (R Square), as well as the t‐ratio. The coefficient of determination describes the overall model and gives information about the suitability of the used data for this model. The data are better described by the model, the closer R Square is to one. According to [Perers, 2014, Personal communication], it was revealed that the t‐ratio should in all cases be higher than 2. If the t‐ratio is lower than 2, then more data are needed to determine the required parameter more accurately. To evaluate the thermal performance of a collector, a total of minimum 16 data points are required for the determination according to the European standard. Four data points are taken from each inlet temperature which match the criteria, as well as those which not exceed the permitted deviation which are shown in Table 4.2. The selected data points should be successively accordingly in the range of 40 seconds for each of the four inlet temperatures. Table 4.3 shows the selected 16 data points from the measurements of the flat plate collector. The second column obtains the efficiencies of the 16 data points and the third column refers to the reduced temperature difference . In order to perform a regression analysis in Excel, the data analysis tool has to be added to the program first. This is done by selecting Excel Options ‐> Add‐Ins ‐> Analysis ToolPak. After selecting the data points and adding the data analysis tool, the regression can be started by Data ‐> Data Analysis ‐> Regression. Table 4.3: Data points for the Regression
Data points [ ²]
1 0.7356 0.0049
2 0.7391 0.0047
3 0.7373 0.0046
4 0.7393 0.0045
5 0.6683 0.0208
6 0.6712 0.0208
7 0.6752 0.0208
8 0.6764 0.0209
9 0.5932 0.0434
10 0.6021 0.0436
11 0.5985 0.0438
12 0.5918 0.0441
13 0.4129 0.0647
14 0.4348 0.0646
15 0.4325 0.0640
16 0.4696 0.0662
The summary output of the regression can be seen in Figure 4.1 below. The first table “Regression Statistics” which contains the R Square, and the second table “ANOVA” gives information about the Analysis of Variance. The third table contains the

28
coefficients of the intercept and the heat loss coefficient . Furthermore, a line fit plot is shown in a graph on the right side as well.
Figure 4.1: Summary output from the regression

29
5. Results 5.1 Uncertainty
Measurement uncertainties can occur during testing and this can lead to differences in the test results. The used equipment itself has uncertainties as shown in section 3.2. The uncertainties in efficiency as well as the heat loss coefficient will be explored in the following. The Table 5.1 shows the uncertainties of the used measuring equipment. These uncertainties can be found in the datasheet of the used equipment. Table 5.1: Uncertainties of the used equipment
Parameter Uncertainty
Flow meter ± 0.15 %
Pyranometer CM 6 ± 2 %
Temperature sensor PT 100 ± 0.3 °C
The uncertainty of a measurement result is expressed as a standard deviation. If a measurement variable consists of several other measurement variables, then the Gaussian error propagation law can be applied in order to determine the amount of the resulting standard deviation by adding the uncertainties as root sum of squares. This can be done with the Equ. 5.1 below. [GUM, 2008]
. 5.1
The following formulae were used in order to calculate the standard uncertainties for the dependent variables [Taylor, 1997]:
∆ ∆ ∆ . 5.2
∆∆ ∆
. 5.3
Since the mean temperature of the fluid is calculated as , the
uncertainty is expressed as follow:
∆ ∆ ∆ . 5.4
0.3 0.3
0.42°C
The uncertainty for the mean fluid inlet temperature and ambient temperature results in:
∆ ∆ ∆ . 5.5
0.42 0.3

30
0.52°C
Using the calculated uncertainties above, the uncertainty for the reduced temperature difference can be calculated with:
∆ ∆ ∆
. 5.6
The uncertainties have been determined for each measurement using the . 5.6 and the following . 5.7 for the uncertainty of the efficiency. The uncertainty in the efficiency consists of multiple parameters which have to be taken into account, as can be seen in the equation below:
∆ η∆ ∆ ∆
. 5.7
The uncertainty in ∆ is the same is in∆ because the difference is calculated in the same way. The uncertainty of the mass flow and the radiation are indicated in percent of the measured value. Therefore, the uncertainties of both parameters had to be calculated for each measurement.
5.2 Evaluation of the CPC-T-Collector
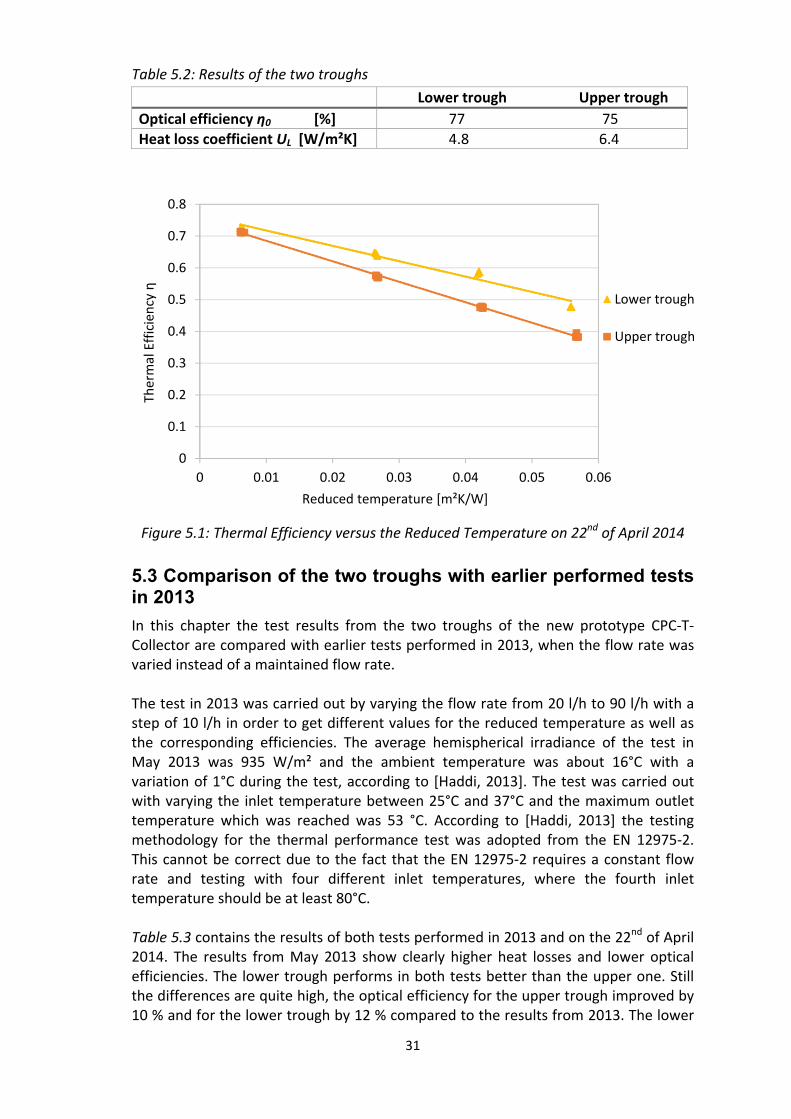
The evaluation of the optical efficiencies and the heat loss coefficients of the two different troughs of the CPC‐T‐Collector from Solarus are presented in this section. The new prototype CPC‐T‐Collector was tested between April 14th and April 22nd 2014. Due to weather restrictions, only four days could be used for collector testing under steady state conditions. The following results are from the 22nd of April 2014, which was a perfectly clear day with a mean hemispherical irradiance of 960 W/m². The thermal efficiency versus the reduced temperature of both troughs is plotted in Figure 5.1. Using the multiple linear regression, the data were fit to a linear function which follows the line for the upper trough which is 0.75 0.06 6.45 0.27 x. The corresponding coefficient of determination is R² = 0.9987. Thus, the optical efficiency of the upper trough is 75 ± 6% and the heat loss coefficient UL has a value of 6.4 ±0.3 W/m²K. The lower trough has the following linear function 0.77 0.054.84 0.20 xand the corresponding coefficient of determination is R² = 0.9688. The optical efficiency of the lower trough is 77 ± 5% and the heat loss coefficient UL is 4.8 ± 0.2W/m²K. The results show that the lower trough of the CPC‐T‐collector performs better than the upper trough. The optical efficiency of the lower trough is 2 % higher than from the upper one and the heat loss coefficient is lower by ‐1.61 W/m²K. In Figure 5.1 can be seen that both graphs are quite steep and that at higher temperatures the thermal efficiency decreases in both troughs and the losses from the collector are increasing significantly. The different absorber paintings have a significant impact on the results. For a better overview, the results of the thermal performance of this collector are shown in Table 5.2.
31
Table 5.2: Results of the two troughs
Lower trough Upper trough
Optical efficiency η0 [%] 77 75
Heat loss coefficient UL [W/m²K] 4.8 6.4
Figure 5.1: Thermal Efficiency versus the Reduced Temperature on 22nd of April 2014
5.3 Comparison of the two troughs with earlier performed tests in 2013
In this chapter the test results from the two troughs of the new prototype CPC‐T‐Collector are compared with earlier tests performed in 2013, when the flow rate was varied instead of a maintained flow rate. The test in 2013 was carried out by varying the flow rate from 20 l/h to 90 l/h with a step of 10 l/h in order to get different values for the reduced temperature as well as the corresponding efficiencies. The average hemispherical irradiance of the test in May 2013 was 935 W/m² and the ambient temperature was about 16°C with a variation of 1°C during the test, according to [Haddi, 2013]. The test was carried out with varying the inlet temperature between 25°C and 37°C and the maximum outlet temperature which was reached was 53 °C. According to [Haddi, 2013] the testing methodology for the thermal performance test was adopted from the EN 12975‐2. This cannot be correct due to the fact that the EN 12975‐2 requires a constant flow rate and testing with four different inlet temperatures, where the fourth inlet temperature should be at least 80°C. Table 5.3 contains the results of both tests performed in 2013 and on the 22nd of April 2014. The results from May 2013 show clearly higher heat losses and lower optical efficiencies. The lower trough performs in both tests better than the upper one. Still the differences are quite high, the optical efficiency for the upper trough improved by 10 % and for the lower trough by 12 % compared to the results from 2013. The lower
0
0.1
0.2
0.3
0.4
0.5
0.6
0.7
0.8
0 0.01 0.02 0.03 0.04 0.05 0.06
Thermal Efficiency η
Reduced temperature [m²K/W]
Lower trough
Upper trough

32
trough has a lower heat loss coefficient by 3.53 W/m²K and the upper trough by 2.16 W/m²K. An explanation for the lower optical efficiencies from 2013 could be due to the low flow inside the pipes. The heat transfer inside the absorber is not so good at low flow and the therefore the optical efficiency decreases as it involves the heat transfer hidden in the collector efficiency factor . Since contains the collector efficiency factor as well, the heat loss coefficient should have been decreased too but when having low flow inside the pipes, the temperature rise gets not linear but logarithmic and this leads in the standardized evaluation to a larger heat loss coefficient. Furthermore, the heat transfer can be reduced due to air bubbles inside the absorber, which are caused due to a low flow. [Perers, 2014, Personal communication] In the work of [Haddi, 2013] it is not clear if the sun was tracked in order to follow the sun’s movement during the testing or not. This would explain the differences in the optical efficiencies as well. The optical efficiency is sensitive to incident angles and the highest optical efficiency can be reached when the angle is closest to the normal incidence. Table 5.3: Results of the two troughs compared to 2013
Lower Trough Upper Trough
April 2014 May 2013 April 2014 May 2013
Optical efficiency η0 [%] 77±5 65 75±6 64
Heat loss coefficient UL [W/m²K] 4.8±0.2 8.37 6.4±0.3 8.61
5.4 Evaluation of the Flat-Plate Collector
This chapter contains the evaluation of the optical efficiency and the thermal heat loss of the flat‐plate collector from KBB Kollektorbau GmbH. The performance of the flat plate collector was tested only for verification of the test method. Due to the weather, the flat plate collector has been tested under steady state conditions only on the 28th of April 2014. Accordingly, the results presented in Figure 5.2 are based on the 28th of April 2014. The mean hemispherical irradiance that day was 888 W/m² and the ambient temperature during the testing period was between 21°C and 23°C. The data from this collector were fit to a linear function which follows the line 0.77 0.06 4.89 0.25 x. The corresponding coefficient of determination is R² = 0.9520. Therefore, the optical efficiency of this flat plate collector is 77±6% and the heat loss coefficient has a value of 4. 9±0.2W/m²K. The Figure 5.2 shows an expected steep graph, with increasing temperature the thermal efficiency decreases and the heat losses are increasing.
33
Figure 5.2: Thermal Efficiency versus the Reduced Temperature of the Flat Plate Collector on 28th of April 2014 TÜV Rheinland tested the same flat plate collector in end of May and the beginning of June 2013. The datasheet which contains the test results and which can be found in part B of the Appendix, discloses that the test was performed indoor using a solar simulator (according to EN 12975‐2 6.1.5). Another major aspect which should be mentioned is that a flow rate of 0.033 kg/s per m² were used with water as fluid. This flow rate is higher than the required 0.02 kg/s per m² from the standard. Table 5.4 shows the results from TÜV Rheinland as well as from the 28th of April 2014. When comparing the results from both tests it is obvious that due to the fact of different conditions, the results are expected to be slightly different. The results from TÜV Rheinland show a better optical efficiency and a slightly lower heat loss coefficient UL
than the results of the test performed on the 28th of April 2014. The optical efficiency is higher by 3% and the heat loss coefficient is lower by 0.36 W/m²K when testing under conditions as TÜV Rheinland. The test report from TÜV Rheinland show an a1‐value of 4.11 W/m²K and an a2‐value of 0.0133 W/m²K². The ‐value shown in Table 5.2 is determined through
. 2.18from section 2.5. The calculated heat loss coefficient of 4.53 W/m²K refers to the same temperature interval as which is used when the flat plate collector was tested. Figure 5.2 show measured values for the reduced temperature between 0.005 m²K/W and 0.066 m²K/W. By multiplying the mean hemispherical irradiance of 888 W/m² with the values for the reduced temperature as mentioned above, the temperature difference for these values are between 4.4 K and 58.6 K. This results in a mean temperature differenceΔ of 31.5 K for the mentioned interval. By inserting the parameters into the . 2.18, the ‐value is calculated to:
4.11 0.0133 31.5 4.53 . 5.8
Table 5.4: Results of the 28th of April and the datasheet from TÜV Rheinland
28th of April 2014 TÜV Rheinland
Optical efficiency η0 [%] 77±6 80
Heat loss coefficient UL [W/m²K] 4.9±0.2 4.53
0
0.1
0.2
0.3
0.4
0.5
0.6
0.7
0.8
0 0.01 0.02 0.03 0.04 0.05 0.06 0.07
Thermal Efficiency η
Reduced temperature [m²K/W]

34
6 Discussion The results of the thermal performance of both collectors, CPC‐T as well as flat plate collector will be compared with related collectors which are described in chapter 2. The thermal performance of different collectors is shown in Table 6.1.
Table 6.1: Comparison of thermal performance of different collectors
Collectors [%] [W/m²K] Source of results
Solarus CPC‐T lower trough 77±5 4.8±0.2 Measurement
Solarus CPC‐T upper trough 75±6 6.4±0.3 Measurement
Solarus CPC‐T (commercial) 51 2.12 Test report from SP
CPC‐T 64 3.84 Bernardo et al., 2011a
CPC – PV/T 54 4.17 Bernardo et al., 2013
Flat plate from KBB 77±6 4.9±0.2 Measurement
Flat plate from KBB 80 4.53 Test report from TÜV
Solarus advice was to take the most recent test report from the SP Technical Research Institute of Sweden and compare their results with the one accomplished in this work. SP tested a commercial Solarus CPC‐T‐1500W under quasi‐dynamic test conditions outdoor in March of 2011. The test was carried out with water as fluid and a flow rate of 0.008 kg/s per m². [Test report in part C of the Appendix] The collector efficiency parameters according to the aperture area are η0 = 0.51, the first order heat loss coefficient is a1 = 1.76 W/m²K and the second order heat loss coefficient is a2 = 0.012 W/m²K². The heat loss factor UL for a commercial CPC‐Thermal collector from Solarus is according to their datasheet 1.90 W/m²K. [Part B in Appendix] In the following, the – value will be determined through the first and second order heat loss coefficient from SP and the mean temperature difference of the tested CPC‐T collector in this work. The ‐value has been determined as in section 5.3 described. Figure 5.1 show measured values for the reduced temperature between 0.006 m²K/W and 0.056 m²K/W. By multiplying the mean hemispherical irradiance of 960 W/m² with the values for the reduced temperature, the temperature difference for these values are between 5.8 K and 53.8 K. This results in a mean temperature differenceΔ of 29.8 K for the mentioned interval of the tested CPC‐T collector. By inserting the parameters into the . 6.1, the ‐value is:
1.76 0.012 29.8 2.12 . 6.1
The calculated UL‐value of the tested collector by SP is according to the calculation 2.12 W/m²K and found to be slightly higher than the UL‐value of 1.9 W/m²K in Solarus datasheet. By comparing the calculated ‐value (2.12 W/m²K) with the ‐values determined for the lower trough (4.84 W/m²K) and upper trough (6.45 W/m²K), it is found that the determined values in this work are around 2 times (lower trough) and 3 times (upper trough) higher than the one from SP. Thus, these results are not directly comparable to one another because the two collectors have different coatings as well as absorbers.

35
The optical efficiency determined by SP is 51% and therefore lower compared to the optical efficiencies of both troughs (see Table 6.1). The difference in these values can occur due to the difference in testing between both collectors and due to the fact that these are two different collectors with different absorbers. The collector in the testing institution was mounted at a tilt angle of 45° facing south and the optical axis was in east‐west direction. [SP, 2014] Due to testing with QDT it was not necessary for SP to track the sun and follow the sun’s movement. Due to this, the optical efficiency is lower by SP because without tracking the sun, the incidence angle is not close to normal. The boundary condition for diffuse fraction of 30 % is removed by QDT and therefore testing under various diffuse fractions is acceptable. By increased diffuse fraction, the collector output decreases and therefore the efficiency as well. The values which are found for the efficiency and the corresponding heat loss coefficients are very dependent from the diffuse fraction. Unfortunately, the test report does not mention the amount of diffuse fraction. Another fact is that SP tested the commercial collector with a flow rate of 0.008 kg/s per m². Due to the low flow inside the pipes, the optical efficiency decreases because the heat transfer inside the absorber is not so good at low flow.
[Bernardo et al., 2011a] evaluated the performance of the low concentrating thermal CPC collector system which is based on the roof‐integrated MaReCo reference design such as the presented CPC‐T prototype collector in this work. Furthermore, an investigation of the CPC PV/T collector has been carried out by [Bernardo et al., 2013] as well. In this case, both collectors have the same reflector shape, but one collector is a PV/T and the other one is a thermal only collector. Therefore, the difference in the optical efficiency is explained. The CPC thermal has an optical efficiency of 64 %, which is 10 % higher than the one for the CPC PV/T. This is not surprising that the optical efficiency of the CPC PV/T is lower since this collector produces electricity and heat at the same time and this value is in accordance when electricity is extracted. The values are reduced due to the fact that a part of the incoming irradiance is used to produce electricity. Solar cells do not have as high absorptance as a black surface and they are normally a little coloured and through high temperatures the efficiency of the photovoltaic module decreases and this loss which corresponds in electricity production, is compensated by thermal production. In order to compare the thermal performance, the ‐ value of the CPC‐T collector has to be determined first. The results showed an ‐ value of 2.8 W/m²K and an ‐ value of 0.035 W/m²K². With the mean temperature difference of 29.8 K for the test carried out in this work, the ‐ value is found to be 3.84 W/m²K. This value is lower than the values of both troughs of the tested prototype as well as the CPC PV/T collector which has a heat loss coefficient of 4.17 W/m²K. The higher ‐value of the tested CPC PV/T collector can occur due to not having a low‐emissivity coating of the laminated cells. The paints of the CPC‐T prototype are candidates for utilization as background paint in the PV/T collector, therefore Solarus was interested in the properties of these paints in order to decide whether they want to use these paints for their PV/T collector or not. The solar cells are covering 85 % of the absorber surface, so 15 % of the absorber area could be utilized with these paints. If the unknown paints of the CPC‐T prototype are intended to be used in the PV/T collector, the collector performance will be reduced significantly in normal working conditions due to the found results.

36
Due to the high heat loss coefficients achieved for the prototype of the CPC‐T collector in this work, it can be assumed that the absorber coatings of the two troughs (which are unknown), are most probably non‐selective. Absorbers have typically selective coatings in order to reduce heat losses. A good solar absorber should have high absorptivity for solar radiation and the surface must have low emissivity in order to not radiate heat. The commercial CPC‐T tested by SP had an absorptance of 0.96 and an emittance of 0.07 which resulted in the lower heat loss coefficient (2.12 W/m²K). The absorber of the investigated thermal CPC collector by [Bernardo et al., 2011a] has a selective coating and this results in the lower heat loss coefficient which was calculated to 3.84 W/m²K. If the emittance of the two paints in the prototype are high, then the high value in heat loss coefficient would be explained. Unfortunately, these properties of the prototype are unknown. Due to the found results it can be said that the lower trough of the prototype CPC‐T collector performs overall better than the upper trough but their heat loss coefficients are still too high when compared to similar studies. If Solarus wants to use these paints in their PV/T collector, than some improvements have to be done in order to improve the collector performance in normal working conditions. A recommendation for Solarus would be that the absorbers should have selective coating in order to reduce the heat losses and furthermore, heat losses of the prototype collector could be improved trough convection suppression. [Adsen, 2002] showed that the heat loss coefficient can be reduced by 30 % when Teflon is put as a transparent insulation around the absorber. By this, the radiation losses and the convection coefficient is reduced. The flat plate collector from KBB was tested only for verification of the test method. The determined optical efficiency was found to be 77 % and the heat loss coefficient UL is 4.9 W/m²K. Comparing the determined results with the one from the testing institution TÜV Rheinland, the optical efficiency determined by TÜV is higher by around 3 % and the heat loss coefficient UL is lower by 0.36 W/m²K for a mean temperature difference of 31.5 K. TÜV Rheinland tested this collector with a flow rate of 0.033 kg/s per m² which is slightly higher than the recommend one in EN 12975‐2 (0.02 kg/s per m²). The difference in the results can occur due to the difference in flow rate. The heat transfer inside the absorber is better by higher flow rate and this results in increased optical efficiency. Due to various factors, the measurements and therefore the results can be affected. The used flow meter is a very good and accurate one but it should be cleaned quite often, maybe every second or third day of measurements because inside the flow meter formation of dirt occurs and this can lead to inaccurate values. [Perers, 2014, personal communication] Another factor is that the required wind speed between 2 m/s and 4 m/s could not always be reached during the test period. The EN 12975‐2 specifies to have an artificial wind generator in this case. Due to restriction of equipment, an artificial wind generator could unfortunately not be provided. The collector was a bit dirty from the outside as well from the inside. The cover of the collector was cleaned before starting the measurements, but the inside of the collector was quite a bit dirty to start the measurements without cleaning it first. To remove the dirt inside the collector, an air compressor were used but only a few dust particles could be removed. Still the inside of the collector was not that much dirty and it should not have such a huge impact of the results but it would be interesting to
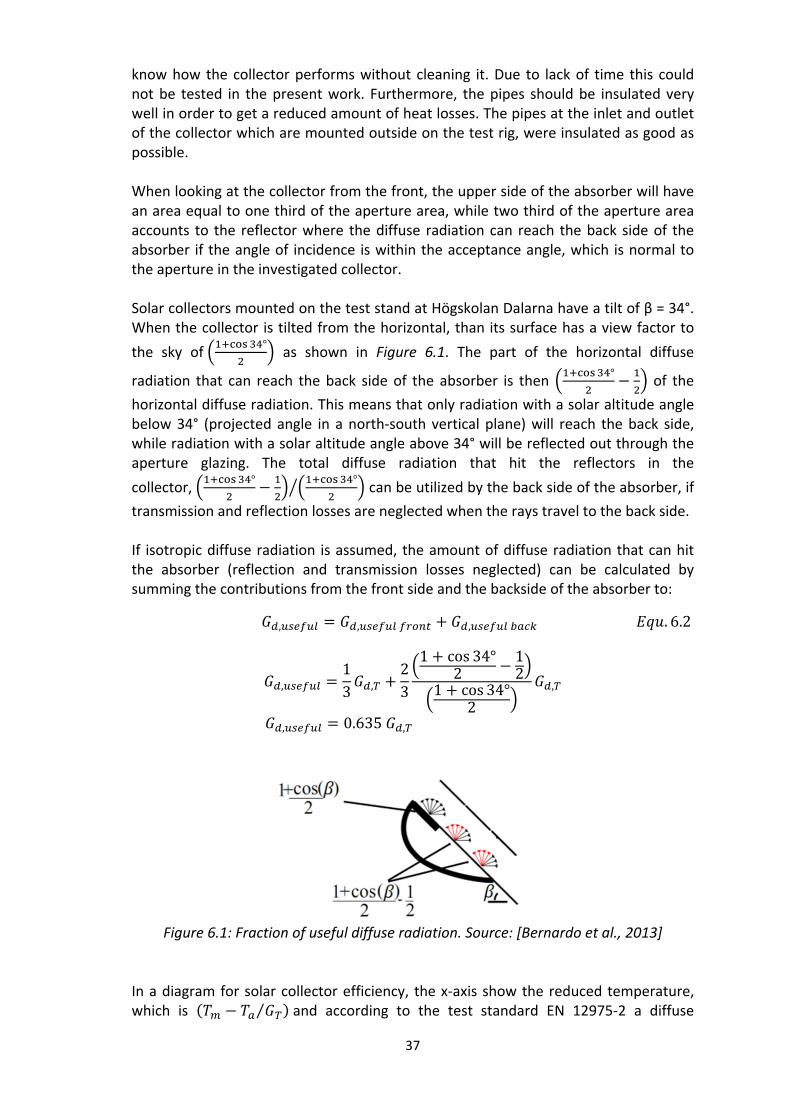
37
know how the collector performs without cleaning it. Due to lack of time this could not be tested in the present work. Furthermore, the pipes should be insulated very well in order to get a reduced amount of heat losses. The pipes at the inlet and outlet of the collector which are mounted outside on the test rig, were insulated as good as possible. When looking at the collector from the front, the upper side of the absorber will have an area equal to one third of the aperture area, while two third of the aperture area accounts to the reflector where the diffuse radiation can reach the back side of the absorber if the angle of incidence is within the acceptance angle, which is normal to the aperture in the investigated collector. Solar collectors mounted on the test stand at Högskolan Dalarna have a tilt of β = 34°. When the collector is tilted from the horizontal, than its surface has a view factor to
the sky of ° as shown in Figure 6.1. The part of the horizontal diffuse
radiation that can reach the back side of the absorber is then °
of the
horizontal diffuse radiation. This means that only radiation with a solar altitude angle below 34° (projected angle in a north‐south vertical plane) will reach the back side, while radiation with a solar altitude angle above 34° will be reflected out through the aperture glazing. The total diffuse radiation that hit the reflectors in the
collector, ° ° can be utilized by the back side of the absorber, if
transmission and reflection losses are neglected when the rays travel to the back side. If isotropic diffuse radiation is assumed, the amount of diffuse radiation that can hit the absorber (reflection and transmission losses neglected) can be calculated by summing the contributions from the front side and the backside of the absorber to:
, , , . 6.2
,13 ,
23
1 cos 34°2
12
1 cos 34°2
,
, 0.635 ,
Figure 6.1: Fraction of useful diffuse radiation. Source: [Bernardo et al., 2013]
In a diagram for solar collector efficiency, the x‐axis show the reduced temperature, which is ⁄ and according to the test standard EN 12975‐2 a diffuse
38
fraction up to 30% can be accepted in the steady state test method. At really clear weather, the diffuse fraction can be as low as 8% (rarely less), but since the GT is used that is incident on the collector in calculation of the efficiency curve, is not the radiation that actually can be used for the collector. This means that the radiation used by the collector in the test can vary from 89% (for diffuse fraction of 30%) to 97% (for diffuse fraction of 8%) of the total global radiation. The radiation used by the collector can be calculated according to . 6.3. This will now be shown with the example of the diffuse fraction of 8%:
, . 6.3
0.92 0.635 ∗ 0.08 0.97
If the diffuse part of the total radiation is low and near 8‐10 %, a higher output from the collector occurs compared to the diffuse part which is larger and near 30 %. Due to this fact an extra uncertainty will arise since the diffuse part may vary during the measurement period. The comparison of different measurements of the same collector is made more difficult since the result will depend on the diffuse fraction. During the measurement performed in this study, the weather was very clear with diffuse fractions near 10 % or even lower. This can explain the high optical efficiency which is achieved compared to other measurements performed on similar collectors. A more rigorous analysis may also show that the heat loss coefficient can be affected by the diffuse fraction, but this is not within the scope of this thesis. Although the above mentioned analysis is approximate since factors like reflection losses and contribution of ground reflected radiation is neglected, it shows that the test standard EN 12975‐2 has drawbacks and may not be suitable for low‐concentrating collectors in its current form. For future research it is suggested that test methods for low‐concentrating collectors should be studied more for reducing the uncertainties that will arise with today’s test methods.
In parallel with this thesis, another Master Thesis by Assem Sayed is written with the main objective on the investigation of the electrical performance of the Solarus CPC‐PV/T collector. The results which are achieved in that thesis were planned to be presented in this work as well. Unfortunately, the results could not be included due to the fact that the testing is not finished yet.

39
7 Conclusion and Outlook The aim of this thesis was to test the thermal performance of two types of thermal collectors. One collector is a flat plate collector from KBB Kollektorbau GmbH and the second collector is a Solarus CPC thermal collector which has two absorbers that are coated with different surfaces whereby the coating performance is unknown. The thermal performance of the flat plate collector was only tested for verification of the test method. The tests were performed according to the steady state test method as described in the European standard EN 12975‐2. The CPC thermal collector was tested in 2013 according to the EN 12975‐2 as well, but with varying the flow rate instead of the inlet temperature. Therefore, the earlier tests performed in 2013 were compared with results achieved in this work. The evaluation of the measured data was carried out using the multiple linear regression. The evaluation showed that the optical efficiency of the lower trough is 77±5% and therefore 2 % higher than from the upper one, which has an optical efficiency of 75±6%. The heat loss coefficient UL of the lower trough is 4.8±0.2 W/m²K and from the upper trough 6.4±0.23 W/m²K. The different absorber paintings have a significant impact on the results, the lower trough has an overall better performance. The results achieved in this thesis show lower heat losses and higher optical efficiencies compared to the results from 2013 in which the thermal performance was tested by varying the flow rate between 20 l/h to 90 l/h which resulted in lower optical efficiencies since the heat transfer inside the absorber is not good at low flow and therefore the optical efficiency decreases. Nevertheless the lower trough of the CPC‐T‐Collector performs in both tests better than the upper trough but the heat loss coefficients of both troughs are still higher compared to other results for CPC collectors which have been found in earlier studies (section 6). The results of the flat plate collector show an optical efficiency of 77±6% and the heat loss coefficient UL has a value of 4.9±0.2 W/m²K. These results do not differ much from the results presented in the test report from TÜV Rheinland for the same collector. The optical efficiency is higher by 3 % and the heat loss coefficient UL is lower by 0.36 W/m²K when testing under conditions as TÜV Rheinland. The results of this thesis provide a foundation for future thermal performance testing of solar thermal collectors. A recommendation for future studies would be to test the collector when it is cleaned and not cleaned in order to know how much impact dirt can have on the results. In addition, it would be interesting to test the thermal performance of collectors both inside and outside according to the steady state method, simply to compare the difference when using a solar irradiance simulator.

40
References
Adsten M. (2002) Solar Thermal Collectors at High Latitudes – Design and Performance of Non‐Tracking Concentrators, Dissertation from the faculty of Science and Technology, Uppsala University Bales C., Persson T., Fiedler F., Perers B., Zinko H. (2012) Solar Heating Systems and Storage, Compendium, Solar Energy Research Center (SERC) Bernardo L.R., Davidsson H., Karlsson B. (2011a) Performance Evaluation of a High Solar Fraction CPC‐Collector System Bernardo L.R., Perers B., Håkansson H., Karlsson B. (2011b) Performance Evaluation of Low Concentrating Photovoltaic/Thermal Systems: A Case Study from Sweden, Solar Energy, 85, 1499‐1510 Bernardo R., Davidsson H., Gentile N., Gomes J., Gruffman C., Chea L., Mumba C., Karlsson B. (2013) Measurements of the Electrical Incidence Angle Modifiers (IAM) of an asymmetrical PV/T CPC‐Collector Diwan L. (2013) Study of Optimization in a Novel Asymmetric Photovoltaic/Thermal Hybrid Solar Collector, Master Thesis, Tecnico Lisboa Duffie J. & Beckman W. (2006) Solar Engineering of Thermal Processes, 3rd edition, John Wiley and Sons Dupeyrat P., Helmers H., Fortuin S., Kramer K. (2011) Recent advances in the development and testing of hybrid PV‐Thermal, Fraunhofer Institute for Solar Energy Systems ISE, Freiburg, Germany EN 12975 (2006) Thermal solar systems and components ‐ Solar collectors ‐ Part 2: Test methods. Brussels: European Committee for Standardization GUM (1995) Guide to the Expression of Uncertainty in Measurement (1995), ISO, Switzerland Haddi J. (2013) Thermal Evaluation of a Solarus PV‐T Collector, Master Thesis, Dalarna University, Borlänge, Sweden John R. Taylor (1997) An introduction to error analysis: the study of uncertainties in physical measurements. University Science Books, Sausalito, Calif, 2nd edition. ISBN 0935702423. Justin E. (2013) Performance Evaluation of Using Transparent or Reflective End Gables in a Low‐Concentrating PV/T Collector, Master Thesis, Dalarna University, Borlänge, Sweden Kaya M. (2013) Thermal and electrical performance evaluation of PV/T collectors in UAE, Master Thesis, KTH University, Stockholm, Sweden

41
Kovacs P. (2012) A guide to the standard EN 12975, Technical Research Institute of Sweden Mansi G., Sheth, Dr.P.K.Shah (2013) Design and development of compound parabolic concentrating solar collector with flat plate absorber, International Journal of Innovative Research in Science – Engineering and Technology, Vol.2, Issue 8 Micko M. (2012) Programming, Installation, and First Operation of a Test Rig for Solar Collector Evaluation, Bachelor Thesis, Dalarna University, Borlänge, Sweden Perers B., Fischer S., Berquist P., Müller‐Steinhagen H. (XXXX) Collector test method under quasi‐dynamic conditions according to the European Standard EN 12975‐2 Redpath, David A.G., Singh H., Tierney C., Christopher and Dalzell (2012) An Experimental Comparison of two Solar Photovoltaic‐ Thermal (PVT) Energy Conversion Systems for Production of Heat and Power. Energy and Power, 2 (4). pp. 46‐50. [Journal article] Rönnelid M., Karlsson B. (1996) Experimental investigation of the heat losses from low‐concentrating non‐imaging concentrators Winston R., Minano J.C. and Benitez P. (2005) Nonimaging Optics, Elsevier Academic Press, Burlington

42
Appendix
Part A: Solarus CPC‐T‐1500W Technical Specification

43
Part B: KBB Flat Plate Collector – Test report from TÜVRheinland

44

45
Part C: Solarus CPC‐T‐1500W – Test report and Solar Keymark Licence

46


![solar thermal pre-packaged systems€¦ · Launch of the system Collector type Collector sur-face [m2] 1 Absorber coating Collector war-ranty [years] Mounting system Pre-insulated](https://img.dokumen.tips/doc/110x75/60174fad5270e5116f7bd1f7/solar-thermal-pre-packaged-systems-launch-of-the-system-collector-type-collector.jpg)


![Build Your Own Flat Panel Solar Thermal Collector[1]](https://img.dokumen.tips/doc/110x75/552a6e354a79597b6d8b45e5/build-your-own-flat-panel-solar-thermal-collector1.jpg)
