Embed Size (px)
Citation preview

N A S A TECHNICAL NOTE
a:
TN_ -D-4112
THERMAL DESIGN VERIFICATION TESTING OF THE ANCHORED INTERPLANETARY MONITORING PLATFORM “D”
by Jere ?KMedlin, Jr.
Godddrd Spuce Flight Center Greenbelt, Md .
N A T I O N A L AERONAUTICS A N D SPACE A D M I N I S T R A T I O N W A S H I N G T O N , D. C. NOVEMBER 1967
https://ntrs.nasa.gov/search.jsp?R=19680000831 2018-09-01T08:20:24+00:00Z
TECH LIBRARY KAFB, NM
IlllllllllllIIIIIll1111111111lllll11ll111 0330985
NASA TN D-4112
THERMAL DESIGN VERIFICATION TESTING
OF THE ANCHORED INTERPLANETARY MONITORING PLATFORM "D"
By Jere W. Medlin, Jr.
Goddard Space Flight Center Greenbelt , Md.
NATIONAL AERONAUT ICs AND SPACE ADMINISTRATION
For sa le by the Clearinghouse for Federa l Scient i f ic and Technica l Information Springfield, V i rg in ia 22151 - CFSTl price $3.00

ABSTRACT
Major aspects of the thermal design performance test of the Anchored Interplanetary Monitoring Platform (AIEJIP-"D"-Lunar Orbiting) a re presented herein. The severity of the test and the accuracy of the thermal predictions during the initial test phases a re significant items. The test verified the assumptions made for the thermal model with minor exceptions. Thermal design was verified and the spacecraft successfully survived the 6.8-hour shadow simulation with only one experiment problem. Orbital thermal predictions and results a r e also presented. The orbital temperatures were generally within predicted values for most items with the exception of the solar paddles. The thermal test program was a success in closelyduplicating the orbital thermal environment and in developing an excellent spacecraft thermal design. After completion of this report, orbital thermal data was received which exceeded predicted temperatures. Retro-motor exhaust contamination of the spacecraft top cover was determined by the thermal design engineer to be the cause of the thermal extremes.
ii

CONTENTS
Abstract ......................................... INTRODUCTION ................................... TEST OBJECTIVES ................................. TEST DESIGN .....................................
Selection of Test Conditions ......................... Simulation Rationale ..............................
THERMAL DESIGN AND PREDICTIONS . . . . . . . . . . . . . . . . . . . DESCRIPTION OF TEST FACILITY ......................
Solar Simulation Source ........................... Spacecraft Positioner ............................. Vacuum Chamber ................................
DISCUSSION OF SOLAR SIMULATION TEST ERRORS . . . . . . . . . TEST RESULTS ...................................
Launch Profile Test Phases ......................... Thermal Design Test Phases ........................ Test Result Synopsis .............................
TEST CONCLUSIONS ................................ ORBITAL DATA ................................... ORBITAL DATA CONCLUSIONS ........................ OVERALL CONCLUSIONS............................. ACKNOWLEDGMENT ................................ References .......................................
ii
1
2
2
2 3
6
7
7 7 8
9
10
10 10 18
20
20
21
23
23
23
iii

THERMAL DESIGN VERIFICATION TESTING OF THE ANCHORED INTERPLANETARY MONITORING PLATFORM "D"
bY J e r e W. Medlin, Jr.
Goddard Space Flight Center
INTRODUCTION
Lunar orbi--.ig spacecraft without attitude or orbit control systems pose severe requ,,-ements on passively controlled thermal designs. A spacecraft with an eccentric lunar orbit must be designed to survive long shadows (i.e., 6.8 hours) yet be capable of withstanding lunar inputs of near 100 Btu/hr f t 2 for circular lunar orbits at altitudes of 200 nautical miles (Reference 1).
Selection of the final thermal coating patterns for the Anchored Interplanetary Monitoring Platform (AIMP) 'D" were the result of at least four solar simulation tests. Two of these involved the thermal model and the later two were conducted on the prototype spacecraft.
This report illustrates a thermal test program which is significant in the wide range of thermal levels to which the 206-pound spacecraft was exposed and in the close correlation between predicted, test, and orbital temperatures. The test program was conducted on the Prototype AIMP '?)"
Spacecraft in March 1966 at the Test and Evaluation Division of Goddard Space Flight Center. The
~ 109.330"
1- 54.665 '' 0" SOLAR ASPECT
ANGLE DIRECTION 1m
44
GSFC FLUXGATE MAGNETOMETER
L*5a Figure 1 -AIMP-D spacecraft side view.
1
I.___ - -.-- .-- -_-.. . .. .... ..- .... . . . . . ... . . ..... . . ~ ___ .....

I I I 1 l l l l 1 l 1 1 l 1 l l 1 I
spacecraft was launched on 1July, 1966 under the designation of Explorer 33 and has been performing satisfactorily both thermally and electronically since launch (as of September 5, 1966).*
TEST OBJECTIVES
1. To ascertain the validity of the thermal predictions for the following situations:
a. 150-degree solar aspect angle. 100-percent sun condition - maximum thermal condition
b. 90-degree solar aspect angle. 18.3-percent shadow condition - A nominal-minimum thermal condition.
c. 6.8-hour shadow - A survival condition.
2. To determine if the electronic components can survive the thermal conditions experienced in a 6.8-hour shadow.
3. To demonstrate battery operation through the 2.4-hour shadows in the nominal-minimum thermal condition.
4. To verify the thermal coating physical compatability on the spacecraft.
5. By accomplishing the above objectives to verify the thermal design.
6. To verify operation of the spacecraft optical aspect system rotating in the sun at 28 rpm, and various experiments that a r e solar-stimulated.
7. To simulate launch profile thermal conditions before spacecraft spin-up occurs by driving the non-spinning spacecraft to predicted coast period temperatures.
TEST DESIGN
Selection of Test Conditions
By means of the orbital possibility study mentioned in Reference 2, a maximum percent shade time orbit was selected along with a survival shadow condition which the spacecraft might encounter The thermal prediction program was utilized to select the maximum 100-percent sun aspect for the spacecraft and the minimum mission solar aspect angle, which was selected to be used for the maximum shadow time repetitive sun-shade orbit. The following test conditions exist:
1. 150-degree aspect - 100-percent sun stabilization.
2. 90-degree aspect - 18.3-percent shade orbit.
3. 135-degree aspect - 6.8-hour shadow survival.
*After completion of this report, orbital thermal data was received which exceeded predicted temperatures. Retro-motor exhaust contamination of the spacecraft top cover was determined by the thermal design engineer to be the cause of the thermal extremes.
2

Simulation Rationale
Chamber Calibration
The chamber calibration was L e first step in the solar calibration procedure. . "black ball" the approximate size of the spacecraft made of thin shelled aluminum and painted with high-absorptivity black paint was mounted in the chamber at the spacecraft attachment point. Centered inside the large sphere and thermally isolated from it, a small thin-shelled black integrating sphere with a thermocouple attached was used to measure the integrated temperature of the sphere.
The effective sink temperature of the chamber was found by allowing the black ball to stabilize under liquid nitrogen chamber wall conditions and no solar input, but with all in-chamber equipment operating (Le., gimbal heaters, "Zero-Q Interface," etc.)
The integf-ating sphere stabilized at -150°C. This became the effective sink temperature to be used in the solar calibration calculations.
Determination of Carbon Arc Intensity
The initial step in determining irradiation parameters of the carbon arc simulator was to find out how the spectrum of the zoom-lens carbon-arc solar-simulator compared with the solar spectrum. A plot of the two spectra is given in Figure 2.
.Since differences were noted in the two spectrums, the next step was to investigate the variations in spacecraft thermal coating absorptivities with wave length for the spacecraft thermal coatings. The TiO, Methyl Silicone White Paint was found to have a highly variable absorptivity depending on the spectrum.
The next task was to find the effective absorptivity for each spacecraft thermal coating in the solar spectrum and the test carbon arc spectrum. This was done with the aid of absorptivityversus-wavelength curves for each coating, utilizing the spectrum evaluation computer program.
The theoretical absorbed radiation could now be calculated for the test. The composite a/� of the spacecraft could now be calculated for both the solar and test carbon arc spectrum utilizing Table 1 and the following equations:
3

225 .;::! I ,,I
50
25 ._._...___..__.---r I ----.
I I I I2 . 0 2.1 2.2 2 .3 2 .4 2 .5
WAVELENGTH (microns)
Figure 2-Spectrum evaluation computer program.
Table 1
Spacecraft Thermal Coating Data.
Spacecraft Surface
Top skin
Top thermal shield
Side skin
Lower deck
Lower cone
Spring seat cover
Top center tube extension
Lower center tube extension
:Total
4
2

where
A = ratio of the total counting area to the exposed area,
a = absorptivity, and
E = emissivity.
The intensity level for the test can now be calculated in the following manner:
Although the previous method of intensity determination was planned to be used, actual intensity plots with the a rc showed a variation of intensity with depth of field of 0.31 solar constants in 14 inches (half the spacecraft depth at the 90-degree aspect). This w a s due to the 11- to 13-degree collimation half angle of the beam.
This facility limitation forced a limit on the intensity no greater than 1.1 solar constants on the forward edge of the spacecraft and acceptance of the average that resulted. Fortunately, since the solar paddles were not on the spacecraft to shade it, the resulting calibration came very close to the orbital effective solar input.
After the desired beam settings were achieved, subject to the limitation mentioned above, a solar input calibration w a s made in the chamber. The black sphere mentioned previously was used as the thermal input standard. The purpose of this was to allow the sphere to detect any extraneous energy inputs from the chamber under solar simulation - which a radiometer would not see.
The center temperature of the sphere came within 1°C of the calculated stabilization temperature of the sphere, using the solar input as measured by the radiometer. The calculation was made with the following equation:
I Aa a = u A E E (Tg4e,, - T.&k) ,
where
I = carbon arc intensity as measured by the radiometer,
A, = absorbing area of the ball,
5

a = absorptivity of the coating on the ball,
u = Stefan-Boltzmann constant,
A, = emitting area of the ball,
E = emissivity,
T,,, = the center ball temperature,
TSi, = the effective sink temperature of the chamber.
Thus, the radiometer solar input meas
2127-2210 urement was confirmed by the black sphere . . . . test; no in-chamber sun-on extraneous energy
- . . . . . - I . _ _ n . . m . . was detected. Radiometer plots were used in the test for solar input measurements.
3- 19-66
In addition to the above solar input meas1 : :;; urements, the spacecraft solar cell experiment
. . .
. . .
. . . .
. . . .
mounted on the side of the spacecraft was a useful instrument in detecting the incident solar energy on the side of the spacecraft. The solar cell experiment was used not as an absolute measuring device but as an indicator to establish the variation of solar energy with rotation angle that the side of the spacecraft experienced.
Beam half angles of 11 and 13 degrees were
Figure 3-Uniformity plot - 150-degree aspect. used during the test phases, and the radiation measuring device used for the in-test intensity
plots was an Epply pyrheliometer. Intensity was sampled on a 2.5-inch point-to-point grid for determination of the solar input. A sample uniformity plot with the spacecraft outlined in the beam is shown in Figure 3.
Lunar Input Consideration
No lunar emitted energy input to the spacecraft was simulated, because of the 1000 kilometer perilune elliptical lunar orbit.
THERMAL DESIGN AND PREDICTIONS
The spacecraft thermal model was composed of approximately fifty thermal nodes. The nodes in general represented points in the center of spacecraft sub-volumes; rather than specific spacecraft components. Thus an exact point prediction and test comparison were not possible.
6

The lower shelf of the spacecraft was designed as a heat sink and allhigh power dissipation cards were mounted to it. The dissipated power of the spacecraft was in the 20-watt range and power-off to power-on gradients were 20 to 25°C. Thus electrical power dissipation had an appreciable effect on spacecraft temperature.
Chamber predictions were made (assuming no heat loss or gain through the mounting interface, no solar paddle, boom, or retro-motor shadowing) utilizing the effective sink temperature. Solar constant values were obtained by radiometer plots at various distances conforming to the front and r ea r edge of the spacecraft as exposed to carbon arc illumination.
These values were area-weighted averaged for various spacecraft sections to determine the integrated value of the solar constant to be used in making the thermal predictions.
DESCRIPTION OF TEST FACILITY
Solar Simulation Source
The Genarco Carbon Arc used for the solar simulation source has the following characteristics:
Uniformitg *8 percent
Maximum beam diameter (at 7-1/2 feet) 48 inches
Collimation half-angle for test 11to 13 -degrees
Intensity adjustment method Zoom lens
Power
Operation
Positive rod
Negative rod
Spectrum
400 ampere 72 volts
Continuous feed
24-hour replacement
Figure 4-Solar simulation test fac i l i ty . See Figure 3
Figure 4 illustrates -e carbon-arc in-test position.
Spacecraft Positioner
The gimbal used to mount the spacecraft has the following characteristics:
Slip rings
Number of coaxial rings 4
7

Number of regular rings
Maximum current capability
Rotational speed
Interface
Stepping switch (Thermal sensor monitoring system)
Thermal control
In test
Post tes t
Mobiliw
144
5 amperes
Up to 30 RPM
Zero heat transfer by insulators and an automatic heater circuit
34 positions
Liquid nitrogen coils
Strip heaters
6-wheeled track-mountedFigure 5-AIMP-D spacecraft - T50-degree
asoect as test mounted.
Wacuum Chamber
Figure 5 illustrates the positioner.
The test chamber used for this test has the following characteristics:
Working volume:
Diameter
Length
Shroud
Quartz port diameter
Feed-through ports
Ultimate vacuum (with spacecraft)
Vacuum pumps
Mechanical pump
DifEusion pump
Figure 4 illustrates the chamber.
7 f t
8 f t
Finned tube Liquid nitrogen
12 ins.
3
6 X 10⁻⁸ Torr.
300 cfm
32,000 liters/sec
8

DISCUSSION OF SOLAR SIMULATION TEST ERRORS
E r r o r s result from the lack of a true space environment, namely, the absence of a true sun source, the absence of a 4°Kheat sink, and shape factors and mounting considerations (Reference 3). These e r ro r s in simulation manifest themselves in test temperatures which differ slightly from the orbital temperatures achieved in a true space environment.
An attempt wil l be made to qualitatively identify and evaluate the possible e r ror sources. These sources and their applicability to this test are:
1. Extraneous thermal radiation from uncooled ports test support hardware and walls at a finite temperature. This effect was measured utilizing the "black ball" mentioned previously in the discussion of solar calibration. It was found that the effective sink temperature of the chamber without solar input was -150°C instead of the -196" liquid nitrogen temperature. This amounts to an input of 4 Btu/hr or a 3°C e r r o r when solar inputs of 0.84 are being measured. Using this sink temperature during solar calibration, the test temperature came within 1°C of the calculated temperature of the black ball; therefore it was concluded that no extraneous energy was present as a result of solar heating.
2. Spectral mismatch. As shown by the carbon a rc spectrum in Figure 2, the spectral match (Genarco Carbon Arc v s Johnson Curve) was very close. A spectrum evaluation computer program was utilized to compare the spectrally integrated value of the absorptivity of white paint in the Genarco Carbon Arc Spectrum to the integrated solar absorptivity as defined by the Johnson Curve. The white paint was found to exhibit an absorptivity of 0.363 in the Genarco spectrum, as compared with an absorptivity of 0.375 in the solar spectrum.
3. Extraneous solar reflection from non-black walls. Absorptivity measurements on the Cat-a-lac Black painted walls were made and a value of 0.92 was measured. No extraneous energy (reflected or radiated) was detected by the "black sphere" used for solar calibration; however, the shape factor and the highly reflective buffed aluminum coating on the spacecraft constitute different conditions from those encountered in calibration. The change is believed to be small, however.
4. Non-uniform flux in the longitudinal direction. Due to the 11- to 13-degree collimation half-angle of the Genarco Arc a variation of intensity with distance was encountered on the spacecraft. Over a 14 inch depth on the spacecraft at the 150-degree aspect, a 0.31 solar constant variation was present. This variation in intensity with depth was established prior to test and was mathematically averaged to produce the integrated solar constant for the entire spacecraft. The solar-cell experiment on the side of the spacecraft also established the variation in intensity with distance and rotation angle.
5. Non-uniform flux in the lateral direction. The spacecraft rotation averaged the effect of local hot spots, so no e r ro r can be attributed to this during spacecraft rotation. It was noted that a maximum variation in nodal inputs of 0.073 solar constants was detected for
9

non-rotational cases. This e r ror was eliminated by supplying the specific thermal input to each node for computation of predicted temperatures.
6. De-collimation shadows. Rotation of the spacecraft averaged any shadowing that was present. Only in the 90-degree aspect was any significant shadowing present, occurring mainly on the lower cone structure as a result of the shadows cast by the vertical paddle-arm mounting brackets. Some very slight transient shadows were cast by the paddle-arm-tomount tie-downs, but rotation should have made the effect of these insignificant.
7. Thermal interaction between the spacecraft and the simulator. Since the maximum view factor between the single simulator port and the spacecraft is less than 0.025, the interaction between the spacecraft and the simulator is believed to be negligible.
TEST RESULTS
Launch Profile Test Phases
After achieving a high vacuum, and prior to reaching a cold space environmental temperature, thermal launch parameters were simulated; phase I of this test simulated fairing heating. The carbon arc was used to heat the spacecraft while rotating at the 90" aspect angle until the side cover temperatures approached the predicted values for fairing heating (+50 to +70"C).
Phase 11of this test simulated the non-spinning coast period occurring prior to spin-up and spacecraft ejection. The spacecraft was rotated until Facet "C" (location of skin thermal sensors) was toward the sun at the 90" aspect angle, and rotation was stopped. Next, the a rc was turned on the spacecraft, and the aspect angle was slowly changed according to the profile expected prior to ejection. Thus, the orientation was changed according to a programmed aspect angle change between 90" and 150" in 787 seconds. During this period the maximum temperature achieved on the side of Facet C was +57"C.
Phase 111consisted of despin squib firing immediately after Phase I1 with the squib near its predicted temperature at firing. The side of Facet C was +32"C when the despin squibs were fired.
Thermal Design Test Phases
150" Aspect. The 100% sun, 150" aspect angle represents the condition for which the thermal input to the spacecraft is at a maximum. The spacecraft stabilized at this condition after approximately 12 hours exposure to solar simulation. The integrated average solar input used for predicted temperatures was 0.87 solar constant with 1.07 solar constant input to the forward edge of the spacecraft deck and 0.79 solar constant input at the rear edge of the spacecraft. Thus, a variation of 0.28 solar constant in 23-1/2 inches was a test limitation because of the beam divergence.
Figure 6 illustrates the test temperatures and the thermal predictions at 150" aspect stabilization. In general, test predictions compare very closely with actual test temperatures. This is also shown by Thermal Profile No. 1in Figure 7.
10

PREDICTED TEMPERATURES BASED ON : CODE: a WHITE PAINT = 0.363 * PREDICTED TEMPERATURES a BUFFED ALUMINUM = 0.15 * * TEST TEMPERATURES a BLACK PAINT = 0.95
/ TOP THERMAL SHIELD
COVER, OVER
Figure 6-AIMP-D spacecraft - 150' aspect 100% sun stabilization data.
In summary, correlation of predicted versus test temperatures is excellent for the 150" aspect condition. A photograph of the spacecraft at the 150" aspect is shown as Figure 5.
90" Aspect. The 90" aspect test condition of 10.7 hours of sun and 2.4 hours of shadow repre__ sents a condition at the coldest expected aspect angle for the largest percentage of shadow in an orbit that is possible at that aspect angle.
The cycle profile (Figure 8) illustrates the actual cycle run. A facility malfunction forced termination of the final 10.7-hour sun phase, but the spacecraft was considered stable after two orbits (the thermal predictions confirm this also); hence, a valid se t of temperatures in this orbit were achieved. It is noteworthy that the spacecraft did not go into undervoltage as a result of the battery temperatures achieved in these 2.4-hour shadows. (An accidental undervoltage condition was triggered by the integration team on the last shadow, 25 minutes before the completion of the 2.4-hour shadow.)
The integrated average solar input used for thermal predictions was 0.9 solar constant with 1.15 solar constant on the side face of a facet, and 0.84 solar constant at the midplane of the spacecraft (approximate shadow entry point). Thus, a variation of 0.25 solar constant in 13-1/2 inches was present during this test phase.
11

--
b-INTERNAL TEMPERATURES 2 ; : SKIN TEMPERATURES+
THERMAL PROFILE NO. 1
0 PROTOTYPE TEST DATA
0 TEST PREDICTION DATA 0 >
tJ350c X FLIGHT SPACECRAFT 340 c ORBITAL DATA
El El
0 El
0 0 B
0
0 - 10 150" solar aspect angle data t
k--INTERNAL TEMPERATURES
t ~ 1 : SKIN TEMPERATURES+PERFORMANCE PARAMETERS+
X THERMAL PROFILE NO. 2
0 - 15 7 90' solor aspect angle data t
(Test values a t end of a 10.7 hour sun period during the 81.7% sun orbit)
Figure 7-Thermal prof i le Nos. 1 and 2.
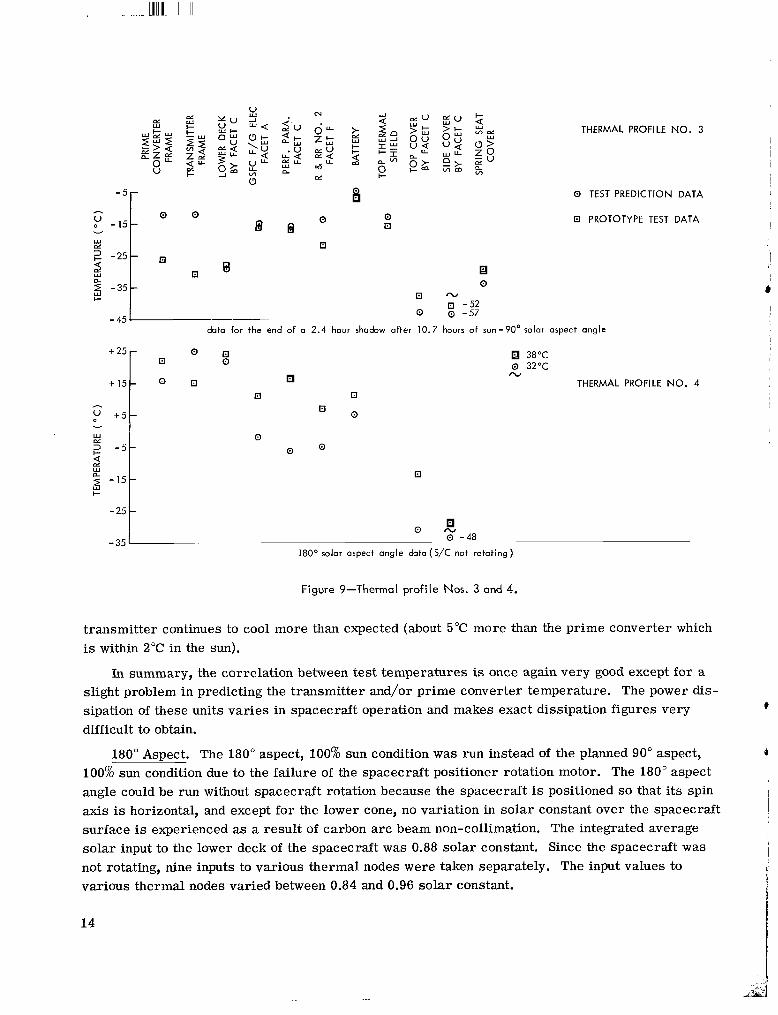
Thermalprofile No. 3 in Figure 9 illustrates the test temperatures and the thermal predictions for the end of a 10.7-hour sun period in an 81.7% sun orbit. Again, the test temperatures compare very closely with the predicted values. The prime converter temperature is also of interest, since it now runs warmer than the transmitter. As an item of interest, plotted in thermal profile No. 2 of Figure 7 are 90" aspect orbital temperatures versus test temperatures. This is, however, a comparison of the flight spacecraft to the prototype spacecraft which we tested. In summary, correlation of test temperatures versus predicted values is excellent for the 90" aspect, 10.7-hour sun condition in an 81.7% sun orbit.
Figure 9 illustrates the test temperatures and the thermal predictions for the end of a 2.4hour shadow in an 81.7% sun orbit. The mid-facet, battery, lower deck, skin, spring seat, and top shield temperatures compare well with the predicted values. The prime converter and transmitter frame temperatures a re appreciably below their predicted values. This is believed to be due to the large effect power dissipation has on the temperature of these units and the fact that an accidental spacecraft turn-off occurred 25 minutes before the end of the last 2.4-hour shadow. However, the
12
1.111111111 I.IIIIIIII.IIIIIII11111111 1 1 1 111 I I I I1 I I I111 I IrI I I 111 II

2
d
m
-.T - IIi I1 i
3IIIi
c :
"V I 20
+ l o hy 0 v
w -10w
5 -20-Y
4 -30-Y
-50 I
'-2.4 HOUR SHADOW^ -2.4 HOUR S H A D O W 4I 3 30
0 B 84 v) 4
v)
4 Z
I-= 2 v)
l o N
Figure 8-AIMP-D spacecraft - 90" aspect 10.7 hour sun - 2.4 hour shade cycle plots.
.. .....!!.11l1ll1l I I1
-T 0 0 TEST PREDICTION DATA
0 0 El PROTOTYPE TEST DATAB e 0
0 E l
m -52-35t O 0 -57
data for the end of a 2.4 hour shadow after 10.7 hours of sun-90' solar aspect angle
38°C 0 32°C
THERMAL PROFILE NO. 4 m El
El
-25LNO -35 0 -48 _ _ 180° solar aspect angle data(S/C not rotating)
Figure 9-Thermal profile Nos. 3 and 4.
transmitter continues to cool more than expected (about 5°C more than the prime converter which is within 2°C in the sun).
In summary, the correlation between test temperatures is once again very good except for a slight problem in predicting the transmitter and/or prime converter temperature. The power dissipation of these units varies in spacecraft operation and makes exact dissipation figures very difficult to obtain.
180" Aspect. The 180" aspect, 100% sun condition was run instead of the planned 90" aspect, 100% sun condition due to the failure of the spacecraft positioner rotation motor. The 180" aspect angle could be run without spacecraft rotation because the spacecraft is positioned so that its spin axis is horizontal, and except for the lower cone, no variation in solar constant over the spacecraft surface is experienced as a result of carbon arc beam non-collimation. The integrated average solar input to the lower deck of the spacecraft was 0.88 solar constant. Since the spacecraft was not rotating, nine inputs to various thermal nodes were taken separately. The input values to various thermal nodes varied between 0.84 and 0.96 solar constant.
14

THERMAL PROFILE NO. 5
I 0 PROTOTYPE TEST DATA
t
II
!
0 0 TEST PREDICTED DATA0 - 3 2 " C
0- 19 OC 'L- - 4 5 [
Y -55 El 0 'L 0
v 0 0 0 8u 0 0
0 02 -75
I- 8
-85 ' 0 2-91.c 6.8 hour shadow data
THERMAL PROFILE NO. 6
c 3 2 Ot24 'L
'L -50 0- 54 %-68
turn-on data 5 hrs, 42 min after shadow exit
Figure 10-Thermal profile Nos. 5 and 6.
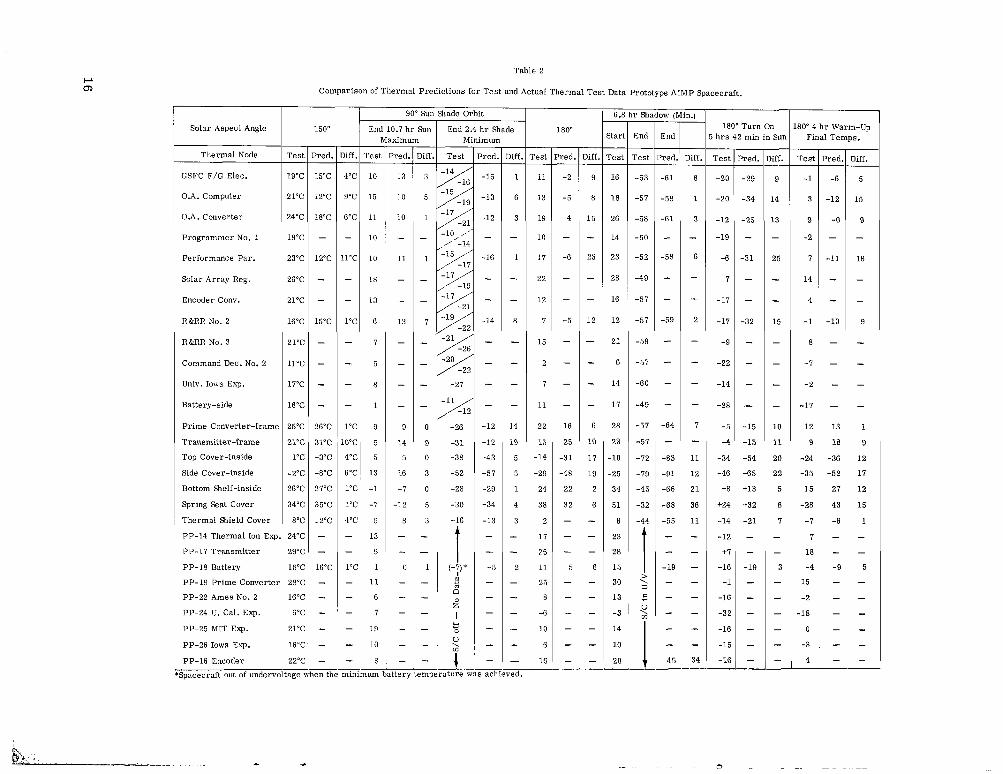
Table 2 and Thermal Profile No. 4 in Figure 9 illustrate the test temperatures and the thermal predictions for the 180" aspect. Comparison of the predicted temperatures with the test temperatures becomes very difficult at this aspect angle. In general, internal facet temperatures a re 10"to 15°C warmer than predicted temperatures. Skin temperatures a r e higher than predicted on the side and top faces which a re in shadow. These skin temperatures indicate excellent conduction of heat from the bottom deck to the top cover where zero conduction was assumed in making the thermal predictions. The battery temperature ran 6°C above its prediction, and in contrast the lower deck temperature ran only 2°C above predictions, but this temperature is probably subject to question because the exact input at that point is not subjected to the thermal averaging due to rotation.
In summary, test temperatures did not agree with predicted values at the 180" aspect. The solar input was more accurately known at this aspect, since no variation in intensity was present on the spacecraft, so the suspected cause of the non-correlation is a further ultraviolet degradation and corresponding increase to the absorptivity of the white paint on the spacecraft.
15
I
U
m
---- ----
Table 2
-- - - - - - - - - - ---Therma l Node
GSFC F/G Elec.
Tes t-19°C
'red.-15°C
#iff.-4°C
'est-10
r e d-13
Tes t 'red,--x -15
'est-11
'est-16
'est--53
r e d--6 1
Tes t--20
'red.--29
Tes t--1
'red.--6
)iff.
O.A. Computer 21°C 12°C 9°C 1s 10 z -13 13 18 -57 -58 -20 -34 3 -12
O A . Converter 24°C 18°C G T 11 10 -12 19 26 -58 -G1 -12 -25 9 -0
P rogrammer No. 1 19°C - - 10 - lo,,' -/ -14
10 14 -50 - -19 - -2 -
Performance Pa r .
Solar Ar ray Reg.
23°C
26°C
12°C
-1°C
-10
18
11
-x -16
x -17
22
23
28
-52
-49
-58
--6
7
-31
-
7
14
-11
-Encoder Conv.
R&RR No. 2
21°C
16°C
-15°C
-1°C
13
G
-
13
17/ -/ -21x -14
12
7
16
12
-57
-57
--59
-17
-17
-
-32
4
-1
--10
R&RR No. 3
Command Dee. No. 2
21°C
11°C
-
---
7
S
-
-Y-5 -75 -
15
2
21
6
-59
-57
--
-9
-22
--
8
-7
-
-
Univ. Iowa Exp. 17°C - - 8 - -27 - 7 14 -GO - -14 - -2 -Battery-side 16°C - - 1 - y 4 - 11 17 -49 - -28 - -17 -
Pr ime Converter-frame 25°C 26°C 1°C 9 9 -26 -12 22 28 -5 7 -64 -5 -15 12 13 -
Comparison of The rma l Predict ions for Tes t and Actual Thermal Tes t Data Prototype AIMP Spacecraft.
- - -90" Sun Shade Orbit 6 .t .sh; IW (1- - -
Solar Aspect Angle 150" End 10.7 h r Sun End 2.4 h r Shade 180' 180" Turn On 80" 4 h r Warm-Up Maximi Minimun t a r :nd End h r s 42 min in Sun Final Temps.
x
Transmit ter-frame 21°C 31°C 0°C 5 14 -31 -12 15 23 -57 -4 -15 9 18
Top Cover-inside 1°C -3°C 4°C 5 5 -38 -43 -14 .10 -72 -83 -34 -54 -24 -36
Side Cover-inside -2°C -8°C G T 13 16 -52 -57 -29 .25 -79 -91 -46 -68 -35 -52
Bottom Shelf-inside 26°C 27°C 1°C -1 -7 -28 -29 24 34 -45 -GG +8 +13 15 27
Spring Seat Cover 34°C 35°C 1°C -7 -12 -30 -34 38 51 -32 -68 +24 +32 -28 43
Thermal Shield Cover 8°C 12°C 4°C 5 8 -16 -13 2 G -55 -14 -21 -7 -6
PP-14 Thermal Ion Exp. 24°C - - 13 - 17 23 - -12 - 7 -PP-17 Transmi t t e r 29°C - - 9 t - 2s 28 - +I- 18 -PP-18 Battery 15°C 16°C 1°C 1 (-?* -5 11 15 -19 -16 -19 -4 -9
PP-19 P r ime Converter 28°C - - 11 * - 25 30 - -1 - 15 0"
PP-22 Ames No. 2 16°C - -i:
- 8 13 - -16 - -2 -PP-24 U. CaI. Exp. 6°C - - 7 I - -G -3 \ - -32 - -18 -PP-25 MIT Exp. 21°C - - 19 z - 10 14 - -16 - 0 -PP-26 Iowa Exp. 16°C' - - 10 u - 6 10 - -1: - -3 > PP-16 Encoder 22°C - - 8 4 - 16 20 i 45 --16 -- 4 -
*Spacecraft out of undervoltage when the minimum t e r y temperature was ach red.-
When the test was finished, inspection of the spacecraft revealed that due to the bearing failure of the gimbal rotation motor, oil had been deposited in spots over the top shelf. Some evidence of oil was also seen on the edges of the white paint under the transmitter facet. This oil would tend to increase the emissivity of the paints which was not the case in the 180" aspect, 100% sun stabilization when the spacecraft ran 10" to 15°C warmer than predicted, o r in the 6.8-hour shadow when test values generally did not reach predicted values. The oil may have been deposited after the test was completed when the motor was tried again. The increase in the absorptivity of the white paint due to extensive exposure to ultraviolet light is still the suspect reason why the spacecraft ran warmer than predicted values at the 180" aspect angle.
Pseudo 135" Aspect (180" Actual) and 6.8-Hour Shadow. The expected aspect angle at which the spacecraft might encounter the long shadow of 6.8 hours (which has only some 2% probability of occurring) was the 135" aspect angle. Due to loss of spacecraft rotational capability, the spacecraft was maintained at the 180" aspect and was driven to the 135" aspect predicted temperatures. The spacecraft battery was the primary control thermal node for this cperation, and when it reached the 135" aspect predicted value, the 6.8-hour shadow was begun.
The spacecraft operated 2.5 hours before going into under-voltage, and because of an inhibit circuit problem, no automatic turn-on was achieved coming out of the shadow. Manual turn-on was executed successfully 5 hours and 42 minutes after emergence from the 6.8 hour shadow. Improper readouts were obtained from the MIT experiment, but it was concluded by the spacecraft checkout personnel that the incorrect readouts were due to noise. However, the unit later malfunctioned after the test. Since this represents a survival condition for the spacecraft only, shadow survival w a s excellent.
Table 2 illustrates the spacecraft temperatures at the time of :hadow entry. Since the spacecraft was in a transient state, the predictions a re only of limited use because they a re based on a steady state condition. It must be remembered that no pre-test solar calibration was completed for this condition since it was a deviation from the test plan due to the failure of the gimbal rotation motor.
Comparison of the test versus predicted temperatures shows that the bottom spring seat, the lower deck, the upper thermal shield cover, and the internal battery temperatures compare favorably. However, the predictions for the centers of the various facets a r e low by 9" to 22°C. The test temperatures of the side and top cover a r e much warmer than the predicted values which were based on the assumption that there would be no conduction from the deck to the cover. This was not the case.
Once again it is believed that the absorptivity of the paint increased above original values because of long term ultraviolet degradation, and more heat was absorbed than predicted. The absorptivity for the buffed aluminum was increased to 0.22 instead of the previously used 0.15 for the pre-shadow predictions, but this still could not account for all the absorbed heat. Because the side and top cover temperatures ran higher, it is believed to only have had a second order effect (conduction versus radiation) on the internal facet temperatures.
17
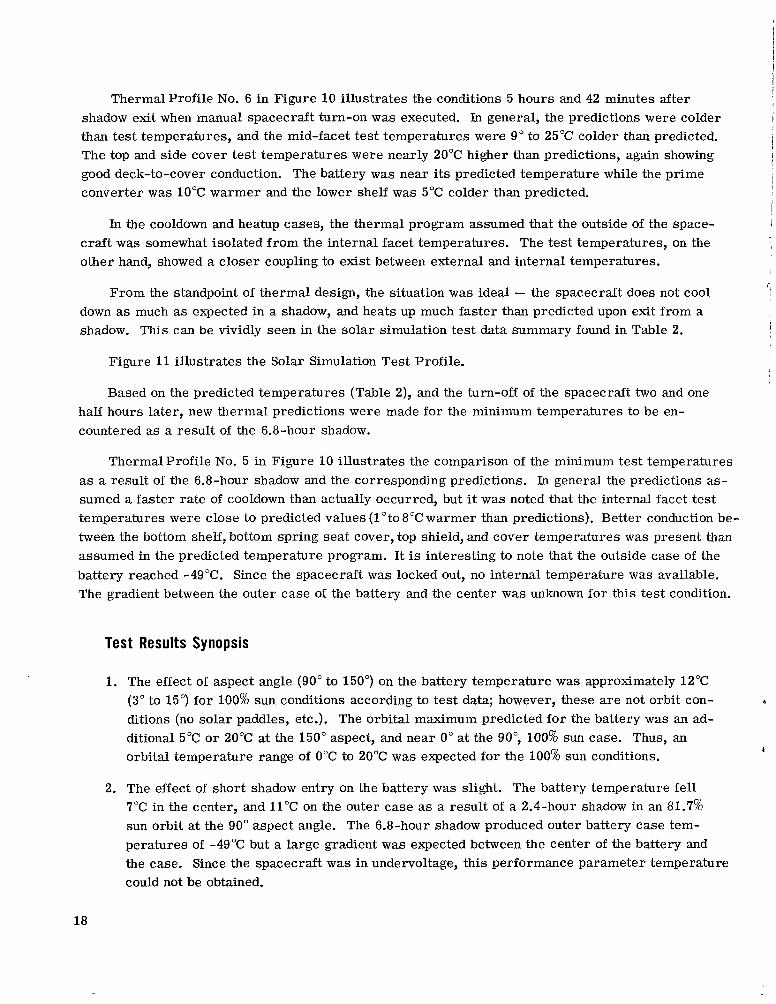
Thermalprofile No. 6 in Figure 10 illustrates the conditions 5 hours and 42 minutes after shadow exit when manual spacecraft turn-on was executed. In general, the predictions were colder than test temperatures, and the mid-facet test temperatures were 9" to 25°C colder than predicted. The top and side cover test temperatures were nearly 20°C higher than predictions, again showing good deck-to-cover conduction. The battery was near its predicted temperature while the prime converter was 10°C warmer and the lower shelf was 5°C colder than predicted.
In the cooldown and heatup cases, the thermal program assumed that the outside of the spacecraft was somewhat isolated from the internal facet temperatures. The test temperatures, on the other hand, showed a closer coupling to exist between external and internal temperatures.
From the standpoint of thermal design, the situation was ideal - the spacecraft does not cool down as much as expected in a shadow, and heats up much faster than predicted upon exit from a shadow. This can be vividly seen in the solar simulation test data summary found in Table 2.
Figure 11illustrates the Solar Simulation Test Profile.
Based on the predicted temperatures (Table 2), and the turn-off of the spacecraft two and one half hours later, new thermal predictions were made for the minimum temperatures to be encountered as a result of the 6.8-hour shadow.
Thermalprofile No. 5 in Figure 10 illustrates the comparison of the minimum test temperatures as a result of the 6.8-hour shadow and the corresponding predictions. In general the predictions assumed a faster rate of cooldown than actually occurred, but it was noted that the internal facet test temperatures were close to predicted values (1"to8°C warmer than predictions). Better conduction between the bottom shelf, bottom spring seat cover, top shield, and cover temperatures was present than assumed in the predicted temperature program. It is interesting to note that the outside case of the battery reached -49°C. Since the spacecraft was locked out, no internal temperature was available. The gradient between the outer case of the battery and the center was unknown for this test condition.
Test Results Synopsis
1. The effect of aspect angle (90" to 150") on the battery temperature was approximately 12°C (3" to 15") for 100% sun conditions according to test data; however, these a re not orbit conditions (no solar paddles, etc.). The orbital maximum predicted for the battery was an additional 5°C or 20°C at the 150" aspect, and near 0" at the 90°, 100%sun case. Thus, an orbital temperature range of 0°C to 20°C was expected for the 100% sun conditions.
2. The effect of short shadow entry on the battery was slight. The battery temperature fell 7°C in the center, and 11°C on the outer case as a result of a 2.4-hour shadow in an 81.7% sun orbit at the 90" aspect angle. The 6.8-hour shadow produced outer battery case temperatures of -49°C but a large gradient was expected between the center of the battery and the case. Since the spacecraft was in undervoltage, this performance parameter temperature could not be obtained.
18

c
0 Y w
2t4~rv) in
- 60 I I I 1 0 24 48 72 96
TIME (HRS. )
ON
'Ic MANUAL S/C TURN-ON
OFF
ASPECT
I
19
120
3. The spacecraft skins (spring seat cover, top shield, and outer cover) are thermally coupled to the spacecraft structure to a greater degree than the thermal program assumed.
4. The effect of the 90" aspect 2.4-hour shadow on the average facet temperature was approximately 28°C. The effect of the 6.8-hour shadow from near 135" aspect conditions was a drop of approximately 70°C in the average facet temperature. The variation in the average facet temperature between the maximum and minimum 100% sun aspect was 10°C.
5. The spacecraft survived the 6.8-hour shadow with the possible exception of the MIT experiment which malfunctioned later, and required the replacement of a modulator.
TEST CONCLUSIONS
Based on the test results, the following conclusions were reached:
1. The solar simulation test verified the assumptions made for the thermal model with the following exceptions :
a. Better thermal coupling existed between the external skins, and the spacecraft internal units than the thermal model assumed.
b. No definite conclusion was reached on the lack of correlation at the 180" aspect nonrotating test condition.
2. The thermal design for the spacecraft was excellent, and was designed to run near +25"C as a maximum temperature in orbit, and even if paint degradation or maximum lunar emitted energy raised this temperature a predicted 1O"C, the design was still satisfactory. The spacecraft also runs at high enough temperatures during the 2.4-hour shadow (81.7% sun) orbit to allow the battery to carry the spacecraft load without going into undervoltage.
3. The spacecraft functioned under all expected space conditions with the possible exception of malfunctioning in the MIT experiment upon encounter of a 6.8-hour shadow, since it malfunctioned shortly after the test.
ORBITAL DATA
Flight thermal information since the 1July launch is illustrated on Figures 12 through 22* which also show the flight thermal predictions (as of 5 September 1966).
*These thermal predictions are the work of the GSFC Thermal Systems Branch, and the thermal design engineer.
20

1
E -10 LL
' 0 PREDICTED DATA I I
0 30 60 90 120 150 180
-60 I ? SUN ANGLE (degrees)
0 30 60 90 100 129 150 180 SUN ANGLE (degrees) Figure 15-Battery orbital thermal performance.
Figure 12-Solar cel I experiment orbital thermaI performance.
0 ORBITAL DATA 2 -20 0 PREDICTED DATA
I " , , , " " ,5
PRBITALIDATA 1 2 -20
PREDICTED DATA
I , , I 30 60 90 120 150 180
0 ORBITAL DATA t SUN ANGLE ( degrees)
PREDICTED DATA c -30 I I I I I
0 30 60 90 120 150 180 Figure 16-Prime converter orbital thermal performance.
SUN ANGLE (degrees)
Figure 13-Thermal ion experiment orbital thermal performance. - n L
b
0 PERDICTED DATA I I I I I I 1 1-+ -30. 1 I I I I 0 15 30 45 60 75 90 105 120 135 150 165 180
0 30 60 90 120 150 180 SUN ANGLE (degrees) SUN ANGLE (degrees)
Figure 17-Paddle temperatures IMP-D & E Figure 14-Transmitter orbital thermal performance. orbital thermal performance.
ORBITAL DATA CONCLUSIONS
In general all internal spacecraft temperatures were within the thermal prediction range except the MIT Experiment which consistantly ran near 8°C over the maximum O L / E predictions. This was probably due to the large sensor opening on the side of the spacecraft.
The spacecraft battery ran slightly colder than predictions near the 90" aspect angle and appeared strange since minimum solar paddle power and maximum battery usage with the resultant
21

ll11111l llllll I I I I1
I I I I I I 0 30 60 90 120 150 180
SUN ANGLE (degrees)
Figure 18-AMES experiment orbital thermal performance.
SUN ANGLE (DEGREES)
Figure 19-GSFC MAG flipper orbital therma I performance.
5°C internal power dissipation should have occurred here. The battery later climbed above the maximum U / E predictions (at the 64" aspect angle). Conduction changes were suspected as the suspected reason for wide variation in ther
mal behavior.
The solar paddle predictions did not agree with orbital data, but i t was noted that an
0 PREDICTED DATA Y
I- -301 I I I I I 0 30 60 90 120 150 180
SUN ANGLE (degrees)
Figure 20-university of California experiment orbital thermal performance.
0 ORBITAL DATA PREDICTED DATA
0 30 60 90 120 150 180
SUN ANGLE (degrees)
Figure 21 -MIT experiment orbital thermal performance.
0 ORBITAL DATA ' 0 PREDICTED DATA
I- -300 I I I I I 30 60 90 120 150 180
SUN ANGLE (degrees)
Figure 22-SUI experiment orbital thermal performance.
i
i '1
i
e r ro r in the thermal predictions was believed to be the cause. This lack of correlation might have been discovered if the paddles could have been tested on the spacecraft.
The Goddard Boom Mounted Magnetometer temperature ran appreciably above the minimum C L / E predictions for the unit. Thermal coating peeling and fiberglass cover distortion with a similar unit were discovered in a solar test on this component.
In summary internal spacecraft temperatures were generally within the thermal prediction range and the solar paddles were the only items showing no correlation to thermal predictions.
22

OVERALL CONCLUSIONS
1. The spacecraft thermal test results closely duplicated orbital thermal results (as of September 5, 1966).*
2. The lack of correlation between solar paddle predictions, and orbital results could have been discovered if a facility had been available to test the spacecraft with the paddles attached.
3. The thermal test program was a success.
ACKNOWLEDGMENT
We wish to express our gratitude for the vital part played in the thermal design test by Stanford Ollendorf of Goddard Space Flight Center. The thermal predictions for the test, the thermal coating data, and the solar input integration over the spacecraft surface and the orbital predictions were also completed by Stanford Ollendorf.
Gratitude is also expressed to Mr. Neil Zylich for developing the Spectrum Evaluation Computer Program which allowed us to obtain an integrated value of absorptivity for white paint in our carbon a rc spectrum.
Again gratitude is expressed for the orbital data furnished by the AIMP Project Staff.
Goddard Space Flight Center National Aeronautics and Space Administration
Greenbelt, Maryland, October 31, 1966 861-21-26-01-51
REFERENCES
1. Candell, L. M., "Incident Lunar Emission on Orbiting Surfaces," AIAA Paper No. 64-336. Presented June 29-July 2, 1964, Washington, D. C.
2. Groves, R. T., "AIMP Lunar Orbit Lifetime and Shadow Monte Carlo Results with Variable Fourth Stage Firing Times," NASA Goddard Space Flight Center, Greenbelt, Maryland, August 1965.
3. Bobco, R. D. and Ishimoto T., "Temperature Er ro r s in Simple Systems Caused by Deviations from Ideal Space Solar Simulation,'' IES-ASIM International Symposium on Solar Radiation Simulation, Los Angeles, California, January 18-20, 1965.
'After completion of this report, orbital thermal data was received which exceeded predicted temperatures. Retro-motor exhaust contamination of the spacecraft top cover was determined by the thermal design engineer to be the cause of the thermal extremes.
NASA-Langley, 1967 -33 23

"The aeronautical and space activities of the United States shall be conducted so as to contribute . . . to the expansion of human knowledge of phenomena in the atmosphere and space. The Admihistration shall provide for the widest practicable and appropriate dissemination of information concerning its activities and the results thereof ."
-NATIONAL AER0NAUnC.S AND SPACE ACT OF 1958
NASA SCIENTIFIC AND TECHNICAL PUBLICATIONS
TECHNICAL REPORTS: Scientific and technical information considered important, complete, and a lasting contribution to existing knowledge. '
TECHNICAL NOTES: Information less broad in. scope but nevertheless of importance as a conyribution to existing,knowlecge. .:., TECHNICAL MEMO&UMS: Informitioq receiving G t e d distribution because of prelimiriary data, security classification,or other &a&uns. CONTRACTOR REPORTS: Scientific and technical information generated under a NASA contract or grant and considered an important contribution to existing knowledge.
TECHNICAL TRANSLATIONS: Information published in a foreign language considered to merit NASA distribution in English.
SPECIAL PUBLICATIONS: Information derived from or of value to NASA activities. Publications include conference proceedings, monographs, data compilations, handbooks, sourcebooks, and special bibliographies.
TECHNOLOGY UTILIZATION PUBLICATIONS: Information on technology used by NASA that may be of particular interest in commercial and other non-aerospace applications. Publications include Tech Briefs, Technology Utilization Reports and Notes, and Technology Surveys.
Details on the availability o f these publications may be obtained from:
SCIENTIFIC AND TECHNICAL INFORMATION DIVISION
NATIONAL AERONAUTICS AND SPACE ADMINISTRATION
Washington, D.C. PO546