Embed Size (px)
Citation preview

49th International Conference on Environmental Systems ICES-2019-249 7-11 July 2019, Boston, Massachusetts
Copyright © 2019 California Institute of Technology. Government sponsorship acknowledged.
Thermal Design and Validation of Mars 2020 Gas Dust
Removal Tool (gDRT)
Edgardo Farias1, Elizabeth Jens2, Barry Nakazono3, Jason Kempenaar4, and Keith Novak5
Jet Propulsion Laboratory, California Institute of Technology, Pasadena CA, 91109
As part of the science goals for the planned Mars 2020 mission, two instruments, PIXL and
SHERLOC, intend to study the Mars surface at a close scale. These two instruments are
planned to be used on smooth rock surfaces that are free of dust and other particles. Such
surfaces are prepared by using a drill with an abrading drill bit; residual dust and particles
are then blown away using a compressed gas system—the Gas Dust Removal Tool (gDRT).
Early in the design process a risk of valve leakage below the vendor’s -20C rating was
identified. To mitigate this risk a parallel path was implemented: 1) qualify the valves to
operate at -135C, and 2) develop thermal control capability to elevated temperatures in case
qualification efforts are unsuccessful. While qualification efforts are ongoing, it is expected
that the valves will be qualified to an operating temperature of -135C. In the event that
qualification is not successful, thermal control has been realized via a thermally isolated valve
configuration and thermostatically controlled heaters. Thermal testing of gDRT has validated
this design and enabled thermal model correlation in order to provide more accurate survival
energy predictions. The resulting energy consumption for heating the valves at the Jezero
landing site represents a minimal impact to the Rover energy budget.
Nomenclature
∝ = solar absorptivity
AFT = Allowable Flight Temperature
CO2 = carbon dioxide
ε = IR emissivity
gDRT = gas Dust Removal Tool
GN2 = gaseous nitrogen
MSL = Mars Science Laboratory
Ω = Ohm, electrical resistance
PIXL = Planetary Instrument for X-ray Lithochemistry
PRT = Platinum Resistance Thermometer
RTG = Radioisotope Thermoelectric Generator
SHERLOC = Scanning Habitable Environments with Raman and Luminescence for Organics and Chemicals
SLI = Single Layer Insulation
τ = tau, optical depth
WCC = Worst Case Cold
WCH = Worst Case Hot
1 Thermal Engineer, JPL, Instrument and Payload Thermal Engineering, 4800 Oak Grove Drive, Pasadena, CA 91109,
M/S 125-123. 2 Systems Engineer, JPL, Chemical Propulsion and Fluid Flight Systems, M/S 125-211. 3 Systems Engineer, JPL, Chemical Propulsion and Fluid Flight Systems, M/S 125-211. 4 Systems Engineer, JPL, Instrument and Payload Thermal Engineering, M/S 125-123. 5 Systems Engineer, JPL, Spacecraft Thermal Engineering, M/S 125-123.

International Conference on Environmental Systems
2
I. Introduction
ASA is currently developing the Mars 2020 Rover, which is scheduled to launch in the summer of 2020. The
design for this rover is based on the design of the MSL Curiosity Rover which has been operating on the surface
of Mars since 2012.1,2 The Mars 2020 Rover plans to carry with it a new suite of science instruments to investigate
the Martian landscape and environment. Two of these instruments are PIXL and SHERLOC, both of which intend to
study the Mars surface at a close range. PIXL and SHERLOC will study smooth rock surfaces, approximately 40mm
in diameter, prepared by the Coring Drill using an abrading drill bit. The abrading process, however, leaves residual
dust on the surface which would reduce the science output of PIXL and SHERLOC. Prior Mars surface missions have
used brushes to clear away dust. Brushes remove dust by generating air flow to suspend or entrain dust particles, but
this can be difficult to implement on Mars where the atmospheric density is low.3 The gDRT improves dust removal
capability by using a compressed gas system to puff dust away, thus improving PIXL and SHERLOC science
performance. The gDRT tool was a late addition to the Mars 2020 program and this late start mandated a simple and
low risk implementation utilizing existing components. In particular, commercial valves were selected that were only
rated to a -20C operating temperature by the manufacturer. Martian surface temperatures, however, can reach as low
as -105C within the Mars 2020 landing site envelope.4 A parallel approach was implemented to resolve this
temperature discrepancy: 1) qualify the valves to a lower temperatures, and 2) implement thermal control to keep the
valves at an elevated temperature. Qualification of the valves to a -135C operating temperature is currently ongoing
and is expected to be successful. In the event that low temperature qualification is not successful, thermal control of
the valves has been designed, implemented, and validated.
II. Hardware Overview
The gDRT, PIXL, SHERLOC, and the Corer collectively form the Turret Assembly which is located at the end of
the 5 degree of freedom Robotic Arm at the front the Rover, shown in Figure 1. The Robotic Arm is responsible for
accurately positioning the Corer onto a surface of interest in order to perform an abrading operation. The Turret then
rotates to position the gDRT above the abraded surface. The gDRT performs three gas puffs per abraded surface to
remove dust, with each puff releasing approximately 0.138g GN2. Finally, the Turret rotates to enable science
observations from PIXL and/or SHERLOC. An overview of the gDRT hardware is shown in Figure 2, and the
mechanical design is shown in Figure 3.
The gDRT is comprised of:
One supply tank filled with an initial GN2 load of 159g
One small plenum tank that is filled prior to each gDRT operation
Two redundant supply valves to transfer gas from the supply tank to the plenum tank
A single run valve that releases the gas from the plenum tank
A nozzle that accelerates and directs the released gas towards the surface of interest
A fill-and-drain valve for loading and off-loading gas into the supply tank prior to launch
A pressure transducer to read the supply tank pressure
N
Figure 1. Mars 2020 Rover design, with gDRT pointed out within the Turret Assembly

International Conference on Environmental Systems
3
Thermal hardware on the gDRT includes:
Two PRTs to measure supply tank temperature
Two Kapton patch heaters to provide heating capability on the supply valves and run valve
One mechanical thermostat to control the heaters, with set point of -64.5C to -75C
An SLI blanket enclosure to surround the valves, providing a CO2 gas-gap for insulation5
III. Valve Qualification to -135C
The gDRT run and supply valves are commercially sourced components that have only been qualified to a -20C
minimum temperature by the vendor. Using the valves below this temperature poses a risk of gas leaking through the
solenoid valve seats. In order to use these valves on Mars, where minimum environment temperatures reach -105C, a
parallel approach was implemented: 1) qualify the valves to -135C, and 2) implement the capability for survival
heating in case qualification to -135C is not successful. Early characterization and risk reduction testing with the
valves -135C showed no reduction in valve performance and no gas leakage was observed. These results raised
confidence that the valves could be qualified to -135C. The positive results from risk reduction testing also enabled
selection of survival heating thermostat set points below the vendor’s -20C rating. A thermostat set point of -64.5C to
Figure 2. Hardware overview for the gDRT
Figure 3. Mechanical design of the gDRT
Supply Tank
Pressure
Transducer
Run and
Supply Valves
Plenum
Tank
Nozzle
SLI
Enclosure
Baseplate

International Conference on Environmental Systems
4
-75C was ultimately selected based off gas leakage risk versus energy consumption to maintain the valves above
various temperature points. Qualification of the valves to -135C is ongoing, and it is expected that this qualification
program will be successful. Valve survival heating would not be required during flight if the valves are successfully
qualified to -135C; heating would only be used in the event that gas leakage is detected. If qualification to -135C is
not successful then the survival heating will be used in flight and the valves will be qualified to a -75C AFT. There is
no plan to heat the valves to the vendor’s -20C minimum temperature, though the heaters have been sized to
accommodate heating to -20C if necessary.
IV. Thermal Design
During non-operating conditions the gDRT is passively maintained within the AFT range of -128C to +50C via
appropriate use of thermo-optical coatings for each surface. The thermo-optical coatings for the gDRT are shown in
Figure 4. Black Kapton tape is used on the exterior surfaces of the supply tank and the SLI enclosure in order to reduce
the maximum daytime temperatures when the hardware is receiving a direct solar flux. Black Kapton has a lower ∝/ε
ratio than a bare metal surface: 𝛼
𝜀≈ 1.1 for black Kapton vs
𝛼
𝜀≈ 5.0 for bare metal surfaces. Lower
𝛼
𝜀 ratios can be
achieved with white paint or silverized Teflon tape (𝛼
𝜀< 0.5), but these options were not feasible for gDRT: handling
constraints of the fracture-sensitive supply tank made painting higher risk than taping, and glint requirements
prevented use of reflective silverized Teflon tape on hardware within view of the Rover’s numerous cameras and
sensors. As the Mars 2020 mission progresses it is expected that dust will accumulate on the hardware. The Martian
dust particle size is such that it alters hardware surface solar absorptivity, but leaves IR emissivity unchanged. The
solar absorptivity of Martian dust is approximately ∝ ≈ 0.7. As most of the external gDRT surfaces are Black Kapton
with ∝ = 0.92, as dust accumulates the net absorptivity will decrease. A decrease in effective absorptivity results in a
decrease 𝛼
𝜀 ratio, and the hardware will see reduced maximum temperatures under solar loading. Bare metal surfaces
will see an increased 𝛼
𝜀, resulting in increased maximum temperatures under solar loading; however this only effects
mechanical structure which does not have a max AFT, and the fill and drain valve which has significant margin to the
max AFT of 50C.
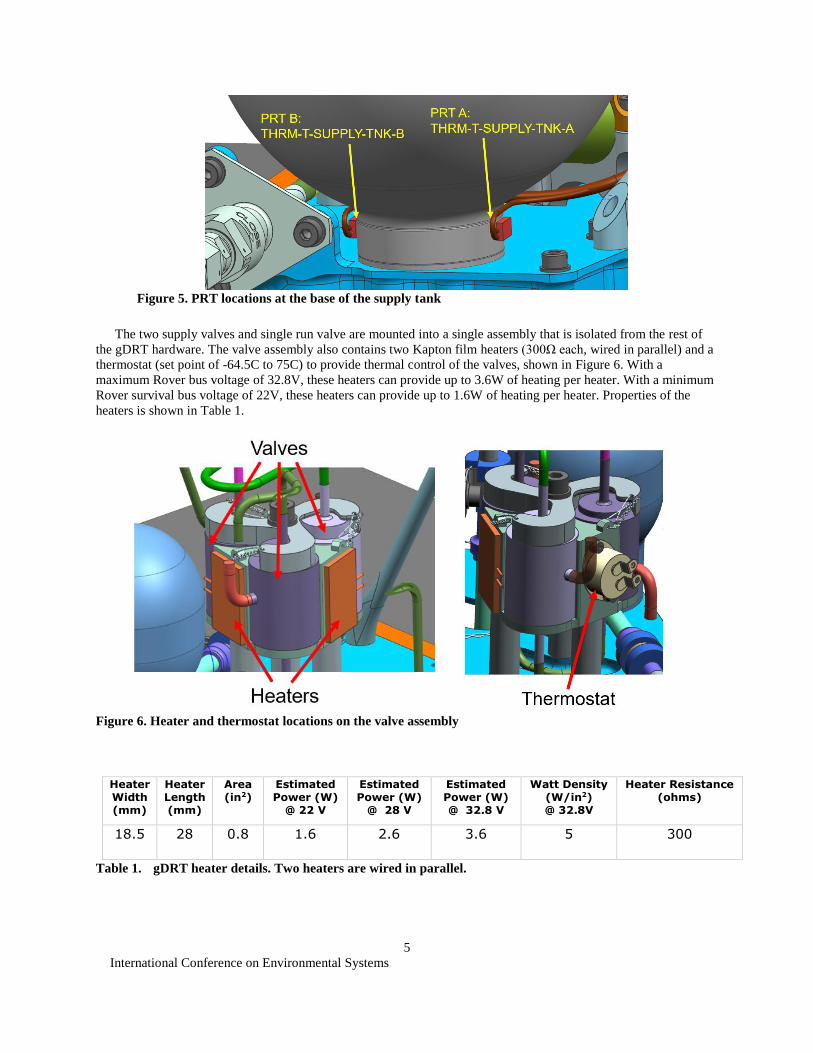
Two PRTs are located at the base of the supply tank, shown in Figure 5, in order approximate the temperature of
gas inside the supply tank. This temperature measurement, along with pressure measurements, will then be used in
estimating gas consumption. It is expected that the temperature of the two PRTs could differ in the daytime due to the
gDRT orientation with respect to the sun – if one PRT is illuminated by the sun it could read a higher temperature
than the shaded PRT. A smaller temperature difference between the PRTs is expected during the nighttime.
Figure 4. Thermo-optical coatings for the gDRT
International Conference on Environmental Systems
5
The two supply valves and single run valve are mounted into a single assembly that is isolated from the rest of
the gDRT hardware. The valve assembly also contains two Kapton film heaters (300Ω each, wired in parallel) and a
thermostat (set point of -64.5C to 75C) to provide thermal control of the valves, shown in Figure 6. With a
maximum Rover bus voltage of 32.8V, these heaters can provide up to 3.6W of heating per heater. With a minimum
Rover survival bus voltage of 22V, these heaters can provide up to 1.6W of heating per heater. Properties of the
heaters is shown in Table 1.
Figure 5. PRT locations at the base of the supply tank
Figure 6. Heater and thermostat locations on the valve assembly
Heater Width (mm)
Heater Length (mm)
Area (in2)
Estimated Power (W)
@ 22 V
Estimated Power (W)
@ 28 V
Estimated Power (W) @ 32.8 V
Watt Density (W/in2) @ 32.8V
Heater Resistance (ohms)
18.5 28 0.8 1.6 2.6 3.6 5 300
Table 1. gDRT heater details. Two heaters are wired in parallel.

International Conference on Environmental Systems
6
V. Valve Assembly Isolation
The valve assembly is kept thermally isolated from the rest of the gDRT hardware. The primary reason for doing
this is to minimize the heat loss from the valves to the Mars environment in order to minimize the energy needed to
keep the valves within the thermostat set points. The valve assembly is mounted to the gDRT baseplate via 3, 1” long
G-10 isolators and titanium bolts. The valve assembly is then enclosed by an SLI blanket which provides a nominal
1” thick CO2 gas-gap for insulation, blocks Martian wind forced convection, and blocks the view of the valves to the
cold sky during nighttime. This isolation scheme is shown in Figure 7, with all modes of heat loss from the valves
shown. Table 2 details the heat loss conductor values that were shown in Figure 7. The net conductors sum to 0.08W/C.
In the worst case condition of the SLI enclosure and gDRT baseplate being at -95C (the minimum environment
temperature at the Jezero landing site, described in Section VI), and the valves held at -69C (the average thermostat
set point), this results in an estimated 2.1W of heater power needed to maintain the valve temperature. This is well
within the design capability of 3.2W total heating at the Rover minimum survival bus voltage of 22V.
VI. Thermal Testing
Thermal testing was conducted on the Flight Unit gDRT. This test program included characterization of the thermal
control design, which exercised the thermostat and heaters at extreme environment temperatures. The gDRT unit under
test was instrumented with 14 Type-E thermocouples, 3 of which were placed on the valves, shown in Figure 8. This
testing was conducted in a thermal-vacuum chamber at 8±4 torr GN2 in order to emulate the Mars environment (note:
the Martian atmosphere is primarily CO2, but due to chamber capabilities only GN2 can be used at low temperatures).
The gDRT baseplate was temperature controlled to -135C via at heat exchanger, and the chamber shrouds were held
at -155C. In this configuration (and with a heater voltage of 23.8V), the predicted duty cycle on the thermostat and
Figure 7. Valve assembly heat loss paths. Conductor Values detailed in Table 2.
Conductor Value (W/C) Description
G1 0.0023 Radiation heat loss from valves (ε=0.1) to SLI enclosure
interior and baseplate (ε=0.1)
G2 0.0064 CO2 gas-gap, with a 1” nominal gap on all sides
G3 0.0143 Valve assembly through 3, 1” long titanium bolts and G-10
isolators
G4 0.0350 Conduction through cabling for thermostat, heaters, and valves
G5 0.0220 Conduction through steel tubes leaving the valve assembly
Net 0.08
Table 2. Valve Assembly heat loss conductor values
G1
G2
G5
G3 G4

International Conference on Environmental Systems
7
heaters was 55%. The as-tested duty cycle result was 61%. A duty cycle of 61% at a heater voltage of 23.8V
corresponds to an approximate average power dissipation of 2.3W. This test configuration was more conservative than
what would be experienced on the Martian surface:
GN2 was used instead of CO2 (GN2 has a higher thermal conductivity), resulting in increased heat loss
via the gas-gap to the SLI enclosure (G2 in Figure 7 and Table 2)
The baseplate was held at -135C, whereas the baseplate is not expected to go below -95C in flight
The thermocouples wires were a source of additional cabling heat loss (G4 in Figure 7 and Table 2)
The thermal model was correlated to the test data. Two changes were made to the valve thermal model: 1) reduced
the mass of valve assembly by 34% (as not all of the mass participates in the heating), and 2) increased heat loss via
the gas-gap by 20% (this reflects the as-built configuration with actual gas-gap dimensions). A temperature plot of
thermal test results and correlated model results is shown in Figure 9. The correlated model predicts the duty cycle
within 2%. Given the conservative nature of this test and with the heater duty cycle result of 61%, it is expected that
the thermal control of the valves will function as intended on the Martian surface and meet the JPL design guideline
of staying below 80% duty cycling on heaters.
Figure 8. Thermal test configuration: thermocouples on valves and vacuum chamber set up
Figure 9. Average valve temperature during the heater characterization portion of thermal testing
-130
-120
-110
-100
-90
-80
-70
-60
0 1 2 3 4 5 6 7 8
Tem
per
atu
re (
C)
Time (hr)
Thermal Test Results Correlated Model
Heater Duty Cycling:Test Results: 61%Correlated Model: 60%
Thermocouple
Valves underneath SLI enclosure

International Conference on Environmental Systems
8
The run and supply valves were exercised during the thermal test at the qualification temperatures of -135C and
+70C. As GN2 flows from the valves and out the nozzle, it is expected that the gas will expand and experience Joule-
Thomson cooling. The nozzle mass is approximately 14g, and the released gas is approximately 14g per puff. In a
very conservative calculation assuming the gas expands to 0K, the bulk temperature of nozzle cannot drop more than
roughly 2C per gas puff. During the thermal test it was observed that the nozzle dropped by about 1.1C over three gas
puffs, shown in Figure 10. The Martian atmosphere is primarily CO2 which undergoes deposition at -128C. With a
minimum atmosphere temperature of -90C at the Jezero landing site (described in the next section) Joule-Thomson
cooling will not result in CO2 ice plugs forming inside the nozzle; gas flow will proceed unobstructed.
VII. Mars Operation Analysis
At the start of the Mars 2020 program, the Level 1 requirement for landing site latitude range was from 30° South
to 30° North, with landing sites in the southern hemisphere having the more extreme temperatures (for both the cold
and hot conditions).1 In November 2018 NASA announced the Jezero landing site, located 18.4° North, as the official
Mars 2020 landing site.6 The thermal environment for the Jezero landing site, as well as the other landing sites that
were in consideration, was generated using a Global Climate Model.4 The diurnal temperature environment is detailed
in Figure 11 for the Worst Case Cold condition, and in Figure 12 for the Worst Case Hot condition. The air temperature
ranges from -88C to -28C in WCC, and from -78C to -9C in WCH. The ground temperature ranges from -90C to -7C
in WCC, and from -80C to +14C in WCH; though, local ground temperature can vary due to shading from the Rover
and from heat dissipation from the Rover RTG.7
The environments defined in Figure 11 and Figure 12 are used within a Thermal Desktop® model of the gDRT
and Turret. The temperature results from this simulation are shown in Figure 13. It is predicted that the thermal control
design will be able to maintain the valves within the desired set points during the cold periods of the sol in both WCC
and WCH. The performance of the heaters is detailed in Table 3. Energy consumption is predicted to be 0.4 W-hr in
WCH and 2.6 W-hr in WCC. The peak duty cycle is predicted to be 15%; this results in significant margin to the JPL
design guideline of < 80% duty cycling on heaters. The Rover has an overall energy budget of roughly 2400 W-hr per
sol. In the worst case, a 2.6 W-hr energy draw to keep the valves warm translates to 0.1% of the total energy budget;
this is a minimal impact to the operations planning of the Rover.8
Figure 10. Nozzle temperature during the valve operation portion of thermal testing. Effects of Joule-
Thomson cooling are observed.
-126.0
-125.5
-125.0
-124.5
-124.0
0 2 4 6 8 10 12 14
Tem
per
atu
re (
C)
Time (minutes)

International Conference on Environmental Systems
9
Figure 11. Jezero Landing Site Environment, WCC, 18.4N, Ls = 281°, albedo = 0.1773, τ = 0.2
0
100
200
300
400
500
600
-140
-120
-100
-80
-60
-40
-20
0
20
40
0 4 8 12 16 20 24
Sola
r Lo
ad (
W/m
2)
Tem
pe
ratu
re (
C)
Time (hr)
Ground Temperature Atmosphere Temperature Sky Temperature Total Ground Solar Load
Tground, max = -7C
Tground, min = -90C
Tatm, min = -88C
Tatm, max = -28C
Tsky, max = -111C
Tsky, min = -135C
Qsolar, max = 468 W/m2
Figure 12. Jezero Landing Site Environment, WCH, 18.4N, Ls = 179°, albedo = 0.1467, τ = 0.2
0
100
200
300
400
500
600
-140
-120
-100
-80
-60
-40
-20
0
20
40
0 4 8 12 16 20 24
Sola
r Lo
ad (
W/m
2)
Tem
pe
ratu
re (
C)
Time (hr)
Ground Temperature Atmosphere Temperature Sky Temperature Total Ground Solar Load
Tground, max = 14C
Tground, min = -80C
Tatm, min = -78C
Tatm, max = -9C
Tsky, max = -98C
Tsky, min = -125C
Qsolar, max = 563 W/m2

International Conference on Environmental Systems
10
VIII. Conclusion
Due to the late addition of the gDRT to the Mars 2020 program, a simple and low risk design utilizing existing
components was developed. The commercially sourced supply and run were only rated to -20C by the vendor. With
Martian temperature reaching well below this temperature, a parallel approach was implemented to address the
temperature discrepancy: 1) qualify the valves to be able to operate at lower temperatures, and 2) design thermal
control using Kapton patch heaters and a mechanical thermostat. The valve assembly is mounted to the gDRT
baseplate via G-10 isolators, and is fully enclosed in an SLI enclosure that provides a CO2 gas-gap for insulation. Two
patch heaters on the valve assembly are then thermostatically controlled to a set point of -64.5C to -75C. Conservative
thermal testing was conducted on the flight unit gDRT which resulted in a successful demonstration of the isolation
and heater design. The thermal design of gDRT has been validated and is ready to be used if valve qualification to
-135C is unsuccessful. Using the results from the thermal testing, the thermal model of the gDRT on Mars was updated
in order to run simulations for the Jezero landing site environments. Heater performance is bounded by the Worst
Case Cold condition, where it is predicted that the heaters will operate at a peak duty cycle of 15% during the night
time, and draw 2.6 W-hr of energy. The energy required to heat the valves represents 0.1% of the total Rover energy
budget, a minimal impact to Rover operations planning.
Figure 13. Valve temperature prediction for Jezero Landing Site in WCC and WCH environments
-80
-70
-60
-50
-40
-30
-20
-10
0
10
20
0 4 8 12 16 20 24
Tem
per
atu
re (
C)
Time (Mars hr)
Worst Case Cold Worst Case Hot
Jezero Environment Energy Consumption (W-hr) Peak Duty Cycle (%)
WCC 2.6 15
WCH 0.4 N/A Table 3. Predicted flight heater performance at the Mars 2020 Jezero landing site

International Conference on Environmental Systems
11
Acknowledgments
This research was carried out at the Jet Propulsion Laboratory, California Institute of Technology, under a contract
with the National Aeronautics and Space Administration. © 2019 California Institute of Technology. Government
sponsorship acknowledged.
References 1Novak, K., Kempenaar, J.G., Redmond, M., and Bhandari, P., “Preliminary Surface Thermal Design of the Mars 2020 Rover,”
45th International Conference on Environmental Systems, Bellevue, Washington, July 2015. 2Kempenaar, J.G., Novak, K., Redmond, M., Farias, E., Singh, K., and Wagner, M., “Detailed Surface Thermal Design of the
Mars 2020 Rover” 48th International Conference on Environmental Systems, Albuquerque, New Mexico, July 2018. 3Jens, E., Nakazono, B., Brockie, I., Vaughan, D., and Klatte, M., “Design, Development and Qualification of a Gas-Based
Durst Removal Tool for Mars Exploration Missions” 2018 IEEE Aerospace Conference, Big Sky, Montana, March 2018. 4Wagner, T., and Lange, R., “Mars 2020 Surface Mission Modeling: Landing Site Thermal Environment” 2018 IEEE
Aerospace Conference, Big Sky, Montana, March 2018. 5Bhandari, P., Karlmann, P., Anderson, K., and Novak, K., “CO2 Insulation for Thermal Control of the Mars Science
Laboratory” 41st International Conference on Environmental Systems, Portland, Oregon, July 2011. 6Brown, D., Wendel, J., and Agle, D.C., “NASA Announces Landing Site for Mars 2020 Rover” www.nasa.gov 7Farias, E., Redmond, M., Bhandari, P., Kempenaar, J.G., and Novak, K., “Thermal Modeling of Mars Ground for Surface
Missions” 47th International Conference on Environmental Systems, Charleston, South Carolina, July 2017. 8Novak, K., Redmond, M., Kempenaar, J.G., Farias, E., and Singh, K., “Thermal Operability Improvements for the Mars 2020
Rover Surface Mission” 48th International Conference on Environmental Systems, Albuquerque, New Mexico, July 2018.