Embed Size (px)
Citation preview

IOEAP-I3733 AEC RESEARCH AND DEVELOPMENT REPORT
SEPTEMBER 1971
THERMAL CON DUCTlVlTY
URANIUM-PLUTONIUM OXIDE R. A. LASKlEWlCZ 8. F. MELDE S. K. EVANS P. E. BOHABOY
U. S. ATOMIC ENERQY COMMISSION CONTRACT AT(04-3)-189 PROJECT AQREEMENT 10

DISCLAIMER
This report was prepared as an account of work sponsored by an agency of the United States Government. Neither the United States Government nor any agency Thereof, nor any of their employees, makes any warranty, express or implied, or assumes any legal liability or responsibility for the accuracy, completeness, or usefulness of any information, apparatus, product, or process disclosed, or represents that its use would not infringe privately owned rights. Reference herein to any specific commercial product, process, or service by trade name, trademark, manufacturer, or otherwise does not necessarily constitute or imply its endorsement, recommendation, or favoring by the United States Government or any agency thereof. The views and opinions of authors expressed herein do not necessarily state or reflect those of the United States Government or any agency thereof.

DISCLAIMER
Portions of this document may be illegible in electronic image products. Images are produced from the best available original document.

NUCLEAR 'ENERGY DIVISION GENERAL ELECTRIC COMPANY SAN JOSE, CALIFORNIA 95125
. APPLICABLE TO
PUBLICATION NO. GEAP-13733
T ~ T ~ E Thermal Conductivity Of
w u m - P l u t o n i u m Oxide
DATE , September 1971
' ERRATA And ' ADDEMOA S H hET
1 NO. I
DATE 3-2-72
NOTE Correct all copies of tbe applicable publication as specified below.
PAGE
INSTRUCTIONS
(CORRECTIONS AND ADDITIONS)
360.2 360.2 Change: to
(2.04 - 0/M)T3 (2.04 - 0/M)T2
(a) Add an asterisk next to the word Number, i.e., umber*
(b) For footnote explaining asterisk, add following sketch at bottom of Table:
"8.2 0 7
Run Number in Test
Pellet Number, 1 = Top, 2 = Middle, 3 = Bottom
Test Number (See Table 1, page 10)
ITEM
1.
2.
REFERENCES (SECTION. P A C E .
PARAGRAPH. LINE)
Section 7; Page 24; first line of equation ...
Table A-1, Page 29; Column 7 with heading reading Test Number
I I

GEAP-13733 AEC Research and
' Development Report September 1971 NOTICE--
This report was prepared as an account of work .
THERMAL CONDUCTIVITY OF URANIUM - PLUTONIUM OXIDE
sponsored by the -United States Government. Neither the United States nor.the United States Atomic Energy Commission, nor any of their employees, nor any of their contractors, subcontractors, or their employees, makes any warranty, express o r implied, o r assumes any legal liability or responsibility for the accuracy, com- pIeteness nr usefulness of any, information, apparatus, product or process disclosed,, or represents that its use would not infringe privately owned rights.
1
R. A. Laskiewicz S. K. Evans G. F. Melde
P. E. Bohaboy
i
I 1
; (
Approved: 5 G a E. A. Aitken, Manager
Plutonium Research
- 1 - J
Approved :
&ncipal Project Engineer
Approved : fl& F. E. Tippets, Acting Manager
Development Engineering
U. S. Atomic Energy Commission Contract No. AT(0A-3)-189 Project Agreement.No. 10
85-295-Dew. Eng.
EGO-1 0171
BREEDER REACTOR DEPARTMENT .GENERAL ELECTRIC COMPANY SUNNYVALE, CALIFORNIA 94086
GENERA^ @ ELECTRIC

. . I
NOTICE .. This report was prepared as an account of work sponsored by the'united States
Government. Neither the United States'nor the United States Atomic Energy Com- . '
mission, nor any .of their emp1oyees;nor Pny of their contractors, subcontractors, or their employees, makes any warranty, express or implied, or assurnes any legal liability or responsibility for the accuracy, completeness or usefulness of any infor- mation, apparatus, proc!uct or process disclosed, or 'represents that its use would. not infringe privately owned rights.

TABLE OF CONTENTS
Page
. . . . . . . . . . . . . . . . . . . . . . . . . . . . . . . . . . . . . . . . . . . Abstract 1
. . . . . . . . . . . . . . . . . . . . . . . . . . . . . . . . . . . . . . . 1 . Summary 1
2 . Introduction . . . . . . . . . . . . . . . . . . . . . . . . . . . . . . . . . . . . 2
3 . Priorwork . . . ; . . . . . . . . . . . . . . . . . . . . . . . . . . . . . . . . . . 2
. . . . . . . . . . . . . . . . . . . . . . . . . . . . . . . . . 4 . Experimental Design 4 . . . . . . . . . . . . . . . . . . . . . . . . . . . . . . . . . . . . . 4.1 Test Furnace 4
4.2 Specimen Preparation . . . . . . . . . . . . . . . . . . . . . . . . . . . . . . . 8 . . . . . . . . . . . . . . . . . . . . . . . . . . . . . . . . . . 4.3 Instrumentation 9
4.4 Experimental Procedure . . . . . . . . . . . . . . . . . . . . . . . . . . . . . . 9
. . . . . . . . . . . . . . . . . . . . . . . . . . . . . . . . . 5 . Results and Discussion 10 5.1 Effect of Stoichiometry and Composition on the Thermal Conductivity of Urania-Plutonia . . . . 10 5.2 Effect of Fabrication Procedure of the Thermal Conductivity of (U0.8P~0.2)02.x . . . . . . . 11 5.3 Effect of Density on the Thermal Conductivity of (U0.8P~0.2)02.x . . . . . . . . . . . . 11 5.4 Electrical Conductivity . . . . . . . . . . . . . . . . . . . . . . . . . . . . . . 11
. . . . . . . . . . . . . . . . . . . . . . . . . . . . . . . . . 5.5 Order-Disorder 14 5.6 Empirical Equation for the Thermal Conductivity ( U O . ~ P U O . ~ ) O ~ . ~ . . . . . . . . . . . . . 14 5.7 Microstructures of Tested Specimens . . . . . . . . . . . . . . . . . . . . . . . . . 14
. . . . . . . . . . . . . . . . . . . . . . . . . . . . . . . . . . . . 6 . Data Analysis 20 . . . . . . . . . . . . . . . . . . . . . . . . . . . . . . . . 6.1 Method o f ' ~ a t a Analysis' 20
. . . . . . . . . . . . . . . . . . . . . . . . . . . '6.2 Degree of Uncertainty in ~'esults 21
. . . . . . . . . . . . . . . . . . . . . . . . . . . . . . . . . . . . 7 . Conclusions 24
. . . . . . . . . . . . . . . . . . . . . . . . . . . . . . . . . . Acknowledgments 25
. . . . . . . . . . . . . . . . . . . . . . . . . . . . . . . . . . . . . References 25
APPENDIX
A . Data . . . . . . . . . . . . . . . . . . . . . . . . . . . . . . . . . . . . . . . . 27
. . . . . . . . . . . . . . . . . . . . . . . . . . . . . . . . . B- . Statlslical Analysis Rosults 53
. . . . . . . . . . . . . . . . . . . . . . . . . . . . . . . . . . . . . Distribution 73

Figure
1
Title Page
Comparison of Mixed Oxide Thermal Conductivity Data Versus Temperature for Several Experimenters . . . . . . . . . . . . . . . . . . . . . . . . . . . . . . 3
Schematic of Thermal Conductivity Apparatus . . . . . . . . . . . . . . . . . . . . 4
. . . . . . . . . . . . . . . . . . . . . . . . . . . . . Vacuum Furnace.Closed 5
Vacuum Furnace-Open . . . . . . . . . . . . . . . . . . . . . . . . . . . . . 6
. . . . . . . . . . . . . . . . . . . . . . . . . Vacuum Furnace Instrumentation 7
. . Experimental Arrangement . . . . . . . . . . . . . . . . . . . . . . . . . . . . . 8
Effect of Stoichiometry on Thermal Conductivity of (U0.8P~0.2)02.x . . . . . . . . . . 12
Effect of Composition on Thermal Conductivity of (UxPuy)02q . . . . . . . . . . . . . 12
Fabrication Effect on Thermal Conductivity of (U0.8 Pu0.2)01 -95 . . . . . . . . . . . . 13
. . . . . . . . . . . . ThermalConductivityofCoprecipitatedandPhysicallyMixedPellets 13
Effect of Density on Thermal Conductivity of (U0.8P~0.2)01 9 5 . . . . . . . . . . . . . 15
Thermal Conductivity of 91% Dense (U0.8P~0.2)02.00 Showing 90% Confidence Band and . . . . . . . . . . . . . a Few Selected Data Points with Experimental Uncertainty Bands 15
Effect of Stoichiometry on the Thermal Conductivity of 91% Dense (U0.8P~0.2)02.x . . . . . 16
. . . . . . . . . . . . . . . . Post-Test Microstructure of 84% Dense (U0.8P~0.2)0 3 5 17
. . . . . . . . . . . . . . . . Post-Test Microstructure of 94.6% Dense (U0.8P~0.2)01 95 18
Comparison of the Microstructures of Test Specimens Prepared as
(a) coprecipitated 87% dense (U0.8P~0.2)01 . 965 and . . . . . . . . . . . . . . (b) physically mixed 94.6% dense (U0.8P~0.2)01 . 95 18
Uncertainties in Heat Flux Measurements as a Function of Temperature . . . . . . . . . . 23
. . . . . . . . . . . . . . . . . . . . . . . . . . . . . . . . . Test 8 (Part I) 46
. . . . . . . . . . . . . . . . . . . . . . . . . . . . . . . . . Test 8 (Part 1) 46
. . . . . . . . . . . . . . . . . . . . . . . . . . . . . . . . . Test8(Partll) ; 47
. . . . . . . . . . . . . . . . . . . . . . . . . . . . . . . . . Test 8 (Part l I) 47
. . . . . . . . . . . . . . . . . . . . . . . . . . . . . . . . Test8(Partill) 48

. . . . . . . . . . I :
LIST OF ILLUSTRATIONS (Continued)
. . . . . . . . . Test 1 1 . . . . . . . . . : . . . . " . . . ; . .' . . . . . ' . . . . . . . . . . . . . 49
Test 11 . . . . . . . . . . . . . . . . . . . . . . . . . . . . . . . . . . . . . 49 5 .
Test 3 . . . . . . . . . . . . . . . . . . . . . . . . . . . . . . . . . . . , 5 0

LIST OF TABLES
Table
1
A- 1
Title Page
. . . . . . . . . . . . . . . . . . . . . . . . . . . . Summary of Test Parameters 10
. . . . . . . . . . . . . . . . . . . . . . . . . . . . . . . Test 8 (Part I ) Data 29
. . . . . . . . . . . . . . . . . . . . . . . . . . . . . . . . Test 8 (Part I) Data 30
. . . . . . . . . . . . . . . . . . . . . . . . . . . . . . Test 8 (Part II) Data 31
. . . . . . . . . . . . . . . . . . . . . . . . . . . . . . Test 8 (Part II) Data 32
. . . . . . . . . . . . . . . . . . . . . . . . . . . . . . Test 8 (Part l l I) Data 33
. . . . . . . . . . . . . . . . . . . . . . . . . . . . . . . . . Test 10 Data 35
. . . . . . . . . . . . . . . . . . . . . . . . . . . . . . . . . Test 11 Data 37
. . . . . . . . . . . . . . . . . . . . . . . . . . . . . . . . . . Test 11 Data 38
. . . . . . . . . . . . . . . . . . . . . . . . . . . . . . . . . Test 13 Data 39
. . . . . . . . . . . . . . . . . . . . . . . . . . . . . . . . . Test3Data 40
. . . . . . . . . . . . . . . . . . . . . . . . . . . . . . . . . Test 12 Data 41
\ . . . . . . . . . . . . . . . . . . . . . . . . . . . . . Test 7 and Test 13 Data 43

, . ABSTRACT
Out-of-pile ther~nal conductivity measurements were made on urania-plutonia fuel mixtures for varying fuel temperature, density, stoichiometry, composition and fabrication method. The measurements were made in a helium-6% hydrogen atmosphere uslng a radial heat flow technique. The empirical equation developed for the thermal conductivity of (U0,8P~0.2)02-x is:
1 + 0.5841 X 10⁻¹² T~ + 360.2 a + (0.9702'0.44650)~ (2.04 - O/M)T'
where
k = thermal conductivity (wattslcm-'C)
T = temperature (800-2300'~)
D = fractional density (0.84 - 0.91 )
O/M = stoichiometry (1.94 - 2.00)
Typical values for k on this curve (for D = 0.91. Pu/(U+Pu) = 0.2 and O/M = 2.00) are:
T (OC) k (Wlcm-OC)
800 0.031 8 1000 0.0266 1500 0.0224 2000 0.0231 2300 0.0248
The equation was obtained using a weighted non-linear regression analysis. Data above -1800'~ indicated that the thermal conductivity increased slightly above this temperature. The results are in good agreement with previously published data. Error analyses inherent in the regression technique used showed that the equation has 90% confidence .limits ,of f 11% which ,reflect. the experimental and curve fitting errors involved in i t s development.
1. SUMMARY
Out-of-pile thermal conductivity measurements were made on urania-plutonia fuel mixtures as a function of fuel temperature, density, stoichiometry, Composition and fabrication method. An empirical equation was developed for the thermal conductivity of UOz- 20% Pu02.
Using weighted, non-linear regression analyses, an empirical equation for the thermal conductivity of (Uo.8Pu0.2)02-~ was determined as a function of several variables. The equation is:
where k = thermol conductivity (watts/~rn-~c)
T = temperature (800 to 2300'~)
D = .fractional density (0.84 to 0.91 )
O/M = oxygenlmetal ratio (1 -94 to 2.00)
Stotistical analyses showed that this empirical equation had 90% confidence limits of * 11%. Measurements showed that the thermal conductivity increased sllghtly at ternporatures greater than about 1 8 0 0 ~ ~ . This result was included in the empirical equation and is largely accounted for by the T~ term of the equation.

The effect of density change on the thermal conductivity of mixed oxide fuel was found to be much less than in previous studies using stoichiometric uranium dioxide. The effects of varying density and plutonium composition were overshadowed by the effects of varying stoichiometry. The thermal conductivity was found to increase as the stoichiometry increased.
Fuel fabrication methods were found to have a negligible effect on the thermal conductivity. It was presumed, but not investigated here, that this would indeed be the case as long as the plutonia in the mixed oxide fuel remained well-distributed throughout the fuel lattice.
The application of the out-of-pile thermal conductivity data from this experiment to in-pile usage requires additional input from integral to melt thermal conductivity data to ensure that the required boundary conditions are fully met.
2. INTRODUCTION
One important parameter in determining the limiting power level for an oxide nuclear fuel element is the thermal conductivity of the fuel. In addition, the shape of the conductivity versus temperature curve is of importance in calculating the Doppler coefficient and transient behavior of fast flux, oxide-fueled reactors. Although several in-pile and out-of-pile investigations of thermal conductivity of stoichiometric and hyperstoichiometric uranium dioxide have been reported, relatively little work has been done with mixed uranium-plutonium oxide fuels.
In-pile conductivity data are complicated by the compound effect of fission product generation, fuel restructuring, and power cycling, as well as time and temperature. Some of these variables can be interpreted by out-of-pile measurements which provide the basis for a systematic evaluation of any existing trends.
t The use of plutonium-uranium oxides as fast ceramic reactor fuels requires a thorough understanding of the
' thermal behavior of the material. Due to the large temperature gradients that occur in the fuel during irradiation, a I ? ?
i ' variety of structures and compositions develops in the fuel matrix which affect both the physical and mechanical :.- , properties. Preferential migration of oxygen to the colder regions of the mixed oxide fuel has been observed out-of-pile.
In a similar manner the plutonium in mixed oxide fuels irradiated in a fast flux tend to migrate to the center of the
Y r
fuel. The occurrence of equiaxed and columnar grain growth also result in a variety of density and grain size regions. All of the above conditions produce a complex fuel matrix which can appreciably alter the heat transfer across the fuel pin.
The thermal conductivity data now available in the literature is not adequate to cover the various conditions and temperature ranges of concern fqund in irradiated fuel. Much of the current data available is in the form of thermal diffusivity measurements which require somewhat uncertain heat capacity data for conversion to actual thermal conductivity (wattslcm-'c) measu6ement.s.
The out-of-pile thermal conductivity study reported here was designed to yield data which will be directly applicable to realistic conditions.
This work was undertaken to obtain an equation for the thermal conductivity of 20% plutonium concentration (Pu-U)02 as a function of temperatures, fuel densities and composition which will be encountered in fast ceramic reactor fuels. Other fuel parameters such as oxygenlmetal (OIM) ratio and fuel powder preparation methods were also studied to investigate their effects on thermal conductivity. The thermal conductivity of stoichiometric U02 was also measured.
It is the purpose of this report to present these experimental results in graphical and tabular form, as well as obtaining a mathematical expression for the thermal conductivity of mixed oxide fuel based on out-of-pile measurements.
3. PRIOR WORK
The thermal conductivity characteristics of uranium dioxide have been extensively investigated both in- and out-of-pile, and the,results summarized by ~samoto.' However, relatively few investigations have studied the (Pu-U)02 system. Some of the early work has been summarized by ~ e t z l e r , ~ and more recent contributions have been made by him along with ~chmid t ,~ ~ i b b ~ : Van craeynestS and ail^.^ While these experimenters used three different experimental techniques to measure the thermal conductivity of mixed oxide fuel, their results are in reasonable
..agreerirent. As an example of comparison, the curves of thermal conductivity versus temperature for these recent experiments (for 96% T.D. and OIM ='2.00) are plotted in ~ i ~ u r e 1 along with the rebults of the measurements reported here for the same experimental conditions.

Figure I . Comparison of Mixed Oxide Thermal Conductivity Data Versus Temperature for Several Experimenters
- .U
O1 0.06-
E 5 . - 2 1 I- $. 0.04 0 . z 8 -1 a E g 0.02 I-
0
Additional thermal conductivity values were needed to supplement the information already available on mixed plutonium-uranium oxide fuels because of the following conditions:
1) A large portion of the data was developed from thermal diffusivity measurements. Since thermal conductivity values are calculated using estimated numbers for the specific heat of the material, there is some uncertainty in the conductivity values obtained.
2) Little data have been reported for temperatures greater than 1 9 0 0 ~ ~ . 3) The data on the effects of plutonium content and density are sparse and inconclusive. 4) While the role of stoichiometry in the thermal conductivity has been investigated by several authors?t3t'
inadequate control of the test atmospheres may well have resulted in O/M shifts during high temperature tests. In general these possible stoichiometry changes were not taken into account in the analysis of the earlier data.
The present out-of-pile thermal conductivity study f i l l s in thc oroas where data are needed and also serves as a check on the data already present in the literature.
It i s worthwhile to note that ~ a i l y ~ retained the same density correlation factor that was developed by ~samoto' for UOz; however, the thermal conductivity was presumed to be constant above 2 0 0 0 ~ ~ . Also, all data at high temperatures (> 2 0 0 0 ~ ~ ) i s subject to some speculation. The high temperature electrical conductivity of the fuel may be sufficiently large enough at high temperatures so that some joule heating occurs in the specimen itself rather than bcing confined to a tungsten rod which is used as a heat source by several experimenters. ~ i n s c o u ~ h ~ has shown that such power generation in the specimens will lend to anlflcally high valuos for the measured thermal conductivity. ~ i b b ~ ~ has eliminated this problem using his laser pulse technique; however, his results using the calculation of thermal diffusivity required knowing the fuel heat capacity (Cp) accurately. Calculations nf this latter quantity are subject to error. Gibby's studies used 95.5% dense, 25% PuOz coprecipitated fuel.
schmidt9, in a recent paper, asserts that the mechanisms of electronic and radiative heat transfer have only minor effects, if any, on the thermal conductivity of uranium dioxide. His analysis demonstrated that the specific heat of the fuel material was the predominant factor in determining the temperature dependence of the thermal conductivity of UQ, above 1 2 0 0 ~ ~ . He also determined that 2 0 5 0 ~ ~ is the limiting temperature above which the thermal conductivity of UOz begins to increase because the specific heat inoroases with temperature in this region. Several authors1 '1' ' 1'
have shown this trend of specific heat versus temperature for U02, Pu02 and mixed oxide fuels.
KEY
- 3. J. VAN CRAEYNEST(~ )
4. F. J. HETZLER(~)
5. W. E. B A I L Y ( ~ )
6. NEW GE DATA
-
6 2
-
4 5
I I 1 I I 1 0 400 800 1200 1600 2000 2400 2800
TEMPERATURE (OC)

4. EXPERIMENTAL DESIGN
4.1 TEST FURNACE Thermal conductivity measurements were carried out in a vacuum furnace modified to accommodate a radial heat
flow power generation apparatus. A schematic diagram of the furnace used for these experiments i s shown in Figure 2. Several modifications were
made to the standard frame in order to provide a viable experimental arrangement in an alpha enclosure. Electrodes were fitted through the top and bottom of the furnace casing so that the annular test pellets could be placed on a tungsten rod heated by means of the electrodes. Electrical contact between the tungsten rod and the bottom electrode was provided through a Ga-24.5% In eutetic liquid' metal pool. This eliminated any tungsten rod expansion problems. Legs were fastened to the bottom of the furnace to provide clearance and access under the furnace case. The furnace door was modified so that i t could be swung to the side of the furnace, providing improved access to the furnace interior through the alpha enclosure glove ports. Figures 3 through 5 show the furnace and i t s instrumentation.
General furnace heating was provided by tungsten mesh elements in the furnace case and on the furnace door. The pur(;ose of the tungsten mesh heaters was to control the outer surface temperature of the test specimens so that the AT could be adjusted to desired values. Large interlocking copper blades completed the electrical circuits when the door was closed.
Separate SCR linear power control supplies provided power to the tungsten mesh and rod heaters. The two heat sources could be controlled separately but operated simultaneously if desired.
The furnace door was supplied with a 2-inch by 114-inch s l i t (covered by a vycor window) for viewing the pellet column with minimum heat loss from the furnace.
FOR
3/16 TUNGSTEN ROD CENTRAL HEATER
APPROXIMATELY 9 inches LONG
.EXTERNALHEATER (TUNGSTEN BASKET)
6 inches OF EXTERNAL HEATER
' SLOT PROVl DED . IN AREAOF
BLACK BODY HOLES OPTICAL PYROMETRY
UPPER ELECTRODE
0.850 in. o. d. x 0.450 in. HEIGHT TEST SPECIMENS
BLACK BO'DY HOLES IN MIXED-OXIDE PELLETS F,OR OPTICAL PYROMETRY
LOWER ELECTRODE
INDIUM-GALLIUM ROD EXPANSION1 LOWER CONTACT
. .
Figure 2, Schematic of Thermal Conductivity Apparatus

Figure 3. Vacuum Furnace-Closed

NEGATIVE No. A 681234
71-3
Figure 4. Vacuum Furnace-Open

NEGATIVE No. A 681237 71-4
Finure 5. Vacuum Furnace lnstrumendetion

4.2 SPECIMEN PREPARATION Test pellets were fabricated to various stoichiometry, plutonium content, and density specifications. The majority
of the pellets were prepared from physically mixed Pu02 and U02 but a few were prepared from coprecipitated powder. Physically mixed U02-20% Pu02 was prepared by blending the proper amounts of U02 and Pu02 powders in a twin shell blender followed by hammermilling. U02-10% was prepared from U02-20% Pu02 by blending in additional U02. Coprecipitated U02-20% Pu02 and U02-30% Pu02 were prepared by precipitating the proper mixtures of uranyl nitrate and plutonium nitrate using the reverse strike method. The precipitates were washed and then calcined at 7 0 0 ' ~ in dry N2-6% H2 followed by ball-milling to obtain a sinterablepowder.
Fabrication procedures and quality control checks were used to promote a single-phase solid solution and protect against large inhomogeneities in the fuel matrix.
The experimental arrangement is illustrated in Figure 6. The stack of three pellets in each test usually contained two mixed oxide pellets and one uranium oxide pellet. Each pellet contained four black-body holes, and beginning with Test 8 (see Table I), the U02 pellet was the top pellet of the three test pellets in all but one test (Test 13). U02 insulator pellets were placed on both sides of the test pellets to complete the pellet stack.
Pellets 0.850 + 0.05 inch 0.d. and 0.450 + 0.05 inch in height were made by granulating the compacted powders through a coarse screen followed by cold pressing and sintering in dry N2-6% Hz at 1 6 5 0 ~ ~ to produce annular pellets with 84 to 97.6% T.D. and O/M = 1.95. The pellets were centerless ground to ensure that a right circular cylindrical shape was maintained. The central annuli were 0.200 inches in diameter so that the pellets could be stacked in a column on the 0.1875 inch diameter tungsten heater rod.* The pellets were slotted along a radius to prevent breakage from differential thermal expansion. Black-body holes 0.030 to 0.050 inches in diameter were drilled at 0.120,0.180,0.240, and 0.300 inch depths in each pellet. The holes had length to diameter (LID) ratios from 4 to 6.
* No provision was made to maintain concentricity of the annular pellets with respect to the tungsten heater rod. Electrical contact was possible and is considered in Section 5.4.
0.030 in. SLOT
TUNGSTEN HEATER
BLACK BODY HOLES
Figure 6. Experimental Arrangement

4.3 INSTRUMENTATION A Pyro disappearing filament dptical pyrometer was used to measure the black-body hole temperatures.
Pyrometer readings were standardized against tungsten/tungsten-26% rhenium thermocouples inserted into a cavity in the tes t pellet. Standardization measurements were carried out under isothermal conditions.' Optical pyrometer measurements.were limited to maximum temperatures of approximately 2200' to 2400 '~ because of fuel vaporization and the corresponding distortion of the black-body holes.
Total current through the: tungsten rod heater was measured with a Weston multirange ~mmeter (0 to 1 up to 0 to 50 amperes, + 114% accuracy) in series with a 24011 stepdown transformer.
4.4 EXPERIMENTAL PROCEDURE Three test pellets were positioned on the.tungsten heater rod with 7 U02 insulator pellets below and 6 U02
insulator pellets above them to minimize axial h,eat losses. The loaded rod was inserted into the furnace so that the bottom of the rod was suspended freely in the indium-gallium pool. The bottom insulator pellet rested on the ledge of the liquid metal pool. The three test pellets were positioned so that the black-body holes could be observed through the s l i t in the furnace door.
The furnace was evacuated to - lo - ' mm Hg and back filled with dry He+% H2 a minimum of three times to provide a low enough oxygen pressure so that it would be easily gettered by the hydrogen in the furnace atmosphere without significantly affecting the H201H2 ratio.
Thermal conductivity measurements were conducted by energizing the tungsten mesh and rod heaters simultaneously at zero power and slowly increasing both simultaneously until a temperature of approximately 8 0 0 ' ~ was observed at the pellet surface and the temperature difference between the deepest and most shallow black-body holes was about 200'~. The radial temperature difference in the test pellets was held to a maximum of 2 0 0 ' ~ and to a maximum of 5 0 ' ~ between adjacent black-body holes. This should have minimized any oxygen migration from the hotter to the cooler regions of the pellets. Further temperature increases were carried out using the mesh heater alone, so that the power input to the center of the pellet stack remained relatively constant. Steady-state was reached quite rapidly (within 10 minutes). Temperatures were measured with a disappearing filament micro-optical pyrometer focused on the bottoms of the four radial holes, drilled to different depths in the specimen. The entire set of black-body holes was measured in sequence; then the sequence was repeated at least four times. When five consecutive measurements of each black-body hole were within f 5 degrees, those five measurements were concluded to be at steady state. The next series of measurements was then made after increasing the furnace temperature. Current measurements are taken after each furnace temperature increase (see Section 6.1 ). , ,
Measurements for the urania-plutonia system encompassed the following conditions: densities of 84 to 97.6% T.D., O/M ratios of 1.94 to 2.00, plutonium contents of 0 to loo%, temperatures of 800 to -- 2300°C, and two fyel preparation methods-coprecipitation and physically-mixed. Only the 20% plutonium content data were ultimately used to develop the empirical equation.
Measurements at various stoichiometries were made by annealing the test pellets to obtain a stoichiometry of 1.940. The precise weight ot each pelleL was ,mcosurod a t this time. Thermal conductivity measurements were made from 800 to 2300°C while the test pellets were surrounded by a tantalum sleeve to retain the low stoichiometry. The pellets were then cooled and removed from the furnace for weighing. The pellets were then placed ayain in the furnace and annealed in dry He-6% H2 for twd hours at.1600'~ after which thermal conductivity measurements were again carried out from 800 to 2300'~. The weighing procedure was repeated and the pellets were annealed for two hours in He+% H2 to wh'ich a small amount of H20 was added. Thermal cond,uctivity measurements from 800 to 2300 '~ were repeated in this atmosphere.
The weighing procedure was again repeated and the pellets were annealed in He+% H2 saturated with room temperature H 2 0 for 2 hours at 1600'~. Thermal conductivity measurements were then carried out in this atmosphere from 800 to 2300°C. In this manner thermal conductivity measurements were made at stoichiometries of 1.940, 1.948, 1.980, and 2.00.
. The tes t parameters are summarized in Table 1.

Table 1 SUMMARY OF TEST PARAMETERS
Density Test Number of startinga Range Temperature
Number Pellets Material Wt % Pu O/M (% T.D.) Range (OC) Comments
Results Not Used Results Not Used
Results Not Used
Results Not Used
Column Too Short 100% uo2 One Pellet Was uozb
One Pellet Was U O ~
One Pellet Was U02 One Pellet Was ~0~ One Pellet Was U O ~ One Pellet Was U O ~ One pellet Wa? U O ~
(a) C = Coprecipitated powder, PM = physically-mixed powder '
(b) Ttie U02 pellet was 97..6% T.D. and OIM = 2.00
5. RESULTS AND DISCUSSION
Thermal conductivity measurements were carried out on specimens of urania-plutonia mixtures as functions of temperature, stoichiometry, density, composition and fabrication procedure. The results are discussed in terms of current theories on phonon transfer in solids. An empirical equation given in Section 7 was generated which described that part of the data which involved changes in microstructure, temperature and stoichiometry.
5.1 EFFECT OF STOICHIOMETRY AND COMPOSITION ON THE THERMAL CONDUCTIVITY OF URANIA-PLUTONIA The effects of stoichiometry on the thermal conductivity of physically blended U02-20% Pu02 are shown in
Figure 7. This experiment was conducted from 8 0 0 ' ~ to 2300°C on a single set of pellets by varying the oxygen activity in the furnace atmosphere in accordance with the experimental procedure discussed in Subsection4.4. Measurements were made a t stoichiometries varying from 1.94 to 2.00. The results exhibited the expected increase in thermal conductivity as the stoichiometry increases a t low temperatures. This is in accordance with the thermal diffusivity measurements of ~ i b b ~ ? and Van Craeynest and weilbacherS who found a monotonic increase in thermal diffusivity as the stoichiometric composition is approached.
The strong effect of stoichiometry on the thermal conductivity of the mixed oxide material is worthy of further comdent. At temperatures much greater than the Debye temperature, the thermal conductivity is largely dependent upoh the phonon mean free path length. As this path length is reduced, phonon scattering becomes more pronounced with a resulting decrease in thermal conductivity, following roughly a T-' dependence on the temperature. When the mean free path is reduced to interatomic distances, further reduction of path length has no effect and the thermal conductivity becomes temperature independent. This condition apparently exists in (U, P U ) ~ ~ . ~ at temperatures above about 1 4 0 0 ~ ~ as indicated by the data discussed here. Below this temperature, the thermal conductivity increases with decreasing temperature\ and i s also highly dependent upon impurity scattering centers such as oxygen vacancies. The stoichiometry and composition dependences in the thermal conductivity data indicate that the phonon mean free path is reduced to interatomic distances with only about 3% of the oxygen sub-lattice replaced by vacancies.

GEAP- 13733
As additional vacancies are introduced, either by lowering the oxygen activity or by increasing the plutonium content, the thermal conductivity does not continue to decrease. The constancy of the thermal conductivity for large oxygen vacancy concentrations also strongly supports the hypothesis that the substitution of plutonium for uranium does not alter the lattice vibrational spectrum significantly. That this is the case is illustrated in Figure 8 which exhibits the thermal conductivity as a function of composition for hypostoichiometric urania-plutonia of a constant oxygen-to-plutonium ratio. Experiments were performed on specimens of urania-plutonia with plutonium compositions of 10, 20, 30 and 100%. In each case the experiments were carried out in dry He-6% H2 so that conditions of constant oxygen-to-plutonium ratio prevailed at each tes t temperature. The oxygen-to-plutonium ratios varied from approximately 1.82 at 800°C to 1.65 at 2300°C, assuming that equilibrium with the furnace gas took place at each temperature during the test.
Corresponding O/M's varied (e.g., for constant 20% plutonium composition) from 1.96 at 800°C to 1.93 at 2300°C. ~ i b b y ~ has indicated that the addition of plutonium to the U02 lattice had virtually no effect on the thermal conductivity except where it altered the defect concentration in the oxygen sub-lattice. He has reported data on thermal diffusivity in urania-plutonia solutions as a function of plutonium content, and the relatively small effects reported would be completely overshadowed by the larger number of impurity scattering centers due to the anion defect structure in the hy'postoichiometric mixed oxide material.
5.2 EFFECT OF FABRICATION PROCEDURE OF THE THERMAL CONDUCTIVITY OF (U0.8P~0.2)02-~ While most of the materials studied in this work were prepared by physically blending the urania and plutonia
powders in the proper proportions, some tests were krried out on material which was derived from a coprecipitation process, as described in the section on "experimental design." Figures9 and 10 show comparisons of thermal conductivity measurements in urania-plutonia fabricated using physically blended and wprecipitated powders. Any differences observed here were generally within experimental error, and are contained within the confidence band on the empirical equation. The thermal conductivities of these materials might be expected to be different if the plutonia agglomerates were of sufficient size to rcsult in the material being basically a matrix of U02 with large islands of hypostoichiometric plutonia. This situation would probably result in somewhat higher conductivity observed for the physically blended material. Since this is not the case, it can be assumed that the plutonia was sufficiently well distributed so that these inhomogeneous effects were generally not present.
5.3 EFFECT OF DENSITY ON THE THERMAL CONDUCTIVITY OF (U0.8P~0.2)02., The effect of density on the thermal conductivity of urania-20% plutonia is illustrated in Figure 11. Contrary to
the normal models of porosity effects on thermal conductivity, no significant density effect on the thermal conductivity was observed in these measurements. Since all of the available theoretical models concerning porosity in thermal conductivity measurements are based on the assumption of closed porosity, the presence of open pores and fissures in this material would preclude an analysis based on these theoretical models. It i s likely that the ratios of open to closed porosity in the various materials tested are such that any large density variation, such as would be predicted by any of the theoretical models, are not apparent. The low stoichiometry (1.95 o/m) overshadowed the density effect in this case (subsection 5.5).
5.4 ELECTRICAL CONDUCTIVITY The electrical conductivity of mixed oxide fuels varies with stoichiometry and plutonium content such that it
increases with increasing stoichiometry and with increasing plutonium contents. The samples were tested in dry hydrogen, which fixed the O/PU ratio a i each temperature while electrical conductivity increased with increasing temperature. Increasing plutonium content would result in gre.ater electrical conductivity although offset to some extent by any decrease in stoichiometry. An increase in electrical conductivity would have caused some amounts of joule heating if the pellets had come in contact with the central tungsten heating 'rod. Although the electrical conductivity of tungsten is much larger than that of a urania-plutonia ceramic, this might explain to some extent the wide variations in thermal conductivity observed at high temperatures for the 30 to 100% Pu02 samples, shown in Figure 8.

0-TO-M RATIO DENSITY 1.940 0 91.2% 1.950 v 91.2% 1.9508 0 91.2% 1.980 0 91.2% 2.000 A 91.2% U02 8 . 97.6%
. , . . . . . . . . i ' .
71-6 . .
' . Figure 7. Effect of Stoichiom.etry on Thermal Conductivity of (U0.8P~0.2)02-x .
Pu RATIO . DENS1.W 100% : 0 93 %TD 30% 0 .93.3% TD 20% A.91.2%TD
10% . V 91.3%TD. U02 8 97.6%TD
800 1000 1200 1400 1600 1800 2000 2200 2400
TEMPERATURE (OC)
Figure 8. Effect of Composition on Thermal Conductivity of (U/uy)O2,

Figurn 9. Fabrication, Effect on Thermal Conductivity of (Uo 8 Puo 2)0 1 95
U
OI 0.04 E, 3 - > , k 1 I-
, $ 0.03 0
0 (U-20 wt % Pu)02-, 93% TD COPREClPlTATED
OIM = 1.95
0 PHYSICALLY MIXED 84.9% TD
- 0 COPRECIPITATED 86.0% TD ' -
- -
0 (U-20 wt % Pu)02-,
92% TD PHYSICALLY MIXED
01M = 1.96
0 1 1 1 I 1 600 1OOO 1400 1800 2200 2600
TEMPERATURE (OC)
z ( 0 0 0 J a z W
0.02 - I-
-
71-9 ~ i ~ u r e 10. Thermal Conductivity of Copmipirated and Physically Mixed Pellers
0.01 I I I I I 1 I 800 1000 1200 1400 1600 1800 2000 2200 2400
TEMPERATURE (OC)

5.5 ORDER-DISORDER The thermal conductivity of a solid decreases with decreasing density and increasing molecular disorder. The
disoider effect increases with temperature.up to the temperature a t which radiative heat transfer effects dominate and cause' the observed increase in thermal conductivity at high temperatures. In mixed oxide fuels, increasing disorder can be caused by the formation of a non-ideal solid solution, such as one containing scattering centers formed due to oxygen vacancies. The number of oxygen vacancies depends on the stoichiometry (OIM ratio) of the fuel and not the OIPu ratio. Test 8 of this work demonstrated t t i e effect of this increase in thermal conductivity due to increases in O/M. The magnitude of the effect decreased as the deviation from stoichiometry (OIM = 2.00) increased and as the temperature increased. With increasing p~utdnium content, disorder also increased but the effect was overshadowed by disorder resulting from an increased number of oxygen vacancies since the measurements were made at lo& OIM values for plutonium content greater than 20%. Also overshadowed by the effect of stoichiometry was the effect of density on thermal conductivity. Thus the results presented indicate the strong effect of stoichiometry and.a lesser effect of plutonium content and density. For this reason, plutonium content was not included as a parameter in the empirical equation and the density correlation fa,ctor of 0.4465 developed.by ~s~moto"was retained. The second term of the empirical.equation given in Section 7 i-eflects a much lesser effect of density on t h ~ r ~ a l ' c o n d u ~ t i v i t ~ than was observed ,
in the U02 study by Asamoto.
5.6 EMPIRICAL EQUATION FOR THE THERMAL CONDUCTIVITY (U0.8P~0.2)02-x Figure 12 shows the plot of the empirical equation developed for the thermal conductivity of 91% dense
(U0.8P~0.2)02-x which i s given in Section 7, as a function of temperature over the range of 800 to 2300'~. The increaie in the thermal .conductivityf observed above .- 1800'~. was predicted by the equation. The 90% confidence band has been shown in Figure 12 to indicate the statistical accuracy of the equation. A few selected data points hive been added to Figure 12 to illustrate the curve-fitting'technique. The experimental uncertainty associated with each of these data points has been indicated in the figure by a vertical bar. These uncertainties were used as the weighting factors in the statistical .analyses discussed in Section 6.1.
Figure 13 shows the empirical equation plotted for'gl%'dense ( u ~ . ~ P " ~ . ~ ) o ~ - ~ and varying stoichiometry as a function of temperature. The effect of changing stoichiometry discussed in the preceding sections is evident here.
. .
5.7 MICROSTRUCTURES OF TESTED SPECIMENS Metallographic examinations were conducted on selected thermal conductivity test specimens to determine the
extent of fuel restructuring during the high temperature portions of the thermal conductivity measurements. Two examples are presented where varying'degrees of restructuring occurred. Figure 14 illustrates the microstructure of 84% dense ( U o # ~ ~ . ~ ) 0 ~ . ~ ~ . subjected to a radial temperature gradient with a central temperature > 2400'~ for 40 minutes. Extensive pore migration was . evident . in the center which extended to about 2200'~. Had the test continued for a longir period, a mature dq~umnar grain growth 'region would have formed. : Figure 15 shows the microstructure of 94.6% dense (Uo *PUO 2)01.95 subjected to a radial temperature gradient
with a center temperature > 2378'~ for 20 minutes. Barely perceptible evidence for pore migration above 2200'~ was visible. The shorter test time combined with
the higher density and smaller pore size served to inhibit pore movement to the extent that only negligible amounts were seen. .
The minim,um .temperature observed for pore ,migration .was somewhat higher than that observed for U02 specimens subjected to similar' treatments. ~samoto' and ~ a w s o n ' ~ have reported pore sweeping in U02 at temperatures greater than 1950'~. Possibly with longer heat treatments the mixed oxide would have exhibited pore migration a t lower temperatures. However, the lower heavy metal-bearing vapor pressures in the hypostoichiometric mixed oxide tended to delay the kinetics of porekiiigration to the extent that the onset of observable pore movement was permanently shifted to higher temperatures.
Figure 16 (a) and (b) compare the microstructures of t es t specimens prepared by different dowder preparition methods. Figure 16 (a) shows coprecipitated 87% dense (U0.8P~0.2)01.95 and Figure 16 (b) shows physically-mixed 94.6% dense' (U0.8Pu0.2)0i -95:' Both figures indicated that, as a result of the small temperature gradient, little grain growth occurred. Grains of comparable characteristics were observed in the bvo figures, which represent regions of comparable temperature.
The microstructures shown in Figures 14, 15, and 16 can be considered typical of all the tests done in this study.

DENSITY
0 94.75% TD
0 91.2 % TD
A 84.0 % TD
0.05 -
0.04
0.03
0.02
0.01
1 I I I 1 I I I
- -
- -
- -
I I I I I I I ' I 800 1000 1200 1400 1600 1800 2000 2200 24 00
0.034
TEMPERATURE (OC)
71-10 Figure 1 I . Effect of Density on Thermal Conductivity of (U0.8P~0.2)0 1.95
I I I I I I I I
k = 0.01524 + 1110.9702-0.4465D)T + 0.5841 x 1 0 - l ~ ~ ~ + 360.2/(2.04-01~1~~ - -
-
-
0.028 -
0
2 0.026 - - z 0 V J 0.024 - a I 5 0.022 - - - - _ - - x I-
0.020 - -
0.018 A I I I I I I I
lo00 1200 1400 1600 1800 2000 2200 2400 800 TEMPERATURE (OC)
71-11 Figure 12. Thermal Conductivity of 9 1 % Dense (U0.8P~0.2)02.00 Showing
90% Confidence Band and a Few Selected Data Points wid, Experimental Uncertainty Bands

Figure 13: Effect of Stoichiometry on the Thermal Conductivity of 9 1 % Dense
("0.8Pu0.2)*2-x
/
0.034
I I I I I I I
- k = 0.01524 + ll(0.9702-0.4465D)T + 0.5841 x 1 0 - l ~ ~ ~ + 360.2/ (2 .04-0/~)~~ -
-
-
-
-
-
-
d
0.018 I I I I I I I 800 1000 1200 1400 1600 1800 2000 2200 2400
TEMPERATURE (OC)
71-12

PELLET i. d. M0000-14
NEGATIVE No. 0714
Figure 14. Post- Test Microstructure of 84% Dense IUo.gPug2)0 1.35

PELLET i. d. M0090-8 NEGATIVE NO. 0828-1
Test Microawcture of 94.6% Dense { U ~ . ~ P U O . ~ I Q 1-95
-18-

2M1X NEGATIVE No. -7 (a) PREPARED AS COPRECIPITATED 87% T.D. (UOaPuO2)OleseS
PELLET i. d. 6486-2
25QX NEGATIVE No. 0828 Ib) PREPARED AS PHYSICALLY-MIXED 94.6% T.D., ~U0~8P~o~210,~95
PELLET i. d. M0090-8
Figure 16. Comparison of the Microstructum of Test Spmimens

6. DATA ANALYSIS
6.1 METHOD OF DATA ANALYSIS Each test pellet had four black-body holes, and a maximum of five temperature measurements were taken at each
of the holes. The current (I) through the tungsten rod was measured once for each run of sixty (maximum) temperature measurements. Attempts to measure the voltage through the tungsten rod were futile since the temperature (which thus determined the rod power by multiplying E X I) was not uniform over the entire length of the rod. Rod temperature however was assumed to be uniform throughout the test pellet stack. Also, voltage tap connections to the tungsten rod were difficult to attain due to the high temperatures involved. A single test thus consisted of up to twenty temperature measurements for each pellet and up to three pellets per test. Black-body hole depth measurements (r) were recorded before and after testing to an accuracy of + 1 mil. I f a significant deviation in hole depth was found in a particular hole, the temperature data for that hole were deleted. The time of each temperature measurement was recorded at the beginning of each sequence of measurements (i.e., after twelve consecutive measurements).
The data taken from each set of up to four black-body holes was plotted as temperature versus log radius. This yielded up to twenty points in an approximate straight line, assuming a constant thermal conductivity yield a parabolic temperature profile in a cylindrical pellet. Inconsistencies in black-body hole depths (pellet radii) were recognized if points in these plots deviated from the best f i t line. General consistency of the data was also judged from these plots, which formed a basis for deleting several tests (see Table 1 ). Since there were different fuel materials in each test column (U02 and Pu02 have different thermal conductivities) and because of general furnace heating variations, an axial temperature gradient existed across the test column. However, the only axial temperature gradient of importance was the one which existed across the length of each individual pellet. Measdrements showed that this gradient could be a maximum of loOc, but usually only about 5 " ~ over the entire length of a pellet. The resultant actual temperature gr* die?t between black-body holes at equal depths was negligible. A least-squares line was fit through the data remaining using computer code technique. The code extrapolated the best-fit line through the origin (r = o) or pellet inside diameter which determined the center temperature as well as the various AT'S and Ar's for each pellet. This was done by next calculating the gap conductivity of the helium gas filling the space between the pellet's inside diameter and tungsten rod.' Using this, the temperature drop between the pellet's inside diameter and tungsten rod were determined and the rod temperature, assumed to be uniform, was calculated. An empirical equation1' of resistance of unalloyed tungsten as a function of temperature was used to calculate the resistance of the tungsten rod which then yielded the power (0) in the rod by means of the O = l2 R relation. The same value of O was used for all five observations at each black-body hole.
A leastsquares line was fit through each set of up to four consecutive temperature measurements, one for each of the four black-body holes per pellet. Thirty seconds elapsed between consecutive temperature measurements, but about six minutes elapsed between measurements at the same hole. For up to five measurements per hole, up to five least-squares lines were obtained for each pellet. These least-squares plots consisted of lines of temperature versus log r as before. Temperature differences were calculated from the equations of these least-squares lines, and using the slopes of the lines, up to five values of thermal conductivity (k) were determined in a manner outlined in detail by ~samoto.' The validity of such a procedure depended upon provisions which were made to hold the radial temperature differences between adjacent black-body holes to a maximum of about 5 0 ' ~ (see Section 4.4) so that a mean value of the thermal conductivity could be assumed within such a temperature region.
In such a manner, values for k were calculated for the various tests under varying conditions of temperature (as controlled by varying the power in the tungsten heater rod), O/M ratio, and density. Only the results of tests 8(1), 8(1 I), 8(111), 10 and 11 (396 data points) were used to determine an empirical equation and comprise only 20% Pu concentration fuel. Except for test numbers 3 and 7, test data prior to test number 8 (see Table 1) were not reported due to inconsistencies and/or uncertainties in the black-body holes measurements. Although the data of test numbers 3, 7, 12 and 13 (which were for plutonium concentrations of O[U021, 10,30 and 100 percent) were not used to fit the empirical equation, they were, however, discussed in the results. These tests were not used for determining the equation because a consistent relationship between thermal conductivity and plutonium content for hypostoichiometric fuel could not be established.
In order to f i t an equation to the 396 data points (see Appendix A for data listing) which were valid, a computer code was developed to perform a weighted regression analysis for a non-linear equation form.

From experiments such as this; thermal conductivity of. mixed oxide fuel has been found to be a function of several variables. These variables include: temperature, fuel density, plutonium content, and oxygenlmetal (OIM) ratio. Theoretical models along with prior work set the guidelines for the general form of the equatior~:
where k = thermal conductivity ( ~ a t t s l c m - ~ ~ )
T = temperature (OC)
D = fractional density
OIM = oxygenlmetal ratio
Ci = constants determined by data analysis ( i = 1-4)
The factor (0.4465) multiplying the density (D) in the second term of the equation was derived from prior work by ~samoto' on U02. Insufficient data prohibited the determination of such a factor for mixed oxide fuel here. The factor (2.04) in the denominator of the last term was determined empirically.
The T~ term was required to produce the observed increase in thermal conductivity at high temperatures. Linear '
(T) and T~ relationships were tried first, but it was found that the ~3 relationship was the most satisfactory. Caution is noted regarding any extrapolation of the equation above 2 3 0 0 " ~ (i.e., above the upper limit of experimental data) which might result in an overprediction of the thermal conductivity as a result of this T~ term.
A weighted regression analysis was required since not all data points were known with equal precision. Those at lower temperatures were less precise than at higher temperatures. This was due to experimental errors which are explained in Section 6.3.1. The computer code which was developed fit an equation of the form discussed here to the entire set of data by determining the constants Ci such that the equation described the data to within acceptable limits (see Section 6.3). It i s not the purpose of this report to give a detailed description of the mathematics which were involved. However, initial estimates for the constants Ci were required for the curve-fitting analysis. These estimates were determined using both hand calculations and a generalized (non-weighted) curve fitting computer code. Only "ball-park" estimates were required and were easily obtained. These initial guesses were:
C1 = 0.01, C2 = 0.5, C, = 1 X 10-13, and C4 = 1.0 X lo3
The variation of k with various powers of T was determined by noting trends on plots of k versus T as a function of D, O/M, etc. Intuition entered also, as in the case of the C,T~ term which was required to fit the curve to the high temperature data which showed a slight increase in k as a function of T. The factor 2.04 in the last term was determined by hand calculations at first, but later it was allowed to float as a fifth constant in the computer ~alculatiu~~s and the voluc of 2.04 was confirmed.
The detailed weighted non-linear regression analysis yielded final values for the four constants ot: C1 = 1.524 X C2 = 0.9702, C3 = 0.5841 X 10-I and Cq = 360.2 to form the final equation reported here. The computer code
also yielded statistical parameters which are discussed in Section 6.3, and a plotting routine was also included.
6.2 DEGREE OF UNCERTAINTY IN RESULTS
6.2.1 Mixed Oxide Thermol Conductivity Experimental Error Analysis This analysis of errors 'in thermal conductivity measurements was based on the general probable error equatiu~i.
when z = f(x,y, ...) i s the function for which the probable error i s to be determined and Px, Py, ... are the probable errors attached to the given variables. - . . . .
The equation for thermal conductivity of. a cylindrical material with radial heat flow is:

The variables of interest are Q, rl , r2, and A T.
The partial derivatives are:
a K ' - 0 a (A TI 2n [(A , .
In (r2/rl - . . and the.error equation becomes:
Consider first the probable error in power (Q) determined by errors in assignment of the tungsten rod temperature (the actual voltage and current measurements were known to a higher order of precision).
The temperature drop between the tungsten rod and the fuel inside diameter was largely determined by the He gas conduction in the gap. The thermal conductivity of He at various temperatures was calculated from equations given by ~irschfelder.'
The results of these calculations are shown below:
The error in power (0) was calculated as follows: The UOz data from tests 8 and 13 were compared with ~samoto's' data, finding that difference between data was no more than 0.00125 at 800'~. Since Kuoz = 0.W. then for this data Kuo2 X 0.04 * 0.00125 which represents a 3.1% error a t 800'~. This corresponded to a temperature error at the tungsten rod of * 25'~. The gap width between the rod and the pellets was calculated for a total temperature drop of 5 0 ' ~ as follows:
where K i s conductivity of He, using a hypothetical QL which remained constant for this gap analysis.
r2 = 1.019 X 0.0938 = 0.0956
or a gap of 1.8 mils on the average. Using this gap and a QL of 50 wattslcm-'c, AT'S were calculated for higher tem- peratures using adjusted KH, values as well.

Once the temperature drops across the gap were known for each rod temperature, the error in rod temperature was calculated as
Since the resistivity of tungsten varied linearly with temperature; this error was also the error in linear power, which i s plotted in Figure 17 as PQ.
TEMPERATURE (OCI 71-16
Figure 17. . Uncertainties in Heat Flux Measurements as a Function of Temperature
Errors due to the uncertainty in AT between measured points were also present and comparable to the error in Q, but to be conservative, the entire error was attributed to uncertainties in Q. This yielded a value for the AT across the gap at 8 0 0 ' ~ of 50'~. Using this AT and the conductivity values for He as a function of temperature, an effective gap width was calculated. Then new AT and error values were calculated. The results of these calculations are shown in Figure 17.
The probable errors in the radii of black-body holes were calculated on the basis of Pr, = Pr2 = k 1 mil. The probable errors ill AT were found based upon the reproducibility of individual temperature measurements
using optical pyrometry. It has been shown that measurements such as these are reproducible (i.e., the variation among a series of temperature measurements at the same point compared with the one most often obtained) to within f 3 ' ~ . ~ There may well have been a systematic error in the temperature measurements. If a black-body cavity (hole) started out with a temperature not constant over i t s surface, it could be postulated that radiative transfer would have brought the walls close to a uniform temperature. If such a mechanism existed, then the temperature measured would have been lower than the maximum temperature without radiative transfer. Such a systematic error would not affect AT however. The variation in the absolute values of individual optical pyrometer measurements has been shown to be * 2% up to 2000'~ and ?; 3% between 2 0 0 0 ~ ~ and 2400°c.' The probable error in AT, called PAT, was then just the square root of the sum of the squares of the error in reproducibility for two temperature measurements, f (3" 3 ) 1 / 2 0 ~ , or about k 4 ' ~ .

Then the squares of al l the error terms were summed and the resulting probable error in K was the square root of that sum. It can be noted here however, with respect to the relative importance of the sources of experimental error, that the error due to uncertainties in Q was more than one order of magnitude greater than the errors due to uncertainties in either black-body hole depth or AT.
6.2.2 Confidence Limits The weighted regression analysis which was used to fit an equation to the'data reported here was designed to also
calculate a 90% confidence band on the equation. The computer code combined the experimental error associated with .each data point (which were used as "*veighting factors") with the error involved the deviations.of each data point from the regression line. Results are tabulabd i n Appendix 0 , and it was apparent that the width of.the confidence band a t each data point was not the same since the experimental conditions varied.
The "independent variable" listed i s temperature and the "dependent variable" i s thermal conductivity. Percent error width for each data point i s listed in the final column. The 90% confidence limits were.placed on the equation
. determined using one-half the mean value of the.percent error widths of a l l 396 data points..This in effect gave a reasonably conservative 90% confidence band of uniform width for the entireequation. It must be remembered that not all data points need to fall within a 90% confidence band. This i s especially true in a weighted regression analysis like the one which was done here, since some points were known more precisely than others.
7 . CONCLUSIONS
1. The thermal conductivity of (0.2 Pu - 0.8U)02.x was found to be a function of several variables. The equation is
k = 0.01524 + 1 + (0.5841 X 10-l2 )T3 +-
360.2 (0.9702 - 0.4465D)T (2.04 - O/M)T~
where k = thermal conductivity (watt~/cm-~c)
'T = temperature (800 to 2 3 0 0 ~ ~ )
D = fractional density (0.84 to 0.91)
O/M = oxygenlmetal ratio (1.940 to 2.000)
2. The thermal conductivity of mixed oxide fuel. was found to increase slightly a t temperatures greater than about 1 8 0 0 ~ ~ .
3. For design purposes, 90% confidence limits of + 11% may be applied to the above equation as determined by a weighted regression analysis.
4. The application of the out-of-pile thermal conductivity data from this experiment to in-pile usage requires additional input from integral to melt thermal conductivity data to ensure that the required boundary conditions are fully met.' 6 f 1 7

ACKNOWLEDGMENTS
The authors wish to thank W. E. Baily, R. N. Duncan and C. N. Spalaris for their direction and encouragement during the course of this investigation; T. F; Green, G. E. Valley Forge Space Center, Philadelphia, Pa. for his development of the weighted non-linear regression analysis code; C. R. Mijares and N. R. McBurney for their assistance in the computer analysis of the data; M. L. Thompson for his supervision of the test fuel fabrication; and D. C. Common and R. H. Cummings, who performed the laboratory measurements.
REFERENCES
Asamoto, R. R., Anselin, F. L., and Conti, A. E., The Effect of Density on the Thermal Conductivity of Uranium Dioxide, April 1968 (GEAP-5493). Hetzler, F. J., Lannin, T. E., Perry, K. J., and Zebroski, E. L., The Thermal Conductivity of Uranium and Uranium-Plutonium Oxides, August 1967 (G EAP4879). Schmidt, H. E., and Richter, J., The Influence of Stoichiometry on the Thermal Conductivity of (U0.8P~0.2;)02fx Oxide Fuel Thermal Conductivity Symposium, Stockholm, Sweden, June 1, 1967. Gibby, R. L., ''The Effect of Plutonium Content on the Thermal Conductivity of (U,Pu)02 Solid Solutions," J. Nucl. Mat. 38: 163-1 77 (1971 ). Van Craeynest, J. C., and Weilbacher, J. C., Etude De La Conductibilite Thermique Des Oxydes Mixtes D'Uranium Et De Plutonium, J. Nucl. Mat. 26: 132-136 (1968). Baily, W. E., et al., Thermal Conductivity of Uranium-Plutonium Oxide Fuels, Nuclear Metallurgy, Volume 13, International Symposium on Plutonium Fuels Technology, Proceedings of the 1967 Nuclear Metallurgy Symposium, Scottsdelc, Arizona, October 4-6, 1967, AIME. Gibby, R. L., The Effect of Oxygen Stoichiometry on the Thermal Diffusivity and Conductivity of U 0 . 7 # ~ 0 . 2 5 0 ~ - ~ , January 1969 (BNWL-927). Ainscough, J. B., "The Effect of Electrical Conduction in U02 on the Measurements of i t s High Temperature Thermal Conductivity as Determined by Radial Flow Techniques," J. Nucl. Mat. 20, pp. 184-192 (1966). Schmidt, H. E., "Some Considerations on the Thermal Conductivity of Stoichiometric Uranium Dioxide at Hiyh Temperatures," J. Nucl. Mat. 39:pp. 234-237 (197 1 ). Kruger, 0. L., Savage, H., "Heat Capacity and Thermodynamic Properties of Plutonium Dioxide," J. of Chemical Physics (49) 4540 (1968). Hein, R. A., and Flagella, P. N., Enthalpy Measurements of U02 and Tungsten to 3260°~ , February 16, 1968, (GEMP-578). Ogard, A. E ., and Leary, J. A., High Temperature Heat Content and Haat Capacity of Uranium Dioxide and Uranium Dioxide-Plutonium Dioxide Solid Solutions, LA-DC-8620 ( 1967). Lawson, V. B., and MacEwan, J. R., Thermal Simulation Experiments with a U02 Fuel Rod Assembly, March 1960 (CRFD-915). Hirschfelder, J. O., et al., Molecular Theory of Gasesand Liquids, John Wiley & Sons, Inc., New York, New York, (19541, p. 534. Feith, A. D., The Thermal Conductivity and Electrical Resistivity of Tungsten-26 Weight Percent Rhenium, 1967 (GEMP-562). Craig, C. N., and Baily, W. E., In-Pile Comparison of Effective Thermal Conductivity of (Pu02-U02) Mixed Oxides, January 1988 (OEAP-55%). Cantley, D. A., Rubin, B. F., and Craig, C. N., Stoichiometric Effects on the Integrated Thermal Conductivity of Mixed Oxide Fuels, to be published (GEAP-13734).

APPENDIX A. DATA
The tables. found in Appendix A contain the following information: thermal conductivity (K, ~ l c m - ~ c ) , temperature (OC), fractional density, fractional plutonium content, test number, and a data point reference number. For the 20% Pu data, the weighting factors used for the weighted non-linear regression analysis have been included.
Each table of data has been plotted with a figure number corresponding to the data tables. In the figures with 20% Pu data a smooth curve of the empirical equation has been plotted.

Table A-1 TEST 8 (PART I) DATA
Temperature ("c) Density Weight
Test Number Number

Table A-2 TEST 8'(PART I):DATA
Temperature K ("c) Density Weight
~ e & Number Number

Table A-3 TEST 8 (PART II) DATA
Temperature ("c) Density O/M Pu Weight
Test Number Number

Temperature ("c)
Table A 4 TEST 8 (PART II DATA
Density O/M Pu . Weight Test
Number Number

Table A-5 TEST 8 (PART I I I) DATA
Temperature ("c) Density O/M Pu Weight
Test Number Number

Table A-5 (continued)
Temperature ("c) Density . O/M Pu Weight
Test Number .. Number

Table A 4 TEST 10 DATA
Temperature ("c) Density O/M Pu Weight
Test Number Number

Temperature ("c)
Table A-6 (continued)
Density O/M Pu Weight
0.000889 0.000877 0.000897 0.000534 0.000528 0.000537 0.000534 0.000528 0.000485 0.000477 0.000475 0.000477 0.000477 0.001719 0.001710 0.001945 0.002085 0.001841 0.000397 0.000394 0.000395 0.000394 0.000397 0.000470 0.000454 0.000470 0.000470 0.000466 0.000725 0.000681 0.00068 1 0.000681 0.00068 1
Test Number Number

Table A-7 TEST 11 DATA
Temperature ("c) Density
0.8551 0.855 0.855 0.855 0.855 0.855 0.855 0.855 0.855. 0.855 0.855 0.855 0.855 0.855 0.855 0.855 0.855 0.855 0.855 0.855 0.855 0.855 0.855 0.855 0.855 0.855 0.855 0.855 0.855 0.855 0.055 0.855 0.855 0.855 0.855 0.855 0.855 0.855 0.855 0.855
Weight Test
Number Number

Temperature ("c) Density
Table A-8 TEST 11 DATA
Weight
0.001719 0.001706 0.001 699 0.001 759 0.001 639 0.0007 16 0.000723 0.0007 13 0.000723 0.0007 16 0.000503 0.000498 0.000509 0.000509 0.000506 0.000386 0:000384 0.000390 0.000386 0.000386 0.000405 0.0004 14 0.000403 0.000407 0.0004 1 1 0.000342 0.000344 0.000339 0.000344 0.000346 0.000300 0.000300 0.000300 0.000299 0.000301 0.000564 0.000536 0.000528 0.000541 0.000554
Test umber
11.301 1 1.301 11.301 11.301 11.301 1 1 :302 1 1.302 1 1.302 11.302 1 1.302 1 1.303 1 1.303 1 1.303 1 1.303 1 1.303 11.304 1 1.304 1 1.304 1 1.304 1 1.304 1 1.305 1 1.305 1 1.305 1 1.305 1 1.305 11.306 1 1.306 1 1.306 1 1.306 . 1 1.306 1 1.307 1 1.307 1 1.307 11.307 1 1.307 1 1.308 1 1.308 1 1.308 1 1.308 1 1.308 '
Number

Table A-9
TEST 13 DATA
Temperature ("c) Density
Test Number Number

Temperaiure . (' C)
Table A-10 TEST^ DATA ;
Density O ~ M Test
Number
3.101 3.102 3.102 3.103 3.103 3.108 3.109 3.1 10 3.1 1 1 3.1 12 3.201 3.202 3.203 3.204 3.205 3.'206 3.207 3.208 3.209 3.210 3.21 1
Number

Table A-1 1
TEST 12 DATA
Temperature ("c) Density O/M Pu
Test Number Number

Temperature ( " ~ 1 .
Table A-1 1 (Continued)
Density
0.976 0.976 0.976 0.976 0.976 0.976 0.976 0.976 0.976 0.976 0.976 0.976 0.976
Test Number Number

Table A-12 TEST 7 AND TEST 13 DATA
Temperature ("c) Density O/M Pu
Test Number Number

Table A-12 (Continued)
Density Test
Number ' . L
Number

Table A-12 (Continued)
Temperature ("c) Density . O/M
Test Number Number

0.035
- 0
O1 0.030
6 5 - c L I- $ 0.025 0 2
8 d Q
Z W 1 0.020 I-
0.01 5 800
I I I I I I I
- - DENSITY = 0.91
OIM = 1.94
Pu = 0.20
- - 8 8
0 - -
I I I I I 1000 1 200 1600
I 1400
1 1800 2000 2200
TEMPERATURE (OC)
71-17
Figure A- 1. Test 8 (Part 1)
0.035
- 0 0.030 I E 5 - > k > F 0.025 0 3 0 z 0 U A Q s
0.020 I I-
0.01 5 800
I I I I I I I
- DENSITY = 0.91
8 01 M = 1.95 -
0 Pu = 0.20
0 - - " 1
- -
I I I I I I 1000 1200 1400 1600 1800 2000
I 22po
TEMPERATURE (OCI
71-18
Figure A-2. Test 8 (Part I )
46-

DENSITY = 0.91
01 M = 1.98
I I I I I I 1 I 10 1000 1200 1400 1600 1800 2000 2200
TEMPERATURE I'C)
71-19
Figure A-3. Test 8 ( ~ i r t 11)
Figure A-4. Test 8 (Part 11)

0.035
- 0 0
1 0.030 6 5 - > 'z 1 I- $ 0.025
I I I I 1 1 1
- - DENSITY = 0.91
OIM = 1.95
Pu = 0.20
- o 0 -
0.035
- oU 0.030
I E . 3 -
4 1 1 1 I I I I
DENSITY = 0.84 - - 01 M = 1.96
PU = 0.20
3
0
€I 0
a
0.015
J a
I I I I I I I
0.01 5
800 1000 1200 1400 1600 1800 2000 2200 TEMPERATURE I'C)
71-21 Figure A-5. Test 8 (Part 1/11
I 1 I I I I I 800 1000 1200 1400 1600 1800 2000 2200
TEMPERATURE {OC)
71-22 Figure A-6. Test 10
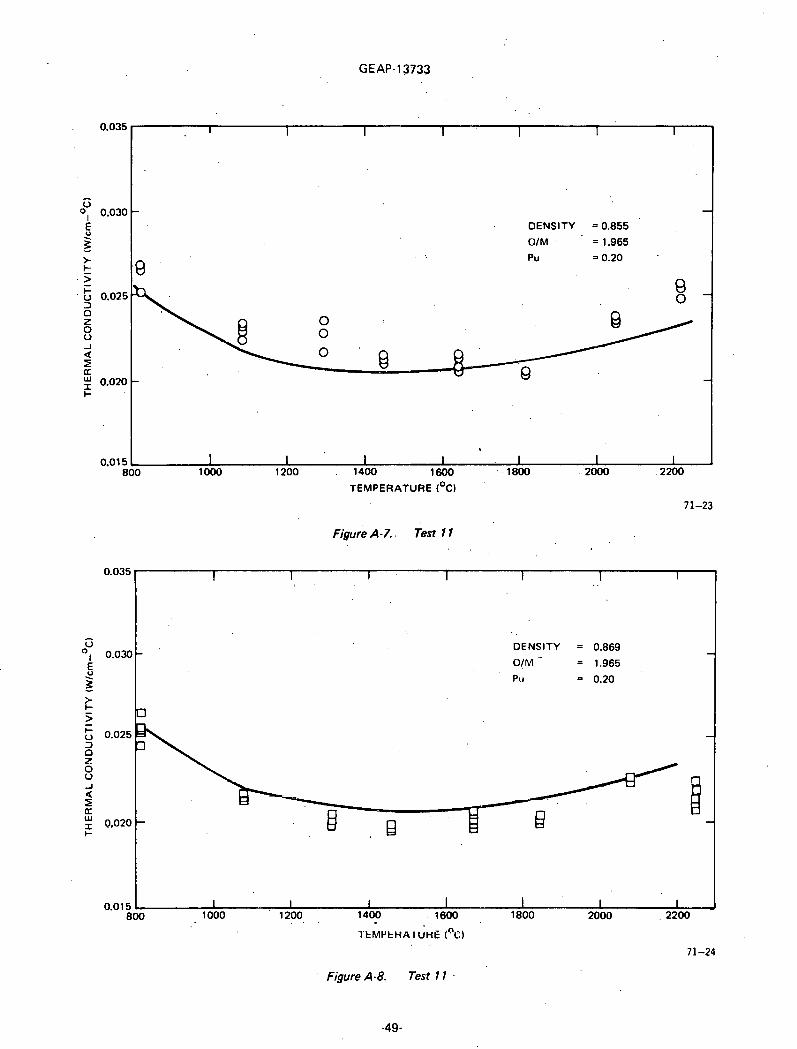
DENSITY = 0.855
OIM = 1.965
TEMPERATURE ('c)
~ i ~ u r e A-7. . Test 1 1
0.035
- U
OI 0.030
E 2 c 1
I 1 1 I I I 1 . .
DENSITY = 0.869 - ' - OIM '- = 1.965
Pu 0.20
0
0.025 2
- 0 2 0 0 -I
2 . [r
W 0.020 -
k
% -
0.015 r I I 1 I I I 1 - 800 1000 1 200 1400 1600 1800 2000 . 2200 . . ,
. I . ~ M P ~ H A I "HE PC) . ..
7 1-24
FigureA-8. Test11.

0.035
- 0
0 1 0.030 5 5 - >
. t 2 I- 3 0.02s 0 . Z
; a' a z W
.I, 0.020
0..0151 '
. . - I 1 I I' 1. I 1 .
, .
. . . .
- DENSITY = ' 0.91 - . - . . . . OIM - . ' . = 1.986.
Pu = 0.10
0 . ,
, . . . . .
. .
. . @., - 0 . . .
. . : Q 8 8 ,
$ ' , 0 ,
0 . & j . , , 0 , . ; . . 0 . . . .
. . - . . -
. . . .
' , I 1 I 1 I 1 800.. . - 1000'. :: q 200 - ' : 1400 is00 ' . '1800 ' ,2000
. . 2200 ',
TEMPERA,TURE (OC)
' . . 71-25
:;FigureA-9. ~esr.13' . .
. . . . ' . ,
0.035.
0.030 0
I , 6
: 1 - > . ' c 1 ' 0.025' I- 0
.. 3 0 2 . . .
8' J 4 : g 0.020 W - I I-
0.01 5 800
. . . . . . . . .
. . .,
1. I . ,. I 1 I 1
. . DENSITY = 0.93
OIM = 1.95 . . , - ,
. . Pu = 0.30 - . .
. .
. . - - . . . . m 0 .
oa . . .O 0 . ' " . . .
. . . . . D a : . - . . , , . . . . .
' a 0 Q ; . . . - - . .
. .
. . A . .. . . . . . . ~,
I . . 1 I I 1 I A
lo00 1200 ' '1400. .'.I600 . 1800 2000 2209 TEMPERATURE (OCI . .
. . 11-26 figure A- 10. .,Test 3
. . , . .

Figure A- 11. Test 12
0.035
- CJ
0 0.030 I
E 5 - > k 2
0.025 3 0 z
8 -I a Z
0.020 k
0.015 800
Figure A- 12. Test 7 and Test 13
1 1 1 I I 1 I
DENSITY = 0.976
OIM = 1.86
Pu = 1.00 (Pu02)
- - 0
- 0 -
o % S O 8 8 O 9 0
8' % B 0
- 8
- 0
. I I I 1 I I 1 1000 1200 1400 1600 1800 MOO 2200
TEMPERATURE (OC)
71-27

APPENDIX B. STATISTICAL ANALYSIS RESULTS
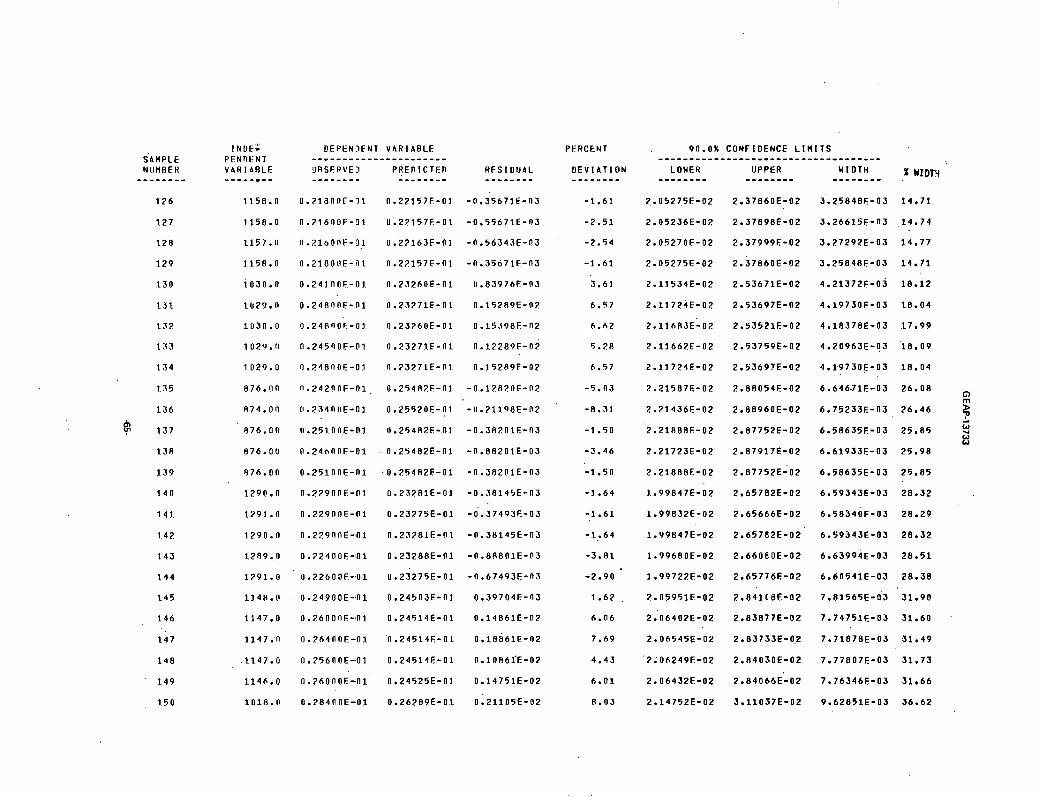
' The results of the statistical analysis used to determine the empirical equation for the thermal conductivity of ( U O . ~ P U ~ . ~ ) O ~ - ~ are given in this appendix. As indicated. only'the 20% Pu/(Pu+U) data were used to determine the ' .
equation. This represented data from Tests 8(1), 8(11), 8(111), 10 and 11 (see Appendix A) for a total of 396 data points which are indicated by "sample number" here. The "independent variable" is temperature ("C); the "dependent variable" i s thermal conductivity ( ~ l c m - ~ ~ ) ; the "residual" i s the "observed" minus the "predicted" value of the dependent variable; the "percent deviation" i s based upon the predicted value of the dependent variable and the "90% confidence limits" are based upon the predicted value of the dependent variable.
The term "predicted" is the value determined by the empirical equation. The "observed" value is the measured one.

INDF; PENDENT V A F l ABLE --------
DEPENDENT VARIABLE . . . . . . . . . . . . . . . . . . . . . . ~ ~ S E R V E ~ P H E D l C T F n -------- - - - - - - - -
PERCENT
D E V I A T I O N -------- - 4 . 8 2
-4 . 88
-2 .95
-5 .38
-4 .42
- 3 . 4 5
-6 .41
-5 .96
-7 .35
-5 .06
- 5 . 5 1
-0 .99
- 0 . 9 9
-0 .99
- 1 . 4 3
-0,57
, 90.0% CONFIDENCE L I M I T S ------------------------------------ LOWER UPPER WIDTH , ~ . Y X D T H " -------- -------- --------

SAMPLE NUMBER -------- RESIDUAL --------
U . l l 0 7 8 E - 0 2
0 . ' 1 2 6 8 5 ~ ' - 0 2
0 . 2 0 5 3 5 ~ - 0 2
PFRCENT
D E V I A T I O N -------- ., 9 0 . 0 % ----------
LOYER -------- CONFIDENCE L I M I T S . - - - - - - - - - - - - - - - - - - - - - - - - -
UPPER Y I , D T H -------- --------

SAMPLE NUMBER --------
UEPFNnENT V A R I A B L E . . . . . . . . . . . . . . . . . . . . . . OBSERVED P R E D l C T E O -------- -------- H F S I DUAL --------
PERCENT 9 0 . 0 % C O N F I D E N C E L I M I T S ------------------------------------ LOWER UPPER W l D T Y -------- -------- --------

SAMPLE NUMBER --------
I N D E ~ P E N D F N T V A R I A B L E --------
DEPENDENT V A R I A R L E . . . . . . . . . . . . . . . . . . . . . . I IRSEHVED P R E D I C T E D R E S I D U A L - - - - - - - - - - - - - - - - - - - - - - - -
PERCENT
D E V I A T I O N --..-----
9 0 . 0 % CONFIDENCE L I ~ I T S ----------i-------------------------
L O W E R UP'PER -------- . W l D T H % WIDTH . - ------- -------- . .

INDE- P E H n E N l V 4 R 1 ABL
DFPEMDFNT V A R I A B L E ' . . . . . . . . . . . . . . . . . . . . . . O R S E f f V i n P R E ~ I C T E ~ -------- --------
PERCENT
D E V 1 4 T I O N -------- -1.57
1 2 . 5 1
- 0 . 8 1
4 . 4 7
8 .05
3.58
-0 .97
9 0 . 0 % CONFIDENCE L I M I T S .................................... I-OUER UPPER ~ l o r n -------- -------- --------
SAMPLE NUMBER
- - - - - . - - - R E S I D U A L -------- % WIDTH

DEPENDENT V A R I A R L E ...................... OBSERVED , P R E D l C T E D -------- , --------
I N ~ € : P E N D E ~ T V A R I A B L E . --------
PERCENT
D E V I A T I O N -------- - 3 . 4 5
- 0 . 6 2
0 .36 .
- 1 . 1 2
-1 .12
- 0 . 6 3
- 4 . 1 7
9 0 . 0 % CONFIDENCE. L l n l T s - ' .................................... LOUER UPPER W I D T H ' -------- ---i---- -------- .
SAMPLE NUMBER. --------

.I N O E L PENOENT V h R l h B L E --------
DEPENDENT V A R I A E ' L E . . . . . . . . . . . . . . . . . . . . . . uBSERVED r P R E D I C T E D -------- --------
PERCENT 9 0 . 0 % C O N F I D E N C E L I M I T S - - - - - - - - - - - - - - - - - - - - - - - - - - - - - - - - - - - - .
LOWER UPPER U l DTH ' - ------- -------- . . - ------- S A H P L t NUMBEH -------- R E S I D U A L D E V I I I T I O N -------- -------- X WIDTH

Po. 0 % ----------- LOWER -------- .
r # n E - PENPE,N,T V A R I A R L E --------

I N ~ I ~ : : P E N l ) t N l V A H I A R L E - - - - - - - -
DEPENDENT VARI.3RLE . . . . . . . . . . . . . . . . . . . . . . ORSERVEn P R E I I CTED -------- - - - - - - - -
PERCENT
D E V I A T l O N -------- 9 0 . 0 % CONFIDENCE L I M I T S ....................................
LOWER , UPPER. W I D T H -------- -------- -------- R E S I D U A L --------

9 0 . 0 % C.ONF1DENCE LIMITS. . - - - - - - - - - - - - - - , - - - - - - - - - - - - - - - - - - - - - -
LOWER . , .UPPER ' W I D T H % WIDTH -------- -------- -------- ,liFf;FE4nt:FiT V A H I APLF. . . . . . . . . . . . . . . . . . . . . . .
rfns~~rvttl PRE-D ICTED R E s I n u A L . - - - - - - - - . - - - - - - - - -------- H E V I A T I O N --------
INDE: P E N n f N T V A R I A B L E - - - - - . - -
D E P E N > F N T V A R I A B L E . . . . . . . . . . . . . . . . . . . . . . D R S E R V E ) P q E n l c T E n R F S I D U A L - - - - - - - - - - - - - - - - --------
P E R C E N T 9 0 . 0 % C O N F I D E N C E L I M I T S ------------------------------------ LOWER U P P E R W I D T H -------- -------- -------- D E V I A T I O N - - - - - - - -

DFPENDENT V A N I A B L E . . . . . . . . . . . . . . . . . . . . . . O R S E ~ ? V E ~ P R E ~ I ~ T E D -------- --------
PERCENT
IlFVl A T I O N --------
C O N F I D E N C E L I M I T S . . . . . . . . . . . . . . . . . . . . . . . . . . l lPPER u I O T H -------- --------
9 0 . O X ---------- LOWER - - - - ----
SAMPLE NUMREH . - - - - - - - R E S I D U A L --------

SAMPLE NllMBEH --------
INI)E' 'PENDFNT VARIABI.E --------
D F P E N ~ E N T V A R ' I A ~ L E . . . . . . . . . . . . . . . . . . . . . . ~ R S E R V E ~ P R E D I C T E D - - -'- - - - - -------- R E S I O U A L --------
PERCENT
D E V I A T I O N -------- 9 0 . 0 % C O N F I D E N C E ' L I M I T S ' ------------------------------------
LOWER, UPPER W I D T H - - - - - - - - -------- --------

SAMPLE NUMBER --------
DSPENOENT VAHIAbL,E ...................... O H S E R V € D PREDIC'TI:D -------- --------
PERCENT
. . . .-
9 0 . 0 % CUNFI,DENCE L I M I T S .................................... LONER l lPPER . W I D T H . %.WIDTH,. . -------- -------- ----.---
1 .82716E-02 2 .24818E-02 4. '21022€-03 2 0 3 6

' V A H I ARLE , - - - - - - - - - - -
PREDICTED -------- U.20597E-01
0.2060RE-01
0.20612E-01
0 . 2 0 6 0 ~ ~ - 0 1
0 . 2 0 6 0 8 E - 0 1
0.21263E-01
0.21277E-01
U.21277E-01
0:21290E-01
0.21290E-01.
0 .22686E-01
0.22686E-01
0.22498E-01
0.22698E-01
0.22698F-01
0.22130F-01.
U.27160E-01 '
0.22160E-01
n . z 7 1 7 i ~ - n 1
0.2219JE-OI
0.20728E-01
O . ~ ~ ~ ~ P E - O I
O.?0723C-01
I I . ~ [ I ~ : ! ~ E - ~ I
0 . 7 n 7 7 j ~ - 0 1
PERCENT
DEVIATION - - - - - - - - 5.36
3.36
3.82
3. A4
1.90
1.5H
-1.30
1 :n 5
0.115
-0.42
-3.03
-1 .?a
-1.76
-2.70
-5.28
-5.14
-3.88
-6.59
-3.93
-2.67
13.85
13.85
12.44
1.3.86
15.33
90.0%
LOYEH -------- 1.87562E-02
1.87527E-02
1.87564E-02
1 aR7547E-02
1.87461E-02
1.91465E-02
1 .91362E-02
1.91487E-02
1.91464E-02
1.91459E-02
1.98219E-02
1.98347E-n2
1.98354E-02
1.983,24E-07
1.98094E-02
1.90090E-02
1.90262E-02
1.9OOJQE-02
1.90293E-02
1.9f l464E-02
1.84432E-02
1.84432E-02
1.84344E-02
1.R4418E-02
1.84487E-02
CONFIDECCE L l n l T s .------------------------- UPPER U I D T H -------- --------
2.24375E-02 3.68128E-03
2.24641E-02 3.21136E-03
2 .24681E-02 ' 3 .71168E-03
2.24620E.-02 3..707266-03
2.24707E-02 3.72461E-03 .
2.33797E-02 4.23319E-03
2.34169E-02 4.28075E-03
2.34044E-02 4.25566E-03
2.34318E-02 4.28340.E-03
2.34343E-02 4 . 2 8 8 4 3 ~ - 0 3
2.55507E-02 5.72876E-03-
2.55379E-02 5 .70325E-03 .
2.55615E-f l2 5.72608E-03
2.55645E-02 5.'73212€-03 .
2.55875E-02 5.77813E-03
2.52676E-02 - 6 .25856E-03
2.52941F-O? 6.26787E-03
2.53164E-02 6.31249E-03
2.53129E-02 6.2R362E-03
2 .53398~- '02 6.29340E-03
2.30131E-02 4.56991E-03
2.30131E-@2 4.56991E-03
2.30114E-02 4.57693E-03
7.30040E-02 4.56213E-03
2.29970E-02 4.54832E-03

1NDI:s PFNIIl!NT V A R I A B L E - - - - - - - -
054.00
9 5 3 . 0 0
9 5 1 . 0 0 .
V 4 R . 0 0 .
946.011
1125.11 .
1126.!1
1126.11
R E S I OllAL - - - - - - - -
. . 9 '0 .0% CONFIDENCE L I H I ' T S . .
---------------i--------.------------
L O W E R ~ P P E R . . U I D T H ' - - - - - - - - - - - - - , - - - -------- . .. . .

1 ' . ' I T I A l . GIIESS F O R H E T A ( 1 I = 1 . 4 R 5 0 0 0 E - f l 2 . B E T A ( 2 ) = 0 .704600. R E T A ( 3 ) = 5 . 7 1 0 0 0 0 E - 1 3 , R E r A ( 4 ) =
I N l T I A l . 5111~1 OF EI??OPS SOJAl?FD RASFl j I lN GUESS. FOR @ETA VALl lES = 1.02747
IMF'HIIVI I1 SllV OF FHRLIRS S:.IIIAHED HASED Oh 2 1 I T E R A T I O N S = 0.9957110
C F l A I 1 ) = 1.5240H2F.-fl2 . e E l A ( 2 ) : fl .970194. R E T A ( 3 ) = 5 .8413U3E-13. RETA,(4) = 360.240
a * * * * Y F IJLDE R E S l P I I A L ANALYSIS * * C O O
5,llf l Ill- THE !!FSIDI.;ILLS = 9.1114252F-07
t<hXIE(!!P: APIU M l k l l . l l r PFSEIIIJAL. VALIIE = 6.62141P.E-03 - 3 . 4 6 0 0 R 2 E - 0 3
i1 l l l f IJ l i4 U.\TSQN S T h T I S 1 1 C n . 2 9 8 2 7 1
R!lkS = 1 9 ( 1 9 H 9 )
'5Kk'JNI;SS = 1 .O??f lE.F flO 0 1 . 2 2 6 2 9 c - 0 1
E!IhTUSIS = 1 , 7 5 2 9 0 0 . 2 4 4 6 5

DISTRIBUTION
Director, Contracts Division U. S. Atomic Energy Commission San Francisco Operations Office 21 11 Bancroft Way Berkeley, California 94704
RDT Site Office U. S. Atomic Energy Commission General Electric Company 310 DeGuigne Drive -Sunnyvale, California 94086
Chief, California Patent Group U. S. Atomic Energy Commission San Francisco Operations Office P. 0. Box 808 Livermore, California 94550
Manager . Westinghouse Electric Corporation Advanced Reactors Division P. 0. Box 158 Madison, Pennsylvania 15663
Division of Reactor Development and Technology, Headquarters U. S. Atomic Energy Commission Washington, D. C. 20545 Attn: Assktant Director,
Engineering Standards .
Division of Reactor Development and Technology, Headquarters U. S. Atomic Energy Commission Washington, D. C. 2 0 9 5 Atm: Assistant Director,
Nuclear Safety
Division of Reactor Development and Technology, Headquarters U. S. Atomic Energy Commission Washington, D. C. 20545 Attn: Assistant Director,
Plant Engineering
Division of Reactor Development and Technology, Headquarters .
U. S. Atomic Energy Commission Washington, D. C. 20545
' Attn: Assistant Director, Program Analysis
Division of Reactor Development and Technology, Headquarters U. S. Atomic Energy Commission Washington, D. C. 20545 Attn: Assistant Director,
Project Management
Division of Reactor Development and Technology, Headquarters U. S. ~ t o m i c . Energy Commission Washington, D. C. 20545 Attn: Assistant Director,
Reactor Engineering
Division of Reactor Development and Technology, Headquarters U. S. Atomic Energy Commission Washington, D. C. 20545 Attn: Assistant Director,
Reactor Technology
Division of Reactor Development and Technology, Headquarters U. S. Atomic Energy Commission Washington, D. C. 20545 Attn: Chief, Fuels and
Materials Branch
Division of Reactor Development and Technology, Headquarters U. S. Atomic Energy Commission Washington, D. C. 20545 Attn: Chief, Fuel Engineering
Branch
Dlvisiu~~ of Resetor Dcvolopmont and Technology, Headquarters U. S. Atomic Energy Commission Washington, D. C. 20545 Attn: Chief, Reactor Vessels
Branch
hsistant Direotor for Pacific Northwest Programs, RDT +
U, S. Atomic Energy Cornmission P. 0. Box 550 Richland, Washington 99352
RDT.Site Office U. S. Atomic Energy Commission Argonne National Laboratory Building 2, Argonne, Illinois 60439

RDT Senior Site Representative f Director U. S. Atomic Energy Commission Chemical Engineering Division P. 0. Box 2325 Argonne National Laboratory San Diego, California 921 12 9700 South Cass Avenue
Argonne, Illinois 60439 Division of Naval Reactors 1 Chief, Nuclear Materials Branch FFTF Fuels Department U. S. Atomic Energy Commission Pacific Northwest Laboratory Washington, D. C. 20545 P. 0. Box 999
Richland, Washington 99352 Director 3 Division of Reactor Licensing U. S. Atomic Energy Commission RDT Site Office Washington, D. C. 20545 U.S. Atomic Energy Commission
Atomics International Director 2 P. 0. Box 1446 Mettalurgy Division Canoga Park, California 91304
Argonne National Laboratory 9700 South Cass Avenue RDT Site Office Argonne, Illinois 60439 U.S. Atomic Energy Commission
Argonne National Laboratory Manager, FFTF Project 6 P.O.Box2108 Pacific Northwest Laboratory Idaho Falls, Idaho 83401
P. 0. Box 999 Richland, Washington 99352
Division Leader (CMB) Manager 1 Chemistry and Metallurgy Division Chemistry and Metallurgy Division Los Alamos Scientific Laboratory Pacific Northwest Laboratory P. 0. Box 1663 P. 0. Box 999 Los Alamos, New Mexico 87544 Richland, Washington 99352
Director RDT Site Office 1 Metallurgy and Materials U. S. Atomic Energy Commission Science Division Oak Ridge National Laboratory Brookhaven National Laboratory P. 0. Box X Upton, New York 11 973 Oak Ridge, Tennessee 37830
Division Chief, M & S Division Director 2 NASA - Lewis Research Center Division of Reactor Standards 21000 Brookpark Road U. S. Atomic Energy Commission Cleveland, Ohio 441 35 Washington, D. C. 20545
General Manager Division of Technical 135 Westinghouse Electric Corporation Information Extension Bettis Atomic Power Laboratory
U. S. Atomic Energy Commission P. 0. BOX 79 P. 0. Box 62 West Mifflin, Pennsylvania 15122 Oak Ridge, Tennessee 37831
Associate Manager Director 2 Materials Engineering Department LMFBR Program Office Battelle Memorial Institute Argonne National Laboratory Columbus Laboratories 9700 South Cass Avenue 505 King Avenue Argonne, Illinois 60439 Columbus, Ohio 43201
-74-

larrager, Nuclear Laboratories dmbustion Engineering Inc. Nuclear Division Prospect Hill Road Windsor, Connecticut 06095
Manager, Plutonium Chemistry and Ceramics Fuels Development Nuclear Materials and Equipment
' Corporation Plutonium Laboratow Leechburg, Pennsylvania 15656
Head, Fuels and Materials ~ t o m i c Power Development Associates 191 1 First Street Detroit, Michigan 48226
Director Metals and Ceramics Division Oak Ridge National Laboratory P. 0. Box X Oak Ridge, Tennessee 37830
Director, Liquid Metal Engineering Center Atomics International P. 0. Box 1449. Canoga Park, California 91 304
Manager-Advanced Development Activity General Electric Company Knolls Atomic Power Laboratory P. 0. Box 1072 Schenectady, New York 12301
Director, LMFBR Technology Program Atomics International P. 0. Box 309 Canoga Park, California 91304
Director Nuclear Development Center The Babcock and Wilcox Company Atomic Energy Division Lynchburg, Virginia 24501
Laboratory Assistant Director Gulf General Atomic Incorporated P. 0. Box'608 San Diego, California 92112
I Manager, Research United Nuclear Corporation Research and Engineering Center Grasslands Road Elmsford, New York 10523
1 Director Nuclear Safety Program Oak Ridge National Laboratory P. 0. Box Y . .
Oak Ridge, Tennessee 37830
K-2,Group Leader 1 Reactor Division
Los Alamos ~cientif i6~aboratory . '
P. 0. Box 1663 . ,
Los Alamos, New Mexico 87544
2 Westinghouse Electric Corporation Technical Director Advanced Reactors Division P. 0. Box 158 Madison, Pennsylvania 15663
1 Manager Liquid Metal Information Center Atomics International P. 0. Box 1449 Canoga Park, California 91304
1 Irradiation Coordinator EBR-I I Project Argonne National Laboratory P. 0. Box 2528 ldaho Falls, ldaho 83401
Experiment Manager 1 EBR-ll Project
Argonne National Laboratory 9700 South Cars Avenue Argonne, Illinois 60439
1 Director Reactor Safety & Analysis Division Argonne National Laboratory 9700 South Cass Avenue Argonne, Illinois, 60439
1 Technical Director, FFTF Project 1 Hanford Engineering Development Laboratory P. 0. Box 1970
. . Richland, Washington 99352

U.S. Atomic Energy Commission Region I I - Division of Compliance Suite 818 230 Peach Tree Street, N. W. Atlanta, Georgia 30303
Dr. Knox M. Broom, Jr. Nuclear Specialist Middle South Services, Inc. P.O. Box 61 000 New Orleans, La.
1 Assistant Director of Pacific Northwest Programs, RDT 1 U.S. Atomic Energy Commission P.O. Box 550 Richland, Washington 99352
1 Technical Director, FFTF Project 1 Hanford Engineering Development Laboratory P.O. Box 1970 Richland, Washington 99352

SUNNYVALE, CALIFORNIA 94086
Expanding the World's Energy Reserves