Embed Size (px)
Citation preview

There’s Something About
SeattleCreative Economy Report2019

2 Creative Economy Report
On behalf of the City of Seattle, we are excited to introduce our first Creative Economy Report.

3 Creative Economy Report
March 2019
In Seattle, we know that creativity does much more than add to our quality of life. Creativity is integral to the character of our city and is a powerful component of our economy. Seattle’s creative workers push us to be better and think bigger.
Our city benefits every day from its diverse community of entrepreneurs, artists, and innovators. Musicians from Jimi Hendrix to Heart’s Ann and Nancy Wilson to Nirvana’s Kurt Cobain put our city on the world stage. Today, as our powerful technology sector draws companies and workers from around the world, our thousands of creatives continue to create the art and culture that helps draw hundreds of thousands of visitors to Seattle every year. Creatives make the films that showcase the beauty of our landscape, perform the concerts and plays that bring our community closer together, create the websites that take a human-centered design approach to make it easier for our neighbors to meet their needs, and so much more.
Yet we hear, more and more often, that some of our most creative residents are not benefitting from living in the city that is benefit-ting so much from them. The affordability crisis that has affected all of us is especially threatening for many members of our creative workforce. It is vital that we ensure that all members of our community can continue to live and work in Seattle.
Investing in creative skills and understanding their role in the wider economy is more important now than ever. With technological advances like automation and artificial intelligence gaining momentum and investment, it is equally important to invest in jobs that humans are uniquely qualified to do. Our focus is on fields that center creativity, the human experience, and the creation and pres-ervation of culture.
To know how to support and grow our creative workforce, we first need to understand it. The Seattle Creative Economy Report is a benchmark study; with this starting point, we will be able to monitor changes over time and better understand the impacts of our interventions. Investing in creative industries can help drive interdisciplinary creative collaboration and innovation across all industry sectors, maintaining Seattle’s reputation as the city that invents the future.
This work began years ago, and we are excited to carry it forward for years to come. Thank you to the hundreds of people who par-ticipated in the creative economy survey last year—your input gave us valuable real-world insight. It is a pleasure to share this initial report, and we look forward to an open dialogue on how this new information should shape our work.
Sincerely,
Kate Becker Randy Engstrom Karl Stickel Director, Office of Film + Music Director, Office of Arts & Culture Interim Director, Office of Economic Development

4 Creative Economy Report
Contents

5 Creative Economy Report
Introduction ............................................................................................6
Why Study the Creative Economy? .................................................... 7
Goals of this Report .............................................................................. 7
Key Findings ............................................................................................8
Top 5 Creative Occupations ................................................................. 11
Fastest-Growing Occupations .............................................................. 11
What’s Next? ......................................................................................... 14
Background & Methodology .................................................................15
Defining the Creative Economy .......................................................... 16
Creative Industries and Creative Occupations ................................. 17
Occupations and Industries Included in this Report ....................... 17
Data Source .......................................................................................... 18
Geography ............................................................................................. 18
A Deep Dive Into Creative Occupations ..............................................19
There’s Something Special About Seattle: The Competitive Effect . 27
Job Concentration ................................................................................. 29
Earnings .................................................................................................. 31
Self-Employed Arts, Design, Entertainment and Media Workers in Seattle ..................................................................... 33
Demographics ....................................................................................... 35
Where Creatives Work .......................................................................... 39
Industries Employing Creative Workers ............................................. 40
In-Demand Skills.................................................................................... 44
The Economic Impact of Creative Industries......................................49
Gross Regional Product ....................................................................... 51
Earnings .................................................................................................. 52
Sales ........................................................................................................ 53
Export-Oriented Creative Industries ................................................... 54
Appendix .................................................................................................59
References ..............................................................................................65
Acknowledgements ...............................................................................66

6 Creative Economy Report
Introduction

7 Creative Economy Report
Why Study the Creative Economy? The Office of Film & Music, Office of Economic Development and Office of Arts & Culture undertook studying the local creative economy because we know that creativity is vital to the health of our economy, both now and in the future.
Seattle is an economic and cultural powerhouse; we consistently rank as a top destination for tourists and as one of the best places to live in the United States. We owe this reputation in large part to the imagination and inventiveness of our local workforce. Not only do creative workers fill our local performance spaces and art galleries, but they are also essential to our booming tech sector, where computer programmers and software developers use creativity in their work every day.
Investing in creative skills and media arts education is important to keeping our workforce strong and competitive for years to come. In a training session for media arts teachers, Tiffany Dockery of Amazon had these words for educators:
The reality is that most of the jobs that we have today may not exist in the future. The indicator that we should keep in mind is that creativity is the one thing that will differentiate those jobs, and relatedly is that most of your students will need to create their own jobs. The extent to which they can do that is based on their ability to think outside of the box, and media arts education is crucial to that endeavor.
At a time of extraordinary change in our city—as the public debates the merits of our tech boom, as many worry about affordability for creative workers, and as we seek to prepare our workforce for the economy of the future—it is more important than ever that we deeply understand creative workers’ contributions to our community as well as the difficult challenges they face. This report is a major step toward building that understanding.
Goals of this ReportWe are excited to introduce this new approach to thinking about the creative economy, knowing that we will continue to measure changes in the labor market and attempt to measure the impact of interventions on our workforce.
In planning, researching, and creating this report, we had three objectives:
1. Define the creative economy: No standard definition exists, so we considered a set of occupations and industries that allow us to use available data to quantify attributes of creative workers and businesses. Our defi- nition of creative economy should always be open to debate and revision, especially as we recognize the continuous, dynamic interplay between technology and creativity.
2. Quantify the creative economy: Using data from a major labor market analytics firm, we used numbers to paint a picture of Seattle’s creative economy. The numbers allow us to identify growing and declining occupa tions, compare earnings, unpack demographic characteristics – though not in as much detail as we should – and quantify some of the economic contributions of creative industries. This research also gives us a base line against which to measure future changes. We recognize that while the numbers may paint a picture, they do not tell the entire story. In fact, as we consider our next steps, we know we must continue to learn from the ac tual people who are spending their lives in creative pursuits.
3. Inspire action: We were our own primary audience for this report, and we undertook this work to help us identify bright spots where we can build momentum, as well as gaps and disparities we can work to close. We also hope to inspire action by other creative economy stakeholders, including re gional policy makers, creative workers, employers, creative advocacy orga nizations, and consumers of creative works.

8 Creative Economy Report
Key Findings

9 Creative Economy Report
Seattle’s creative economy appears strong when viewed in aggregate. Growth in creative occupations is outpacing overall job growth (23% vs. 15%, 2012-2017). We added 4,373 more creative jobs than would be expected if Seattle had followed national trends. At $30.76, the Seattle metro has the second highest cost of living-adjusted, median hourly earnings for creative workers among large and medium metros. Creative industries contribute 18% of Seattle’s gross regional product, compared to 4% of the U.S. gross domestic product. Finally, each new job in a creative industry creates a total of three local jobs.
However, the creative economy is not monolithic. This report provides a series of reminders that data disaggregation is essential if we care about uncovering disparities related to race, gender, and the value society places on the various types of creative work. Our defi-nition includes both high-earning creatives working in computer occupations and low-earning creatives working in arts, design, entertainment and media occupations, the former being the highest paid in the U.S., while the latter are the lowest paid. This disparity is further exacerbated by whether a worker is employed or self-employed.
When we examined the demographic makeup of creative occupations, we found that in most occupational families, people of color are underrepresented, even though overall, they appear to be overrepresented. In aggregate, women are underrepresented in creative occupations, but the disparity varies greatly by occupation. The available data made possible a limited analysis based on race and gender, and it did not allow for any cross-tabulation of multiple attributes.

10 Creative Economy Report
67,350
creative jobs in Seattle
23% creative job growth1
$30.76median hourly earnings2
1 From 2012-2017, compared to 15% growth in all jobs2 Creative workers in the Seattle Metro (2nd highest among large and medium metros)

11 Creative Economy Report
Top 5 Creative Occupations(2017)
Fastest-growing Occupations(2012-2017)
1. 15,728 Software Developers
2. 5,664 Photographers
3. 3,688 Graphic Designers
4. 2,683 Writers and Authors
5. 3,381 Computer Programmers
41.7% Web Developers
37.3% Software & App Developers
31.7% Actors
31.1% Library Technicians
26.5% Writers and Authors
More than half of creative jobs are in Arts, Design, Entertainment, and Media occupations. More than a third are in Computer and Mathematical occupations.
Seattle added 4,373 more creative jobs than would be expected if the city had followed national trends.
Seattle has the lowest earnings3 in arts, design, entertainment and media-related occupations.
Seattle has the highest earnings3 in computer-related occupations.
+
+
$
$
3 Cost-of-living adjusted; among US metros with more than one million people

12 Creative Economy Report
Many populations are underrepresented in the largest creative occupations:
Female workers Underrepresented in 7 of the 10 largest creative occupations
American Indian or Alaska Native workers Underrepresented in 9 of the 10 largest creative occupations
Asian workers Underrepresented in 5 of the 10 largest creative occupations
Black or African American workers Underrepresented in 9 of the 10 largest creative occupations
Hispanic or Latino workers Underrepresented in 8 of the 10 largest creative occupations
Native Hawaiian or Other Pacific Islander Underrepresented in 10 of the 10 largest creative occupations
Workers of two or more races Underrepresented in 9 of the 10 largest creative occupations

13 Creative Economy Report
3x jobs multiplier: Each new job in a creative industry creates a total of three local jobs.

14 Creative Economy Report
$6.75 billionearned by creative industry workers (2017)
$24 billioncreative industry goods and services sold (2017)
18%contribution to Seattle’s GDP (2017)

15 Creative Economy Report
What’s Next? This report’s findings inform the ongoing and future work of the Office of Film & Music, Office of Economic Development, and Office of Arts & Culture in the following areas:
Prepare for the future of work. The Future of Work Subcabinet and inter-departmental Staff Planning Group have been directed by Mayor Durkan to improve economic opportunity for youth in Seattle today, while preparing youth for the economy of the future. With increasing risk of automation for certain occupations, and the rise of the gig economy and non-traditional forms of employment, we need to create a comprehensive youth development system, so youth can build transferable skills and competencies, including entrepreneur-ship, computational thinking, empathy, and creativity. The Creative Economy Report will help inform the Subcabinet’s ongoing work.
Prioritize skills and competency-based education and workforce develop-ment. The City of Seattle and its partners will invest in skills and competen-cy-based education and workforce development programs to prepare young people to use creative skills and get paid. We are moving beyond the popu-lar emphasis on STEM (Science, Technology, Engineering, Math) education to STEAM—including an emphasis on arts.
The Creative Careers Interdepartmental Team, in partnership with the Employ-ment Pathways Interdepartmental Team, is exploring new ways to invest in programs and organizations that provide career-connected learning oppor-tunities for students, youth, and teachers that range from career exposure, awareness and exploration activities to more intensive earn-and-learn models. This includes leveraging current partnerships, such as our relationship with the Creative Advantage, to bring more arts education into classrooms with a focus on building the skills and competencies needed for youth to be competitive in the changing economy. Existing examples include Career Days and “try-a-trade” events in partnership with local employers and the Seattle Colleges, which give youth opportunities to meet industry professionals and learn about the variety of career options that are available. In addition, the team uses labor market data and research reports to inform school curriculum and support communities to build creative workforce programs that meet the needs of our economy.
The City is vastly expanding its capacity to support internal programs and our partner organizations, launch new events and programs, and research what is and is not working to prepare and support our current and future creative workforce.
Further understand the creative workforce and barriers to entry. In 2019, the Office of Arts & Culture (ARTS) and Office of Economic Development will collaborate on an intentional, mixed research method, rigorous Puget Sound regionally-focused creative workforce study with a race and social justice lens. This will be led by ARTS through on-going partnerships with the UW Evans School and Mellon/American Council of Learned Societies funding. We need data that tell us about the lived experiences of creative workers, that give us a macro-level portrait of where our creative workforce resides in the Puget Sound region, what that portrait looks like through an intersectional race, gender, and class lens and analysis, and what the creative jobs of the future might be like. ARTS is interested in identifying barriers at the entry, middle, and established tiers of creative economy work, and designing recommendations for how to increase access for those who historically have been left out.
Understand and communicate the connections between arts and computer occupations. We are expanding our definition of “creative” and work-ing to understand where creativity shows up across occupations. For example, how are creatives in gaming and virtual reality categorized in our occupational data? How can a worker use creative skills in higher-paying creative occupations? Understanding how creative skills and competencies align to form a career pathway can help students and workers reach high-paying occupations.
Continue to collect data. Moving forward, we will track annual changes in creative occupation counts, wages, and demographics; in-demand skills for creative jobs; and the economic impact of creative industries (earnings, sales, jobs multipliers). Continuing to collect and monitor trends will help us understand whether our efforts to increase equity and opportunity are having desired effects.

16 Creative Economy Report
Background & Methodology

17 Creative Economy Report
Defining the Creative Economy While much has been written about the creative economy, a standard definition does not exist. It may seem relatively straightforward to come up with a list of “creative industries” and quantify their economic impact, but as we quickly learned, the creative economy is a much more complex system than a limited set of industries. Creative work takes place across a range of industries, many of which may not fit our notion of “creative.” John Howkins, author of The Creative Economy, defines the creative economy as:
“Economic systems where value is based on imaginative qualities rather than the traditional resources of land, labor and capital. Compared to creative industries, which are limited to specific sectors, the term is used to describe creativity throughout a whole economy.”
(Howkins, 2013).
Our approach focuses primarily on creative occupations, allowing us to examine jobs that use creative skills and produce creative results across all industries. We augment occupational data with estimates of the economic impact of cre-ative industries. By analyzing both creative occupations and industries, we pro-vide a more complete look at the economic impact of creative work than past studies that have focused on limited sets of industries, such as film and music. While we acknowledge that this method is still more limited than Howkins’ sys-temic approach to the creative economy, the availability of high quality labor market data and our ability to analyze demographic, economic, and geographic characteristics of local creative workers led us to conclude that our approach would produce actionable insights about the local creative economy and the people engaged in it.
Future research should focus on more clearly understanding the nuances and interconnected nature of the creative economy, especially the nature of creative work, where creative workers often piece together multiple “gigs,” as well as the relationship between technology and creative work in a city on the forefront of video gaming and virtual/augmented reality.

18 Creative Economy Report
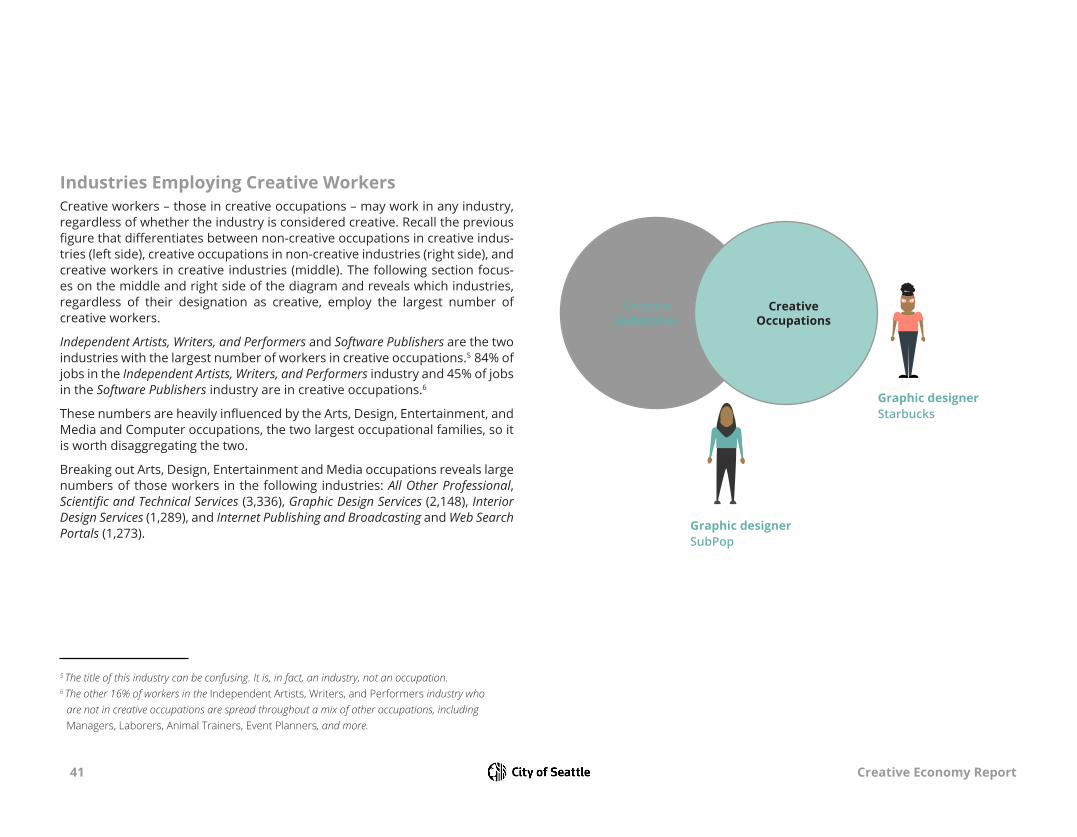
Creative Industries and Creative Occupations The primary way to approach labor market data is through industry and occupa-tional classifications. Industry classifications describe the activities of businesses while occupational classifications describe the activities of workers. Industries generally employ people in many different occupations, from support staff to executives. Similarly, many occupations are found in many different industries. The graphic below provides a framework for thinking about creative industries and occupations.
Accountant
SubPop
Creative Industries
Creative Occupations
Graphic designer
Starbucks
Graphic designer
SubPop

19 Creative Economy Report
Occupations and Industries Included in this Report This report uses a set of 63 Standard Occupational Classifications (SOC) and a set of 55 North American Industry Classification System (NAICS) codes to com-prise our definitions of creative occupations and industries. Complete lists can be found in Appendices 1 and 2.
Occupations The occupational codes are further divided into job families to distinguish between types of occupations. The job families are as follows:
• Management Occupations (SOC 11)
• Business and Financial Occupations (SOC 13)
• Computer and Mathematical Occupations (SOC 15) (hereafter referred to as Computer Occupations)
• Architecture and Engineering Occupations (SOC 17)
• Education, Training, and Library Occupations (SOC 25)
• Arts, Design, Entertainment, Sports, and Media Occupations (SOC 27) (hereafter referred to as Arts, Design, Entertainment and Media Occupations)
• Construction and Extraction Occupations (SOC 47)
• Production Occupations (SOC 51)
References to job families throughout this report refer to the subsets of each job family that we consider creative occupations. For example, the federal gov-ernment’s set of occupations within the Arts, Design, Entertainment, Sports, and Media job family includes several sports-related occupations, such as umpires and coaches. We exclude those and several other occupations, while still using the official job family names to align with the SOC system.

20 Creative Economy Report
Of course, assigning occupations binary designations of “creative” and “non-cre-ative” requires some subjective judgement, which is why we used as a starting point the list of occupations included in the Creative Vitality Suite, a data suite created by the Western States Arts Federation in partnership with our primary data source, Emsi. We narrowed the list to more closely align with the missions and spheres of influence of the Offices of Film + Music, Economic Development, and Arts & Culture. Our definition is more limited than that of Rise of the Creative Class author Richard Florida (he includes all knowledge workers, including healthcare, business, and legal occupations), but more broad than traditional arts occupations.
Our inclusion of tech occupations may provoke debate, especially when consid-ering the outsized impact of the three included occupations (Software Developers, Applications; Computer Programmers; and Web Developers) on the aggregate statistics. However, we would be remiss if in 21st century Seattle we excluded what the Bureau of Labor Statistics calls “the creative minds behind computer programs” (Bureau of Labor Statistics, 2018). Their medium may not be a stage, canvas, or movie screen, but it is becoming increasingly difficult to argue that occupations that design and produce what are essentially audio/visual prod-ucts are drastically different from the occupations included in the Arts, Design, Entertainment and Media job family. To account for tech’s large influence on the aggregate numbers, each step of our analysis drills down into either job families or individual occupations.
Industries The industries included in the report were adapted from a list of industries in-cluded in the City of Bellevue’s recent Creative Economy Strategy as well as a 2013 report by the Creative Economy Coalition, entitled America’s Creative Economy: A Study of Recent Conceptions, Definitions, and Approaches to Measurement Across the USA (Harris, Collins, & Cheek). We consider these industries to have creativity as an essential input that drives economic and/or cultural value.
Data Source Occupation and Industry data come from Economic Modeling Specialists, International (Emsi). By combining traditional government sources for labor market information, such as the Occupational Employment Statistics, American Community Survey, and the Washington State Employment Security Department with data from online social profiles, resumes, and job postings, Emsi provides one of the most complete pictures of our local and national workforce.
The four datasets that comprise Emsi’s “complete employment” set allow us to include employed and self-employed workers whose primary source of income is in creative occupations, as well as workers who earn secondary income from creative occupations. The latter category, which is captured in Emsi’s Extended Proprietor dataset, would not normally be used when analyzing most other oc-cupations and industries, but is essential when estimating the size and impact of the creative economy due to the prevalence of part-time, gig, and freelance work. Without it our analysis would risk severely undercounting creative workers.
Geography Throughout our research, we use the smallest geographic unit for which data are available. In most cases, a collection of zip codes approximates the city of Seattle. For demographic data, we use King County, and for earnings com-parisons to other metros, we use the Seattle-Tacoma-Bellevue Metropolitan Statistical Area.

21 Creative Economy Report
A Deep Dive Into Creative Occupations

22 Creative Economy Report
Most creative jobs are in two job families: Arts, Design, Entertainment and Media occupations and Computer occupations. At 35,161 jobs in 2017, the Arts, Design, Entertainment and Media job family accounts for more than half (52.2%) of Seattle’s 67,350 creative jobs. The largest occupations in the family include Photographers (5,664 jobs), Graphic Designers (3,688), Writers and Authors (3,683), Musicians and Singers (3,265), and Producers and Directors (1,577).
The three occupations included in the Computer job family account for nearly a third (32.3%) of Seattle’s creative jobs. They are Software Developers, Applications (15,728 jobs), Computer Programmers (3,381), and Web Developers (2,647). Software Developers, Applications is also the largest individual occupation included in our list of creative occupations.

23 Creative Economy Report

24 Creative Economy Report
Growth in creative occupations has outpaced Seattle’s overall job growth. Seattle has experienced rapid job growth over the last several years. From 2012 to 2017, the total number of jobs increased by 15.3%, while the number of creative jobs grew by 23.4%.

25 Creative Economy Report
2012 2013 2014 2015 2016 2017
0%
2%
4%
6%
8%
10%
12%
14%
16%
18%
20%
22%
24%
15.29%
23.36%
Percent Increase in EmploymentCity of Seattle, 2012-2017
Source: Emsi 2018.1
Creative Occupations All Occupations

26 Creative Economy Report
Arts and Computer occupations lead job growth.The Arts, Design, Entertainment, and Media and Computer job families accounted for most of the growth, adding 5,539 and 5,422 jobs respectively, but despite adding nearly the same number of jobs, the Arts, Design, Entertainment, and Media jobs family grew at only half the rate of computer-related jobs.
The fastest-growing individual occupations were Web Developers (41.7%), Software Developers, Applications (37.3%), Actors (31.7%), Library Technicians (31.1%), and Writers and Authors (26.5%). Of course, it is also im-portant to compare the number of jobs in each occupation; there were nearly 16,000 Software Developers, Applications in 2017 and just over 900 Actors.

27 Creative Economy Report
Arts, Design, Entertainment, and Media
Computer
Management
Architecture and Engineering
Education, Training, and Library
Construction and Extraction
Production
Business and Financial Operations
5,539 (18.7%)
5,422 (33.2%)
655 (22.2%)
588 (25.1%)
421 (29.2%)
68 (30.9%)
-9 (-3.3%)
44 (3.1%)
Change in Employment by Occupational FamilyCity of Seattle, 2012-2017
Source: Emsi 2018.1

28 Creative Economy Report
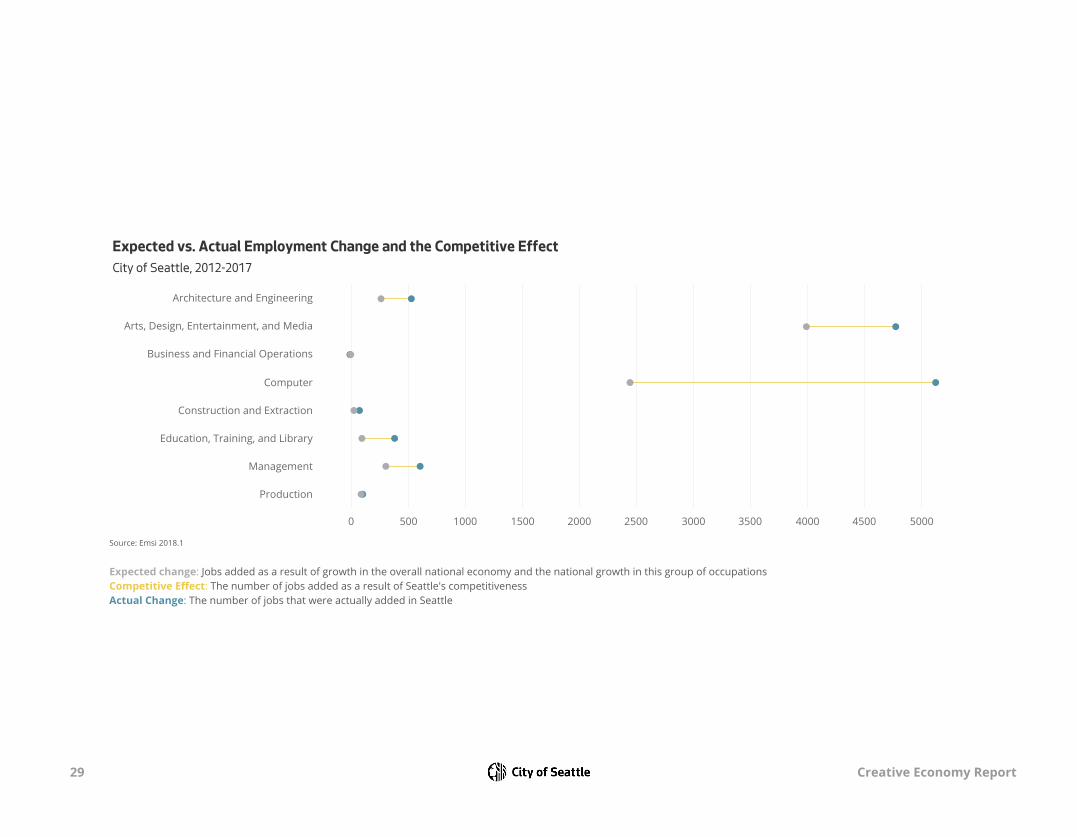
There’s something special about Seattle: the competitive effect. Seattle added 4,373 more creative jobs than would be expected if the city had followed national trends. This conclusion is based on a shift share analysis, which estimates how much local job growth can be attributed to national trends versus local economic conditions. By comparing the actual job change (11,538 jobs actually added) to estimates of expected jobs added or lost if Seattle had followed national trends (7,165 jobs expected to be added), we see that Seattle far exceeded the expected change. This com-petitive effect was particularly pronounced in the Arts, Design, Entertainment, and Media occupations and Computer occupations.
29 Creative Economy Report
0 500 1000 1500 2000 2500 3000 3500 4000 4500 5000
Architecture and Engineering
Arts, Design, Entertainment, and Media
Business and Financial Operations
Computer
Construction and Extraction
Education, Training, and Library
Management
Production
Expected vs. Actual Employment Change and the Competitive EffectCity of Seattle, 2012-2017
Source: Emsi 2018.1
Expected change: Jobs added as a result of growth in the overall national economy and the national growth in this group of occupations.Competitive Effect: The number of jobs added as a result of Seattle's competitivenessActual Change: The number of jobs that were actually added in Seattle

30 Creative Economy Report
Job ConcentrationA location quotient (LQ) analysis allows us to see whether an occupation makes up a larger or smaller share of jobs in Seattle, compared to that occupation’s share of total jobs in the U.S. An LQ of 1.0 means that an occupation’s share of total jobs in Seattle is the same as the occupation’s share of total jobs in the U.S. Higher than 1.0 means that a job is more concentrated in Seattle; lower means it is less concentrated in Seattle.
Looking at the job growth numbers in the previous section, we know both Software Developers, Applications and Actors added jobs in Seattle, but calcu-lating the change in location quotients over the same time period reveals that Software Developers, Applications became more concentrated, while Actors became less concentrated. In fact, all creative occupations in the Computer job family increased their LQ, while the LQ of nearly all Arts, Design, Entertainment and Media occupations declined.
According to Emsi, occupations that fall in the upper, right-hand quadrant of the graph are “’standouts’ that distinguish the regional economy and are doing so more every year—and they are especially important if they are also large in terms of jobs.” They are also likely to see an increase in workforce demand. Occupations in the upper, left-hand quadrant—where most of the Arts, Design, Entertainment and Media occupations appear—are more concentrated in the region, but that concentration is declining. “A large occupation in this quadrant,” according to Emsi, “usually indicates that the major industry employing people in that occupation is in decline” (Economic Modeling Specialists, Inc., 2007).
Both cases deserve our attention if we want to bolster the creative econ-omy. Our expanding recognition of the increasing interconnectedness of technology and creativity should lead us to build on our strengths in computer- related creative occupations. These occupations, with their high wages (more on that in subsequent sections) and steady growth, may be avenues for job seekers who wish to use their creative skills while enjoying the high earnings that technology jobs offer.
At the same time, we should use the insight gained through the location quotient analysis to increase our attention on Arts, Design, Entertainment, and Media occupations. Those occupations bring tremendous value to our community, from music, sculptures, and murals that lift our spirits and enrich our shared experience of living in Seattle, to the graphic designers and pho-tographers who advertise our businesses. And, if we value the contributions of these occupations to our community, we need to ensure that people in those occupations can live and work here.
Throughout the remainder of this report, as we explore data related to wages, geography, demographics, and hiring demand, we dig deeper into the creative occupations in the Arts, Design, Entertainment, and Media and Computer jobs families.

31 Creative Economy Report
-20% -15% -10% -5% 0% 5% 10% 15% 20% 25% 30%Location Quotient Percent Change, 2012-2017
0.0
0.5
1.0
1.5
2.0
2.5
3.0
3.5
4.0
4.5
2012
Loc
atio
n Q
uotie
nt
Furnace, Kiln, Oven, Drier, and Kettle Operators and Tenders
Molders, Shapers, and Casters, Except Metal and Plastic
Public Relations and Fundraising Managers
Shoe and Leather Workers and Repairers
Software Developers, Applications
Multimedia Artists and Animators
Reporters and Correspondents
Plasterers and Stucco Masons
Broadcast News Analysts
Producers and Directors
Tile and Marble Setters
Film and Video Editors
Landscape Architects
Marketing Managers
Library Technicians
Web Developers
Craft Artists
Librarians
Archivists
Curators
1.000
Location Quotient AnalysisCity of Seattle, 2012-2017
Source: Emsi 2018.1
Occupational FamiliesArchitecture and EngineeringArts, Design, Entertainment, and MediaBusiness and Financial OperationsComputer
Construction and ExtractionEducation, Training, and LibraryManagementProduction
2017 Jobs6
5,00010,00015,728

32 Creative Economy Report
EarningsSeattle has the highest paid Computer workers in the nation, lowest paid Arts workers.It’s no secret that workers in Computer occupations are some of Seattle’s most highly-paid and workers in Arts, Design, Entertainment, and Media occupations are not. However, the data reveal a striking disparity in Seattle, beyond that of all other large U.S. metros. When we compared cost-of-living-adjusted, median hourly earnings of the 53 U.S. metros with populations over 1 million, we found that the Seattle-Tacoma-Bellevue metro has the highest paid creatives in Computer occupations ($48.88/hr) and the lowest paid creatives in Arts, Design, Entertainment, and Media occupations ($11.87/hr). For comparison, the metro with the highest-paid creatives in Arts, Design, Entertainment, and Media is Nashville-Davidson–Murfreesboro–Franklin, TN, where the median worker earns $20.68 per hour, after adjusting for cost-of-living. The median metro is San Jose-Sunnyview-Santa Clara, CA, where the median Arts, Design, Entertainment, and Media worker earns a cost-of-living-adjusted $14.77 per hour.
A disparity also exists between employed and self-employed creatives in Arts, Design, Enter- tainment and Media occupations.4 The median hourly earnings for employed workers ranks 9th out of the 53 metros at $25.08, while the earnings for self-employed workers are the lowest of all metros included in the analysis at $9.93.
4 “Self-employed” includes Emsi’s Self-Employed and Extended Proprietor datasets.

33 Creative Economy Report
Computer Management Architecture andEngineering
Education, Training,and Library
Construction andExtraction
Business andFinancial Operations
Production Arts, Design,Entertainment, and
Media
$0
$5
$10
$15
$20
$25
$30
$35
$40
$45
$50$48.69
#20 of 53
$26.26#32 of 53
$22.51#11 of 53
$13.37#53 of 53
$12.78#23 of 53 $11.87
#53 of 53
$48.88#1 of 53
$19.18#1 of 53
Cost-of-Living-Adjusted Median Hourly Earnings and Rank Among 53 Metros with Populations Over 1 millionSeattle-Tacoma-Bellevue, 2017
Source: Emsi 2018.1
34 Creative Economy Report
Self-Employed Arts, Design, Entertainment, and Media Workers in SeattleOne hypothesis of what could be dragging down earnings in Arts, Design, Entertainment, and Media occupations was that a larger share of those jobs in Seattle fall into the self-employed or extended proprietor categories, but that was quickly proven wrong when we discovered that the self-employed/extended proprietor share of total jobs in Seattle was lower in 2017 than across the 53 large metros used in the earnings analysis. Self-employed/extended proprietor jobs also grew at a slower rate in the Seattle metro than in the other large metros.
Seattle’s large disparity between employed and self-employed workers may suggest underutilized talent that is not part of the traditional labor market. If true, some self-employed workers may be able to earn more money by entering the labor market, and employers could access available talent at a reduced cost. Future research should include outreach to self-employed creatives and potential employers to explore reasons for this disparity as well as potential strategies the City could use to help creatives afford to live and work in Seattle.
Suggested research questions include:
• Why are they self-employed? By preference or (perceived) necessity?
• Is creative work a “side hustle?” How much creative work augments or supplements other sources of income?
• Do creatives or their customers undervalue their services? Could they be paid more?
• Are creatives aware of available employment opportunities? Are employers aware of available talent?
The following table contains earnings data for all individual creative occupations in Computer occupations and Arts, Design, Entertainment and Media occupations. Note that the metro compar-isons include data for the Seattle-Tacoma-Bellevue metro, while the tables are specific to the city of Seattle.

35 Creative Economy Report
$0 $10 $20 $30 $40 $50 $60 $70 $80 $90
Software Developers, Applications $61.83Computer Programmers $57.37Web Developers $36.36Technical Writers $32.88Media and Communication Equipment Workers, All Other $32.65Sound Engineering Technicians $31.37Public Relations Specialists $30.80Producers and Directors $28.39Film and Video Editors $25.75Radio Operators $24.32Camera Operators, Television, Video, and Motion Picture $24.26Fashion Designers $23.89Broadcast News Analysts $23.62Commercial and Industrial Designers $22.27Editors $22.16Choreographers $21.78Designers, All Other $20.96Media and Communication Workers, All Other $20.49Multimedia Artists and Animators $20.07Set and Exhibit Designers $18.88Audio and Video Equipment Technicians $18.05Interior Designers $18.02Radio and Television Announcers $17.80Graphic Designers $17.74Broadcast Technicians $16.82Reporters and Correspondents $15.93Entertainers and Performers, Sports and Related Workers, All Oth.. $14.75Art Directors $13.48Dancers $12.59Writers and Authors $12.48Musicians and Singers $12.05Actors $11.75Photographers $11.40Floral Designers $11.13Music Directors and Composers $10.21Artists and Related Workers, All Other $8.70Fine Artists, Including Painters, Sculptors, and Illustrators $7.06Craft Artists $4.78
Median Hourly Earnings of Computer and Arts, Design, Entertainment, and Media OccupationsLine ends signify 10th and 90th percentiles.City of Seattle, 2017
Source: Emsi 2018.1
Arts, Design, Entertainment, and Media Computer

36 Creative Economy Report
DemographicsWomen and people of color are underrepresented in many creative occupations. The City of Seattle strives to center race and social justice in our work by identifying and correcting historical and current inequities. Race and gender disparities in the creative economy are well documented (Florida, 2016). People of color and women face barriers to entering creative occu-pations, including lack of awareness of creative professions and feeling less valued than their white or male colleagues. We also know that decreasing barriers and increasing diversity in the workforce drives more creative and profitable out-comes (Creative Vitality Suite, 2017). To begin to address disparities and barriers, we must first understand who currently participates in our creative occupations, locally.
People of Color in Creative OccupationsWhen we compare representation of people of color in creative occupations to their representation in the overall King County workforce, we find that people of color are underrepresented in most creative occupations. A few notable ex-ceptions include Photographers, where American Indian or Alaska Native and Hispanic workers have above average representation, Musicians and Singers, where Black of African American workers have above average representation, and the three computer occupations, where Asian workers are highly represent-ed. It should be noted that we were not able to disaggregate sub-groups within the Asian category, which did not allow us to capture the fact that some Asian communities are likely underrepresented in computer occupations.
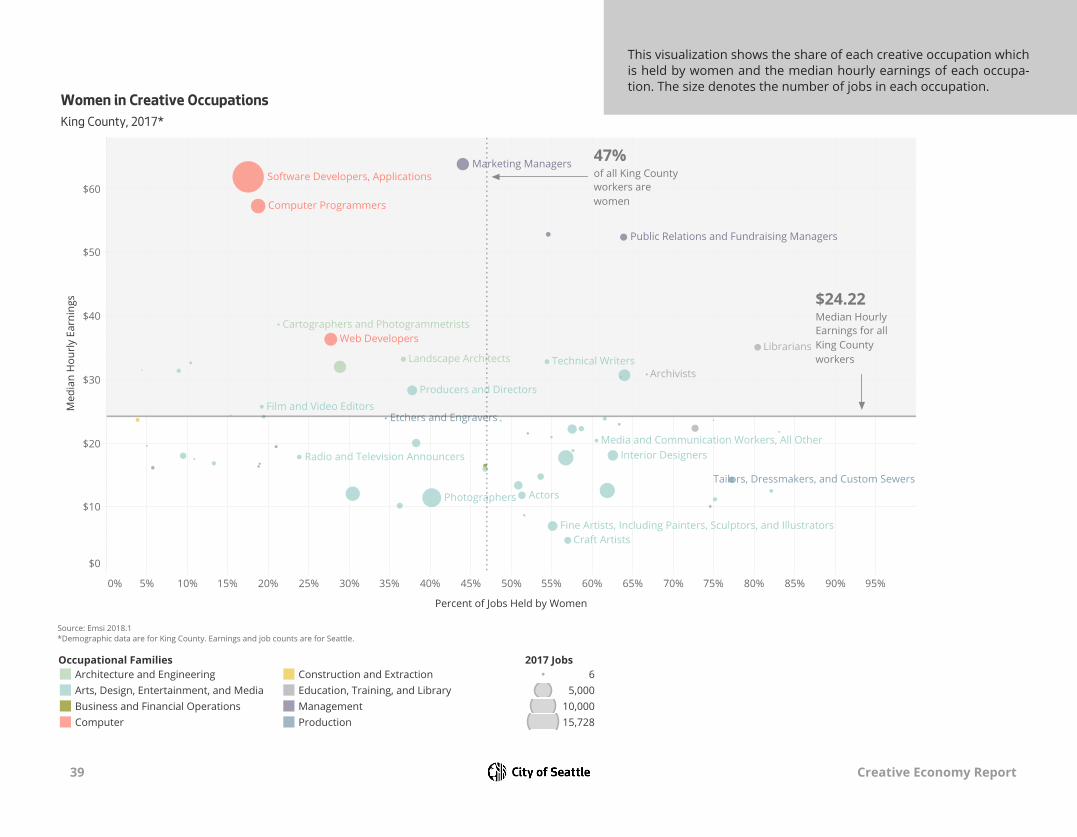
Women in the Ten Largest Creative OccupationsWomen are underrepresented in creative occupations, comprising 46% of the King County workforce, but only 35% of King County creative workers. There is a strong influence from Computer occupations, which employ a large num-ber of workers and an exceptionally low number of women; only 18% of Software Developers, Applications are women. Arts, Design, Entertainment and Media occupations are a more mixed group.
The table following table displays the demographics of the top ten occupations in Seattle by number of jobs. These ten occupations account for two-thirds of all creative jobs in Seattle. The demographic percentages are based on King County, the smallest available geographic unit.

37 Creative Economy Report
Description 2017 JobsAmerican
Indian or AlaskaNative
AsianBlack or African
AmericanHispanic or
Latino
NativeHawaiian orOther Pacific
Islander
Two or MoreRaces
Software Developers, Applications 15,728
Photographers 5,664
Graphic Designers 3,688
Writers and Authors 3,683
Computer Programmers 3,381
Musicians and Singers 3,265
Web Developers 2,647
Marketing Managers 2,424
Architects, Except Landscape and Naval 2,397
Public Relations Specialists 2,207
2%0%3%1%46%0%
0%0%10%0%8%3%
2%0%5%1%14%0%
2%0%3%2%6%0%
2%0%3%2%28%0%
2%0%8%8%6%0%
3%0%5%2%18%0%
2%0%5%2%11%0%
2%0%5%1%13%0%
2%0%5%3%6%0%
Percentage of Jobs Held by People of Color and WomenKing County, 2017*
Source: Emsi 2018.1*Demographic data are for King County. Earnings and job counts are for Seattle.
Blue: Higher than average representation in "All Occupations"Red: Lower than average representation in "All Occupations"
Women
64%
29%
44%
28%
30%
19%
62%
57%
40%
18%
WPK
S*D
BlRe

38 Creative Economy Report
0% 5% 10% 15% 20% 25% 30% 35% 40% 45% 50% 55% 60% 65% 70% 75% 80% 85% 90% 95%
Percent of Jobs Held by People of Color
$0
$10
$20
$30
$40
$50
$60
Med
ian
Hou
rly E
arni
ngs
Fine Artists, Including Painters, Sculptors, and Illustrators
Media and Communication Workers, All Other
Tailors, Dressmakers, and Custom SewersShoe and Leather Workers and Repairers
Cartographers and Photogrammetrists
Advertising and Promotions Managers
Software Developers, Applications
Plasterers and Stucco Masons
Computer Programmers
Producers and Directors
Tile and Marble SettersFilm and Video Editors
Landscape Architects
Marketing Managers
Web Developers
Sewers, Hand
Craft Artists
Librarians
Dancers
$24.22Median Hourly Earningsfor all King County workers
30%of all King County workersare people of color
People of Color in Creative OccupationsKing County, 2017*
Source: Emsi 2018.1*Demographic data are for King County. Earnings and job counts are for Seattle.
Occupational FamiliesArchitecture and EngineeringArts, Design, Entertainment, and MediaBusiness and Financial OperationsComputer
Construction and ExtractionEducation, Training, and LibraryManagementProduction
2017 Jobs6
5,00010,00015,728
This visualization shows the share of each creative occupation which is held by people of color and the median hourly earnings of each occupation. The size denotes the number of jobs in each occupation.
39 Creative Economy Report
0% 5% 10% 15% 20% 25% 30% 35% 40% 45% 50% 55% 60% 65% 70% 75% 80% 85% 90% 95%
Percent of Jobs Held by Women
$0
$10
$20
$30
$40
$50
$60
Med
ian
Hou
rly E
arni
ngs
Fine Artists, Including Painters, Sculptors, and Illustrators
Media and Communication Workers, All Other
Public Relations and Fundraising Managers
Tailors, Dressmakers, and Custom Sewers
Cartographers and Photogrammetrists
Software Developers, Applications
Radio and Television Announcers
Computer Programmers
Producers and DirectorsFilm and Video Editors
Etchers and Engravers
Landscape Architects
Marketing Managers
Interior Designers
Technical Writers
Web Developers
Photographers
Craft Artists
Librarians
Archivists
Actors
47%of all King Countyworkers arewomen
$24.22Median HourlyEarnings for allKing Countyworkers
Women in Creative OccupationsKing County, 2017*
Source: Emsi 2018.1*Demographic data are for King County. Earnings and job counts are for Seattle.
Occupational FamiliesArchitecture and EngineeringArts, Design, Entertainment, and MediaBusiness and Financial OperationsComputer
Construction and ExtractionEducation, Training, and LibraryManagementProduction
2017 Jobs6
5,00010,00015,728
This visualization shows the share of each creative occupation which is held by women and the median hourly earnings of each occupa-tion. The size denotes the number of jobs in each occupation.

40 Creative Economy Report
Creative Jobs as a Percentage of Total Zip Code EmploymentCity of Seattle, 2017
Source: Emsi 2018.1
ZIP
Creative Jobs as aPercentage ofTotal Zip CodeEmployment
2017 CreativeJobs
2017 Arts, Design,Entertainment,and Media Jobs
2017 ComputerJobs
98119
98103
98107
98104
98177
98121
98101
98117
98109
98102
98199
98122
98136
98115
98116
98112
98144
98105
98118
98134
98126
98108
98106
98195
98125
98133 173
99
476
64
375
31
395
65
467
153
123
117
332
52
404
121
427
1,913
92
4,384
2,104
45
3,017
387
3,256
2,327
622
400
583
247
1,027
304
1,270
486
1,080
885
585
521
849
246
1,753
666
1,039
3,057
731
5,160
2,603
421
3,190
2,453
2,181
2,117
1,001
647
1,653
408
1,767
380
2,177
660
1,774
1,246
826
745
1,342
341
2,466
990
1,681
5,998
939
11,569
5,396
524
7,379
3,221
6,094
4,946
3.87%
4.42%
4.58%
4.86%
4.95%
5.57%
5.89%
6.08%
6.79%
8.17%
8.23%
8.81%
8.92%
9.06%
9.21%
10.51%
12.29%
12.41%
12.48%
13.01%
13.98%
14.07%
14.32%
17.20%
18.29%
19.35%
3.87% 19.35%
98177
98117
98107
98199
9811998109
98115
98105
98195
98112
98122
98144
981189810898126
9813698106
9811698134
9810498101
98121
98102
98103
98133
98125
Creative jobs are concentrated in zip codes that include Downtown, South Lake Union, and Northeast Seattle. This map displays cre-ative jobs as a percentage of all jobs in each zip code.
41 Creative Economy Report
Industries Employing Creative WorkersCreative workers – those in creative occupations – may work in any industry, regardless of whether the industry is considered creative. Recall the previous figure that differentiates between non-creative occupations in creative indus-tries (left side), creative occupations in non-creative industries (right side), and creative workers in creative industries (middle). The following section focus-es on the middle and right side of the diagram and reveals which industries, regardless of their designation as creative, employ the largest number of creative workers.
Independent Artists, Writers, and Performers and Software Publishers are the two industries with the largest number of workers in creative occupations.5 84% of jobs in the Independent Artists, Writers, and Performers industry and 45% of jobs in the Software Publishers industry are in creative occupations.6
These numbers are heavily influenced by the Arts, Design, Entertainment, and Media and Computer occupations, the two largest occupational families, so it is worth disaggregating the two.
Breaking out Arts, Design, Entertainment and Media occupations reveals large numbers of those workers in the following industries: All Other Professional, Scientific and Technical Services (3,336), Graphic Design Services (2,148), Interior Design Services (1,289), and Internet Publishing and Broadcasting and Web Search Portals (1,273).
Creative Occupations
Creative Industries
Graphic designer Starbucks
Graphic designer SubPop
5 The title of this industry can be confusing. It is, in fact, an industry, not an occupation. 6 The other 16% of workers in the Independent Artists, Writers, and Performers industry who are not in creative occupations are spread throughout a mix of other occupations, including Managers, Laborers, Animal Trainers, Event Planners, and more.

42 Creative Economy Report
Industry Jobs in Creative Occupations % of Total Jobs in Industry
Independent Artists, Writers, and Performers
Software Publishers
Internet Publishing and Broadcasting and Web Search Portals
All Other Professional, Scientific, and Technical Services
Computer Systems Design Services
Architectural Services
Graphic Design Services
Custom Computer Programming Services
Electronic Shopping and Mail-Order Houses
Colleges, Universities, and Professional Schools (State Government) 4.6%
9.8%
36.0%
78.9%
45.6%
35.4%
58.4%
44.5%
44.9%
84.3%
1,878
2,117
2,144
2,227
2,299
2,855
3,416
4,957
6,417
8,608
Industries Employing Creative WorkersTop 10City of Seattle, 2017

43 Creative Economy Report
IndustryJobs in Arts, Design, Entertainment, and Media
Occupations% of Total Jobs in Industry
Independent Artists, Writers, and Performers
All Other Professional, Scientific, and Technical Services
Graphic Design Services
Interior Design Services
Internet Publishing and Broadcasting and Web Search Portals
Musical Groups and Artists
Electronic Shopping and Mail-Order Houses
Theater Companies and Dinner Theaters
Photography Studios, Portrait
Motion Picture and Video Production 70%
63%
48%
4%
75%
11%
79%
76%
57%
83%
709
760
828
839
873
1,273
1,289
2,148
3,336
8,463
Industries Employing Arts, Design, Entertainment, and Media OccupationsTop 10City of Seattle, 2017
Source: Emsi 2018.1
Breaking out Arts, Design, Entertainment, and Media occupations reveals large numbers of those workers in the following industries:
• Independent Artists, Writers, and Performers (8,463)
• All Other Professional, Scientific and Technical Services (3,336)
• Graphic Design Services (2,148)
• Interior Design Services (1,289)
• Internet Publishing and Broadcasting and Web Search Portals (1,273)

44 Creative Economy Report
Industry Jobs in Computer Occupations % of Total Jobs in Industry
Software Publishers
Internet Publishing and Broadcasting and Web Search Portals
Computer Systems Design Services
Custom Computer Programming Services
Electronic Shopping and Mail-Order Houses
Corporate, Subsidiary, and Regional Managing Offices
Data Processing, Hosting, and Related Services
Colleges, Universities, and Professional Schools (State Government)
Other Computer Related Services
Administrative Management and General Management Consulting Services 3%
33%
1%
18%
4%
4%
33%
33%
27%
39%
338
524
536
828
856
951
1,979
2,639
2,964
5,629
Industries Employing Computer WorkersTop 10City of Seattle, 2017
Source: Emsi 2018.1
A look at Computer occupations reveals large numbers of creative workers in the following industries:
• Software Publishers (5,629)
• Internet Publishing and Broadcasting and Web Search Portals (2,964)
• Computer Systems Design (2,639)
• Custom Computer Programming Services (1,979)
• Electronic Shopping and Mail-Order Houses (951)

45 Creative Economy Report
In-Demand SkillsJob seekers, policy makers, students, and educators need to know what it takes to get into creative jobs, and there is no better source of data than employers themselves. Using software to “read” job postings, we can see exactly what skills employers desire in their employees. Comparing the top technical and common skills in Arts, Design, Entertainment and Media and Computer occupa-tions reveals that while the two job families have very different requirements for technical skills, they share requirements for many common skills. In fact, five out of the top ten most prevalent common skills listed in online job postings are the same.
The Creative Careers Interdepartmental Team (ARTS, Office of Economic Development and Office of Film and Music) is actively collaborating with schools, community organizations, and employ-ers on programs that connect arts education and creative skill building with career exploration in creative fields. Not only is this a sound investment in workforce development, it is also driven by feedback from students themselves – they want more opportunities to make connections be-tween arts, technology, and careers.
These collaborative efforts tie in with the work of Mayor Jenny Durkan’s Future of Work subcabi-net, made up of representatives from several City of Seattle departments tasked with anticipating workforce trends, preparing the next generation of workers and employers for new economic realities, and ensuring that the City as an employer is itself pursuing innovative solutions to culti-vating a skilled workforce.

46 Creative Economy Report
Arts, Design, Entertainment % of Postings Computer % of Postings Media Occupations Listing Skill Occupations Listing Skill
Management 34% Architecture 26%
Communications 33% Management 26%
Writing 22% Communications 19%
Innovation 18% Innovation 19%
Presentations 16% Computer Sciences 18%
Editing 16% Infrastructure 16%
Research 14% Operations 14%
Leadership 13% Problem Solving 13%
Sales 11% Leadership 12%
Problem Solving 8% Integration 11%
Source: Emsi 2018.1

47 Creative Economy Report
As a city, we should increase our efforts to connect employers, educators, and young people to co-design curriculum for learning and creative career exploration that aligns with industry demands.

48 Creative Economy Report
The Creative Advantage, an initiative to restore access to the arts for all Seattle Public Schools students by 2020, provides structure for connecting what young people are learning in the classroom with the expertise and perspective of professionals in creative jobs. This connection gives young people a chance to make informed choices about potential career paths, while also giving creative employers a chance to influence curriculum so that students learn the most relevant content and strategies and are properly prepared to enter into creative occupations.
Tactics have included:
Career Days: half-day events that bring youth ages 16-24 together with working professionals in various creative disciplines.
Media Arts Try-a-Trade event (Feb. 2018): brought Seattle high schoolers to Seattle Central College to learn from students in the Visual Media program at SCC’s Creative Academy.
Media Arts Skills Center (launched June 2017): with support from the Paul Allen Foundation, and as a part of the Creative Advantage programming, Seattle Public Schools introduced a new skills center for high schoolers pursuing Career & Technical Education.

49 Creative Economy Report
I have no clue if media is a stable or reliable field to consider a career in. However, an internship in technology that relates to some sort of graphic production sounds interesting. I also am very interested in photography, which is something that I put a lot of effort into outside of school as well as in. I think photography would be my current first choice in a career path, but again, I’m not too certain on it’s reliability.
–High School Student (Nguyen-Akbar & Reyes, 2018)

50 Creative Economy Report
The Economic Impact of Creative Industries

51 Creative Economy Report
The remainder of the report shifts from creative occupations (what people do) to creative industries (what firms do) and uses a set of traditional economic measures to quantify their impact. Here we examine the contributions of firms in creative indus-tries—those for which creativity is an essential input—to the local economy. It should be noted that this section necessarily includes contributions of all the various occupations needed to run a business, both creative and non-creative.
Creative Occupations
Creative Industries
Graphic designer SubPop
Accountant SubPop

52 Creative Economy Report
City of Seattle GRP U.S. GDP
$16,498.5B
$760.4B
$67.3B
$14.5B
Creative Industries' Contribution to Gross Regional ProductCity of Seattle vs. U.S., 2017
Source: Emsi 2018.1
Creative Industries All Other Industries
Gross Regional Product Nearly 18% of Seattle’s gross regional product comes from creative industries. For comparison, creative industries account for only 4.4% of the U.S. gross domestic product.
53 Creative Economy Report
Software Publishers
Internet Publishing and Broadcasting and Web Search Portals
Architectural Services
Advertising Agencies
Independent Artists, Writers, and Performers
Graphic Design Services
Television Broadcasting
Museums
Radio Stations
Theater Companies and Dinner Theaters
$3,046,345,042
$2,074,256,924
$374,917,861
$199,112,008
$109,066,975
$96,660,474
$93,679,898
$58,444,584
$56,485,074
$50,230,189
Creative Industry EarningsTop 10City of Seattle, 2017
Source: Emsi 2018.1
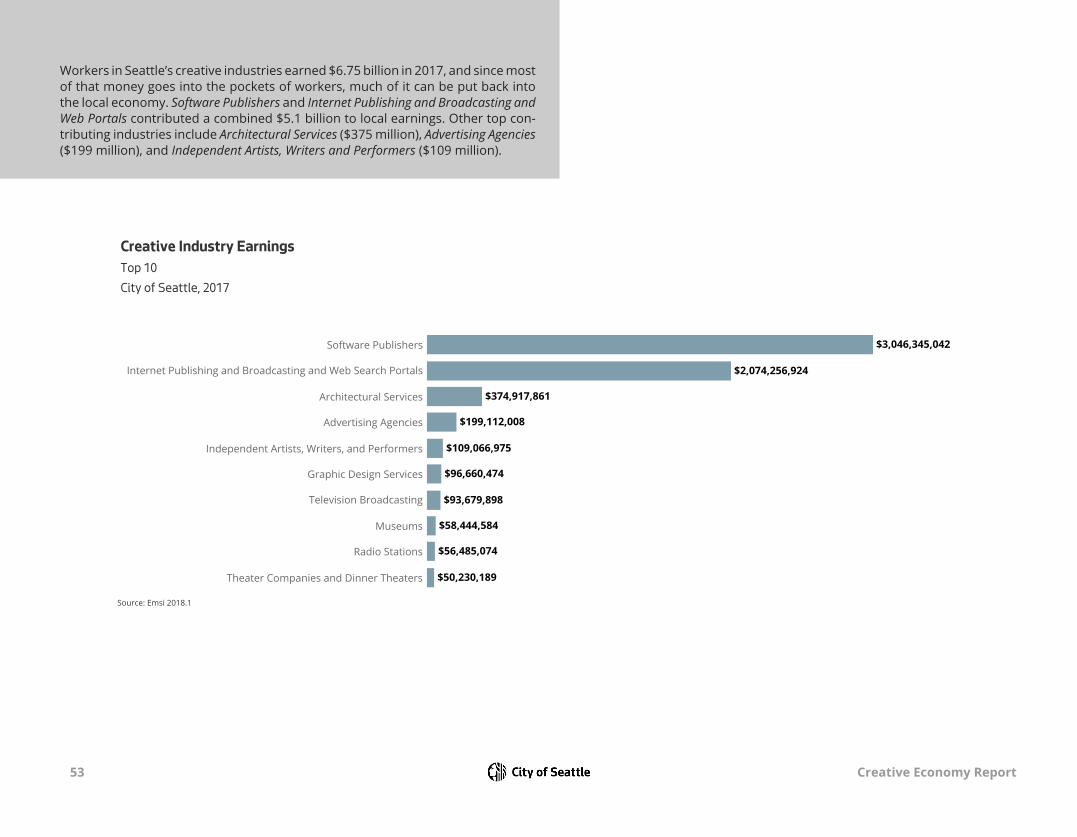
Workers in Seattle’s creative industries earned $6.75 billion in 2017, and since most of that money goes into the pockets of workers, much of it can be put back into the local economy. Software Publishers and Internet Publishing and Broadcasting and Web Portals contributed a combined $5.1 billion to local earnings. Other top con-tributing industries include Architectural Services ($375 million), Advertising Agencies ($199 million), and Independent Artists, Writers and Performers ($109 million).

54 Creative Economy Report
Software Publishers
Internet Publishing and Broadcasting and Web Search Portals
Architectural Services
Advertising Agencies
Television Broadcasting
Radio Stations
Graphic Design Services
Independent Artists, Writers, and Performers
Motion Picture and Video Production
Periodical Publishers
$11,777,391,817
$7,047,080,012
$841,438,641
$660,557,543
$527,334,292
$312,577,968
$194,914,163
$184,680,654
$175,481,060
$173,623,984
Creative Industry SalesTop 10City of Seattle, 2017
Source: Emsi 2018.1
Creative industries sold $24 billion worth of goods and services in 2017. 78% of those sales came from Software Publishers and Internet Publishing and Broadcasting and Web Search Portals.

55 Creative Economy Report
Exported Sales % of Total Sales
Software Publishers
Dance Companies
Internet Publishing and Broadcasting and Web Search Por..
Jewelry and Silverware Manufacturing
Architectural Services
Theater Companies and Dinner Theaters
Museums
Zoos and Botanical Gardens
Industrial Design Services
Musical Instrument Manufacturing 72%
76%
77%
79%
79%
82%
85%
86%
86%
87%
$7,968,573
$64,252,983
$41,358,188
$124,206,038
$133,380,364
$689,932,045
$10,695,261
$6,052,628,633
$41,061,554
$10,195,183,356
Export-Oriented Creative IndustriesTop 10 by Percent of Total Sales ExportedCity of Seattle, 2017
Source: Emsi 2018.1
Industries that export their goods and services outside the city and those that bring outside money into the city through tourism are essential to economic growth. By selling software or jewelry to customers outside Seattle, export-oriented industries inject new dollars into the city’s economy. Similarly, when tourists and visitors spend money at the Paramount or MoPOP, they add new dollars to our economy. In total, creative industries exported $18.7 billion in goods and services, or 78% of their total sales.

56 Creative Economy Report
Three Jobs for the Price of One: The Multiplier EffectEvery time Seattle adds a new creative industry job, two additional jobs are added to the local economy. This is known as the multiplier effect. Money spent and jobs created in one sector create demand for additional goods and services, and therefore jobs, in other areas of the economy. There are three levels of this ripple effect captured in the multiplier after the initial job is counted. Below is a simplified explanation of what the multiplier measures. Multipliers can also be calculated for earnings and sales.
Direct Primary industries purchase from secondary industries.
Indirect Secondary industries purchase from tertiary industries.
Induced Workers spend their paychecks in the local economy, businesses grow and make new investments, government spends to support the growth.
For example, the Motion Picture and Video Production industry in Seattle spent nearly $1 million to purchase goods and services from the Teleproduction and Other Postproduction industry in 2016, and nearly 100% of those purchases were made in Seattle (direct effect). The Teleproduction and Other Postproduction industry spent money in other industries, such as Lawyers, Advertising Agencies, Motion Picture Theaters, and Television Broadcasting (indirect).

57 Creative Economy Report
3.16 1.74 1.67 Jobs Multiplier Earnings Multiplier Sales Multiplier
Multiplier Type Jobs Earnings Sales
Initial 1.00 1.00 1.00
Direct 0.67 0.30 0.24
Indirect 0.27 0.09 0.07
Induced 1.22 0.35 0.35

58 Creative Economy Report
NAICS Description 2017 Jobs Multiplier7
515210 Cable and Other Subscription Programming 3.90
511210 Software Publishers 3.31
519130 Internet Publishing and Broadcasting and Web Search Portals 3.02
515120 Television Broadcasting 2.65
515111 Radio Networks 2.37
423410 Photographic Equipment and Supplies Merchant Wholesalers 2.31
515112 Radio Stations 2.27
711120 Dance Companies 2.14
512250 Record Production and Distribution 2.01
541810 Advertising Agencies 2.00
Creative Industries with the Highest Jobs Multipliers City of Seattle
7 The jobs multiplier includes the initial job plus the additional jobs created. A multiplier of 3 includes the initial job plus two additional jobs created in the local economy.

59 Creative Economy Report
Appendix

60 Creative Economy Report
SOC Description 2012 Jobs 2017 Jobs 2017 Location Quotient Median Hourly Earnings
11-2011 Advertising and Promotions Managers 306 362 2.20 $52.86
11-2021 Marketing Managers 1,945 2,424 2.24 $63.83
11-2031Public Relations and Fundraising Managers
698 818 3.11 $52.49
13-1011Agents and Business Managers of Artists, Performers, and Athletes
275 266 1.34 $16.49
15-1131 Computer Programmers 3,008 3,381 2.61 $57.37
15-1132 Software Developers, Applications 11,458 15,728 4.65 $61.83
15-1134 Web Developers 1,868 2,647 2.61 $36.36
17-1011Architects, Except Landscape and Naval
1,910 2,397 3.52 $31.98
17-1012 Landscape Architects 350 429 3.39 $33.29
17-1021Cartographers and Photogrammetrists
76 98 1.53 $38.65
25-4011 Archivists 48 75 2.30 $30.91
25-4012 Curators 85 111 2.14 $30.41
25-4013Museum Technicians and Conservators
91 113 2.26 $22.98
25-4021 Librarians 565 711 1.44 $35.18
25-4031 Library Technicians 637 835 1.80 $22.27
25-9011Audio-Visual and Multimedia Collections Specialists
13 14 0.35 $23.61
27-1011 Art Directors 962 1,175 1.84 $13.48
27-1012 Craft Artists 667 800 1.69 $4.78
27-1013Fine Artists, Including Painters, Sculptors, and Illustrators
1,276 1,526 1.73 $7.06
27-1014 Multimedia Artists and Animators 908 1,139 2.63 $20.07
Appendix 1 Creative Occupations and Selected Statistics

61 Creative Economy Report
SOC Description 2012 Jobs 2017 Jobs 2017 Location Quotient Median Hourly Earnings
27-1019Artists and Related Workers, All Other
94 115 1.11 $8.70
27-1021Commercial and Industrial Designers
390 467 1.65 $22.27
27-1022 Fashion Designers 219 263 1.89 $23.89
27-1023 Floral Designers 284 296 0.92 $11.13
27-1024 Graphic Designers 3,082 3,688 2.09 $17.74
27-1025 Interior Designers 1,477 1,732 2.82 $18.02
27-1027 Set and Exhibit Designers 137 159 1.78 $18.88
27-1029 Designers, All Other 91 108 1.75 $20.96
27-2011 Actors 704 928 1.66 $11.75
27-2012 Producers and Directors 1,397 1,577 2.46 $28.39
27-2031 Dancers 239 245 2.12 $12.59
27-2032 Choreographers 68 73 1.87 $21.78
27-2041 Music Directors and Composers 504 567 1.17 $10.21
27-2042 Musicians and Singers 2,806 3,265 1.59 $12.05
27-2099Entertainers and Performers, Sports and Related Workers, All Other
622 701 1.39 $14.75
27-3011 Radio and Television Announcers 343 338 1.92 $17.80
27-3021 Broadcast News Analysts 82 81 2.12 $23.62
27-3022 Reporters and Correspondents 451 499 1.86 $15.93
27-3031 Public Relations Specialists 1,908 2,207 2.01 $30.80
27-3041 Editors 1,138 1,400 1.56 $22.16
27-3042 Technical Writers 321 378 1.42 $32.88
27-3043 Writers and Authors 2,912 3,683 1.84 $12.48
27-3099Media and Communication Workers, All Other
197 227 1.36 $20.49
27-4011Audio and Video Equipment Technicians
551 670 1.59 $18.05
27-4012 Broadcast Technicians 284 282 2.00 $16.82
Appendix 1 cont’d. Creative Occupations and Selected Statistics

62 Creative Economy Report
SOC Description 2012 Jobs 2017 Jobs 2017 Location Quotient Median Hourly Earnings
27-4013 Radio Operators <10 <10 1.60 Insf. Data
27-4014 Sound Engineering Technicians 237 282 2.61 $31.37
27-4021 Photographers 4,732 5,664 1.49 $11.40
27-4031Camera Operators, Television, Video, and Motion Picture
207 227 1.47 $24.26
27-4032 Film and Video Editors 205 255 1.18 $25.75
27-4099Media and Communication Equipment Workers, All Other
122 138 1.47 $32.65
47-2044 Tile and Marble Setters 186 249 0.76 $23.69
47-2161 Plasterers and Stucco Masons 33 38 0.30 $31.51
51-6041Shoe and Leather Workers and Repairers
90 76 0.83 $16.82
51-6051 Sewers, Hand 128 112 1.20 $10.02
51-6052Tailors, Dressmakers, and Custom Sewers
626 662 1.38 $14.33
51-7011 Cabinetmakers and Bench Carpenters 177 195 0.42 $16.20
51-7021 Furniture Finishers 99 96 0.86 $16.34
51-7031 Model Makers, Wood <10 <10 0.87 Insf. Data
51-9051Furnace, Kiln, Oven, Drier, and Kettle Operators and Tenders
38 44 0.58 $17.61
51-9151Photographic Process Workers and Processing Machine Operators
82 81 0.78 $21.55
51-9194 Etchers and Engravers 49 72 1.29 $23.94
51-9195Molders, Shapers, and Casters, Except Metal and Plastic
151 145 0.68 $19.42
Appendix 1 cont’d. Creative Occupations and Selected Statistics

63 Creative Economy Report
NAICS Description 2012 Jobs 2017 Jobs 2017 Jobs Multiplier
332323 Ornamental and Architectural Metal Work Manufacturing
112 99 1.58
334614 Software and Other Prerecorded Compact Disc, Tape, and Record Reproducing
19 16 1.15
337212 Custom Architectural Woodwork and Millwork Manufacturing
12 <10 1.43
339910 Jewelry and Silverware Manufacturing 106 100 1.18
339992 Musical Instrument Manufacturing 76 110 1.23
423410 Photographic Equipment and Supplies Merchant Wholesalers
59 23 2.31
424920 Book, Periodical, and Newspaper Merchant Wholesalers
133 105 1.46
451140 Musical Instrument and Supplies Stores 133 137 1.29
451211 Book Stores 678 614 1.29
453920 Art Dealers 555 575 1.21
511110 Newspaper Publishers 1,176 929 1.42
511120 Periodical Publishers 730 713 1.69
511130 Book Publishers 650 544 1.52
511191 Greeting Card Publishers 54 56 1.38
511199 All Other Publishers 66 72 1.52
511210 Software Publishers 12,520 14,295 3.31
512110 Motion Picture and Video Production 959 1,010 1.54
512120 Motion Picture and Video Distribution 42 13 1.50
512131 Motion Picture Theaters (except Drive-Ins) 337 419 1.28
512132 Drive-In Motion Picture Theaters <10 <10 1.31
512191 Teleproduction and Other Postproduction Services
81 167 1.66
512199 Other Motion Picture and Video Industries 15 27 1.43
512230 Music Publishers 29 61 1.55
512240 Sound Recording Studios 201 194 1.54
512250 Record Production and Distribution 115 131 2.01
512290 Other Sound Recording Industries 12 15 1.47
515111 Radio Networks 408 338 2.37
Appendix 2 Creative Industries and Selected Statistics

64 Creative Economy Report
NAICS Description 2012 Jobs 2017 Jobs 2017 Jobs Multiplier
515112 Radio Stations 781 769 2.27
515120 Television Broadcasting 1,036 1,009 2.65
515210 Cable and Other Subscription Programming 109 54 3.90
519110 News Syndicates 171 96 1.38
519120 Libraries and Archives 227 132 1.30
519130 Internet Publishing and Broadcasting and Web Search Portals
5,132 11,150 3.02
532282 Video Tape and Disc Rental 257 74 1.44
541310 Architectural Services 4,175 5,037 1.69
541320 Landscape Architectural Services 472 559 1.48
541410 Interior Design Services 1,268 1,640 1.18
541420 Industrial Design Services 374 491 1.59
541430 Graphic Design Services 2,557 2,824 1.23
541490 Other Specialized Design Services 241 219 1.18
541810 Advertising Agencies 2,535 2,524 2.00
541921 Photography Studios, Portrait 971 1,214 1.17
541922 Commercial Photography 780 921 1.17
611610 Fine Arts Schools 1,057 1,571 1.10
711110 Theater Companies and Dinner Theaters 1,402 1,741 1.92
711120 Dance Companies 363 397 2.14
711130 Musical Groups and Artists 891 1,164 1.91
711190 Other Performing Arts Companies 0 0 0.00
711310 Promoters of Performing Arts, Sports, and Similar Events with Facilities
1,084 1,867 1.62
711320 Promoters of Performing Arts, Sports, and Similar Events without Facilities
503 522 1.94
711410 Agents and Managers for Artists, Athletes, Entertainers, and Other Public Figures
378 417 1.77
711510 Independent Artists, Writers, and Performers
8,748 10,212 1.09
712110 Museums 1,303 1,496 1.42
712120 Historical Sites <10 <10 1.34
712130 Zoos and Botanical Gardens 424 412 1.52

65 Creative Economy Report
ReferencesBureau of Labor Statistics. (2018, April 13). Software Developers.
Retrieved from Occupational Outlook Handbook: https://www.bls.gov/ooh/Computer-and-Information-Technology/Software-developers.htm
Creative Vitality Suite. (2017, October 6). Creative Occupations: Diversity in the Arts. Retrieved from Creative Vitality Suite: https://cv-
suite.org/2017/10/06/diversity-in-the-arts/
Economic Modeling Specialists, International. (2007). Understanding Location Quotient. Retrieved from Emsi Resource Library: https://www.
economicmodeling.com/wp-content/uploads/2007/10/emsi_under-standinglq.pdf
Florida, R. (2016, May 9). The Racial Divide in the Creative Economy. Retrieved from CityLab: https://www.citylab.com/life/2016/05/
creative-class-race-black-white-divide/481749/
Harris, C., Collins, M., & Cheek, D. (n.d.). America’s Creative Economy: A Study of Recent Conceptions, Definitions, and Approaches. Retrieved
from https://www.arts.gov/sites/default/files/Research-Art-Works-Milwaukee.pdf
Howkins, J. (2013). The Creative Economy: How People Make Money From Ideas. Penguin UK.
Nguyen-Akbar, M., & Reyes, R. (2018). Creative Strategies for Career Connected Learning: Youth Voice in the Media Classroom. Seattle:
Office of Arts & Culture.

66 Creative Economy Report
AcknowledgementsThis report was a collaborative effort of the City of Seattle Office of Economic Development, Office of Film & Music,
and Office of Arts & Culture.
John Crawford-Gallagher Researcher and Primary Author
Office of Economic Development
Alex Rose Project Manager and Co-Author
Office of Film & Music
Laura Bet Contributing Author
Office of Economic Development
Sasha Gourevitch Contributing Author
Office of Economic Development
Mytoan Nguyen-Akbar Research Adviser
Office of Arts & Culture
Wynn Barnard Graphic Designer
Office of Economic Development
Many thanks to OFM, OED, and ARTS staff who shaped our creative economy definition and provided input and advice throughout this project.
Thank you to the city of Minneapolis Office of Arts, Culture and the Creative Economy whose 2015 Creative Index report served as a model for this report.

![POSASSNOME PARTECIPANTECLUB MEDIA TEMPO … COLLI.pdf · 115 Caselli Loris Team Cicli Campioli Salvaterra 31.7 Kmh 06h 33m 09.11 14 D [00833] 116 Sorace Giuseppe Jolly - Nota 31.7](https://img.dokumen.tips/doc/110x75/5c6bc8d009d3f216708be1cb/posassnome-partecipanteclub-media-tempo-collipdf-115-caselli-loris-team-cicli.jpg)