Embed Size (px)
Citation preview

156 Journal of Public Health Dentistry
Theoretical Considerations in Applying Benefit -Cost and Cost -Effectiveness Analyses to Preventive Dental Programs*
Linda C. Niessen, DMD, MPH, MPP Veterans Administration Medlcal Center Perry Point MD 21902
Abstract Benefit-cost analysis and cost-effectiveness
analysis can be used to evaluate preventive regimens and aid policy-makers in making resource-allocation decisions. This paper demonstrates the application of benefit-cost and cost-effectiveness analyses to preventive dental programs. The two analyses are defined and described, and the purpose of each technic is compared. For a hypothetical community, four dental preventive programs are described: community water flouridation, school water fluoridation, weekly school-based mouthrinses, and school-based sealants. Benefit-cost ratios and cost-effectiveness ratios are calculated for each program first assuming steady-state conditions, i.e., maximum caries reduction, and then for a 20-year period. Both explicit and implicit costs are included. Underlying assump- tions and limitations, as we// as the effects of changes in caries rates, differential attack rates, and discount rates on the outcome, are discussed. The analysis reveals that community water fluoridation yields the greatest net benefits and most favorable BICand CIE ratios. School water fluoridation and mouthrinsing programs are the next most cost-effective, with similar BIC and CIE ratios when the implicit cost of teachers’ time is omitted from the calculations. The school- based sealant program yields negative net benefits.
Key words: ~enefit-cost analysis, cost-effective- ness analysis, preventive dental programs, fluori- dation, fluorides, sealants.
Introduction Dentists have long recognized the importance of
preventive measures in reducing dental disease, partic- ularly the role of fluoride in reducing dental caries. The institute of Medicine in its Public Policy Options for Better Dental Health has given the highest priority to a public program of preventive dental services (1). Similar policy statements by the American Dental Association and the US Department of Health and Human Services have emphasized the need for disease
*Excerpts ot this paper were presented at the 60th Session, lnternational Association of Dental Research, New Orleans, Louisiana, March 29, 1982.
Chester W. Douglass, DDS, MPH, PhD Harvard School of Dental Medicine Boston MA 021 15
prevention (2, 3, 4). While early dental research examined various
methods for administering fluorides and their effect o n caries reduction, in the last ten years interest has developed in applying benefit-cost analysis to eval- uating various preventive regimens. As government funds become scarcer, policy may dictate that funds be targeted to those programs that provide maximum benefits for the resources expended. Benefit-cost analysis and cost-effectiveness analysis are two technics that can aid policy-makers in such decisions.
This paper will demonstrate the application of benefit -cost analysis and cost-effectiveness analysis to preventive dental programs. I t will describe how the technics are applied presently and illustrate the changes in benefit-cost ratios and cost-effectiveness ratios when one incorporates a 20-year time period into the analysis. The paper will discuss the advantages and limitations of these technics and their applicability to evaluating dental services. Brief Review of Benefit-Cost Analysis and Cost- Benefit Effectiveness Analysis
For the past 50 years, benefit-cost (B/C) analysis has been employed in analyzing water projects. The Flood Control Act of 1936 authorized federal partici- pation in flood-control programs “ . . i f the benefits to whomsoever they may accrue are in excess of the estimated costs” (5). In the 1960’s, benefit-cost analysis was applied to defense projects, and more recently it has been applied to health services (6, 7).
Benefit -cost and cost -effectiveness analyses are analytical tools which can be used to evaluate public expenditure decisions (8). These technics can aid decision-makers in the allocation of scarce resources. The technics of benefit-cost analysis requires that all costs and benefits, tangible and intangible, be enumerated and converted to a common denominator, usually dollars. The aim is to maximize the present value of all benefits less that of all costs, subject to specified constraints. Two characteristics of B/C are the breadth of scope and length of time horizon (9). The breadth of scope refers to the range over which benefits and costs occur, while the time horizon refers to the time period over which the program is evaluated. The objective is to include all costs and all benefits of a program “to whomsoever they accrue” and over as long a period a5 is pertinent and practical (10). Benefit - Cost Analysis
Once the streams of benefits and costs are determined, two decision rules can be applied: maximizing 1) net
Vol. 44, No. 4-Fall 1984
benefits or 2) the benefit-cost ratio. Usually the two methods will yield the same decision. There are cases where the decision rules, however, will yield different results." If this difference occurs, maximizing net benefits is the preferred decision method, with economic theory stating that by choosing the program that yields the maximum net benefits to society, theoretically those receiving the benefits could compensate those who do not. One should keep in mind that with regard to the programs' being evaluated, the maximizing net benefits rule assumes that budgetary constraints are no t a problem and there is sufficient budgetary flexibility to choose among programs.
Enumeration and evaluation of benefits and costs involve decisions about what to include and exclude and at what prices to value them. In the literature on cost-benefit analysis of preventive dental programs, the savings in costs of treating dental caries are usually viewed as the tangible benefits. They are valued at the market price of treating a carious lesion (11, 12).
To simplify the calculations, Davies (13-16), in a series of papers on cost-benefit analysis, suggested this formula for a dental cost-benefit ratio:
cost of implementation of a preventive program savings in cost of treatment
Cost-benefit ratio=
This method continues as the conventional method used by dentists for calculating benefit-cost ratios of dental programs. Indirect and intangible benefits and costs that are difficult to quantify are left out of the analysis(l7). As a result, both the benefits and costs of dental preventive programs are often understated. Additionally, the conventional approach annualizes the costs of the preventive program. Benefits in terms of treatment saved are calculated based on the maximum benefits achieved by a particular method in just one year. For example, children receive the maximum benefits of community water fluoridation when they drink fluoridated water from birth. Studies on community water fluoridation have shown these maximum benefits in caries reduction of 50-70 percent when children drink fluoridated water from birth (18). Studies on the effect of topical fluoride rinse programs have found maximum caries reduction ranging from 20-40 percent (19). While this approach has examined cost-effectiveness and cost-benefits of the fluoride programs when they reach maximum benefits, it does not examine the costs and benefits during the time period prior to reaching maximum benefits. Thus the time horizon has not been incorporated adequately into cost-effectiveness and benefit-cost studies of fluoride programs.
When adequate consideration is not given to the time value of the costs and benefits, the study may overstate the B/C and C/E ratios. Nelson and Swint
157
(20) did incorporate a 20-year time horizon into an examination of the costs and benefits of community water fluoridation and found a lower cost-benefit ratio than that previously reported in similar studies on community water fluoridation. This paper will demonstrate the changes in benefit-cost and cost- effectiveness ratios when the time horizon is incor- porated into the analysis. Cost- Effectiveness Analysis
While B/C analysis is used to make decisions across diverse areas of public expenditure, and is the theoretical ideal, C/E analysis is used to compare alternative means of achieving a desired outcome (21). Cost- effectiveness analysis can be used when it is difficult to measure benefits in dollar terms. For example, if a public agency wishes to achieve a certain amount of data-processing capability, alternative systems can be evaluated to determine which is the lowest-cost method of achieving that capability. Conversely, when the total expenditure for a given purpose is fixed, cost- effectiveness analysis can be used to determine which project is most effective in achieving a certain outcome.
In preventive dental programs, cost-effectiveness analysis is used to determine the cost to save one decayed, missing, or filled tooth or surface (DMFT or DMFS) (22, 23, 24). The technic consists of dividing the costs of a program by the number of carious surfaces prevented using the estimates of maximum benefits for each year. Since the programs do not reach maximum caries reduction in the first year, this approach overestimates the effectiveness in the years prior to reaching maximum caries reduction.
This paper will examine four dental preventive programs in a hypothetical community. Benefit-cost ratios and cost-effectiveness ratios will be calculated first assuming steady-state conditions, i.e., when the programs provide maximum caries reduction. The ratios then will be calculated for each program over a 20-year period. Net benefits will be calculated and the findings will be compared and discussed.
Methods The four dental preventive programs to be examined
Program A: community water fluoridation Program B: school water fluoridation Program C: weekly school-based fluoride mouthrinse Program D: school-based sealant program Since this analysis is being performed for a hypothe-
tical community, some general assumptions are needed about the community prior to performing the analyses. This hypothetical community has 7,000 children in grades K-12 attending six public schools. It should be
are:
"For example, Benefits cost B/C Net Benefits
Program A 8,000 4,000 8,000/ 4,000=2 8,000 - 4,000 = 4,000 15,000/10,000 = 1.5 15,000- 10,000=5,000
Using the maximizing-net benefits rule, one should choose Program B even though Program A shows d higher benefit-cost ratio.
Program B 15,000 10,000

158 Journal of Public Health Dentistry
noted that projecting the school-aged population over an extended period of time and projecting the number of continuous residents in a community is difficult. For purpose of this analysis, it is assumed that although there is d 3.5 percent annual population increase, concomitant declining birth rates will cause the school- aged population to remain constant. Additionally, i t is assumed that all children remain residents of the community, that the community is stable, and all children participating will benefit equally from each program.*
I t is assumed that the water supply contains0.1 ppm natually occurring fluoride. Water is supplied from three sources which will serve as injection sites. The optimum fluoride level for the community is 1.0 ppm based on mean annual maximum daily air temperature (25). Children living in the area and not receiving fluoride supplements o n average develop two decayed surfaces per year (26). The sealant program is school- based with only the first grade (6-year-old) and seventh grade (12-year-old) children participating. The six- year-olds will have only the occlusal surfaces of the four permanent first molars sealed. The twelve-year- olds will have the four occlusal surfaces of the second permanent molars sealed. A team of a dental hygienist and assistant will seal the teeth.
"...Community water fluoridation yields the highest net benefits and has the most favorable benefit-cost ratio and cost- effectiveness ratio suggesting that this is the program of choice for public health officials desiring to reduce dental caries."
The cost of treating a carious surface is $20 per surface (27). Table 1 shows the expected compliance rates and maximum caries-reduction rates that will be used in calculating the benefits and effectiveness of each program. Water fluoridation and school fluoridation (Programs A and B) require the consent of city councils and school boards respectively, thus noncompliance factors are accounted for in the measures of caries reduction. Compliance for these two programs will be considered to be 1.0. Compliance rates of less than one (1.0) for Programs C and D reflect the fact that these programs are voluntarily undertaken only with the knowledge and consent of the children's parents.
The benefits, the number of carious surfaces prevented, first will be calculated for a given year
-One should note that a potential liability of prevention programs is that communities incur costs now but residents receiving the benetits may be lost to thecommunity through migra tion.
assuming a steady-state condition, i.e., the programs are yielding maximum caries reductions (since this has been the convention in the dental literature). A stream of benefits then will be generated over a 20-year period assuming a straight line increase in caries reduction to the point when maximum benefits occur for the fluoride programs. The point when maximum benefits occur will vary for the programs. In the case of systemic fluorides (Programs A and B), based o n the dental literature, maximum caries reduction was assumed to occur after 10 years. For the topical fluoride (Program C), maximum caries reduction was assumed to occur after five years. For the sealant program (Program D), maximum benefits occur in the first year of the program and decrease through year five (28, 29). Since long- term data (greater than seven years) on sealant retention is unavailable, sealant retention rate is assumed to stabilize after five years, Indirect benefits, such as time f rom work needed for dental care, and intangible benefits, such as freedom from pain or disease, will not be quantified, but are assumed to be greater than zero. Thus, any benefit-cost ratio obtained in this analysis represents a lower bound. Both costs and benefits are calculated in constant 1983 dollars. To make comparison possible, they are then discounted to the present using a five percent real rate.*
The Massachusetts Department of Public Health Division of Dental Health was the source of the capital costs and operating costs (30). Capital costs a re amortized over a 10 year period using a five percent discount rate. Capital expenditures for Programs A, B, and D occur twice over a twenty-year period, in years zero and 10. Operating costs include costs for labor, maintenance, chemicals, fluoride rinse/sealant materials, and public education efforts. Annual operating costs are then added to the annualized capital cost to arrive at a total annual cost for each program.
Table 2 lists the capital and operating costs for each program."" The capital costs for Program A are for equipment for three injection sites. The capital costs fo r Program B are for equipment for the six public schools. One portable unit, chair, and operator stools account for the capital costs of Program D. Programs C requires n o capital outlay in order to initiate i t . Program D, the sealant program, has the largest operating costs.
Costs can be categorized a s explicit, i.e., direct program expenditures for capital and operations, and implicit, i.e., the opportunity costs of resources donated o r provided a s n o charge to the program (31). Often the implicit costs are ignored in the analysis. Including the implicit costs in the total cost of a program allows one to gain a clearer perspective of society's true economic commitment to a program. In the case of the school fluoride mouthrinsing program often teachers' time has been considered an implicit cost and excluded in benefit-cost or cost-effectiveness calculations. This
*Five percent real rate is equivalent to a ten percent nominal rate during a time when the inflation rate is five percent,
**See Appendix A for cost breakdowns.

Vol. 44, No. 4-Fall 1984
TABLE 1
159
Compliance Rates, Maximum Canes Reduction Rates, and Years to Reach Maximum Caries Reduction for Each Preventive Program
Proportion Percentages Number of years complying of caries to maximum
Program reduction caries reduction
A Community Water Fluoridation 1 .o 50 (18) 10.0
B School Water FI tioridation 1.0 40 (18,391 10.0 r c School Fluoride Mouthrinse 0.8 (30) 25 (40,41) 5.0
D School -Based Sealant 0.8 (30) 0.77(29) * 1.0**
* represents 82% sealant retention rate X 94% surfaces sound i f sealant retained (29) **caries reduction at a maximum the first year and equals 94%; numberdeclines over the next five years to 77% reduction in years 5-19 (29)
TABLE 2 Annual Program Costs
Annualized Costs* Program Capital Operating Total
A-Community Water Fluoridation B-School Water Fluoridation C-School Mouthrinsing-~i th the cost of teachers’ time** C’-School Mouthrinse Program without cost of teachers time
*See Appendix A for program cost breakdowns **See Appendix B for calculations for cost of teachers’ time
analysis will calculate benefit -cost and cost-effectiveness ratios of school-based mouthrinsing both including and excluding the cost of teachers’time. Teachers’time isvaluedat $lOperhour.Thevalueof students’timeis another example of an implicit cost. Students who spend 10 minutes mouthrinsing give up the opportunity for other activities, Students’ time will not be included in the analysis, howe;er, since there is no consensus on how to value it .
To compare the programs, the streams of costs and benefits generated over 20 years are discounted back to the present. Discounting reflects the time value of money, and the difference between the future value and the present value is determined by the rate of discount. Discounting is different than adjusting for inflation. It derives from the idea that a dollar to be paid today has a higher value than one to be paid one year from now; a dollar received now could be invested to yield more than one dollar in a year. Discounting is used to compare benefits and/or costs occurring in different years. When generating streams of costs and
2,343 3,720 6,063
1,603 6,200 7,803
15,200 15,200
4,000 4,000 1,233 19,180 20,413
benefits in a program where the costs and benefits occur at different time periods, some measure is needed to equate the streams of costs and benefits in order to compare them. Discounting accomplishes this and the convention used is to discount future costs and benefits back to the present. Net benefits are calculated by subtracting the present value of the costs from the present value of the benefits. The program yielding the maximum net benefits is the program of choice.
Results Table 3 shows the benefits and costsfor each program
for a given year in steady state and the present value of the costs and benefits over a 20-year period. With the exception of Program C’, community water fluoridation has the lowest costs. Community water fluoridation also yields the greatest benefits of all the programs both in the steady state and 20-year period. The benefit- cost ratio ranges from 11.55 in a steady state (i.e., $1.00 in cost results in $11.55 worth of benefits) for

160 Journal of Public Health Dentistry
TABLE 3 Benefit-Cost Ratios for Each Program
For Steady-State Year and 20-Year Period
B/C Program Costs I $ 1 Benefits ( $ 1 tiatlo
A Cornmunit> lVater Fluoridation
Steady State l v a r 6,003 70,000 11 55 20 years- . 75,558 b20,910 8 22
n School l\'ater Fluoridation
Steady State \ear 7,803 56.000 7 18 20 vears 57.743 406.727 5 1 1
C School Fluoridc Llouthrinw
I includes cobt o t trachcr 's tiniei Stead!, St,itr 1'~~i i 20 years-.
15.200 28,000 1.84 180,426 301 5 1 8 1 , 5 9
C' School Fluorick \ lnuthrinsr i c . ~ c l u d c ~ ccst o t te. i ihrr 's t imri
StC'dLI!. St'ltc' YC 21. 4,000 28,000 7.00 '0 yea r i . ' 4 9 , w 301,518 6.05
D School- B a d Sv,?i'int Frograni
Steady StLitc l'c.,ii 20,413 18,000 0.88 10 yea r s - ' 251,301 215,767 0.85
'Steady stat? 13 ont-h 'car costs and benetits: assume maximum caries reduction in that \ 'ear '-2O-yeai cost5 anti Ptmrtits arc net present values
TABLE 4 Cost-Effectiveness Ratios for Each Program Steady-State Year and 20-Year Time Period
Carious Cost- Surtaces Ettectivcness
Costs (51 Prevented Ratio i s ) l'r oxrani
A C o m n i u 111 t y \\'a tei- I- I t i or id at 10 n
Steady S t a i r ' Y'pcir 6,063 7,000 0.87 70 >'ear\ ' . 75,558 62,091 1.26
n School \ i , i t ~ r Flut~rii lation
Steady StC>tt" \i>'ir 7,803 5,600 1.30 20 yearc. . 47,243 40.672 1 .?6
L School Fluoi-idation h, louthr inw
~inc ludrs cost of t racher 's t ime)
20 years . ' 188.426 30,151 6.28 S teady Stdtt' hea r 15,200 2.800 5.43
C' School Flu or ide h i out h ri nse (excludes cos t of teacher 's t imcl Steddy Statt.. Yc.ir 4.000 2,800 1.43 20 vea r s - ' 49.849 39.151 1.65
9 School-Based 5ealant Program Steady S ta t e - Year 20,413 7,805 11 31 20 yea r s - ' 254,391 21,576 11 70
'Steady s ta te is one-year costs a n d benefits; assume maximum caries reduction in that year ' "20-year costs a n d surfaces prevented are net present values.

Vol. 44, No. 4-Fall 1984 161
community water fluoridation to 0.88 (i.e., a $1.00 cost results in $0.88 worth of benefits) for the school- based sealant program.
As can be seen in Table 3, when the 20-year time factor is incorporated into the analysis, the resulting ratios are lower. The benefit-cost ratio for community water fluoridation drops from 11.55 to 8.22. This drop reflects the fact that i t takes 10 years before partici- pants start receiving maximum caries reduction, but the program incurs costs during this time. In the case of the topical fluoride and sealant programs, Programs C and D, the difference between the steady state and the 20-year period is less, reflecting the fact that these programs have a smaller time lag between reaching maximum benefits. The benefit-cost ratio is more favorable when the cost of the teachers' time is excluded from the calculations.
Similar results are obtained for the cost-effectiveness ratios (i.e., the cost to prevent one carious surface), as seen in Table 4. Community water fluoridation again is the most cost-effective program, with a steady-state cost of $0.87 per carious surface prevented (i.e., it costs $0.87 to prevent one carious surface). Even when examined over 20 years, the cost-effectiveness ratio for community water fluoridation is only $1.22. Program B shows cost-effectiveness ratios of $1.39 for the steady state and $1.96 for a 20-year period, which is not much higher than community water fluoridation. Program C (including labor costs of teachers) has a cost-effectiveness ratio of $5.43 in steady state and $6.28 for the 20-year period. When one excludes the cost of the teachers' time, however, the cost-effective- ness ratio improves in the steady state to $1.43 and for the 20-year period to $1.65. Of the five programs, the sealant program has the least cost-effective ratios,
$11.31 and $11.79 for the steady state and 20-year period respectively.
Table 5 summarizes the net benefits, benefit-cost ratios and cost-effectiveness ratios for each program. The net benefits decision rule for making public expenditure decisions states that the program yielding maximum net benefits should be chosen. In this case, community water fluoridation yields the highest net benefits and has the most favorable benefit-cost ratio and cost-effectiveness ratio suggesting that this is the program of choice for public health officials desiring to reduce dental caries. School water fluoridation yields considerable larger net benefits than school mouth- rinsing, whether or not the cost of the teachers' time is included. This finding suggests that school water fluoridation should be considered if community water fluoridation is not possible.
Program D, the sealant program, yields negative net benefits, suggesting that the costs exceed the benefits over the 20-year period. This is consistent with a benefit-cost ratio less than one.
Discussion The benefit-cost and cost-effectiveness ratios for
community water fluoridation and school water fluoridation in the steady state are similar to other studies (26, 32). However, the benefit-cost ratios obtained when examining the programs over a 20- year period, are lower and the cost-effectiveness ratios are higher than previously reported (15). The difference results from the fact that previous studies examined the programs only when they yielded maximum benefits while this paper took the latency in achievement of maximum benefits into account. By generating a stream
Table 5 Summary Table
Net Benefits Benefit-Cost Cost-Effectiveness (Benefits-Costs) Ratio Ratio
Net Steady Steady Benefits ($) State ($) 20 yr ($1 State ($) 20 yr i $1 Program
A
1.22 Community Water Fluoridation 545,352 11.55 8.22 0.87
R
399,484 7.18 5.11 1.39 1.96 School Water FI uo ri da t i on
C School Fluoride
6.28 Mouthrinse (inc. teacher's time) 112,092 1.84 1.59 5.43
C' School Fluoride Mouthrinse (excl. teacher's time) 251,669 7.00 6.05 1.43 1.65
D
11.79 School -Based Sealant Program -38,624 0.88 0.85 11.31

162 Journal of Public Health Dentistry
of costs and benefits over a 20-year period, i t can be seen that while the programs generate costs initially, maximum benefits d o not occur until five or 10 years later.
This paper presents the programs as ”either-or” choices. I t is possible to assess the B/C or C/E ratios of a sealant program in a fluoridated community. Given the existence of school-based mouthrinsing and sealants’ occurring in fluoridated communities, this type of analysis would be a logical progression in the application of B/C analysis and C/E analysis to preventive dental programs.
Benefit-cost ratios and cost-effectiveness ratios for Program C1 school fluoride mouthrinsing differ from previously reported work (19). These differences can be attributed to the cost of the teachers’ time, which was included in this analysis. The inclusion of teachers’ time is currently debated. The debate centers on an economic versus accounting approach to the problem. Economic theory states that all costs to society of a program should be included in the analysis. For this reason, this opportunity cost of the teachers’ time should be included in the analysis. The opportunity cost or implicit cost is the value of an individual’s time when employed in the foregone activity. Thus, a teacher who spends 10 minutes on the mouthrinse program spends 10 minutes less teaching other curricular materials. Public decision-makers most commonly see only the accounting costs, however, and tend to overlook the opportunity costs for teachers. This analysis calculated benefit-cost ratios and cost- effectiveness with and without teachers’salaries. If the cost of the teachers’ time is omitted (Program Cl), the C/E ratios, $1.43 for the steady state and $1.65 over the 20-year period, are closer to the $1.00 C/E ratio previously reported (19).
LLlncluding the implicit costs in the total cost of a program allows one to gain a clearer perspective of society’s true economic commitment to a program. ’’ One should keep in mind that this analysis is
hypothetical. A recent review of the dental benefit- cost literature suggests that such analyses tend to underestimate the costs of programs (12). While recognizing the validity of this criticism, this analysis attempted to correct this underestimation by using current cost data from the Massachusetts Department of Public Health for explicit costs and for generating implicit costs. The sealant program costs (Program D) in this analysis averaged approximately $21.26/child/ year which is consistent with the recently reported National Preventive Dentistry Demonstration Program (33). The labor costs of Program D account for the large operating costs of the program. Thus, innovations which will decrease labor costs will increase the net benefits or B/C ratio.
This paper assumed no costs associated with getting parental consent for the children to participate in the programs. In some communities, getting parental consent may require education and administrative costs which should be included in the analysis.
In a hypothetical analysis, while costs are often underestimated, benefits are often overestimated. In undertaking this benefit-cost analysis, the assumptins made are conservative and bias downward the estima- tion of benefits. There are several factors that contribute to this downward bias. First, no attempt was made to quantify intangible benefits or indirect benefits, such as freedom from pain or reduced time lost from work or school to obtain dental care. Since the market price does not factor in these items, one can assume that for those who receive treatment, the benefits are actually greater than the market price. Second, no credit is given to the programs for reduction of extractions, malocclusions or multisurface restorations, which has been documented and all of which are more expensive to treat than single surface restorations (34, 35, 36). Third, in the case of community water fluoridation, the benefits do not include caries reduction occurring in the primary dentition of the children or lifetime benefits accruing to adult members of the community.
Program D can be used to illustrate the effect of this downward bias of benefits. In a steady state year, Program D’s B/C ratio is 0.88, suggesting that for every $1.00 in costs expended, $0.88 in direct benefits is gained. If the indirect and intangible benefits, such as freedom from pain and/or value of sound tooth structure are worth $0.12 per $1.00 in costs expended, the program would yield total benefits at least equal to the costs. Similarly, if a given society valued these indirect and intangible benefits at greater than $38,624 over a 20-year period, the sealant program would yield positive rather than negative net benefits, suggesting that the program be undertaken.
Since the benefits of these preventive programs are biased downward, one may prefer to compare the programs using the cost-effectiveness ratios. Table 5 shows that of the three programs, community water fluoridation is the most cost-effective program. Often public programs require trade-offs to be made between costs and effectiveness. In the case of community water fluoridation, however, no such trade-off is necessary as it provides the most benefits at the least cost of all the programs.
The choice of the type of analysis (B/C versus C/E) will affect the outcome obtained. For example, if the net benefits rule of B/C analysis is used, this analysis suggests that since Program D, the school-based sealant program, yields negative net benefits, this program is not a good investment of public dollars. If, on the other hand, only a C/E analysis is conducted, although Program D has the least effective C/E ratio, for anyone valuing a carious surface saved at greater than $11.79, this program can be considered cost-effective.
Whenever an assumption is made and an input number is identified, i t is useful to know how precise it is. A sensitivity analysis is helpful to perform when
Vol. 44, No. 4-Fall 1984 163
one is uncertain about the accuracy of the input data o r one expects changes over time. By changing the values of a given parameter, one can estimate how sensitive the analysis outcome is to the given parameter. If the relative program rankings change as a result of a change in the value of a certain parameter, the B/C analysis is said to be sensitive to changes in that parameter. For example, since long- term (greater than seven years) data on sealant retention are unavailable, this analysis assumes that the sealant retention rates will stabilize at 82 percent, the five-year level. A sensitivity analysis around this number would illustrate the effect on the B/C and C/E ratios with a change in this variable. Intuitively, one knows that a lower retention rate will worsen the B/C and C/E ratios. The sensitivity analysis will determine how large a change in a variable can be, before it affects the rank ordering of program analysis outcomes.
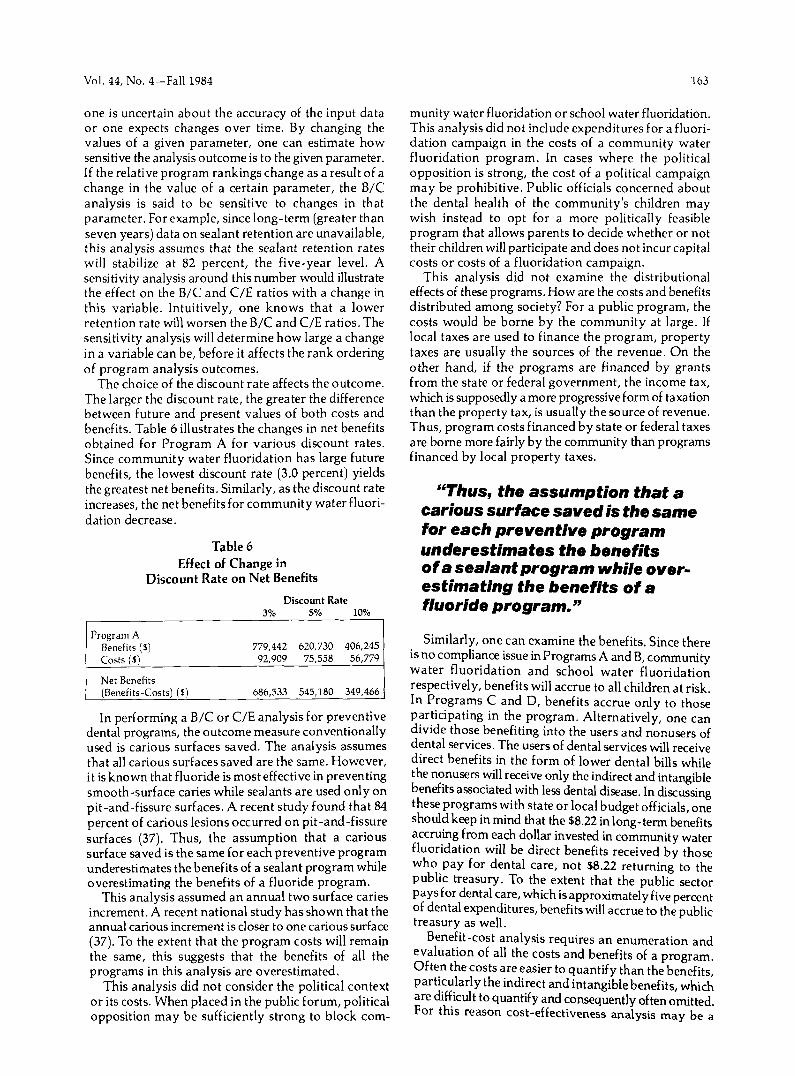
The choice of the discount rate affects the outcome. The larger the discount rate, the greater the difference between future and present values of both costs and benefits. Table 6 illustrates the changes in net benefits obtained for Program A for various discount rates. Since community water fluoridation has large future benefits, the lowest discount rate (3.0 percent) yields the greatest net benefits. Similarly, as the discount rate increases, the net benefits for community water fluori- dation decrease.
Table 6 Effect of Change in
Discount Rate on Net Benefits Discount Rate
3% 5% 10% I
Program A Benefits (S) 779,442 620,730 406,245 costs ($1 92,909 75,558 56,779
Net Benefits (Benefits-Costs) (S) 686,533 545,180 349,466
In performing a B/C or C/E analysis for preventive dental programs, the outcome measure conventionally used is carious surfaces saved. The analysis assumes that all carious surfaces saved are the same. However, i t is known that fluoride is most effective in preventing smooth-surface caries while sealants are used only on pit-and-fissure surfaces. A recent study found that 84 percent of carious lesions occurred on pit-and-fissure surfaces (37). Thus, the assumption that a carious surface saved is the same for each preventive program underestimates the benefits of a sealant program while overestimating the benefits of a fluoride program.
This analysis assumed an annual two surface caries increment. A recent national study hasshown that the annual carious increment is closer to one carious surface (37). To the extent that the program costs will remain the same, this suggests that the benefits of all the programs in this analysis are overestimated.
This analysis did not consider the political context or its costs. When placed in the public forum, political opposition may be sufficiently strong to block com-
munity water fluoridation or school water fluoridation. This analysis did not include expenditures for a fluori- dation campaign in the costs of a community water fluoridation program. In cases where the political opposition is strong, the cost of a political campaign may be prohibitive. Public officials concerned about the dental health of the community’s children may wish instead to opt for a more politically feasible program that allows parents to decide whether or not their children will participate and does not incur capital costs or costs of a fluoridation campaign.
This analysis did not examine the distributional effects of these programs. How are the costs and benefits distributed among society? For a public program, the costs would be borne by the community at large. If local taxes are used to finance the program, property taxes are usually the sources of the revenue. On the other hand, if the programs are financed by grants from the state or federal government, the income tax, which is supposedly a more progressive form of taxation than the property tax, is usually the source of revenue. Thus, program costs financed by state or federal taxes are borne more fairly by the community than programs financed by local property taxes.
“Thus, the assumption that a carious surface saved is the same for each preventive program underestimates the benefits of a sealant program while over- estimating the benefits of a fluoride program. ”
Similarly, one can examine the benefits. Since there is no compliance issue in Programs A and B, community water fluoridation and school water fluoridation respectively, benefits will accrue to all children at risk. In Programs C and D, benefits accrue only to those participating in the program. Alternatively, one can divide those benefiting into the users and nonusers of dental services. The users of dental services will receive direct benefits in the form of lower dental bills while the nonusers will receive only the indirect and intangible benefits associated with less dental disease. In discussing these programs with state or local budget officials, one should keep in mind that the $8.22 in long-term benefits accruing from each dollar invested in community water fluoridation will be direct benefits received by those who pay for dental care, not $8.22 returning to the public treasury. To the extent that the public sector paysfor dental care, which isapproximately five percent of dental expenditures, benefits will accrue to the public treasury as well.
Benefit-cost analysis requires an enumeration and evaluation of all the costs and benefits of a program. Often the costs are easier to quantify than the benefits, particularly the indirect and intangible benefits, which are difficult to quantify and consequently often omitted. For this reason cost-effectiveness analysis may be a
164 Journal of Public Health Dentistry
Table 7
Advantages and Limitations of B/C Analysis
Advantages Limitations
forces decision-makers to examine the problem as a whole forces decision-makers to deal with costs and benefits in a quantitative manner if done well, can improve communication and provide better information forces decision-makers to think about the consequences of their actions decision not based on frivolous grounds may serve as a mediating tool -bringing people of opposing views together to work out disagreements by dissecting the problem provides a framework for contingency planning
more useful method of comparison among the programs since it allows one to compare the costs necessary to prevent one carious surface.
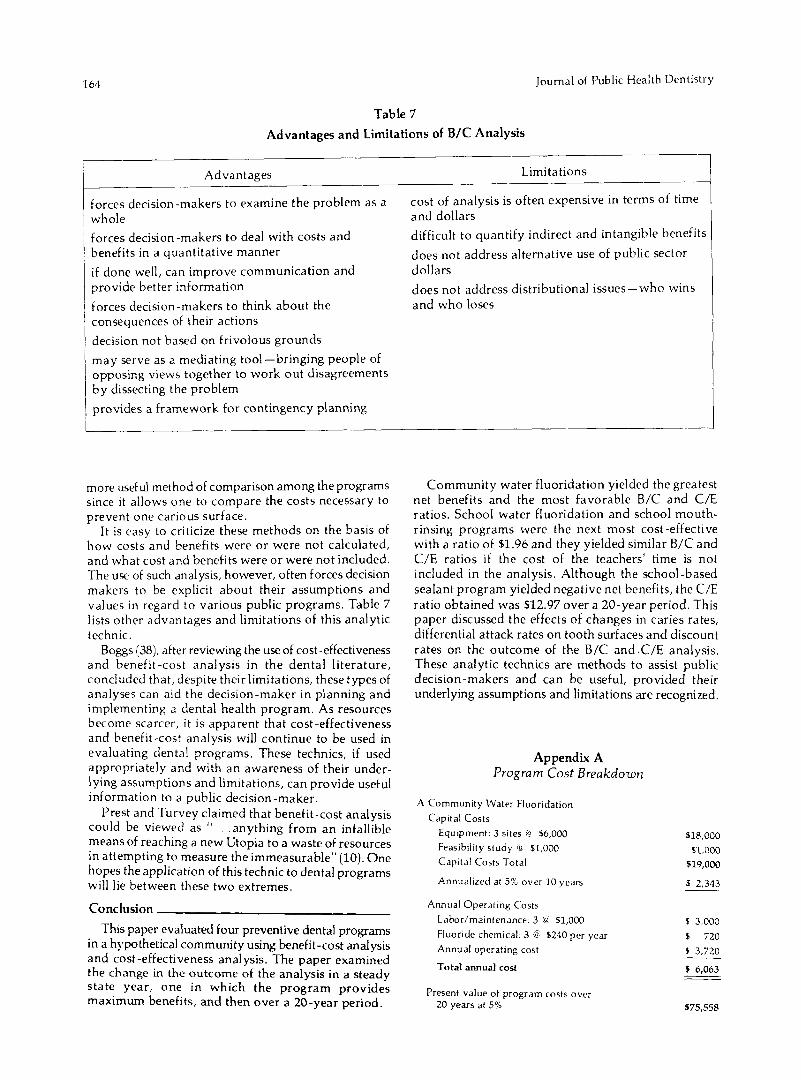
I t is easy to criticize these methods on the basis of how costs and benefits were or were not calculated, and what cost and benefits were or were not included. The use of such analysis, however, often forces decision makers to be explicit about their assumptions and values in regard to various public programs. Table 7 lists other advantages and limitations of this analytic technic.
Boggs (38), after reviewing the use of cost-effectiveness and benefit -cost analysis in the dental literature, concluded that, despite their limitations, these types of analyses can aid the decision-maker in planning and implementing a dental health program. As resources become scarcer, i t is apparent that cost-effectiveness and benefit-cost analysis will continue to be used in evaluating dental programs. These technics, if used appropriately and with an awareness of their under- lying assumptions and limitations, can provide useful information to a public decision-maker.
Prest and Turvey claimed that benefit-cost analysis could be viewed as “ . . .anything from an infallible means of reaching a new Utopia to a waste of resources in attempting to measure the immeasurable” (10). One hopes the application of this technic to dental programs will lie between these two extremes.
Conclusion This paper evaluated four preventive dental programs
in a hypothetical community using benefit-cost analysis and cost-effectiveness analysis. The paper examined the change in the outcome of the analysis in a steady state year, one in which the program provides maximum benefits, and then over a 20-year period.
cost of analysis is often expensive in terms of time and dollars difficult to quantify indirect and intangible benefits does not address alternative use of public sector dollars does not address distributional issues-who wins and who loses
Community water fluoridation yielded the greatest net benefits and the most favorable B/C and C/E ratios. School water fluoridation and school mouth- rinsing programs were the next most cost-effective with a ratio of $1.96 and they yielded similar B/C and C/E ratios if the cost of the teachers’ time is not included in the analysis. Although the school-based sealant program yielded negative net benefits, the C/E ratio obtained was $12.97 over a 20-year period. This paper discussed the effects of changes in caries rates, differential attack rates on tooth surfaces and discount rates on the outcome of the B/C and.C/E analysis, These analytic technics are methods to assist public decision-makers and can be useful, provided their underlying assumptions and limitations are recognized.
Appendix A Program Cost Breakdown
A Community Water Fluoridation Capital Costs
Equipment 3 sites (a $6,000 Feasibility study (a $1,000 Capital Costs Total
Annualized at 5% over 10 years
Annual Operating Costs Labor/maintenancc 3 @ $1,000
Fluoride chemical 3 @ $240 per year Annual operating cost
Total a ~ u a l cost
Present value of program costs over 20 years at 5%
$18,000 $1.000 $19,000
$ 2,343
$ 3,000 s 720 $ 3,720
$ 6,063
$75,558

Vol. 44, No. 4-Fall 1984 165
B School Water Fluoridation Capital Costs
Equipment 6 sites @ $2,000 Feasibility study ti $1,000 Total capital costs
$12,000 $ 1,000 $13,000
Annualized at 5% over 10 years $ 1,603
Annual Operating Costs Labor/maintenance 6 D $1,000 Fluoride chemical Annual operating cost
$ 6,000 $ 200 $ 6,200
Total annual cost 5 7,803
Present value of program costs over 20 years at 5%
C School Fluoride Mouthrinse Capital costs Total capital costs
Annual Operating Costs Fluoride rinse Labor/classroom treatments Education program Dental consultant fee Total annual cost
$97,243
$ 0 $ 0
$ 2,800 $11,200* $ 700 $ 500 $15,200
*See Appendix B for cost of teachers’, hygienists’ and assistants’ time.
Present value of program costs over 20 year period at 5%
C’School Fluoride Mouthrinse Capital costs
Annual Operating Costs Program C costs less cost of teachers’ time: $15,200- $11,200 Total annual cost
Present value of program costs over 20 year period at 5%
D School-Based Sealant Program Capital costs (years 0-10)
Portable unit (AsepticoR), light, chair (ADECR), two stools, compressor
Annual capital costs (annualized at 5% over 10 years
Annual operating expenses Labor* Supplies/Instruments Annual operating expenses
Total annual costs
Present value of program costs over 20-year period at 5%
Appendix B Calculations for Costs of Teachers’ Time
80 percent of 7,000 children=5,600 children
5,600 childredyear X 36 weeks/year=201,600 treatmentdyear 201,600 child treatments =6,720 classroom treatments 30 children/classroom
(6,720 treatments) (10 minutes per treatment)=67,200 minutes=l,lZO hours 1,120 hours classroom treatments X $10 per labor hour=$11,200
Cost of teachers’ time=$11,200
Calculations for Cost of RDH and DA’s Time 1200 children in grade 1 and grade 7 X 80% participation=960 children in program
4 surfaces X 10 minutes/surface=40 minutes/child 40 minutedchild X 960 children=38,400 minutes or 640 hours
640 hours clinical time + 120 hours administrative time =760 hours total of RDH and DA for grade 1 and grade 7
RDH=760 hours X $15/hour=$11,400 DA=760 hours X $8/hour =$6,080
$17,480
5189,426
$ 0
5 4,000 5 4,000
$49,849
$10,000
$ 1,233
$17,480 5 1,700 $19.180
520,413
5254,391

166 Journal of Public Health Dentistry
Appendix C Calculations of BIC and CIE Ratios
over a 20- Year Time Period
PROGRAM A Benefits and effectiveness calculations for 20-year period
(in constant 1982 dollars)
number of surfaces Present Present restored Cost value of value (50"a O t saved costs' of
9" Carious children X $20 restoring (5% discount carious caries surfaces see '1 teeth rate) surtaces
Year reduction saved dentisti ( $ 1 is, saved
0 5 700 350 7,000 7,000 700 1 10 1.400 700 14.000 13,333 1,333
15 2,100 1,050 21,000 19,091 1,900
4 25 3,500 1,750 35,000 28.680 2,860
7
3 20 2,800 1,400 28,000 24,138 2,414
3 30 4,200 7.100 42,000 32,813 3,281 0 35 4,900 2,150 1~,000 30,567 3,657 I
40 5,600 2,800 56,000 39,710 3,072 8 15 0.300 3,150 03,000 42,568 4,257 I) 50 7,000 3,500 70,000 45,161 4.516
10-10 50 7,000 3,500 70,000 331,834 33,183 TOTAL 620,910 62,091
x 20- l e a r I'rogrdm Costs = $75,558
r=interest rate t =yea r
X'payment PV=present value
Program B -School Water Fluoridation Benefits and Costs Calculations for 20-Year Period
(in constant 1982 dollars)
Present 4 surtaces Cdses Present value
0 Carious restores X 920 saved value of car lo us caries surtaces (50% of rest o r ing of costs saved su rt a L es
Ltar reduction saved children) (5% rate) ($1 saved
0 1 5 60 280 5,600 5,600 560 I 8 1,120 560 11,200 10,666 1,067
3 16 2,240 1,120 22,400 19,310 1,931 4 20 2,800 7,400 28,000 22,951 2,295 5 24 3,360 1,680 33,600 26,250 2,625
32 4,480 2,240 44,800 31,773 3,177 8 36 5,040 2,520 50,400 34,054 3,405 u 40 5,600 2,800 56,000 36,129 3,613
26,546 TOTAL 396,727 49,672
7 - 12 1,680 840 16,800 15,273 1,528
0 28 3,920 1,900 3Q,200 29,254 2,925 -
265,467 10-10 40 5,600 2,800 56,000
20 year costs= 597,243
B= 5496,727 =5.11 - _ _ _ C .$ 97,243
C = u = $1.96 E 49.672

Vol. 44, No. 4-Fall 1984 167
Program C-School-Based Fluoride Mouthrinse Benefits and Costs for 20-Year Period
(in constant 1982 dollars)
Cost Saved Restoring Present Value
Teeth Present Value of Carious (# Surfaces of costs Carious Surfaces Restored X $20) Saved Surf aces % Caries
Year Reduction Saved ($1 ($1 Saved
0 5 560 5,600 5,600 560 1 10 1,120 11,200 10,667 1,067 2 15 1,680 16,800 15,273 1,527 3 20 2,240 22,400 19,310 1,931 4 25 2,800 28,000 22,951 2,295
5-20 25 2,800 28,000 227,717 22,771
TOTAL 301,518 30,151
20 -year program costs - $189,426
r a t i o = $301318 =1,59 C 5189,426
Program C' 20 year program costs excluding teachers' time =%49,849
r a t i o = $301,518=6,05 C 5 49,849
5 ratio= 49,849 = 51.65 E 30,151
Program D School Based Sealant Program
Cost and Benefits Calculations for 20 Year Period
~~ ~~ ~~~ ~ ~ ~
Present Yo caries # carious # surfaces cost value of
reduction (29) surfaces restored saved carious (% retention X saved* (50% utilization) (in Present surfaces
Year % effective) x $20 dollars) value saved
0 (100x94) =94 1805 903 18,060 18,060 1,805 1 (96x94) = 90 1728 864 17,280 16,457 1,646 2 (95 X 94) = 89 1709 855 17,100 15,545 1,554 3 (94 X94) = 88 1690 845 16,900 14,569 1,457 4 (90 X94) = 85 1632 816 16,320 13,377 1,338 5 (82x94) = 77 1478 739 14,780 11,547 1,155
6- 19 77 1478 739 14,780 126,212 12,621
20 Years Benefits 215,767 21,576
*number of carious surfaces saved=960 children X 2 DMFS/year X % caries reduction (column one)
References 1. Institute of Medicine. Public policy options for better
dental health. National Academy of Science, Dec. 1980. 2. American Dental Association. Prevention and control
of dental disease through improved access to compre- hensive care. Chicago, House of Delegates Document, 1979.
3. US Public Health Service. Healthy children: effective public health practices for improving children's oral
health. Department of Health and Human Services, Washington; Government Printing Office, Fall 1980.
4. US Public Health Service. Promoting health, preventing disease: objectives for the nation. Department of Health and Human Services, Washington; Government Printing Office, Fall 1980.
5. Nicholson W. Microeconomic theory. 2nd ed. Hinsdale IL: Dryden Press, 1978.
6. Warner KE, Hutton RC. Cost-benefit and cost-effective-

168 Journal of Public Health Dentistry
ness analysis in health care. Med Care 1080; 18:1069-84. 7. Hellinger F J . Cost-benefit analysis of health care: Past
appIications and future prospects. Inquiry 1980; 17:204- 15.
8. Stokey E, Zeckhauser R . A primer for p o k y analysis. New York: \2'W Norton. p. 134.
a , Klar.man HE. Application of cost-benefit analysis to the health services and the special case of technologic innovation. Int J Health Serv 1074; 4(2).
10. Prest AR, Turvey R. Cost-benetit analysis: a survey. Economic J 1965; 75:683-735.
11. Grainger RM. Cost-benefit analysis: application to dental services. J Can Dent Assoc 1073; 10:693-9.
1 2 . Foch C. The costs, effects and benefits of preventive dental care: a literature review. Santa Monica CA: Rand Corporation, N-1732-RhTJF, Dec. 1981.
13. Davies GN. Fluoride in the prevention of dental caries: cost benefits of fluoridation. Br Dent 11973; 135:131-4.
11. Davies GN. Fluoride in the prevention of dental caries: school fluoridation. Br Dent J 1073; 135:173-4.
15. Davies GN. Fluoride in the prevention of dental caries: fluoride tablets. Br Dent J 1973; 135:233-5.
16. Davies GN. Fluoride in the prevention of dental caries. Br Dent J 1973; 135:333-6.
17. Horowitz HS. Cost-value analysis in dentistry. J Public Health Dent 1981; 41:281-6.
18. Newburn E . Cost-effectiveness and practicality features in the systemic use of fluorides. In: Burt BA, ed. The relative etficiency of methods of caries prevention in dental public health. Ann Arbor: University of Michigan, 1070.
10, Heifetz S. Co5t-effectiveness of topically applied fluorides. In: Burt BA, ed. The relative efficiency of methods of caries prevention in dental public health. Ann Arbor: University ot Michigan, 1979.
20. Nelson \V, Swnt IM. Cost-benefit analysis of fluoridation in Houston, Texas. J Public Health Dent 1976 Spring;
21. Gorhdm W. Allocating federal resourcesamong competing social needs. HEW Indicators. Aug. 1966.
22. Horowitz H, Heifetz S. Methods for assessing the cost- effectiveness ot caries preventive agentsand procedures. Int Dent 11970; 29:106-17.
23. McComhie F . Cost-eftectiveness considerations in planning a preventive dental programme for British Columbia. Int Dent J 1979; 29:125-36.
24. Fuller IF. Cost-benefit and cost-effectiveness analysis. NZ Dent J 1074; 70:282-8.
25. Galagan DJ, Vennillion JR . Determining optimum fluoride concentration. Pub Health Rep 1957; 72:491.
26. Burt BA, ed. The relative efficiency of methods of caries prevention in dental public health: proceedings of a conference a t the Universityof Michigan, June 6-8,1978, Ann Arbor: University ot Michigan, 1979.
27. fherican Dental Association, Bureau of ~~~~~~i~ Research and Statistics. Dental fees charged by general Practitioners and selected specialists in the United States, 1075. 1 Am Dent Assoc 1977 Feb; 96:340-52,
36:88-05.
28. Mertz-Fairhurst E . Current status of sealant retention and caries prevention. J Dent Educ 1984 Feb; 48 (Suppl.):18-26.
29. Simonsen RI. Five-year results of sealant effects oncaries prevalence and treatment costs. J Dent Res 1982; 61 (Spec. Issue A) : Abstr. no. 1380.
30. Connolly G, Director, Division of Dental Health, Massachusetts Department of Public Health, personal communication, August 1984.
31. Doherty N, Brunelle JA, Miller A, Li S. Cost of school- based mouthrinsing in fourteen programs. Community Dent Oral Epidemiol 1984; 12:35-8.
32. Heifetz S. Alternative methods of delivering fluoride: an update. In: Horowitz A, Thomas A . Dental caries prevention in public health programs. Department of Health and Human Services, US Public Health Service, National Institutes of Health; Publication No. 81-2235, Aug. 1981.
33. Foch CB, Klein SP, Bohannan HM, Anderson PE, Leone FH, Disney JA, Oshiro M. Costsof treatment procedures in the National Preventive Dentistry Demonstration Program. Santa Monica, CA: Rand Corporation, R-3034-RWJ, Feb. 1984.
31.Ast DB, Alloway N, Drohey HL. The prevalence of malocclusion related to dental caries and lost first permanent molars in a fluoridated city and a fluoride- deficient city. Am J Orthodontics 1962; 48:106-13.
35. Ast DB, Cons N, Pollard S, Garfinkel J , Time and cost factors to provide regular periodic dental care for children in a fluoridated and non-fluoridated area: final report. J Am Dent Assoc 1970 April; 80:770-6.
36. Downer MC, Blinkhorn AS, Atwood D. Effect of fluor- idation o n the cost of dental treatment among urban Scottish school children. Community Dent Oral Epidemiol 1981 June; 9:112-6.
37. US Public Health Service, National Institutes of Health, National Institute of DentalResearch and National Caries Program. The prevalence of dental canes in United States children 1979-80: the Na tional Dental Caries Prevalence Survey. NIH Publ. No. 82-2245. Washington: Govern- ment Printing Office, 1981.
38. Boggs D. Applying the technique of cost-effectiveness to the delivery of dental services. J Public Health Dent 1973; 32:222-37.
39. HorowitzHS, Heifetz SB, Law FE. Effect of school water fluoridation on dental caries: final results in Elk Lake, Pennsylvania after twelve years. J Am Dent Assoc 1972; 84:832.
40. HorowitzHS. The prevention of dental canes by mouth- rinsing with solutions of neutral sodium fluoride. Int Dent J 1973; 23:585-90.
41. Torell PI Ericcson Y. The potential benefits to be derived from fluoride mouthrinses. In: Forrester DJ, Schultz EM, eds- International workshop on fluorides and dental caries reduction. Baltimore: University of Maryland, 1974.