Embed Size (px)
Citation preview

Using Cost 1
Using Cost Benefit Analyses to Develop a Pluralistic Methodology for Selecting
from Multiple Prescriptive Software Process Improvement (SPI) Strategies
MSA 685 Project Report
Submitted in Partial Fulfillment of Requirements
for the Degree of
Master of Science in Administration
(Software Engineering Administration)
by
David F. Rico
Project Instructor
Dr. James Keagle
April 30, 1999

Using Cost 2
ABSTRACT
This study presents a cost and benefit analysis of major software process improvement (SPI)
methods that are prescriptive in nature. The purpose of this study is to guide software developers,
managers, and leaders toward a small collection of highly effective SPI strategies that will help
them achieve their organizational goals and objectives. SPI is a discipline of devising new and
improved policies, procedures, standards, activities, tasks, processes, and tools for computer
programming, software development, and software engineering. SPI may result in more
successful software products, projects, programs, business divisions, organizational units, and
ultimately businesses and organizations themselves. Success is often measured in terms of higher
quality and productivity, faster cycle times and schedules, and the consumption of lower costs
and resources. This study presents a comprehensive survey of SPI methods; a broad survey of
SPI metrics, costs, benefits, and rare data; a return on investment (ROI) model; a break even
point model and analyses; an innovative comparison of eight major SPI methods; and a
comparison of detailed SPI costs and benefits. The differences between the best and worst SPI
methods range from 30:1 to 1,290:1 in terms of cost, quality, productivity, cycle time, and ROI.
Using Cost 3
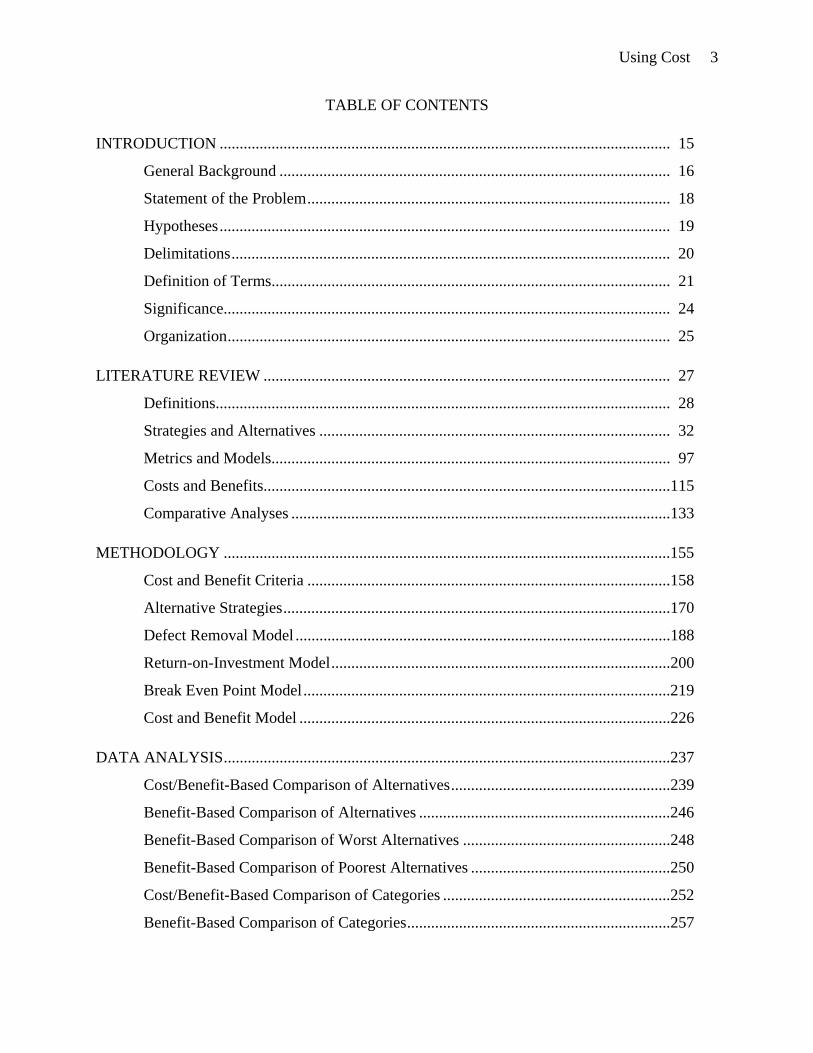
TABLE OF CONTENTS
INTRODUCTION ................................................................................................................. 15
General Background .................................................................................................. 16
Statement of the Problem........................................................................................... 18
Hypotheses................................................................................................................. 19
Delimitations.............................................................................................................. 20
Definition of Terms.................................................................................................... 21
Significance................................................................................................................ 24
Organization............................................................................................................... 25
LITERATURE REVIEW ...................................................................................................... 27
Definitions.................................................................................................................. 28
Strategies and Alternatives ........................................................................................ 32
Metrics and Models.................................................................................................... 97
Costs and Benefits......................................................................................................115
Comparative Analyses ...............................................................................................133
METHODOLOGY ................................................................................................................155
Cost and Benefit Criteria ...........................................................................................158
Alternative Strategies.................................................................................................170
Defect Removal Model ..............................................................................................188
Return-on-Investment Model.....................................................................................200
Break Even Point Model............................................................................................219
Cost and Benefit Model .............................................................................................226
DATA ANALYSIS................................................................................................................237
Cost/Benefit-Based Comparison of Alternatives.......................................................239
Benefit-Based Comparison of Alternatives ...............................................................246
Benefit-Based Comparison of Worst Alternatives ....................................................248
Benefit-Based Comparison of Poorest Alternatives ..................................................250
Cost/Benefit-Based Comparison of Categories .........................................................252
Benefit-Based Comparison of Categories..................................................................257

Using Cost 4
CONCLUSION......................................................................................................................263
Results of Data Analysis............................................................................................265
Outcome of Hypotheses.............................................................................................268
Reliability and Validity..............................................................................................270
Future Research .........................................................................................................272
Recommendations......................................................................................................273
REFERENCES ......................................................................................................................275

Using Cost 5
FIGURES
Figure 1, Process value analysis (PVA)................................................................................. 31
Figure 2, Software process improvement (SPI) strategies from survey of 72 case studies ... 32
Figure 3, Further software process improvement (SPI) strategy classification ..................... 34
Figure 4, Ogden air logistics center software process improvement (SPI) journey .............. 40
Figure 5, Clean room methodology ....................................................................................... 51
Figure 6, IBM research triangle park defect prevention process ........................................... 60
Figure 7, IBM’s orthogonal defect classification (ODC) process ......................................... 61
Figure 8, Family of seven personal software process (PSP) life cycles ................................ 65
Figure 9, Personal software process (PSP) 3 - cyclic development life cycle....................... 66
Figure 10, Software inspection process ................................................................................. 69
Figure 11, Citation frequency of metrics for software process improvement (SPI).............. 99
Figure 12, SEI CMM maturity profile (domestic) .................................................................117
Figure 13, Hewlett packard annual software inspection process savings..............................119
Figure 14, SEI personal software process (PSP) results ........................................................121
Figure 15, Motorola CMM-based software process improvement (SPI) ..............................122
Figure 16, Raytheon CMM-based software productivity improvements ..............................123
Figure 17, DACS software process improvement (SPI) model.............................................124
Figure 18, IBM rayleigh life cycle reliability model accuracy..............................................125
Figure 19, IBM rayleigh life cycle reliability model .............................................................126
Figure 20, SEI software process improvement (SPI) survey of 13 organizations .................127
Figure 21, NEC (tokyo, japan) defect prevention results ......................................................128

Using Cost 6
Figure 22, IBM defect prevention results ..............................................................................129
Figure 23, Share holder value (as a result of process improvement).....................................132
Figure 24, SEI capability maturity model for software (CMM)............................................134
Figure 25, DACS software process improvement (SPI) study results...................................139
Figure 26, Software process improvement (SPI) strategy empirical analytical model..........147
Figure 27, Methodology for evaluating and selecting costs and benefits..............................155
Figure 28, Defect removal model theory ...............................................................................188
Figure 29, Humphrey's defect removal model (Part II) .........................................................199
Figure 30, Software inspection process cost model architecture...........................................205
Figure 31, Custom software process improvement (SPI) break even model.........................214
Figure 32, Test versus ad hoc graphical break even analysis ................................................221
Figure 33, Inspection versus ad hoc graphical break even analysis ......................................222
Figure 34, PSP versus ad hoc graphical break even analysis ................................................222
Figure 35, Inspection versus test graphical break even analysis ...........................................223
Figure 36, PSP versus test graphical break even analysis .....................................................224
Figure 37, PSP versus inspection graphical break even analysis...........................................224
Figure 38, Normalized costs and benefits of eight strategies ................................................238
Figure 39, Average costs and benefits of eight strategies......................................................239
Figure 40, Breakeven hours comparison of eight strategies ..................................................240
Figure 41, Training hours/person comparison of eight strategies..........................................240
Figure 42, Training cost/person comparison of eight strategies ............................................241
Figure 43, Effort (hours) comparison of eight strategies.......................................................242
Using Cost 7
Figure 44, Cycle time reduction comparison of eight strategies ...........................................242
Figure 45, Productivity increase comparison of eight strategies ...........................................243
Figure 46, Quality increase comparison of eight strategies...................................................244
Figure 47, Return-on-investment comparison of eight strategies..........................................244
Figure 48, Normalized benefits of eight strategies ................................................................246
Figure 49, Average benefits of eight strategies .....................................................................247
Figure 50, Normalized benefits of worst strategies ...............................................................248
Figure 51, Average benefits of worst strategies.....................................................................249
Figure 52, Normalized benefits of poorest strategies ............................................................250
Figure 53, Average benefits of poorest strategies..................................................................251
Figure 54, Normalized costs and benefits of categories ........................................................254
Figure 55, Average costs and benefits of categories..............................................................256
Figure 56, Normalized benefits of categories ........................................................................257
Figure 57, Average benefits of categories .............................................................................258
Figure 58, Normalized benefits of worst categories (part I) ..................................................259
Figure 59, Average benefits of worst categories (part I) .......................................................260
Figure 60, Normalized benefits of worst categories (part II).................................................261
Figure 61, Average benefits of worst categories (part II) ......................................................261

Using Cost 8

Using Cost 9
TABLES
Table 1, Survey of Software Process Improvement (SPI) Definitions in Literature ............. 28
Table 2, Defect Prevention and Appraisal Processes............................................................. 36
Table 3, U.S. West's Software Process Improvement (SPI) Principles ................................. 37
Table 4, SEI Capability Maturity Model for Software (CMM)............................................. 39
Table 5, Boeing Defense and Space Software Process Improvement (SPI) Journey ............ 42
Table 6, SPR Software Process Improvement (SPI) Model .................................................. 43
Table 7, Motorola Software Process Improvement (SPI) Strategy........................................ 45
Table 8, Raytheon Software Process Improvement (SPI) Strategies..................................... 46
Table 9, DACS Software Process Improvement (SPI) Strategies ......................................... 47
Table 10, Software Reusability and Domain Analysis Methods ........................................... 49
Table 11, Hewlett Packard Software Reuse Process ............................................................. 50
Table 12, IBM Rochester Organizational Process Improvement Strategy ............................ 52
Table 13, IBM Rochester Software Process Improvement (SPI) Strategy............................ 54
Table 14, IBM Rochester AS/400 Software Quality Management System (SQMS) ............ 55
Table 15, IBM Rochester AS/400 Software Quality and Reliability Metrics and Models.... 56
Table 16, IBM Rochester, University of Maryland, and NASA GSFC Quality Survey ....... 58
Table 17, IBM Houston NASA Space Shuttle Software Process Improvement (SPI).......... 63
Table 18, Hewlett Packard Divisional Software Process Improvement (SPI) Strategy ........ 67
Table 19, Hewlett Packard Corporate Software Process Improvement (SPI) Strategies ...... 68
Table 20, Hitachi, Toshiba, NEC, and Fujitsu Software Process Improvement (SPI) .......... 70
Table 21, Microsoft Software Process Improvement (SPI) Strategies .................................. 71

Using Cost 10
Table 22, Microsoft Synch-and-Stabilize Software Development Approach ....................... 72
Table 23, Netscape Principles for Competing on Internet Time ........................................... 73
Table 24, ISO 9001, Malcolm Baldrige, and Capability Maturity Model Elements ............. 75
Table 25, Organizational Improvement Strategies ................................................................ 76
Table 26, Steve McConnell's Software Best Practices .......................................................... 78
Table 27, IBM Santa Teresa Software Process Improvement (SPI) Strategies..................... 79
Table 28, SEI-Identified Software Process Improvement (SPI) Strategies ........................... 80
Table 29, Process Innovation Strategies ................................................................................ 81
Table 30, Process Innovation Strategies Mapped to Organizational Functions .................... 83
Table 31, Process Innovation Strategies Mapped to Organizational Functions .................... 85
Table 32, Resistance Embracement Organizational Change Strategy................................... 86
Table 33, Reengineering and Total Quality Management (TQM) Strategies........................ 87
Table 34, International Quality Management Strategies ....................................................... 88
Table 35, Three Phases of Business Transformation............................................................. 90
Table 36, Internet Technologies for Organizational Change................................................. 92
Table 37, Digital Strategy for Organizational Change .......................................................... 94
Table 38, Profit Patterns for Organizational Performance Improvement .............................. 95
Table 39, Survey of Metrics for Software Process Improvement (SPI) ................................ 97
Table 40, Reclassification of 487 Metrics for Software Process Improvement (SPI) ........... 98
Table 41, Operating Parameters and Metrics for Business Transformation..........................100
Table 42, Typical Costs for Measuring Quality of Conformance .........................................101
Table 43, IBM Rochester Software Process Improvement (SPI) Metrics .............................102
Using Cost 11
Table 44, Hewlett Packard Software Process Improvement (SPI) Metrics ...........................103
Table 45, Motorola Software Process Improvement (SPI) Metrics.......................................104
Table 46, AT&T Software Inspection Process (SPI) Metrics................................................105
Table 47, SEI Software Process Improvement (SPI) Metrics................................................106
Table 48, SEI CMM-Based Software Process Improvement (SPI) Metrics..........................107
Table 49, DACS Software Process Improvement (SPI) Metrics...........................................108
Table 50, Personal Software Process (PSP) Metrics .............................................................109
Table 51, SPR Software Process Improvement (SPI) Metrics ..............................................110
Table 52, Software Process Improvement (SPI) Metrics for SPC.........................................111
Table 53, NASA GSFC Software Process Improvement (SPI) Metrics................................112
Table 54, Defect Density Metrics for Software Process Improvement (SPI)........................112
Table 55, Universal/Structural Design Metrics for Software Process Improvement (SPI) ...113
Table 56, Software Inspection Process Metrics for Software Process Improvement (SPI)...114
Table 57, Survey of Software Process Improvement (SPI) Costs and Benefits ....................115
Table 58, Motorola Personal Software Process (PSP) Benefits ............................................120
Table 59, Hewlett Packard Software Reuse Costs and Benefits............................................130
Table 60, Clean Room Methodology Benefits ......................................................................131
Table 61, Survey of Software Process Improvement (SPI) Comparative Analyses..............133
Table 62, SEI Comparison of Software Process Improvement (SPI) Methods.....................136
Table 63, Construxx Comparison of Software Process Improvement (SPI) Methods ..........137
Table 64, HP Comparison of Software Process Improvement (SPI) Methods......................138
Table 65, PSP, Software Inspection Process, and Testing Comparison ................................140

Using Cost 12
Table 66, Clean Room, Software Inspection Process, and Walkthrough Comparison..........141
Table 67, Comparison of Reviews, Software Inspection Process, and Walkthroughs ..........143
Table 68, Business Process Reengineering (BPR) Contingency Model................................144
Table 69, Malcolm Baldrige, ISO 9001, and SEI CMM Comparison...................................145
Table 70, Comparison of Enterprise Quality Management Models ......................................146
Table 71, SPR Comparison of Software Process Improvement (SPI) Methods....................148
Table 72, Software Capability Evaluations (SCEs) and ISO 9001 Registration Audits .......149
Table 73, Comparison of SPRM, SPICE, CMM, BOOTSTRAP, and ISO 9000..................150
Table 74, Comparison of BOOTSTRAP, ISO 9000, CMM, and SPICE ..............................151
Table 75, Worldwide Survey of Software Best Practices......................................................152
Table 76, Construxx Comparison of Software Development Life Cycles ............................153
Table 77, Criteria for Evaluating Software Process Improvement (SPI) Alternatives ..........158
Table 78, Alternatives for Evaluating Costs and Benefits.....................................................170
Table 79, Humphrey's Defect Removal Model (Part I) .........................................................190
Table 80, Sulack's Defect Removal Model............................................................................191
Table 81, Gilb's Defect Removal Model ...............................................................................192
Table 82, Kan's Defect Removal Model ................................................................................193
Table 83, McGibbon's Defect Removal Model (Part I).........................................................194
Table 84, McGibbon's Defect Removal Model (Part II) .......................................................196
Table 85, Ferguson's Defect Removal Model........................................................................197
Table 86, Rico's Defect Removal Model ...............................................................................198
Table 87, Basic Quality-Based Return-on-Investment (ROI) Model ....................................200

Using Cost 13
Table 88, Six Software Cost Models for Two Strategies.......................................................204
Table 89, Five Software Cost Models for Estimating Software Development Effort ...........211
Table 90, Graphical Break Even Point Analysis with Software Life Cycle Cost Models.....219
Table 91, Costs and Benefits of Eight Software Process Improvement (SPI) Strategies ......226
Table 92, Costs and Benefits of Personal Software Process (PSP) .......................................227
Table 93, Costs and Benefits of Clean Room Methodology .................................................228
Table 94, Costs and Benefits of Software Reuse Process......................................................229
Table 95, Costs and Benefits of Defect Prevention Process..................................................230
Table 96, Costs and Benefits of Software Inspection Process...............................................232
Table 97, Costs and Benefits of Software Test Process.........................................................233
Table 98, Costs and Benefits of Capability Maturity Model (CMM)....................................234
Table 99, Costs and Benefits of ISO 9000.............................................................................235
Table 100, Normalized Costs and Benefits of Eight Strategies.............................................237
Table 101, Normalized Benefits of Eight Strategies .............................................................246
Table 102, Normalized Benefits of Worst Strategies ............................................................248
Table 103, Normalized Benefits of Poorest Strategies ..........................................................250
Table 104, Costs and Benefits of Categories .........................................................................252
Table 105, Normalized Costs and Benefits of Categories .....................................................253
Table 106, Normalized Benefits of Categories......................................................................257
Table 107, Normalized Benefits of Worst Categories (Part I)...............................................259
Table 108, Normalized Benefits of Worst Categories (Part II) .............................................260
Table 109, Comparative Summary of Eight Strategies .........................................................265

Using Cost 14
Table 110, Comparative Summary of Strategies (Part I).......................................................266
Table 111, Comparative Summary of Strategies (Part II) .....................................................267
Table 112, Comparative Summary of Categories..................................................................267

Using Cost 15
INTRODUCTION
The purpose of this study is to organize the costs and benefits of Software Process
Improvement (SPI) strategies, methods, approaches, and alternatives into a form and
methodology that enables software managers to identify and select the SPI strategies that are
most closely aligned with their business, organizational, and technical goals and objectives. This
study will examine a cross section of popular SPI methods and approaches, prioritize them by
their costs and benefits, classify and group them according to their characteristics, and guide
software managers and developers toward a small collection of highly effective SPI strategies.
This study will classify SPI methods and approaches into two broad classes, descriptive
and prescriptive SPI strategies, or to be referred to as indefinite and vertical SPI strategies
throughout this study, respectively. Indefinite SPI strategies are broadly generalized guidelines
that attempt to help software managers and developers successfully produce software based
products and services, but are so non-specific that they are difficult if not impossible to
successfully use without rare expertise. Vertical SPI strategies are very specific approaches to
software management and development, leaving nothing to the imagination, which when
properly used, help managers and developers successfully produce software based products and
services, requiring much less expertise than indefinite SPI strategies.
The costs and benefits of the various SPI strategies examined in this study will be clearly
explained and organized in such a way that software managers and developers will be enabled to
evaluate and select from multiple vertical SPI strategies with known, repeatable, and measurable
properties that are proven to help them best meet their needs. Hence, this study will achieve these
objectives by “Using Cost Benefit Analyses to Develop a Pluralistic Methodology for Selecting
from Multiple Prescriptive Software Process Improvement (SPI) Strategies.”

Using Cost 16
General Background
This study is examines a few extremely impressive examples of successful Software
Process Improvement (SPI). SPI is a highly controversial, and much disputed field.
SPI is the discipline of characterizing, defining, measuring, and improving software
management and development processes, leading to software business success, and successful
software development management. Success is defined in terms of greater design innovation,
faster cycle times, lower development costs, and higher product quality, simultaneously.
The case studies, examples, information, and data examined in this study were the result
of a notion called using powerful vertical strategies. Powerful vertical SPI strategies are
examined in order to lead the way and encourage others, that have not been successful with SPI,
or have yet to try SPI, to use high leverage SPI strategies as methods of making quantum leaps
forward in bottom line business, organizational, and technical performance.
This study represents a significant departure from traditional indefinite SPI methods, in
that it simply advises organizations to use powerful vertical and universal, or multiculturally
transcendent, SPI solutions that are guaranteed to work. Traditional SPI methods direct unskilled
and inexperienced individuals to embark on long and indefinite journeys to invent homegrown
and highly individualized solutions, having little chance of succeeding.
SPI is a highly controversial field because the technology called “software,” our
mathematical, engineering, and scientific understanding of it, our ability to manage its
development successfully, and the state-of-the-practice are yet in their early infancy. It is
software’s infancy that results in the exact opposite business, organizational and technical
outcome of which is desired:
1. Frequent software project failures
Using Cost 17
2. High software development costs
3. Unpredictable and uncontrollable software management and development
4. Low software quality
5. Lack of design innovation
Unfortunately, the overwhelming majority of software development practitioners believe
that software development will always be a craft industry, a product of highly skilled and highly
individualized artists and artistry. In addition, the majority also believe that software
management and development are unmeasurable, and thus uncontrollable.
This study illuminates, introduces, and examines a systematic series of examples, case
studies, and evidence that software management and development are indeed measurable, and
thus extremely controllable. This study represents strong evidence that an extremely sound,
stable, and scientific understanding of software technology, management, and development,
indeed does exist, and has existed for some time, nearly three decades.
This study will also assert the notion that software is nearing classification as a classical
engineering discipline, though still practiced and taught as a craft. Engineering is defined as the
practical application of science and mathematics. Identifying SPI strategies that exhibit known,
repeatable, predictable, and measurable characteristics challenges software’s craft status.
While this paper is largely devoted to a quantitative examination of history, that is the
past, it will offer a highly unique, tantalizing, and prophetic glimpse into the future of software
technology that few have seen. For it is only by examining history that the future can be clearly
seen. Ironically, it is often said that the past must be forgotten, in order to create new and
innovative computer programs. Maybe that’s why software technology is still in its infancy,
because we refuse to learn from the past, in fact we forbid it.
Using Cost 18
Statement of the Problem
This study proposes to identify, evaluate, classify, and prioritize Software Process
Improvement (SPI) strategies into a decision analysis model in order to help software managers
and developers choose the SPI strategies aligned with multiple simultaneous categories of
business, organizational, and technical goals and objectives.
The first subproblem. The first subproblem is to determine if there is an authoritative
definition of SPI, which can serve as a basis to form a common understanding and cultural link
with the reader, in order to facilitate the comprehension of the concepts presented by this study.
The second subproblem. The second subproblem is to determine if there is an
authoritative or identifiable body of SPI strategies recognized by the software management and
development community that will aid the acceptance of the principles advocated by this study.
The third subproblem. The third problem is to survey and evaluate the costs and benefits
of various SPI strategies in order to determine if SPI is a worthwhile endeavor, and to identify a
pattern of common costs and benefits from which to form a framework for comparison.
The fourth subproblem. The fourth subproblem is to determine if there is a method of
differentiating and discriminating between SPI strategies in order to serve as a basis for aligning
various SPI strategies into common classes, and eventually compare the classes.
The fifth subproblem. The fifth subproblem is to evaluate and prioritize the SPI classes in
order to sharply differentiate and discriminate the costs and benefits of the SPI classes, serving as
a basis for grouping multiple similar SPI strategies along with their costs and benefits.
The sixth subproblem. The sixth subproblem is to identify the unique goals and
objectives of each SPI strategy, independent of effectiveness, so that software managers may be
informed of the costs and benefits of the specific goals and objectives they wish to achieve.

Using Cost 19
Hypotheses
The first hypothesis. The first hypothesis is that there is an emerging definition of what
Software Process Improvement (SPI) means, based on both de facto and international industry
standards (though it may need to be enhanced for use in this study). It is further hypothesized
that abundant literature exists with authoritative surveys of SPI.
The second hypothesis. The second hypothesis is there is a growing awareness that
multiple SPI strategies exist with varying degrees of effectiveness (though many cling to a small
number of ineffective SPI strategies).
The third hypothesis. The third hypothesis, still questioned by SPI professionals
themselves, is that there are SPI strategies that actually exhibit low costs and favorable benefits,
several that consistently exhibit even lower costs and higher benefits, and that a standard method
of classifying costs and benefits is emerging.
The fourth hypothesis. The fourth hypothesis is that multiple distinctive classes of SPI
methods exist and that the costs and benefits are consistent within classes, and are starkly
different across classes.
The fifth hypothesis. The fifth hypothesis is that, not only do multiple SPI classes exist
with sharply different costs and benefits, but that the SPI classes can be clearly identified,
labeled, described, and prioritized.
The sixth hypothesis. The sixth hypothesis is that business, organizational, and technical
goals and objectives can be identified and associated with multiple SPI classes along with their
costs and benefits. It is further hypothesized that this will enable the formation of a framework
from which to select specific goals and objectives, the associated SPI classes and strategies, and
quantify the costs and benefits of those decisions and opted SPI strategies.
Using Cost 20
Delimitations
The first delimitation. The first delimitation is that this study will not invent a new
definition of SPI, leading the reader to believe that this paper is using non-authoritative concepts,
views, and ideas.
The second delimitation. The second delimitation is that this study will invent no new
SPI strategies that have yet to be scientifically proven but will draw upon costs and benefits of
existing authoritative quantitative results.
The third delimitation. The third delimitation is that this study will not evaluate emerging
software product technologies, such as the Internet, World Wide Web, Java, HTML, object-
relational databases, and other high leverage product strategies. Instead this study will examine
process or management approaches, techniques, and methods.
The fourth delimitation. The fourth delimitation is that this study will not examine
emerging software design management methodologies, such as product line management,
compositional software components, and reusable frameworks (such as PeopleSoft, SAP/R3, and
the San Francisco Project). These technologies may be more effective than the SPI strategies
examined in this study, but their costs and benefits have yet to be quantified.
The fifth delimitation. The fifth delimitation is that this study will not examine the costs
and benefits of using highly qualified software managers and developers. That is, those having
graduated from top tier schools such as Harvard, Massachusetts Institute of Technology (MIT),
and Stanford, a popular topic of contemporary research.
The sixth delimitation. The sixth delimitation is that this study will not examine systems
dynamics theory which hypothesizes that a stable work environment is the most important factor
in determining software management and development success.
Using Cost 21
Definitions of Terms
Decision Analysis. Schuyler (1996) defines decision analysis as the discipline that helps
decision makers choose wisely under uncertainty, involving concepts borrowed from probability
theory, statistics, psychology, finance, and operations research. Decision analysis involves the
use of structured tools and techniques for organizing unstructured problems in order to make
sound, profitable, and certain decisions in the face of seeming uncertainty.
Descriptive. McKechnie (1983) defines descriptive as an informal outline, explanation, or
figurative portrayal lacking formal detail, elaboration, and precision. Descriptive SPI strategies
may indicate which processes are important, and even indicate important characteristics of key
software management development processes, yet without giving sufficient guidance to novices,
describing only the essence or a small portion of the total strategy that’s difficult to understand
without deep personal experience.
Indefinite. Braham (1996) defines indefinite as having no fixed limit, not clearly defined
or determined, or being uncertain and vague. Indefinite SPI strategies provide no criteria for
determining when process improvement has been achieved, and tend to emphasize placing too
much emphasis on low leverage or low return-on-investment processes and activities.
Methodology. Braham (1996) defines methodology as a set or system of methods,
principles, and rules, as in the sciences. A SPI methodology is a comprehensive set of step-by-
step instructions for achieving a specific goal or objective.
Model. Turban and Meridith (1994) and Schuyler (1996) define models as abstract
representations of reality and simplified representations that consist of variables and
mathematical formulas (e.g., a mathematical equation of a line that has been correlated to profit,
loss, performance, or other phenomenon).

Using Cost 22
Multiculturally transcendent. Braham (1996) defines multicultural as the existence or
presence of multiple unique cultural identities, each with their own values, beliefs, and norms,
and transcendent as going beyond, surpassing, or exceeding the limits. Therefore, multiculturally
transcendent means crossing multiple cultures simultaneously, or having a common or
overlapping set of values, beliefs, and norms (e.g., universal applicability to a wide variety of
nations, industries, and organizations).
Pluralistic. Braham (1996) defines pluralistic as a condition in which multiple minority
groups participate fully in a dominant society. In the context of this study, it will mean that there
will be multiple minor and dominant approaches or choices, each with their own merits, from
which to choose from, depending on context specific goals and objectives.
Prescriptive. McKechnie (1983) defines prescriptive as a formal, strictly defined,
accurately stated, and minutely exact set of rules, orders, steps, or procedures that must be
followed without variation. In the context of this study, it will mean that prescriptive SPI
strategies contain the entire description of the approach to be used and detailed guidance for
novices and non-experts, unlike indefinite or descriptive SPI strategies.
Software development. The IEEE Standard Glossary (1990) defines software
development as the transformation of user needs into a software product, involving requirements
analysis, software design, computer programming, and testing (e.g., the combination of multiple
computer programming language statements into a product that performs a useful function).
Software management. The IEEE Standard Glossary (1990) defines software
management as the process of planning, estimating resources, scheduling, conducting,
coordinating, and controlling software development.
Using Cost 23
Software process improvement (SPI). Harrington (1991) defines process improvement as
a systematic methodology that significantly helps businesses simplify and streamline operational
processes. Harrington states that the objective of process improvement is to ensure that business
processes eliminate errors, minimize delays, promote understanding, are easy to use, are
customer friendly, are adaptable, enhance competitiveness, and reduce excess capacity.
Software process improvement (SPI) strategy. Combining Harrington’s (1991) and
McKechnie’s (1983) definitions of process improvement and strategy, a SPI strategy is one of
many optional methodologies, plans, and tactical maneuvers that will increase the likelihood of
successfully achieving one or more business objectives. That is, a SPI strategy is prefabricated
management or technical approach that will likely result in successful software development.
Software. The IEEE Standard Glossary defines software as computer programming
language instructions, data, information, and documentation that comprise or constitute a
software product (e.g., shrink wrapped word processor with disks, programs, and user guides).
Strategy. McKechnie (1983) defines strategy as the science of planning and directing
large scale operations, specifically by maneuvering resources into the most advantageous
position prior to actual deployment, implementation, and engagement in order to ensure that
goals and objectives have a high probability of being successfully achieved.
Vertical. In the context of this study, vertical will be defined as specific, non-ambiguous,
prescriptive SPI strategy and tactical approach with known, predictable outcomes for achieving
business goals and objectives and successfully producing software products and services.
Vertical also means SPI strategies that are prefabricated, portable, and self-contained, which can
be deployed and withdrawn from organizational use without having to integrate them into the
total horizontal set of organizational processes, procedures, and operations.
Using Cost 24
Significance
The significance of this study is in several areas, objectively analyzing the results, or
costs and benefits, of Software Process Improvement (SPI) strategies and phenomenon. This
study will not invent any new SPI strategies or analyze exotic and highly unconventional SPI
strategies, but objectively analyze SPI strategies that have roots in the last three decades.
This study will analyze common criteria for evaluating and comparing SPI strategies and
help solidify and promote a standard way of measuring and evaluating costs and benefits
quantitatively. This will orient the reader toward the existence of tangible evidence for
classifying SPI strategies and forming important cultural images of SPI and SPI strategies.
This study will provide a broader, though not unconventional, definition of SPI, SPI
strategies and tactics, and present the reader with a wider array of choices in choosing SPI
strategies. This study will objectively analyze the effectiveness of both mainstream and unknown
SPI strategies, and begin to alert the reader to the existence of a wider array of choices when
selecting SPI strategies.
This study is targeted at technical experts, practitioners, newcomers, and passers-by to
the field of software management, development, and SPI. This study will exhibit an objective
analytical framework to technical experts to begin viewing software management and
development as a quantitative and scientific discipline. And, this study will rapidly orient
practitioners and newcomers toward the issues involved in choosing SPI strategies, building and
delivering software products and services, and guide them away from ineffective SPI strategies
and toward effective SPI strategies.
Finally, if this analysis reveals no discriminating criteria for selecting SPI strategies, that
will be important to technical experts, practitioners, and newcomers; this will be also significant.

Using Cost 25
Organization
This study is organized into five integrated chapters or sections, which introduce the
context and scope of the study which is to analyze and organize Software Process Improvement
(SPI) strategies and their associated information:
Introduction. This chapter introduces the purpose of this study, which is to objectively
analyze SPI strategies by using their costs and benefits, determining whether groundwork may be
laid for constructing a logical and analytical framework as a tool from which software managers
and engineers may choose optimal software product development strategies.
Literature review. This chapter surveys reported SPI strategies and their associated costs
and benefits in order to determine whether a pattern of SPI approaches, common criteria for
measurement, and quantitative costs and benefits begin emerging for objective identification,
analysis, and organization.
Methodology. This chapter begins to design and construct an analytical framework from
lower level building blocks into an integrated and organized structure in which to populate with
SPI strategies and cost and benefit information, along with other important software management
and development criteria which may aid in analysis and selection.
Cost-benefit analyses. This chapter will exercise and execute the analytical framework of
SPI strategies, cost and benefit information, and other critical criteria, in order to determine if
viable discriminating and differentiating factors indeed do exist, from which to provide software
managers and developers with critical business decision making data.
Conclusion. This chapter will report the overall conclusions of this study, its analysis,
whether it achieved its goals and objectives, whether any useful management decision making
data emerged, and if so, what those critical data are.

Using Cost 26

Using Cost 27
LITERATURE REVIEW
The chapter will survey reported results from organizations that have invested heavily in
Software Process Improvement (SPI), identify the strategies they’ve employed, and report the
costs and benefits of their efforts whenever possible. Much of the literature is from advanced and
very mature organizations that are largely devoid of the fundamentals of introductory SPI
principles.
Selecting literature from mature organizations is part of the strategy of this study,
deliberately chosen to help beginning organizations catch up with those that are far ahead of
them. This chapter and this study will attempt to close the gap between introducing basic SPI
principles and their practical application in an advanced way without serving primarily as an
introductory tutorial on SPI, but a stepping stone into mature principles for novices and
beginners, thus an intermediate guide.
This chapter will intentionally avoid qualitative, introductory, philosophical, and
elementary SPI literature, and will focus on high leverage quantitative studies and the quantum
performance impacts of employing those SPI strategies. It is unfortunate that a larger body of
antithetical literature doesn’t exist for comparative analysis. It can be supposed that the small
percentage of software producing organizations that actually employ SPI, is the antithetical
evidence in of itself. However, making that determination is for another study, not this one.
This chapter attempts to conduct and provide a rapid, yet authoritative, survey of the field
of mature SPI strategies. Broad structural issues and topics will be addressed such as: (a) a
common definition and understanding of what SPI is, (b) common strategies for achieving or not
achieving SPI, (c) strategies for SPI measurement, (d) common costs and benefits of SPI, and (e)
the prioritization of SPI strategies.

Using Cost 28
Definitions
Organizing the literature defines SPI as a management science discipline (Rico, 1998)
that includes procedures, tools, and training for SPI (Austin & Paulish, 1993), process
assessment and evaluation (Szymanski and Neff, 1996), and process perfection (Braham, 1996).
SPI also includes having a value-added focus (Szymanski and Neff, 1996), minimizing and
eliminating the resources associated with all processes, value-added and non-value added
Perfect
Add Value
Add Quality
Productivity
Efficiency
Reduce Cost
Flexible
Advantage
Downsize
Define
Measure
Method
Simplify
Add
Substitute
Speed
Incremental
Profit
Braham Harrington Rico Szymanski Austin Garrison DavenportDefinition
Source of Definition
Survey of Software Process Improvement (SPI) Definitions in Literature
Table 1
Using Cost 29
(Garrison and Noreen, 1997a), and increasing customer satisfaction (Harrington, 1991). SPI is
popularly known as changing processes very slowly and deliberately over a long period of time
(Davenport, 1993). As shown in Table 1, SPI definitions vary widely and are not standardized.
Braham (1996) defines improvement as bringing something into a more desirable or
excellent condition, making something better, or increasing something in quality or value.
Braham’s definition of improvement implies that something is made better than it currently is.
Braham makes no judgement as to the current state or quality of what is being perfected, but that
improvement means making the current state or quality even better than it currently is.
Harrington (1991) defines process improvement as a systematic methodology that
significantly helps businesses simplify and streamline operational processes. Harrington goes on
to state that the objective of process improvement is to ensure that business processes eliminate
errors, minimize delays, promote understanding, are easy to use, are customer friendly, are
adaptable, enhance competitiveness, and reduce excess capacity. So, Harrington is saying that
process improvement is the act of eliminating defects, speeding productivity and delivery,
enhancing product desirability, satisfying customers, and minimizing the use of organizational
resources.
Rico (1998) defines SPI as a discipline of defining, measuring, and changing software
management and development processes and operations for the better. Rico defines SPI as a
science involving three distinct elements. The first element is capturing, modeling, and
characterizing key software management and development processes in a tangible form such as
graphical diagrams, step-by-step procedures, or formal notations, languages, and grammars. The
second element is measuring the cost, efficiency, and effectiveness of those defined processes
and comparing them against business, organizational, and technical goals. And, the third is
Using Cost 30
modifying, changing, simplifying, and streamlining the process until it is reduced to its essential
elements, non-essential elements have been removed, and is congruent with goals and objectives.
Szymanski and Neff (1996) define SPI as “a deliberate, planned methodology following
standardized documentation practices to capture on paper (and in practice) the activities,
methods, practices, and transformations that people use to develop and maintain software and the
associated products.” Szymanski and Neff go on to explain SPI as a process of defining
organizational processes, assessing and evaluating them, eliminating inessential steps, and
augmenting organizational processes with value-adding steps. Szymanski and Neff place extra
emphasis on modeling all processes in a highly structured and uniform way and examining
whether current processes add-value or whether value-added processes need to be introduced.
Austin and Paulish (1993) define SPI as integrated procedures, tools, and training in
order to increase product quality, increase development team productivity, reduce development
time, and increase business competitiveness and profitability. Austin and Paulish define SPI as a
process with its own procedures, tools, and training, while the previous authors merely advocate
the definition and modeling of organizational processes without saying how. In addition, Austin
and Paulish focus SPI on increasing product quality, productivity, and profitability.
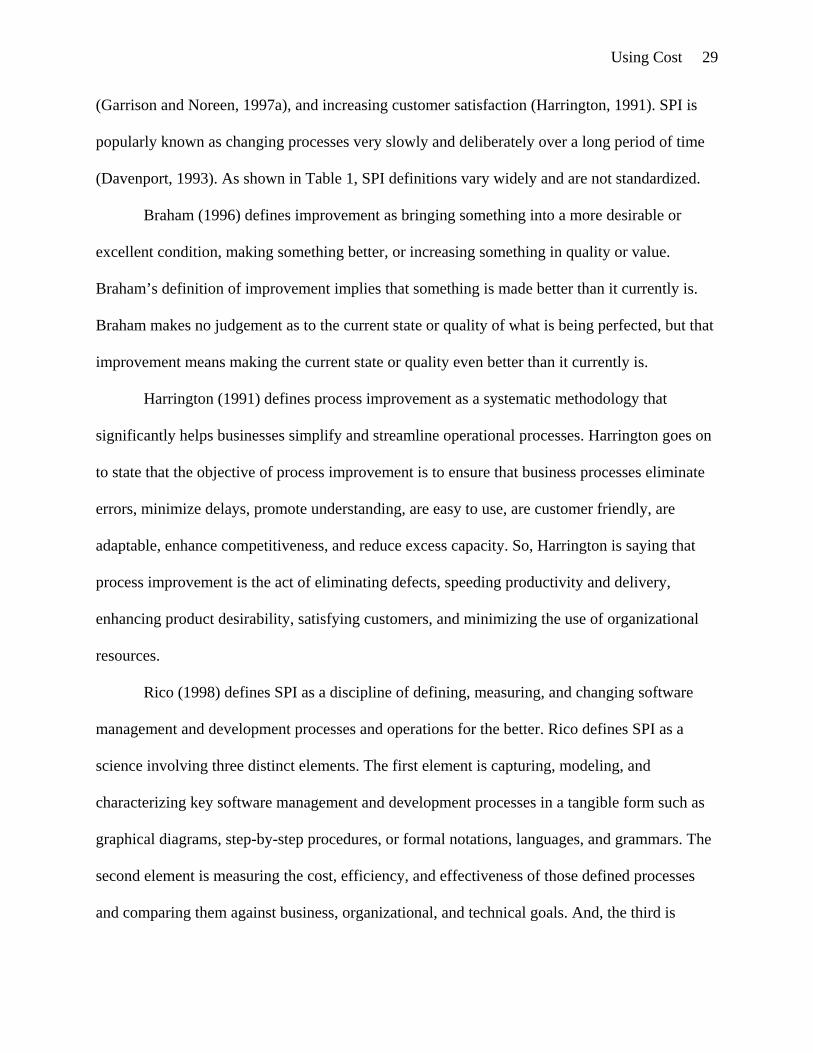
Garrison and Noreen (1997a) define Process Value Analysis (PVA), which is similar to
SPI, as systematically analyzing the activities required to make products or perform services,
identifying all resource consuming activities as value-added or non-value added, and then
minimizing or eliminating the resource consumption of all activities. Garrison and Noreen make
no mention of macro level PVA, that is, treating an entire enterprise as a process that is a
candidate for elimination (more popularly known as value chain analysis). Figure 1 most
appropriately represents PVA from Garrison’s and Noreen’s viewpoint.

Using Cost 31
Davenport (1993) defines process improvement as involving a low level of change,
focusing on minutely incremental change, primarily targeted at polishing existing processes, and
overall involving a long term progression of change, more akin to placing a Band-Aid on a
severed limb.
Davidson (1993) defines re-engineering, which is similar to SPI, as a method for
identifying and achieving radical business performance improvements in productivity, velocity,
quality, business precision, and customer service increases of ten or even a hundred fold or more.
Davidson defines micro or small-scale process improvement in terms of optimization, short
timeframes, local leadership, diverse infrastructure, financial performance focus, single process
focus, and multiple projects. Davidson defines macro or large-scale process improvement in
terms of transformation, long timeframes, senior leadership, integrated infrastructure, multiple
benefit paths, enterprise focus, and massive scale. Davenport (1993) and Davidson by far give
the most formal definitions of both process improvement and its close cousin, re-engineering.
Process 1(4 hours)
Value Added
Process 2(6 hours)
No Value Added
Process 3(5 hours)
Value Added
Process 4(7 hours)
No Value Added
Process 5(5 hours)
Value Added
Process 1(4 hours)
Value Added
Process 3(4 hours)
Value Added
Process 4(5 hours)
No Value Added
Process 5(4 hours)
Value Added
No Change Eliminate Streamline Streamline Streamline
Old Cycle Time (27 Hours)
New Cycle Time (17 Hours)
Process Improvement(37%)
Figure 1. Process value analysis (PVA). A net process of improvement of 37% has been affected by theelimination of process 2 and streamlining of processes 3, 4, and 5.

Using Cost 32
Strategies and Alternatives
Table 1 demonstrates that neither a standard definition of Software Process Improvement
(SPI) exists, nor a standard set of SPI metrics to measure the costs and benefits of SPI and the
various SPI strategies. This section surveys and identifies SPI techniques, methods,
methodologies, strategies, and approaches from approximately 72 scholarly studies. The 72
studies range from the Massachusetts Institute of Technology’s (MIT) two decade long study of
SPI methods from the largest Japanese corporations, Microsoft, and Netscape, the seminal
laboratories of IBM, the Software Engineering Institute (SEI), and straight from reports of recent
SEI CMM Level 5 organizations.
This section’s survey and analysis, like the previous one, revealed a non-standard
plethora of SPI strategies consisting of over 451 individual SPI techniques. Eventually, it is the
intention of this overall study to identify the relevant SPI strategies, not by qualitative judgement
such as keyword analysis or popular survey, but by directly attaching the cost and benefits of the
individual SPI techniques to the SPI techniques themselves. This study will attempt to let the
data speak for itself and keep qualitative interpretation to a minimum. Thus, it is the intention of
Figure 2. Software process improvement (SPI) strategies from survey of 72 case studies.
64
50
0
10
20
30
40
50
60
70
Process
Metrics
Design
Manag
emen
t
Quality
Inspe
ction
Process
Total Q
uality
Man
agem
ent Tools
Defect
Density Test
Config
uratio
n Man
agemen
t
SEI CMM
Reuse
Preven
tion
Custom
er Sati
sfacti
on
Requir
ement
s
Person
al Soft
ware Proc
essTeam
s
Trainin
g
Clean R
oom
Orthog
onal
Defect
Classif
icatio
n
ISO 9000
Baldrig
e
Formal
Method
sPeo
ple
Quality
Functi
on D
eploy
ment
Risk
Busine
ss Tran
sform
ation
Digital
Strateg
y
Process
Inno
vation
Profit
Reengin
eering
Resista
nce E
mbracem
ent
Statist
ical P
rocess
Contro
l
Worl
d Wide
Web
Software Process Improvement (SPI) Strategies
Lite
ratu
re S
urve
y C
itatio
n Fr
eque
ncy
4135
3128
22 21 19 1913 13 11 10 9 9 8 8 7 5 5 4 3 2 2 2 2 1 1 1 1 1 1 1 1

Using Cost 33
sm Personal Software Process and PSP are service marks of Carnegie Mellon University.
this study to be “quantitative” in nature, not qualitative. But, that’s a topic for the next three
sections and the next two chapters.
As shown in Figure 2, 35 categories of SPI techniques were identified by this section’s
survey of 72 representative studies consisting of 451 individual SPI techniques. The first 17 SPI
categories included, Process, Metrics, Design, Management, Quality, Inspection Process, Total
Quality Management, Tools, Defect Density, Test, Configuration Management, SEI CMM,
Reuse, Prevention, Customer Satisfaction, Requirements, and Personal Software Processsm
(PSPsm). The last 18 SPI categories included, Teams, Training, Clean Room, Orthogonal Defect
Classification, ISO 9000, Baldrige, Formal Methods, People, Quality Function Deployment,
Risk, Business Transformation, Digital Strategy, Process Innovation, Profit, Reengineering,
Resistance Embracement, Statistical Process Control, and World Wide Web.
As shown in Figure 2, Process as a SPI strategy was cited the most often, 64 out of 451
times, or approximately 14% of the time. The World Wide Web, on the other hand, was cited the
least often, 1 out of 451 times, or 0.22% of the time. As stressed earlier, this analysis does not
imply that Process as a SPI strategy is superior to the World Wide Web, but merely that Process
was used 64X more often then the World Wide Web as reported by the 72 case studies surveyed
in this section. The next chapter will attach the costs and benefits of using Process versus other
key SPI strategies, in order to help determine which methods are superior, and are thus
recommended by this study.
Figure 3 groups the previously identified 35 SPI categories into nine major classes for
further analysis. Baldrige, Inspection Process, ISO 9000, Orthogonal Defect Classification,
Prevention, Personal Software Process, Quality, Test, and Total Quality Management were all
grouped together to form the Quality SPI class, accounting for 28% of the individual SPI

Using Cost 34
techniques. Configuration Management, Process, Profit, Reengineering, and SEI CMM were all
grouped together to form the Process SPI class, accounting for 19% of the individual SPI
techniques. Customer Satisfaction, Defect Density, Metrics, and Statistical Process Control were
all grouped together to form the Metrics SPI class, accounting for 18% of the individual SPI
techniques. Clean Room, Design, Formal Methods, Quality Function Deployment, and Reuse
were all grouped together to form the Design SPI class, accounting for 14% of the individual SPI
techniques. Management, People, Resistance Embracement, and Risk were all grouped together
to form the Management SPI class, accounting for 9% of the individual SPI techniques. Business
Transformation, Digital Strategy, Process Innovation, Tools, and World Wide Web were all
grouped together to form the Automation SPI class, accounting for 6% of the individual SPI
techniques. The Requirements, Teams, and Training SPI classes, respectively, account for 2% of
the individual SPI techniques.
Figure 3. Further software process improvement (SPI) strategy classification.
Design14%
Metrics18%
Process19%
Quality28%
Training2%
Teams2%
Automation6%
Management9%
Requirements2%

Using Cost 35
Again, this doesn’t necessarily mean that Quality-oriented SPI strategies are superior to
all others, and that SPI approaches like Automation are inferior to all others. In fact, Davenport
(1993), Davidson (1993), Reid (1997), and more recently Downes and Mui (1998) have been
reporting that Automation as a process improvement strategy is quantitatively and economically
superior to all of the others. But, once again, the final determination is for the next two chapters
of this study. What this analysis does indicate is that Quality-oriented SPI strategies are a
conservative favorite among organizations engaging in SPI, while Automation is emerging and
not yet fully embraced. But, this study will examine these issues in further detail in the analysis
and conclusions.
Garrison and Noreen (1997b) report that there are two approaches to improving
profitability: (a) increasing volume and total revenue while maintaining relative variable and
fixed costs and (b) reducing variable and fixed costs while maintaining current volume. Garrison
and Noreen go on to report that the most common and historically preferable approach to
improving profits is to increase volume and thus total revenue while maintaining relative
variable and fixed costs, especially for cost intensive products and services. Garrison and Noreen
(1997a) report that two common methods of reducing costs are to: (a) decrease the cost of value
adding and non-value adding activities through process value analysis (PVA) and (b) improve
quality by reducing the number defects through defect prevention and appraisal activities (see
Table 2). Garrison and Noreen (1997a) report that cost reducing approaches, such as process
value analysis (PVA), activity-based costing (ABC), and quality management lead to increased
cost control and management and are directly controllable, though cumbersome, and have break-
even points of their own that need to be monitored carefully.

Using Cost 36
Garrison and Noreen (1997a and 1997b) set the context for the rest of this section and the
remainder of this study. Garrison and Noreen (1997b) report that the most common historical
method of increasing profitability has been to increase volume through fixed cost-based
advertising. Garrison and Noreen (1997a) report that the more cumbersome and less used
approach is to reduce variable and fixed costs by process and quality improvement. This study
focuses on the definitions, costs, and benefits associated with process and quality improvement.
The remainder of Chapter 2 and the rest of this study focus on the costs and benefits of process
and quality improvement methods and approaches, the road less traveled, thus establishing the
context for Chapter 3, the methodology.
ActivityProcess
Defect Prevention and Appraisal Processes
Table 2
Prevention
Appraisal
Systems developmentQuality engineeringQuality trainingQuality circlesStatistical process control activitiesSupervision of prevention activitiesQuality data gathering, analysis, and reportingQuality improvement projectsTechnical support provided to suppliersAudits of the effectiveness of the quality system
Test and inspection of incoming materialsTest and inspection of in-process goodsFinal product testing and inspectionSupplies used in testing and inspectionSupervision of testing and inspection activitiesDepreciation of test equipmentMaintenance of test equipmentPlant utilities in the inspection areaField testing and appraisal at customer site

Using Cost 37
Arthur (1997) enumerated five techniques that enabled U.S. West to achieve what he
called “quantum” or major improvements in software management and development
performance, such as 50% improvements in quality, cost, and cycle times (see Table 3). The first
technique Arthur reports is to focus directly on the performance results that need to be achieved,
such as reducing defects, cycle time, and rework costs, not company-wide training in total
quality management (TQM) theory. The second technique Arthur reports is to focus SPI efforts
directly on the source of the areas needing improvement, utilizing those directly involved, not
company-wide quality circles solving broad-ranging company-wide problems of processes that
aren’t within the purview of the improvement teams. The third technique Arthur reports is to
focus SPI efforts on improving the customer’s perception of the product or service, such as low
quality, high cost, long delivery times, and poor service, not on solving internal sociological
problems that will never impact the customer. The fourth technique Arthur reports is to focus the
SPI resources on only the people directly involved in the areas needing improvement, such as
TechniqueStrategy
U.S. West's Software Process Improvement (SPI) Principles
Table 3
Mistakes Focus on learning instead of resultsLack of focusLack of sponsorshipTrying to involve everyone, not just the people focused on key resultsTeaching theory instead of developing real world experience
Solutions Focus directly on the performance results that need to be achievedFocus efforts directly on the source of areas needing improvementFocus efforts on improving the perception of the product or serviceFocus resources on those directly involved on the improvement areasFocus resources on the techniques necessary to solve specific problems

Using Cost 38
® Capability Maturity Model and CMM are registered in the U.S. Patent and Trademark Office.
those that have a hands-on association to the problem areas, not involving those that don’t
directly contribute to the problems being solved. The fifth technique Arthur reports is to focus
SPI resources on teaching the concise techniques necessary to solve specific problems, not teach
theory such as TQM or software process improvement philosophy. Arthur summarizes by stating
that organizations should focus improvement efforts, focus on immediate results, use accelerated
methods, and define consistent processes using flowcharts, measuring defects, time, and cost.
Humphrey (1989) created a five-stage SPI method known as the Software Engineering
Institute’s (SEI’s) Capability Maturity Model® for Software (CMM®) beginning in 1987 (see
Table 4). The SEI’s CMM dates back to an early 1960s era IBM manufacturing process
improvement concept and technical report entitled, “Process Qualification—Manufacturing’s
Insurance Policy” as reported by Harrington (1991). IBM’s manufacturing process qualification
technique was translated several times over the last three decades into Crosby’s (1979) “Maturity
Grid,” IBM’s (Radice, Harding, Munnis, and Phillips, 1985) “Process Grid,” Humphrey’s (1987)
“Process Maturity Grid,” and then into Paulk’s, Weber’s, Curtis’, and Chrissis’ (1995)
“Capability Maturity Model for Software (CMM).” The SEI’s CMM is a staged model consisting
of five groups or Levels of purportedly important software management processes called Key
Process Areas (KPAs). The five CMM Levels are Initial, Repeatable, Defined, Managed, and
Optimizing (Humphrey 1989). There are no KPAs for the Initial Level signifying an undefined,
immature, or worst state of software management capability (Humphrey, 1989). The KPAs for
the Repeatable Level are Requirements Management, Software Project Planning, Software
Project Tracking and Oversight, Software Subcontract Management, Software Quality
Assurance, and Software Configuration Management, signifying a defined and repeatable
software project-level management capability (Humphrey, 1989). The KPAs for the Defined

Using Cost 39
Level are Organization Process Focus, Organization Process Definition, Training Program,
Integrated Software Management, Software Product Engineering, Intergroup Coordination, and
Peer Reviews, signifying a defined and repeatable organizational-wide software management
process (Humphrey, 1989). The KPAs for the Managed Level are Quantitative Process
Management and Software Quality Management, signifying a defined and repeatable
organization-wide software measurement and statistical analysis process (Humphrey, 1989). The
KPAs for the Optimizing Level are Process Change Management, Technology Change
Management, and Defect Prevention, signifying a defined and repeatable software process
Key Process Area (KPA)Level
SEI Capability Maturity Model for Software (CMM)
Table 4
Optimizing
Managed
Defined
Repeatable
Initial
Process Change ManagementTechnology Change ManagementDefect Prevention
Software Quality ManagementQuantitative Process Management
Peer ReviewsIntergroup CoordinationSoftware Product EngineeringIntegrated Software ManagementTraining ProgramOrganizational Process DefinitionOrganizational Process Focus
Software Configuration ManagementSoftware Quality AssuranceSoftware Subcontract ManagementSoftware Project Tracking and OversightSoftware Project PlanningRequirements Management
None
Software process improvement (SPI)Information technology insertion(self explanatory)
Use of software quality metricsUse of statistical management methods
Software Inspection ProcessMulti-program project communicationsSoftware design, development, and testMulti-program/project managementSoftware engineering process trainingMulti-program/project process standardsMulti-program/project process definition
(self explanatory)process and product auditing (not test)(self explanatory)Structured project management methodsWritten software project plansSoftware requirements engineering
None
Additional Explanation

Using Cost 40
improvement process (Humphrey, 1989). In summary, the SEI’s CMM is a five stage process of
defining software project management processes, defining organizational wide software
management processes, defining organizational wide measurement and statistical analysis
processes, and then defining organizational wide software process improvement processes. The
SEI (1999) reports that 80% of the software organizations worldwide are at SEI CMM Levels 1
and 2, and therefore have no organizational-wide processes for software management,
measurement and statistical analysis, and software process improvement.
Cosgriff (1999a and 1999b), Oldham et al. (1999), and Craig (1999) report that Hill AFB
used the SEI’s CMM as their primary SPI method, achieving CMM Level 5 in 1998 (see Figure
4). Cosgriff (1999a) cites the use of SEI CMM-Based Assessments for Internal Process
Improvement (CBA-IPIs) and Software Capability Evaluations (SCEs) by Hill AFB. However,
Level 5Optimizing
Yea
r tha
t CM
M L
evel
Ach
ieve
d
Figure 4. Ogden air logistics center software process improvement (SPI) journey.
1997
1998
1992
Level 4Managed
Level 3Defined
Level 2Repeatable
Level 1Initial
Software Engineering Institute (SEI) Capability Maturity Model for Software (CMM)
0
1994
1995
1992
1993
1994
1998
1995
1996
1997

Using Cost 41
Oldham et al. (1999) mentions the use of defect density metrics, the Software Inspection Process,
and cycle time metrics as key components of Hill AFB’s SPI efforts. Craig reports that focusing
on the SEI CMM’s Software Quality Assurance (SQA) Key Process Area (KPA) is a critical
element of Hill AFB’s CMM Level 5 organization. Cosgriff (1997b) reports on twelve elements
of Hill AFB’s SPI efforts, management sponsorship, project planning, operational definitions,
software quality assurance, software configuration management, product lines, intergroup
coordination, measurement, quantitative process management, software quality management,
process change management, and technology change management, mirroring the SEI CMM’s
KPAs.
Yamamura and Wigle (1997) report that Boeing’s Defense and Space Group also used
the SEI’s CMM as a primary SPI method, achieving CMM Level 5 in 1996. Actually,
Yamamura and Wigle report that Boeing’s 17 year SPI journey started in the early 1980s (see
Table 5). Yamamura and Wigle report that Boeing’s SPI efforts occurred in four main phases,
defining process standards, use of the Software Inspection Process and defect density metrics,
use of cycle time reduction and productivity increase initiatives, and for the last two years, the
use of the SEI’s CMM. So, Yamamura and Wigle report that having defined processes, using
inspections and defect density metrics, and having cycle time reduction and productivity increase
initiatives, enabled Boeing to achieve CMM Level 5 after only two years of using the SEI’s
CMM. Wigle and Yamamura (1997) cite two key elements of Boeing’s SPI efforts, charter a
software engineering process group (SEPG) based on continuous SPI (not conducting
assessments) and staff the SEPG with key hands-on project members (not ivory tower
specialists). Wigle and Yamamura enumerate seven of fourteen SPI techniques, such as
obtaining management sponsorship, establishing realistic goals, overcoming individual

Using Cost 42
resistance, educating everyone in the basics, overcoming challenges associated with new SPI
teams, establishing an SEPG, and capturing as-is processes first. Wigle’s and Yamamura’s
remaining seven SPI techniques include thoroughly documenting processes, properly interpreting
the CMM, defining rapidly deployable processes, formalizing SPI processes themselves, forming
appropriate organizational policies, managing compliance with internal or external standards,
and using emerging technologies such as intranets to deploy processes.
StrategyTimeframe
Boeing Defense and Space Software Process Improvement (SPI) Journey
Table 5
1996
Mid 1990s
Technique
Early 1990s
SEI CMM Framework
Quality Teams
Process Management
Late 1980s Process Management
Early 1980s Process Definition
Achieved CMM Level 5
Deployment ProcessUpgraded software process improvement (SPI) groupAdded software process improvement (SPI) processesFocused on achieving capability levels
Focused on increasing productivityFocused on reducing cycle timeAdded more software metrics and measurementsConducted process evaluations
Focused on reducing defectsCreated design review boardAdded more software metrics and measurementsUpdated software engineering processesIntroduced a six step software engineering processConducted software engineering process training
Created software work product standardsCreated company software engineering standardsCreated basic software metrics and measurementsCreated software engineering process libraryDocumented software engineering processes

Using Cost 43
Jones (1996 and 1997a) reports to have measurements, costs, and benefits for SPI
involving 7,000 software projects, 600 software development organizations, and six industries.
Jones reports that organizations go through six distinct stages or approaches to SPI. Jones refers
to these so-called “six stages of software excellence” as, management technologies, software
processes and methodologies, new tools and approaches, infrastructure and specialization,
reusability, and industry leadership (see Table 6). Jones first three of six SPI methods are,
management technologies (referring to improvement of software project planning), software
StrategyStage
SPR Software Process Improvement (SPI) Model
Table 6
Methods and Techniques
One
Two
Three
Four
Five
Zero
Six
Software Inspection Process
Software process assessmentsBaselinesBenchmarks
Project planningResource estimationProject tracking
Requirements managementJoint Application Design (JAD)
Computer aided software engineering (CASE)Client/server technologies and strategiesObject oriented methods
Establish configuration management functionEstablish test and maintenance functionEstablish software quality assurance function
Reuse of software architectures and designsReuse of software life cycle artifactsReuse of software source code
Project management tool suites/environmentSoftware development tool suites/environmentSoftware quality/test tool suites/environment
Assessment
Management
Process
Tools
Infrastructure
Reuse
Leadership

Using Cost 44
processes and methodologies (referring to improvement of technical activities such as software
requirements analysis and design), and new tools and approaches (referring to the insertion of
new computer technologies). Jones last three of six SPI methods are, infrastructure and
specialization (referring to the formation of functional specialization groups such as software
quality assurance), reuse (referring to reusing software life cycle artifacts and software source
code), and industry leadership (referring to automation of all software life cycle management and
development functions).
Diaz and Sligo (1997) report that Motorola’s Government Electronics Division (GED)
used the SEI’s CMM as their primary SPI method for achieving CMM Level 5 as early as 1995
(see Table 7). Diaz and Sligo report that Motorola developed a “Software Quality Management
Manual” that defined software processes and began widespread use of the Software Inspection
Process, helping Motorola to achieve CMM Level 3 in 1992. Diaz and Sligo report the formation
of SPI working groups, creation of software project metrics tracking tools, the use of quality
metrics (most likely defect density metrics), and the creation of a “Handbook for Quantitative
Management of Software Process and Quality,” helping Motorola to achieve CMM Level 4 in
1994. Diaz and Sligo report the formation of defect prevention working groups, “defect
prevention handbook,” CMM Level 5 metrics tools, and the formation of process and technology
change management handbooks, helping Motorola achieve CMM Level 5 as early as 1995. Diaz
and Sligo report nine SPI techniques for achieving and maintaining SEI CMM Level 5. Diaz’
and Sligo’s first four SPI techniques include, focusing on improving new projects, assessing the
intent of CMM KPAs, emphasizing productivity, quality, and cycle time, and getting managers
committed to SPI. Diaz’ and Sligo’s remaining five SPI techniques include, involving only
hands-on software managers and developers in performing SPI, getting managers to believe in

Using Cost 45
SPI benefits, keeping customers informed, creating organizationally unique process
documentation, and overcoming resistance to change.
Haley (1996) reports Raytheon Electronic Systems’ Equipment Division used the SEI’s
CMM as their primary SPI method for achieving CMM Level 3 in 1991 (see Table 8). Haley
reports that Raytheon’s SPI model consisted of two methods, establishing a SPI infrastructure
and SPI measurement and analysis. Haley reports that Raytheon’s SPI infrastructure method
consisted of four elements, a policy and procedures working group to define processes, a training
working group to deploy software processes, a tools and methods working group to identify
Target
Motorola Software Process Improvement (SPI) Strategy
Table 7
Strategies, Methods, and Techniques
Organizational software engineering policy
Software life cycle management manualCross functional software teams
CMM Level 3
CMM Level 4
CMM Level 5
Software Inspection Process
Organizational software engineering procedures
Position
CMM Level 2
CMM Level 3
CMM Level 4
Year
1989
CMM Level 5
1992
1994
1995
Senior practioner process improvement groupSenior task leader process improvement groupProject effort metrics collection toolSoftware process and quality metrics handbook
Defect prevention working groupDefect prevention handbookChief software engineer group expansionProject kickoff (to begin at CMM Level 5)Project self assessmentsLevel 5 software metrics collection toolDoubled process improvement group numberProcess and technology change handbooksWeekly CMM Level 5 improvement meetings
Focus on improving new projectsCMM Level 5Assess intent of CMM for each new projectEmphasize productivity, quality, and cycle timeManagement and staff commitment and belief

Using Cost 46
automated software tools, and a process database working group to manage software process
assets. Haley reports that Raytheon’s SPI measurement method consisted of two elements, data
measurement definitions of key software metrics and data analysis to illustrate how to interpret
and manage the key software metrics and measurements. Additionally, Haley reports on two key
SPI leverage points or techniques used by Raytheon for achieving and maintaining SEI CMM
Level 3, product improvement and process improvement. Haley reports that Raytheon’s product
improvement leverage point consisted of four elements, participation in system definition by
software personnel, requirements definition to identify customer needs, inspections to identify
software defects, and integration and qualification testing to formalize testing. Haley reports that
Method
Raytheon Software Process Improvement (SPI) Strategies
Table 8
Technique
Policy and procedures working group Software engineering policy
Strategy
Infrastructure
Training working group
Tools and methods working group
Process database working group
Data measurement definitionsMeasurementData analysis
Software engineering practicesDetailed procedures and guidelinesTrain everyoneTraining during work hoursOverview and detailed coursesTool selection and evaluationCommercial-off-the-shelf (COTS)Rapid pathfinding tool laboratorySoftware engineering processesProject and project kickoff dataSoftware quality data
Process, project, and product metricsEarned value management
Focus Points Product improvement
Process improvement
System and requirements definitionSoftware Inspection ProcessIntegration and qualification testingSoftware development planningTrainingPathfinding
Metrics Focus Defect density metricsAppraisal to failure ratiosCost performance indices and coding
Product qualityCost of qualityPredictability and productivity

Using Cost 47
Raytheon’s process improvement leverage point consisted of three elements, software
development planning to formalize project planning, training to teach software processes, and
pathfinding to establish software development tool sets for software personnel.
McGibbon (1996), Director of the Data and Analysis Center for Software (DACS) at
Rome Laboratory in Rome, New York identified the costs and benefits of using various SPI
methods. McGibbon developed a quantitative analytical model for evaluating, selecting, and
using three principal SPI methods (see Table 9). McGibbon did so by conducting a survey and
performing quantitative analysis of SPI methods, costs, and benefits, selecting the most cost-
effective and beneficial approaches. McGibbon identified the Software Inspection Process,
Definition
DACS Software Process Improvement (SPI) Strategies
Table 9
SubprocessesProcess
Software Inspection
Software Reuse
Waterfall
Clean Room
Development process
Product appraisal
Asset management
Development process
Develop product
Identify defects
Reuse artifacts
Develop product
Goal
AnalysisDesignCodeTest
PlanningOverviewPreparationInspectionReworkFollow-Up
Produce Reusable AssetsBroker Reusable AssetsConsume Reusable Assets
Function SpecificationUsage SpecificationIncremental Development PlanFormal DesignCorrectness VerificationRandom Test Case GenerationStatistical TestingReliability Certification Model

Using Cost 48
Software Reuse, and the Clean Room Methodology as three of the best SPI methods, developing
a SPI cost model to enumerate concise benefits such as development costs, rework costs,
maintenance costs, and development and maintenance savings, for individual users and use.
McGibbon chose these three SPI methods analytically and quantitatively because of their cost
efficiency, defect removal efficiency (their ability to identify and remove defects before software
product delivery), and ultimately their ability to result in the production of the highest possible
quality products and services at the lowest possible cost. McGibbon also judged and compared
these three methods for their ability to result in the lowest possible software maintenance costs.
McGibbon optimized his SPI model, approach, and methodology for software quality, in terms
of the absence of identifiable defects.
Schafer, Prieto-diaz, and Matsumoto (1994), leading Software Reuse and Domain
Analysis experts on three continents, conducted an analysis of eight leading Software Reuse and
Domain Analysis methodologies (see Table 10). Schafer, Prieto-diaz, and Matsumoto
determined that the eight Software Reuse and Domain Analysis methodologies were composed
of five common phases, stages, or processes. Schafer, Prieto-diaz, and Matsumoto identified the
five common Software Reuse and Domain Analysis phases to be domain characterization, data
collection, data analysis, taxonomic classification, and evaluation. Schafer, Prieto-diaz, and
Matsumoto report that the domain characterization phase is composed of five subprocesses,
business analysis, risk analysis, domain description, data identification, and inventory
preparation. Schafer, Prieto-diaz, and Matsumoto report that the data collection phase is
composed of four subprocesses, abstraction recovery, knowledge elicitation, literature review,
and analysis of context and scenarios. Schafer, Prieto-diaz, and Matsumoto report that the data
analysis phase is composed of seven subphases, identification of entities, operations, and
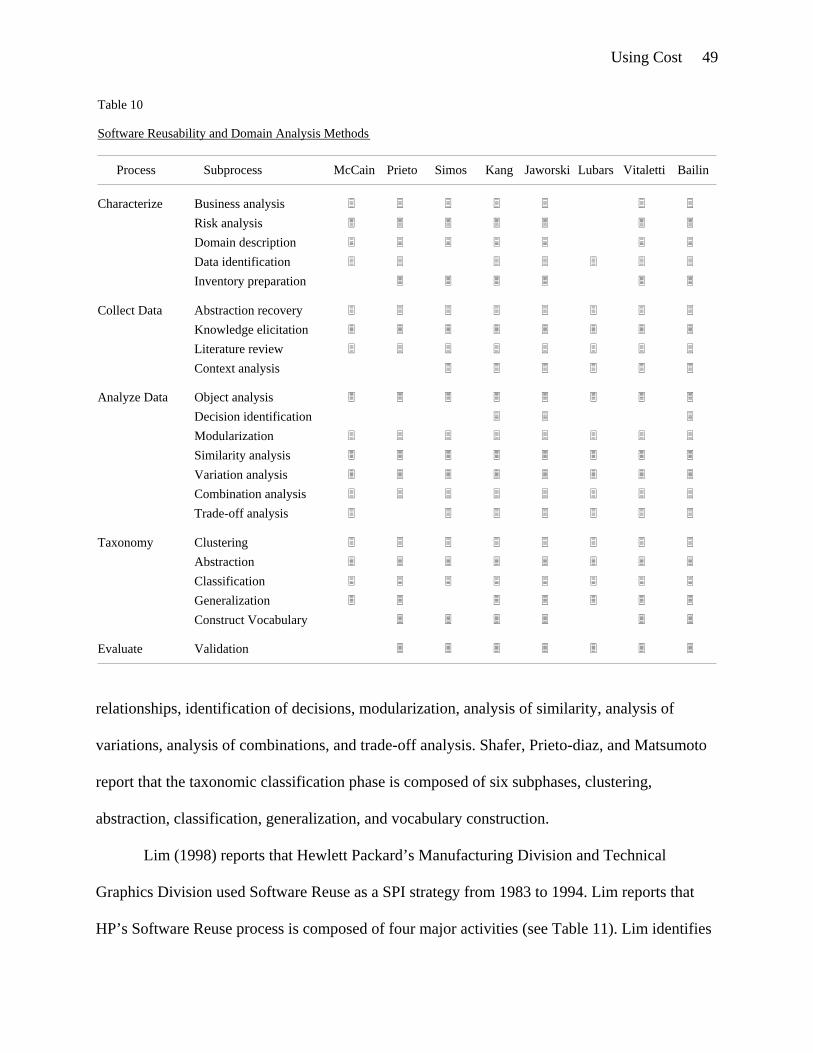
Using Cost 49
relationships, identification of decisions, modularization, analysis of similarity, analysis of
variations, analysis of combinations, and trade-off analysis. Shafer, Prieto-diaz, and Matsumoto
report that the taxonomic classification phase is composed of six subphases, clustering,
abstraction, classification, generalization, and vocabulary construction.
Lim (1998) reports that Hewlett Packard’s Manufacturing Division and Technical
Graphics Division used Software Reuse as a SPI strategy from 1983 to 1994. Lim reports that
HP’s Software Reuse process is composed of four major activities (see Table 11). Lim identifies
Software Reusability and Domain Analysis Methods
Table 10
SubprocessProcess
Collect Data
Analyze Data
Characterize
Taxonomy
Business analysis
McCain
Evaluate
Risk analysisDomain descriptionData identificationInventory preparation
Abstraction recoveryKnowledge elicitationLiterature reviewContext analysis
Object analysisDecision identificationModularizationSimilarity analysisVariation analysis
Trade-off analysis
ClusteringAbstractionClassificationGeneralizationConstruct Vocabulary
Combination analysis
Validation
Prieto Simos Kang Jaworski Lubars Vitaletti Bailin

Using Cost 50
HP’s four major Software Reuse activities as managing the reuse infrastructure, producing
reusable assets, brokering reusable assets, and consuming reusable assets. Lim reports that
producing reusable assets consists of analyzing domains, producing assets, and maintaining and
enhancing assets. Lim reports that brokering reusable assets consists of assessing assets for
brokering, procuring assets, certifying assets, adding assets, and deleting assets. Finally, Lim
reports that consuming reusable assets consists of identifying system and asset requirements,
locating assets, assessing assets for consumption, and integrating assets.
Hewlett Packard Software Reuse Process
Table 11
Subprocess
Managing the reuse infrastructure Establish rules, roles, and goals that support reuse
Process
Producing reusable assets
Brokering reusable assets
Consuming reusable assets
Designate conventions and standardsApprove additions, deletions, and changes to the libraryCommission component constructionCoordinate schedules and resourcesAlign reuse goals to business goalsEstablish and award incentivesInterpret metrics dataImplement economic models
Analyze domainProduce assetsMaintain and enhance assets
Assess assets for brokeringProcure assetsCertify assetsAdd assetsDelete assets
Identify system and asset requirementsLocate assetsAssess assets for consumptionIntegrate assets

Using Cost 51
Kaplan, Clark, and Tang (1995) identified the Clean Room Methodology as a
strategically important SPI strategy in wide use throughout IBM from 1987 to 1993. Kaplan,
Clark, and Tang report that the Clean Room Methodology is composed of seven subprocesses
including, function specification, usage specification, incremental development plan, formal
design and correctness verification, random test case generation, statistical testing, and reliability
certification model. Kaplan, Clark, and Tang report that the Clean Room Methdology is built on
the foundation of formal methods, formal specification, and formal verification (see Figure 5).
Bauer, Collar, and Tang (1992) report that IBM’s AS/400 Division used ten general
management principles as a primary process improvement method from 1986 to 1990, resulting
Figure 5. Clean room methodology.
FunctionSpecification
UsageSpecification
IncrementalDevelopment
Plan
FormalDesign
andCorrectness
Specification
RandomTest CaseGeneration
StatisticalTesting
ReliabilityCertification
Model

Using Cost 52
in winning the Malcolm Baldrige National Quality Award in 1990 and creating an internationally
best selling midrange computer system (see Table 12). Bauer, Collar, and Tang report that IBM’s
process improvement methods included, choosing a visionary leader, creating a visionary team,
IBM Rochester Organizational Process Improvement Strategy
Table 12
Strategic ElementsStrategy
1.
2.
3.
4.
5.
6.
7.
8.
9.
10.
Visionary leaders
Institutionalize vision
Empowerment
Multi-discipline teams
Market segmentation
Market research
Prioritize resources
Parallel processes
Strategic partnerships
Satisfy customer
Articulate visionLiberate creative organizational energies
Align organizational structure to visionResource strategic organizational structures
Trust people to use their own judgementEquip, train, and resource people
Form integrated cross-functional teamsEmpower cross-functional teams
Select target marketsFocus resources on target markets
Use scientific market analysis models and toolsGather, analyze, and model market data
Establish priorities based on goals/objectivesRank goals, objectives, markets and investments
Reject old, sequential, and step-by-step methodsPursue endeavors concurrently
Identify external insights and expertiseOutsource strategic products and services
Exceed customer expectations
Inspire people to perform beyond their abilities
Empower strategic organization structures
Provide performance incentives and rewards
Resource and incentivize cross-functional teams
Differentiate products and services
Simulate and predict market outcomes
Allocate and manage resources by prioritization
Prevent and eliminate defects early
Focus on core competencies
Determine customer's perceptions/expectationsUse quantitative customer satisfaction models

Using Cost 53
empowerment, using cross functional teams, segmenting your market, researching your markets,
setting priorities, using parallel processes and doing it right the first time, forming strategic
partnerships, and exceeding customer expectations. Bauer, Collar, and Tang reported that IBM
created a special task force or tiger team to win the Malcolm Baldrige National Quality Award.
The tiger team studied the Baldrige Award criteria, created strategic and tactical plans, gathered
the evidence, created the application package, and submitted it three years in a row before
winning the Malcolm Baldrige National Quality Award. Bauer, Collar, and Tang report that
IBM’s new AS/400 had already drawn $14 billion in revenues for the IBM Corporation by the
first time IBM Rochester initially applied for the Malcolm Baldrige National Quality Award.
Sulack, Lindner, and Dietz (1989) report IBM’s AS/400 Division used a measurement-
intensive software quality management life cycle as a primary SPI method from 1986 to 1989,
resulting in winning the Malcolm Baldrige National Quality Award in 1989 and creating an
internationally best-selling midrange computer system (see Table 13). Sulack, Lindner, and Dietz
report that IBM’s software quality life cycle, otherwise known as a Rayleigh life cycle reliability
model-based defect removal life cycle, was composed of four major components. Sulack,
Lindner, and Dietz report that the four components included a software process life cycle,
management techniques and controls, design and development, and product verification. Sulack,
Lindner, and Dietz report that IBM’s software process life cycle consisted of broad use of the
Software Inspection Process to identify defects, an incremental software life cycle to simplify
development, and concurrent-overlapping software life cycle iterations to shorten cycle time.
(These software process life cycle elements in combination are referred to as a defect removal
model-based concurrent incremental software life cycle architecture.) Sulack, Lindner, and Dietz
report that IBM’s management techniques and controls consisted of change control or software

Using Cost 54
configuration management, design control groups to manage system-wide architecture decisions,
and dependency management or interface control groups to manage program wide
communication. Sulack, Lindner, and Dietz report that IBM’s design and development
techniques consisted of establishing development objectives or milestones to achieve goals,
establishing performance design points to characterize product performance, and utilizing
usability design methods to design optimal human-computer interfaces. Sulack, Lindner, and
Dietz report that IBM’s product verification techniques consisted of a formalized four-phase test
process, milestone testing to establish user-centered testing objectives, and reuse in testing.
IBM Rochester Software Process Improvement (SPI) Strategy
Table 13
Strategic ElementStrategy
Software process life cycle
Management techniques and controls
Design and development
Product verification
Ensuring user acceptance
Worldwide announcement
Software Inspection ProcessIncremental life cycleParallel life cycle phases
Change control techniquesDesign control groupsDependency management
Development objectivesPerformance design pointsUsability development
Four phase test processTesting cycle considerationsReuse in testingTest automationTest staging
Internal contract test teamsIndependent contract testingCommunications field testingMigration invitational
Concurrent translationDistribution project officeEarly shipment program

Using Cost 55
Kan, Dull, Amundson, Lindner, and Hedger (1994) report IBM strengthened the AS/400
Division’s measurement-intensive software quality management life cycle with additional SPI
methods from 1989 to 1994, helping IBM become ISO 9000 registered. Kan et al. reports that
IBM Rochester’s SPI strategy consisted of customer satisfaction management, in-process
product quality management, post-general availability (GA) product quality management,
continuous process improvement, and performance incentives (see Table 14).
IBM Rochester AS/400 Software Quality Management System (SQMS)
Table 14
Strategic ElementsStrategy
1.
2.
3.
4.
5.
Customer Satisfaction Management
In-Process Product Quality Management
Post-GA Product Quality Management
Continuous Process Improvement
Performance Incentives
CapabilityUsability
ReliabilityInstallability
Defect Removal ModelSoftware Inspection Process
Defect Density MetricsReliability Growth Models
Defect Prevention ProcessExpert Systems
Process BenchmarkingSoftware Maturity Assessments
Yearly Quality TargetsObject Oriented Technology
Workstations
General Managers Award
In-Process Quality AwardLong-Term Quality Award
Performance
Maintainability
Minibuilds
Problem Tracking
Strong Process Discipline
Software Metrics Guidelines
Small Teams
Monthly Quality Award
ISO 9000
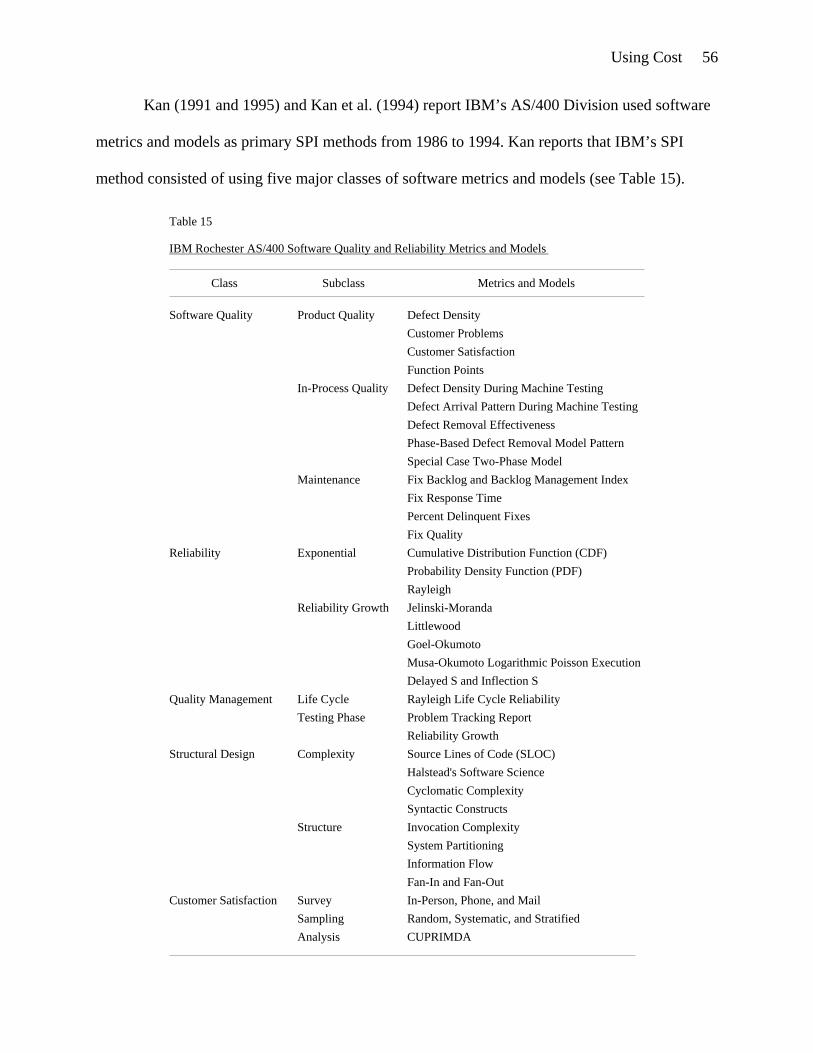
Using Cost 56
Kan (1991 and 1995) and Kan et al. (1994) report IBM’s AS/400 Division used software
metrics and models as primary SPI methods from 1986 to 1994. Kan reports that IBM’s SPI
method consisted of using five major classes of software metrics and models (see Table 15).
Subclass
IBM Rochester AS/400 Software Quality and Reliability Metrics and Models
Table 15
Metrics and Models
Product Quality
Class
Software Quality
Reliability
Quality Management
Structural Design
Customer Satisfaction
In-Process Quality
Maintenance
Exponential
Reliability Growth
Defect Arrival Pattern During Machine Testing
Phase-Based Defect Removal Model PatternDefect Removal Effectiveness
Defect DensityCustomer ProblemsCustomer SatisfactionFunction PointsDefect Density During Machine Testing
Fix Response TimePercent Delinquent FixesFix Quality
Fix Backlog and Backlog Management IndexSpecial Case Two-Phase Model
Cumulative Distribution Function (CDF)Probability Density Function (PDF)
Goel-OkumotoMusa-Okumoto Logarithmic Poisson Execution
LittlewoodJelinski-Moranda
Delayed S and Inflection S
Rayleigh
Rayleigh Life Cycle ReliabilityProblem Tracking Report
Life CycleTesting Phase
Reliability GrowthSource Lines of Code (SLOC)Halstead's Software ScienceCyclomatic ComplexitySyntactic ConstructsInvocation Complexity
Complexity
StructureSystem PartitioningInformation FlowFan-In and Fan-Out
Survey In-Person, Phone, and MailSampling Random, Systematic, and StratifiedAnalysis CUPRIMDA

Using Cost 57
The five classes of software metrics and models included software quality, reliability,
quality management, structural design, and customer satisfaction elements. Kan reports that
software quality metrics and models consisted of product quality, in-process quality, and
maintenance elements. Kan reports that reliability metrics and models consisted of exponential
and reliability growth elements. Kan reports that quality management metrics and models
consisted of life cycle and testing phase elements. Kan reports that structural design metrics and
models consisted of complexity and structure elements. Finally, Kan reports that customer
satisfaction metrics and models consisted of survey, sampling, and analysis elements. Specific
software quality metrics and models reported by Kan include, defect density, customer problems,
customer satisfaction, function points, defect removal effectiveness, phase-based defect removal
model pattern, special case two-phase model, fix backlog and backlog management index, fix
response time, percent delinquent fixes, and fix quality. Specific software reliability metrics and
models reported by Kan include, cumulative distribution function, probability density function,
Rayleigh model, Jelinski-Moranda, Littlewood, Goel-Okumoto, Musa-Okumoto logarithmic
Poisson execution, and delayed-S and inflection-S. Specific software quality management
metrics and models reported by Kan include, Rayleigh life cycle reliability, problem tracking
report, and testing phase reliability growth. Specific structural design metrics and models
reported by Kan include, source lines of code (SLOC), Halstead’s software science, cyclomatic
complexity, syntactic constructs, invocation complexity, system partitioning, information flow,
and fan-in and fan-out. Specific customer satisfaction metrics and models reported by Kan
include, in-person, phone, and mail surveys, random, systematic, and stratified sampling, and
capability, usability, performance, reliability, installability, maintainability,
documentation/information, and availability (CUPRIMDA).

Using Cost 58
Kan, Basili, and Shapiro (1994) conducted a survey of software process and quality
improvement methods from the perspective of IBM, the University of Maryland—College Park,
and NASA Goddard Space Flight Center’s (GSFC) Software Engineering Laboratory (SEL).
Kan’s, Basili’s, and Shapiro’s survey identified five broad classes of SPI methods (see Table 16).
Subclass
IBM Rochester, University of Maryland, and NASA GSFC Quality Survey
Table 16
Specific TechniqueClass
Total Quality Management Individual Philip CrosbyW. Edwards DemingArmand V. FeigenbaumKaoru IshikawaJ. M. Juran
Industry Malcolm Baldrige National Quality AwardMotorola Six Sigma StrategyIBM Market Driven QualityHewlett Packard Total Quality ControlCapability Maturity ModelLean Enterprise Management
Academia Quality Improvement ParadigmExperience FactoryGoal Question Metric
Customer Focus Computer Aided Software EngineeringQuality Function Deployment
Small Team Approach
Rapid Throwaway PrototypingIterative Enhancement and Development
Early Customer FeedbackIBM Customer Quality Partnership Program
Needs Analysis
Product Evolution
Customer Burn-In
Process and Technology Defect Prevention ProcessDesign ReviewsSoftware Inspection ProcessWalkthroughsVienna Development MethodZ Notation
PreventionAppraisal
Formal Methods
Input/Output Requirements LanguageClean Room Methodology
Design Paradigms Object Oriented Design and ProgrammingComputer Aided Software EngineeringSoftware Reuse
Organizational BehaviorMeasurement and Analysis
Management Leadership and EmpowermentQuality, Reliability, and Structural DesignSoftware Metrics

Using Cost 59
Kan, Basili, and Shapiro reported the five classes to be total quality management,
customer focus, process and technology, organizational behavior, and measurement and analysis.
According to Kan, Basili, and Shapiro, total quality management consists of individual, industry,
and academia, customer focus consists of needs analysis, product evolution, and customer burn-
in, process and technology consists of prevention, appraisal, formal methods, and design
paradigms, organizational behavior includes management, and measurement and analysis
includes software metrics. Total quality management techniques are reported to include, Philip
Crosby’s, W. Edward Deming’s, Armand V. Feigenbaum’s, Kaoru Ishikawa’s, J. M. Juran’s,
Malcolm Baldrige National Quality Award, IBM Market Driven Quality, Hewlett Packard Total
Quality Control, Capability Maturity Model, Lean Enterprise Management, Quality
Improvement Paradigm, Experience Factory, and Goal Question Metric. Customer focus
techniques are reported to include, Computer Aided Software Engineering, Quality Function
Deployment, Rapid Throwaway Prototyping, Iterative Enhancement and Development, Small
Team Approach, Early Customer Feedback, and IBM Customer Quality Partnership Program.
Process and technology is reported to include, Defect Prevention Process, Design Reviews,
Software Inspection Process, Walkthroughs, Vienna Development Method, Z Notation,
Input/Output Requirements Language, Clean Room Methodology, Object Oriented Design and
Programming, Computer Aided Software Engineering, and Software Reuse. Organizational
behavior and measurement and analysis are reported to include Leadership and Empowerment
and Quality, Reliability, and Structural Design.
Jones (1985), Mays, Jones, Holloway, and Studinski (1990), and Gale, Tirso, and
Burchfield (1990) report that IBM Communication Systems designed a software defect
prevention process (circa 1980 to 1984), resulting in the invention of IBM’s most “powerful”

Using Cost 60
SPI method used by IBM worldwide (Kaplan, Clark, and Tang, 1995). Jones reports that IBM’s
SPI method consists of five components, stage kickoff meetings, causal analysis meetings, action
databases, action teams, and repositories (see Figure 6). Jones reports that stage kickoff meetings
are held to remind the stage participants of common errors to avoid. Jones reports that causal
analysis meetings are held after the stage is complete to review the defects committed during the
stage, and plan defect prevention. Jones reports that an action database is used to formally
capture and manage defect prevention measures identified by causal analysis meetings. Jones
reports that action teams meet to implement suggestions identified by causal analysis meetings.
Finally, Jones reports that a repository is used to store actions for stage kickoff meetings.
FeedbackStageKickoffMeeting
CausalAnalysisMeeting
ActionDatabase
ActionTeam
Defects
Repository
Technical Team Leader Causal Analysis Leader Action Team Leader
Field ErrorsSuggestions
Suggestions Suggestions
Actions
Suggestions
KickoffPackage
Defect Prevention Process
Figure 6. IBM research triangle park defect prevention process.

Using Cost 61
Chillarege, Bhandari, Chaar, Halliday, Moebus, Ray, and Wong (1992), Bhandari,
Halliday, Chaar, Chillarege, Jones, Atkinson, Lepori-Costello, Jasper, Tarver, Lewis, and
Yonezawa (1994), Bassin, Kratschmer, and Santhanam (1998), and Mendonca, Basili, Bhandari,
and Dawson (1998) describe orthogonal defect classification (ODC) as a SPI method (see Figure
7). Chillarege et al. and Bhandari et al. report that IBM’s Thomas J. Watson Research Center
created ODC to perfect and automate defect identification, classification, and prevention.
Chillarege et al. and Bhandari et al. report that ODC is a seven step process of identifying
defects, identifying defect triggers, correcting defects, identifying defect types, performing
IdentifyDefects
IdentifyDefect
Triggers
CorrectDefects
IdentifyDefectTypes
PerformAttributeFocusing
IdentifyProcess
Improvements
ImproveProcesses
Defects
DefectInformation
DefectTriggerAttributes
DefectTypeAttributes
AttributeFocusCharts
ProcessImprove-ments
ImprovedProcesses
CandidateDefects
ODC Process
Process ArchitectODC ToolWork Product Author
Figure 7. IBM's orthogonal defect classification (ODC) process.

Using Cost 62
attribute focusing, identifying process improvements, and improving processes. Chillarege et al.
and Bhandari et al. report that identifying defects is primarily a result of software verification
and validation processes such as the Software Inspection Process, software testing, and even ad
hoc sources such as customer discovery. Chillarege et al. and Bhandari et al. report that
identifying defect triggers is a process of identifying the activity that was being carried out when
the defect was discovered, such as the Software Inspection Process, unit testing, function testing,
and system testing. Chillarege et al. and Bhandari et al. report that correcting defects is a process
of repairing the discovered problem, often times associated with the Rework Phase of the
Software Inspection Process. Chillarege et al. and Bhandari et al. report that identifying defect
types is a process of identifying the kind of defect that was discovered during structured and ad
hoc software verification and validation, such as assignment/serialization, checking,
algorithm/method, function/class/object, timing/serialization, interface/OO messages, and
relationship. Chillarege et al. and Bhandari et al. report that performing attribute focusing is a
process of developing defect trigger attribute distributions which determine the effectiveness of
individual software verification and validation activities, and defect type attribute signatures
which determine the health of the software work product at any given stage of development.
Chillarege et al. and Bhandari et al. report that identifying process improvements is both an
automatic and manual process of determining what needs to be done to correct a deficient
product and the means of long term process correction based on defect trigger attribute
distributions and defect type attribute signatures. Chillarege et al. and Bhandari et al. report that
improving processes is a manual process of correcting software management and development
processes to prevent software process and product failures.

Using Cost 63
Billings, Clifton, Kolkhorst, Lee, and Wingert (1994) report that IBM Houston’s NASA
Space Shuttle program used a measurement-intensive software quality management life cycle as
a primary SPI method from 1976 to 1993, resulting in CMM Level 5, NASA Excellence Award,
IBM Best Software Lab, and IBM Silver Level (see Table 17).
Strategy
IBM Houston NASA Space Shuttle Software Process Improvement (SPI)
Table 17
Specific TechniquePeriod
1970s Project Management
Quality Assurance
Testing
1980s Configuration Management
Life Cycle Management
Process Assessments
Software Quality Management
Requirements Analysis
Cost Measurement
Software Architecture Review BoardSchedule Measurement
Problem Report TrackingDesign ReviewsCode Reviews
Independent TestingSimulation TestingTesting on Actual Flight Hardware
Customer Configuration Control BoardSupport Software BoardDiscrepancy Report BoardRequirements Review Board
Incremental Release StrategyRequirements Planning
Independent Verification
NASA Excellence AwardMalcolm Baldrige National Quality AwardIBM Quality AwardSEI Capability Maturity Model for Software
Defect Density MetricsSoftware Inspection ProcessDefect Prevention Process
Organizational Improvement Requirements Analysis ProcessSoftware Inspection Process
Software Reliability Modeling
1990s Software Process Enactment Automated Software MetricsAutomated Testing
Process Ownership Teams Requirements, Design, and Code TeamsDevelopment and Independent Test Teams

Using Cost 64
Billings, Clifton, Kolkhorst, Lee, and Wingert report that IBM Houston’s SPI strategy
consisted of ten principle elements, project management, quality assurance, testing, configuration
management, life cycle management, process assessments, software quality management,
organizational improvement, software process enactment, and process ownership teams. Project
management is reported to have consisted of requirements analysis, a Software Architecture
Review Board, schedule measurement, and cost measurement. Quality assurance is reported to
have consisted of problem report tracking, design reviews, and code reviews. Testing is reported
to have consisted of independent testing, simulation testing, and testing on actual flight
hardware. Configuration management is reported to have consisted of a Customer Configuration
Control Board, a Support Software Board, a Discrepancy Report Board, and a Requirements
Review Board. Life cycle management is reported to have consisted of requirements planning,
an incremental release strategy, and independent verification. Process assessments are reported
to have consisted of pursuit and receipt of the NASA Excellence Award, pursuit of the Malcolm
Baldrige National Quality Award, pursuit and receipt of the IBM Quality Award, and pursuit of
the SEI Capability Maturity Model for Software (CMM), receiving a CMM Level 5 rating.
Software quality management is reported to have consisted of the use of defect density metrics,
the Software Inspection Process, the Defect Prevention Process, and software reliability
modeling. Organizational improvement is reported to have consisted of scaling up the
requirements analysis process and the Software Inspection Process organization wide. Software
process enactment is reported to have consisted of automated software metrics and automated
testing. Process ownership teams are reported to have consisted of requirements, design, code,
development, and independent test teams.

Using Cost 65
Humphrey (1995, 1996, 1997, 1998a, and 1998b), Ferguson, Humphrey, Khajenoori,
Macke, and Matvya (1997), Hays and Over (1997), and Webb and Humphrey (1999) report that
the Software Engineering Institute (SEI) created the Personal Software Process (PSP) as a
quantitative SPI method in the late 1980s and early 1990s. Humphrey reports that the PSP is a
family of seven software life cycles, PSP0 Personal Measurement, PSP0.1 Personal
Measurement, PSP1 Personal Planning, PSP1.1 Personal Planning, PSP2 Personal Quality,
PSP2.1 Personal Quality, and PSP3 Cyclic Development (see Figure 8).
PSP0, Personal Measurement, consists of the current process, time recording, and defect
recording. PSP0.1, Personal Measurement, adds a coding standard, size measurement, and a
process improvement plan. PSP1, Personal Planning, adds size estimating and test reporting.
PSP1.1, Personal Planning, adds task planning and schedule planning. PSP2, Personal Quality,
adds code reviews and design reviews. PSP2.1, Personal Quality, add design templates. And,
PSP3, Cyclic Development, adds iteration.
PSP0 Current Process Time Recording Defect Recording PSP0.1
Coding Standard Size Measurement Process Improve-
ment PlanPSP1
Size Estimating Test Report
PSP1.1 Task Planning Schedule
Planning PSP2 Code Reviews Design Reviews
PSP2.1 Design Templates
PSP3 Cyclic
Development
Figure 8. Family of seven personal software process (PSP) life cycles.

Using Cost 66
PSP3, Cyclic Development consists of five phases or stages, Planning, High Level
Design, High Level Design Review, Development, and Postmortem (see Figure 9).
Planning consists of program requirements, size estimate, cyclic development strategy,
resource estimates, task/schedule planning, and a defect estimate. High Level Design consists of
external specifications, module design, prototypes, development strategy and documentation, and
an issue tracking log. High Level Design Review consists of design coverage, state machine,
logic, design consistency, reuse, and development strategy verification, and defect fixes.
Development consists of module design, design review, coding, code review, compile, test, and
reassessment/recycling. Postmortem consists of tracking defects, size, and time.
Logs
Planning Program Requirements Size Estimate Cyclic Development
Strategy Resource Estimates Task/Schedule Planning Defect Estimate
Development Module Design Design Review Code Code Review Compile Test Reassessment/Recycling
Postmortem Defects Injected Defects Removed Size Time
Scripts
High Level Design External Specifications Module Design Prototypes Development Strategy Development Strategy
Documentation Issue Tracking Log
HLD Review Design Coverage Verify State Machines Logic Verification Verify Design Consist. Reuse Verification Development Strategy
Verification Defect Fixes
Logs
Logs
Logs
Logs
Logs
Software Engineer
Figure 9. Personal software process (PSP) 3 - cyclic development life cycle.

Using Cost 67
Grady (1997) reports that Hewlett Packard Divisions align SPI strategies with core
competencies (see Table 18). One Hewlett Packard Division identified its core competencies as
quality control, process execution and predictability, and product enhancing, updates, and
delivery. The quality control core competency consisted of five SPI solutions, quality planning,
defect tracking, inspections, reliability modeling, and regression testing. The process execution
and predictability core competency consisted of process definition, project planning, product
architecture/design, defect tracking, failure analysis, the Software Inspection Process, software
configuration management, and a release process. The product enhancing, updates, and delivery
core competency consisted of defect tracking, software configuration management, on-line
support, customer feedback capture, and installation automation.
Hewlett Packard Divisional Software Process Improvement (SPI) Strategy
Table 18
Advantage/NeedCore Competency
Quality Control Quality Planning
Process Execution
Product Enhancement
Defect TrackingSoftware Inspection ProcessReliability ModelingRegression Testing
Quality prioritizationQuality focus and prioritizationInspect all specifications and designsTune model to different applicationsReduce time to do
Strategy
Process Definition Obtain ISO 9000 certificationProject Planning Create recommended modelProduct Architecture/Design Create better designDefect Tracking Quality focus and prioritizationFailure Analysis Assign ownership for actionSoftware Inspection Process Inspect all specifications and designsConfiguration Management Upgrade to supported modelRelease Process Document and standardize
Defect Tracking Quality focus and prioritizationConfiguration Management Upgrade to supported modelOn-Line Support Use full response-center resourcesCustomer Feedback Capture Create portfolio of customer surveysInstallation Automation Eliminate all need for handholding

Using Cost 68
Grady (1997) goes on to report that Hewlett Packard developed a standard portfolio of
SPI strategies (see Table 19). Hewlett Packard’s SPI strategy portfolio consists of eleven
individual SPI strategies or tactics, product definition improvement, detailed design methods,
rapid prototyping, systems design improvements, the Software Inspection Process, software
reuse, complexity analysis, configuration management, a certification process, software asset
management, and program understanding.
Grady (1997), Barnard and Price (1994), Grady and Van Slack (1994), Weller (1993),
Russell (1991), Sulack, Lindner, and Dietz (1989), and Fagan (1986 and 1976) report that
Hewlett Packard, AT&T Bell Laboratories, Bull HN Information Systems, and IBM used the
Software Inspection Process as a SPI strategy. Fagan reports that the Software Inspection Process
is a highly structured technique for identifying and removing defects from intermediate software
work products by team evaluation (see Figure 10). While technically the Software Inspection
Process is a product appraisal process typically associated with late and ineffective final
manufacturing inspections, the Software Inspection Process can be performed throughout a
Hewlett Packard Corporate Software Process Improvement (SPI) Strategies
Table 19
ApplicabilityStrategy
Product Definition ImprovementDetailed Design MethodsRapid PrototypingSystems Design ImprovementsSoftware Inspection ProcessSoftware ReuseComplexity AnalysisConfiguration ManagementCertification ProcessSoftware Asset ManagementProgram Understanding
Organizations that create new productsSystems with many interfacesComplex user interface and applicationsChronic schedule slips due to design issuesAll projectsStable environment/configuration managementSystems software and firmwareLarge and complex software product portfolioAll projectsDivisions with old existing codeAll maintenance and porting projects

Using Cost 69
software product life cycle, including the very early stages. Fagan reports that the Software
Inspection Process was invented by IBM in 1972, and is composed of six major subprocesses,
Planning, Overview, Preparation, Meeting, Rework, and Followup. Planning is to determine
whether an intermediate software work product is ready for team evaluation and to plan the team
evaluation. Overview is to introduce the software work product to the team for later evaluation.
Preparation is for team members to individually review and evaluate the software work product.
Meetings are to conduct the team evaluation of the software work product and identify defects.
Rework is to repair defects in the software work product identified by the team inspection.
Finally, Followups are to determine whether the defects were repaired and certify the software
work product as inspected. Fagan reports that the Software Inspection Process is a concisely
defined, step-by-step, and time-constrained process with very specific objectives.
Planning
Overview
Preparation
Meeting
Rework
Followup
Moderator Inspectors Author
Standard
Figure 10. Software inspection process.

Using Cost 70
Cusumano (1991) reports that The Massachusetts Institute of Technology (MIT) Sloan
School of Management conducted a study of the four largest Japanese computer and software
manufacturers from 1985 to 1989, yielding eleven common SPI strategies used by Fujitsu, NEC,
Hitachi, and Toshiba (see Table 20). Japan’s SPI strategies included, strategic management and
Strategy
Hitachi, Toshiba, NEC, and Fujitsu Software Process Improvement (SPI)
Table 20
Specific Technique
Strategic Management and Integration
Planned Economies of Scope
Commitment to Process Improvement
Product-Process Focus and Segmentation
Process-Quality Analysis and Control
Tailored and Centralized Process R&D
Dynamic Standardization
Systematic Reusability
Computer-Aided Tools and Integration
Incremental Product/Variety Improvement
Establishment of process improvement agendasFacility establishment focused on single productsSkill, standard, method, tool, and reuse tailoringDeveloping a series of products within a facilityDeliberate sharing of resources across projectsStandard, method, tool, and product sharingLong-term process improvement commitmentSerious commitment from top managersPolicy, control, and incentive institutedFocus on particular types of productsKnowledge accumulation for applicationsProcess segmentation and work channelization
Predictability in cost and schedulingDefect controlStandard processes, methods, and toolsDivision and facility process R&D centralization
Joint research between central laboratoriesCentralized tool and methodology R&D
Periodic review and change of standardsTool and technique refinementStandards for personnel performanceReuse tools, libraries, rewards, and controlsSystematic component reuse across productsManagement planning, controls, and incentivesComputer-aided software engineering toolsProject, data, reuse, quality, and analysis toolsExtensive tool and method integrationProduct design and performance upgradingStrong focus on designProduct variety expansion in individual factories
Late 1980s
Mid 1980s
Early 1980s
Mid 1960s
Late 1970s
Skills Standardization and Leverage Extensive training of all new recruitsTraining in standard process, methods and toolsCapability improvement for process and quality
Early 1970s
Timeframe

Using Cost 71
integration, planned economies of scope, commitment to process improvement, product-process
focus and segmentation, process-quality analysis and control, tailored and centralized process
R&D, skills standardization and leverage, dynamic standardization, systematic reusability,
computer-aided tools and integration, and incremental product/variety improvement.
Strategy
Microsoft Software Process Improvement (SPI) Strategies
Table 21
Specific Technique
Find Smart People Hire a CEO with a deep understanding of both the technology and the businessOrganize flexibly around and across product markets and business functionsHire the smartest managers you can findHire the smartest employees you can find
Organize Small Teams Establish functional specialties, work in small teams and overlap responsibilitiesLet functional experts define and hire for their technical specialtiesEducate new hires through learning by doing and mentoringCreate career paths and "ladder levels" to retain and reward technical people
Evolve Mass MarketsIncrementally improve new products and make old products obsoleteEnter evolving mass markets early or stimulate new markets with good products
Push volume sales and exclusive contracts to ensure products become standardsTake advantage of being the standards provider with new productsIntegrate, extend, and simplify products to reach new mass markets
Evolve Product Features Divide large projects into multiple milestone cycles with no maintenance cyclesUse a vision statement and outliine specification of features to guide projectsBase feature selection and prioritization on user activities and dataEvolve a modular and horizontal design architecture with a mirror organizationControl by individual commitments to small tasks and "fixed" project resources
Parallelize Activities Work in parallel teams, but "synch up" and debug dailyAlways have products you can theoretically ship with versions for every marketSpeak a common language on a single development siteContinuously test the product as you build itUse metric data to determine milestone completion and product release
Continuous Self Critique Systematically learn from past and present projects and productsEncourage feedback and improvement with quantitative metrics and benchmarksView customer support as part of the product and as data for improvementPromote linkages and sharing across product groups
Attack the Future Create products and services for consumers instead of software developersCreate up-front, per-activity, and per-transaction pricing structuresCreate simple unified product and service offerings on yearly cyclesBlur the distinctions between applications, operating systems, and networksBlur the differences between computers, televisions and cable television systems

Using Cost 72
Cusumano and Selby (1995 and 1997) report that the Massachusetts Institute of
Technology (MIT) Sloan School of Management conducted a case study of software
management at the Microsoft Corporation from 1993 to 1995. Cusumano and Selby, identified
seven major management strategies used by Microsoft (see Table 21). The seven strategies are,
find smart people who know the technology, organize small teams of overlapping functional
specialists, pioneer and orchestrate evolving mass markets, focus creativity by evolving features
and “fixing” resources, do everything in parallel with frequent synchronizations, improve
through continuous self-critiquing, feedback, and sharing, and attack the future.
Cusumano and Selby identified “synch-and-stabilize” approach as a critical Microsoft
software development strategy consisting of seven processes (see Table 22). Cusumano and
Selby further report the existence of a critically-important, eleven step daily build process.
Software Development Strategy
Microsoft Synch-and-Stabilize Software Development Approach
Table 22
Product development and testing done in parallel
Vision statement and evolving specification
Features prioritized and built in 3 or 4 milestone subprojects
Frequent synchronizations (daily builds) and intermediate stabilizations (milestones)
"Fixed" release and ship dates and multiple release cycles
Customer feedback continuous in the development process
Product and process design so that large teams work like small teams
Check Out: Check out private copies of the source code from a central master version of the source code Implement Feature: Implement the feature by making changes, adding, or deleting source code Build Private Release: Build a private version of the product using private copies of source code Test Private Release: Test the private release of the product to make sure the new feature works Synch Code Changes: Compare the private copies of source code to master versions for differences Merge Code Changes: Update private copies of source code with other changes to the same source code Build Private Release: Build a private release with individual as well as group source code changes Test Private Release: Test the private relese to make sure that newly implemented features work Execute Quick Test: Execute a highly automated "smoke test" on the private release of source code Check In: Check in source code if the private release and quick test are successful Generate Daily Build: "Build Master" generates complete build using central master source code version

Using Cost 73
Cusumano and Yoffie (1998) report that The Massachusetts Institute of Technology
(MIT) Sloan School of Management conducted a study of software management at the Netscape
Corporation from 1996 to 1998. Cusumano and Yoffie identified four major software
management strategies in use at Netscape (see Table 23).
The four strategies consisted of, scaling an organization on Internet time, formulating
judo strategy on Internet time, designing software on Internet time, and developing software on
Internet time. Scaling an organization consists of, create a compelling, living vision of products,
technologies, and markets, hire and acquire managerial experience, in addition to technical
Strategy
Netscape Principles for Competing on Internet Time
Table 23
Scaling an Organization on Internet Time
Create a compelling, living vision of products, technologies, and markets that is tightly linked to action Hire and acquire managerial experience, in addition to technical expertise Build the internal resources for big company, while organizing like a small one Build external relationships to compensate for limited internal resources
Formulating Judo Strategy on Internet Time
Move rapidly to uncontested ground in order to avoid head-to-head combat Be flexible and give way when attacked directly by superior force Exploit leverage that uses the right and strategy of opponents against them Avoid sumo competitions, unless you have the strength to overpower your opponent
Designing Software on Internet Time
Design products for multiple markets (platforms) concurrently Design and redesign products to have more modular architectures Design common components that multiple product teams can share Design new products and features for parallel development
Developing Software on Internet Time
Adapt development priorities as products, markets, and customers change Allow features to evolve but with frequent synchronizations and periodic stabilizations Automate as much testing as possible Use beta testing, internal product usage, and other measures to improve product and process quality

Using Cost 74
expertise, build the internal resources for a big company, while organizing like a small one, and
build external relationships to compensate for limited internal resources. Formulating judo
strategy consists of, move rapidly to uncontested ground, be flexible and give way when attacked
directly by superior force, exploit leverage that uses the weight and strategy of opponents against
them, and avoid sumo competitions, unless you have the strength to overpower your opponent.
Designing software consists of, design products for multiple markets (platforms) concurrently,
design and redesign products to have more modular architectures, design common components
that multiple product teams can share, and design new products and features for parallel
development. Developing software consists of, adapt development priorities as products,
markets, and customers change, allow features to evolve but with frequent synchronizations and
periodic stabilizations, automate as much testing as possible, and use beta testing, internal
product usage, and other measures to improve product and process quality.
Tingey (1997) of the IBM Corporation in New York, New York conducted an analysis of
three leading international quality management systems (QMS), identifying three major SPI
strategies. Tingey identified the Malcolm Baldrige National Quality Award, the International
Organization for Standardization (ISO) 9001, and the Software Engineering Institute’s (SEI’s)
Capability Maturity Model (CMM) for Software (see Table 24). The Malcolm Baldrige National
Quality Award is composed of seven components, Leadership, Information and Analysis,
Strategic Planning, Human Resource Development and Management, Process Management,
Business Results, and Customer Focus and Satisfaction. ISO 9001 is composed of twenty
components, the first ten of which are Management Responsibility, Quality System, Contract
Review, Design Control, Document/Data Control, Purchasing, Control of Customer-Supplied
Product, Product Identification and Traceability, Process Control, and Inspection and Testing.

Using Cost 75
The last ten ISO 9001 components are Control of Inspection, Measuring, and Test Equipment,
Inspection and Test Status, Control of Nonconforming Product, Corrective and Preventative
Action, Handling, Storage, Packaging, Preservation, and Delivery, Control of Quality Records,
Internal Quality Audits, Training, Servicing, and Statistical Techniques. The SEI’s CMM is
composed five components or Levels, Initial, Repeatable, Defined, Managed, and Optimizing.
ISO 9001, Malcolm Baldrige, and Capability Maturity Model Elements
Table 24
Management Responsibility LEADERSHIP
Quality System
Contract Review
Design Control
Document and Data Control
Purchasing
Control of Customer-Supplied Product
Product Identification and Traceability
Process Control
Inspection and Testing
Control of Inspection/Test Equipment
Inspection and Test Status
Control of Nonconforming Product
Corrective and Preventative Action
Handling/Storage/Packaging/Delivery
Control of Quality Records
Internal Quality Audits
Training
Servicing
Statistical Techniques
Senior Executive Leadership
Leadership System and Organization
Public/Corporate Citizenship
INFORMATION AND ANALYSIS
Management of Information and Data
Competitive Compare/Benchmark
Analysis and Uses of Company Data
STRATEGIC PLANNING
Strategy Development
Strategy Deployment
HUMAN RESOURCES
Human Resource Planning/Evaluate
High Performance Work Systems
Employee Education and Training
Employee Well-Being/Satisfaction
PROCESS MANAGEMENT
Design/Introduction Product/Service
Product/Service Production/Delivery
Support Service
Management of Supplier Performance
BUSINESS RESULTS
Product and Service Quality Results
Operational/Financial Results
Supplier Performance Results
CUSTOMER SATISFACTION
ISO 9001 Malcolm Baldrige Capability Maturity Model
Customer and Market Knowledge
Customer Relationship Management
Customer Satisfaction Determination
Customer Satisfaction Results
Customer Satisfaction Comparison
REPEATABLE
DEFINED
MANAGED
OPTIMIZING
Requirements Management
Software Project Planning
Software Project Tracking/Oversight
Software Subcontract Management
Software Quality Assurance
Software Configuration Management
Organization Process Focus
Organization Process Definition
Training Program
Integrated Software Management
Software Product Engineering
Intergroup Coordination
Peer Reviews
Quantitative Process Management
Software Quality Management
Defect Prevention
Technology Change Management
Process Change Management
INITIAL
N/A

Using Cost 76
Harrington (1995) identifies six major organizational improvement strategies, Total Cost
Management, Total Productivity Management, Total Quality Management, Total Resource
Management, Total Technology Management, and Total Business Management (see Table 25).
Strategy
Organizational Improvement Strategies
Table 25
Total Cost Management
Total Productivity Management
Total Quality Management
Total Resource Management
Total Technology Management
Total Business Management
Element, Component, Activity, Method, or TechniqueActivity-Based Costing (ABC)Just-in-Time (JIT) Cost AccountingProcess Value Analysis (PVA)Performance ManagementResponsibility AccountingIntegrated Financial Reporting
Lessening of government regulationsInvest in capital equipmentInvest in research and developmentMake all management aware of the problemMake effective use of creative problem solvingIncrease use of automation and roboticsIncrease teamwork and employee involvementExpand international marketsDo the job right the first timeStart with top management involvementEducate all levels of managementUnderstand your external customer's requirementsPrevent errors from occuringUse statistical methods to solve problems and control processesTrain all employees in team and problem-solving methodsFocus on the process as the problem, not the peopleHave a few good suppliersEstablish quality and customer-related measurementsFocus on the internal as well as external customersUse teams at all levels to solve problems and make decisionsAggressive employee training and empowermentEffective and efficient inventory managementOptimal floor space managementUse the most advanced technologyFocus on applied researchUse concurrent engineeringCapitalize on using information technology (IT)Product and service diversification analysisConsolidation analysisProduct support analysisTechnology analysisBusiness-line analysisInvestment analysis
Poor-Quality Cost
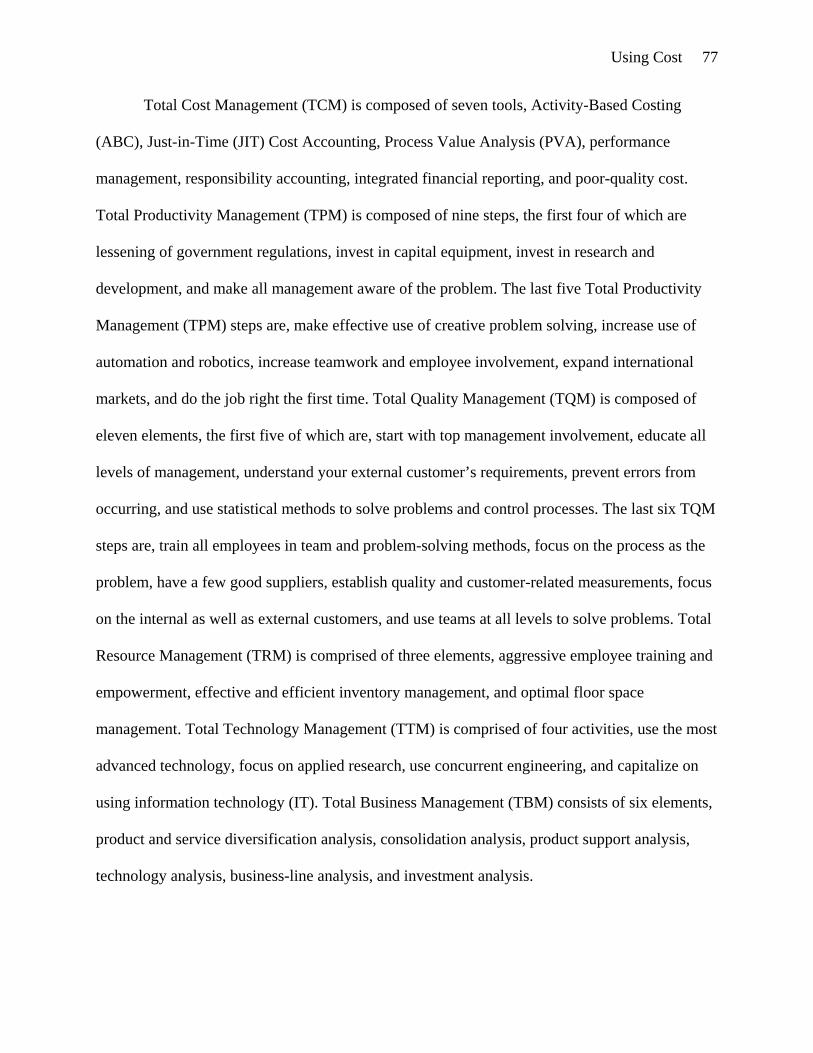
Using Cost 77
Total Cost Management (TCM) is composed of seven tools, Activity-Based Costing
(ABC), Just-in-Time (JIT) Cost Accounting, Process Value Analysis (PVA), performance
management, responsibility accounting, integrated financial reporting, and poor-quality cost.
Total Productivity Management (TPM) is composed of nine steps, the first four of which are
lessening of government regulations, invest in capital equipment, invest in research and
development, and make all management aware of the problem. The last five Total Productivity
Management (TPM) steps are, make effective use of creative problem solving, increase use of
automation and robotics, increase teamwork and employee involvement, expand international
markets, and do the job right the first time. Total Quality Management (TQM) is composed of
eleven elements, the first five of which are, start with top management involvement, educate all
levels of management, understand your external customer’s requirements, prevent errors from
occurring, and use statistical methods to solve problems and control processes. The last six TQM
steps are, train all employees in team and problem-solving methods, focus on the process as the
problem, have a few good suppliers, establish quality and customer-related measurements, focus
on the internal as well as external customers, and use teams at all levels to solve problems. Total
Resource Management (TRM) is comprised of three elements, aggressive employee training and
empowerment, effective and efficient inventory management, and optimal floor space
management. Total Technology Management (TTM) is comprised of four activities, use the most
advanced technology, focus on applied research, use concurrent engineering, and capitalize on
using information technology (IT). Total Business Management (TBM) consists of six elements,
product and service diversification analysis, consolidation analysis, product support analysis,
technology analysis, business-line analysis, and investment analysis.

Using Cost 78
McConnell (1996) conducted an analysis of software management and development best
practices or SPI strategies, identifying twenty-seven individual strategies (see Table 26).
The first thirteen SPI strategies are, Change Boards, Daily Builds, Designing for Change,
Evolutionary Delivery, Evolutionary Prototyping, Goal Setting, Inspections, Joint Application
Development, Life Cycle Model Selection, Measurement, Miniature Milestones, Outsourcing,
and Principled Negotiation. The last 14 SPI strategies are, Productivity Environments, Rapid-
Development Languages, Requirements Scrubbing, Reuse, Signing Up, Spiral Life Cycle,
Staged Delivery, Theory-W Management, Throwaway Prototyping, Timebox Development,
Tools Group, Top-10 Risks List, User-Interface Prototyping, and Voluntary Overtime.
Strategy
Steve McConnell's Software Best Practices
Table 26
Specific TechniqueChange Board An approach to controlling changes to a software productDaily Build and Smoke TestDesigning for ChangeEvolutionary DeliveryEvolutionary PrototypingGoal SettingSoftware Inspection ProcessJoint Application DevelopmentLife Cycle Model SelectionMeasurementMiniature MilestonesOutsourcingPrincipled NegotiationProductivity EnvironmentsRapid-Development LanguagesRequirements ScrubbingReuseSigning UpSpiral Life Cycle ModelStaged DeliveryTheory-W ManagementThrowaway PrototypingTimebox DevelopmentTools GroupTop-10 Risks ListUser-Interface PrototypingVoluntary Overtime
A process in which a software product is completely built every dayDesigning a software product for easy maintenance programmingA balance between staged delivery and evolutionary prototypingA life cycle model in which the system is developed in incrementsEstablishment and commitment to a small, clear set of goalsProduct appraisal process optimized for software defect identificationA requirements-definition and user-interface design methodologyUse of a software life cycle contingency modelThe use of software metrics, models, and measurementsA fine-grained approach to software project tracking and controlPaying an outside organization to develop a software productStrategy for improved communications and creation of win-win optionsThe use of private, noise-free office space for software developersHigh productivity, fourth generation programming languagesThe elimination of complex software requirements from specificationsThe development and use of prefabricated software source codeProcess of building individual and team esteem and belief in a projectLife cycle model involving iteration, risk management and prototypingA life cycle model in which software is developed in stagesEstablishment of a software project in which all stakeholders benefitProduction of temporary software models for requirements elicitationA construction-time practice that helps to infuse a sense of urgencyOrganization responsible for identifying software development toolsManaging projects based on prioritizing critical problem areasUse of temporary user interface models for eliciting requirementsMotivation of software developers to work hard for intangible rewards

Using Cost 79
Kaplan, Clark, and Tang (1995) report that IBM’s Santa Teresa software development
laboratories in Silicon Valley, California, used 40 innovations or SPI strategies from 1989 to
1995, resulting in the award of IBM’s highest and most prestigious quality award, IBM’s gold
medal for excellence (see Table 27).
The first ten SPI strategies are, The Excellence Council, Departmental Quality Strategies,
Seminar Series, The Leadership Institute, Quality Publications, Programming Development
Handbooks, Extended Unit Testing, Satisfaction Surveys, Joint Application Development, and
Process Modeling Methods and Tools. SPI strategies eleven through twenty are, The Center for
Software Excellence, The Council System, an ISO 9000 strategy, Rigorous Code Inspections,
Early Test Involvement, Combined Line Item and Function Test, Error-Prone Module Analysis,
High-Risk Module Analysis, Customer Survey Data Linkage Analysis, and Strategic Focus. SPI
IBM Santa Teresa Software Process Improvement (SPI) Strategies
Table 27
Leadership Category Process Category Technology Category
Awareness
Baldrige Stage
Coping
Management
Integration
Deparmental Quality Strategy
The Excellence Council
Quality Publications
Seminar Series
The Leadership Institute
Extended Unit Testing
Programming Handbooks Satisfaction Surveys
Joint Application Development
Process Modeling Methods
Center for Software Excellence
The Council System
ISO 9000
Customer Survey Data Analysis
Software Inspection Process
Early Test Involvement
Combined Line Item Test
Error-Prone Module Analysis
High-Risk Module Analysis
Strategic Focus
Empowerment
Quality Week Analysis of the Competition
Process Benchmarking
Defect Prevention Process
Object-Oriented Design
Computerized Team Workspaces
Electronic Meetings
On-Line Reviews
LAN Library Control System
Rapid Prototyping
Clean Room Methodology
Continuous Improvement Reviews
WorkForce 2000
Quality Exchanges
Quality Partnerships
Business Partner Quality Process
Performance Mining
Orthogonal Defect Classification
Quality Return on Investment

Using Cost 80
strategies twenty-one through thirty are, Empowerment, Quality Week, Defect Prevention,
Process Benchmarking, Analysis of the Competition, Computer-Supported Team Work Spaces,
Electronic Meetings, On-line Reviews, Local Area Network Library Control Systems, and
Object-Oriented Design and Coding. The final ten SPI strategies are, Rapid Prototyping, Clean
Room Techniques, Continuous Improvement Reviews, Quality Exchanges, Workforce 2000,
Quality Partnerships with Customers, Business Partner Quality Process, Performance Mining,
Orthogonal Defect Classification, and Quality Return-on-Investment.
Austin and Paulish (1993) of the Software Engineering Institute (SEI) at Carnegie Mellon
University (CMU) conducted a survey of software process improvement in the early 1990s,
identifying thirteen principle strategies (see Table 28).
Scope
SEI-Identified Software Process Improvement (SPI) Strategies
Table 28
Environment
Product
Process
ISO 9000
Software Metrics
Interdisciplinary Group MethodTotal Quality Management
Software Inspection ProcessSoftware Reliability EngineeringQuality Function Deployment
EstimationSoftware Process AssessmentProcess Definition
CASE ToolsDefect Prevention Process
Clean Room Methodology
Strategy CMM Level
3
4
33
34
233
55
4
4
Principle Key Process Area
Organization Process Definition
Quantitative Process Management
Intergroup CoordinationOrganization Process Focus
Peer ReviewsQuantitative Process ManagementSoftware Quality Management
Software Project PlanningOrganization Process FocusOrganization Process Definition
Technology Change ManagementDefect Prevention
Software Quality Management

Using Cost 81
The thirteen SPI strategies included, estimation, ISO 9000, Software Process Assessment
(SPA), process definition, Software Inspection Process, software metrics, computer-aided
software engineering (CASE), interdisciplinary group methods (IGMs), software reliability
engineering, Quality Function Deployment (QFD), Total Quality Management (TQM), the
Defect Prevention Process, and the Clean Room Methodology.
Strategy
Process Innovation Strategies
Table 29
Process Improvement
Process Innovation
Technique
Activity-Based Costing (ABC)Process Value Analysis (PVA)
Total Quality Management (TQM)Industrial Engineering (IE)
Code GenerationConferencingConventional ProgrammingCurrent ApplicationsData Gathering and Analysis ToolsDecision Analysis SoftwareDesktop Graphics ToolsExecutive Information Systems (EIS)Fourth-Generation Languages (4GL)General Communications TechnologiesGroup Decision-Support Systems (GDSS)HypermediaIdea Generation ToolsInformation EngineeringObject-Oriented Programming (OOP)PC-Based Prototyping ToolsProcess Modeling ToolsProgrammable Databases and SpreadsheetsProject Management ToolsPrototypingRapid Systems Development TechniquesSimulationStoryboardingStrategic Application DatabasesSystems Reengineering ProductsTechnology Trend DatabasesVery High-Level Languages
Computer Aided Software Engineering (CASE)
Business Process Improvement (BPI)

Using Cost 82
Davenport (1993) conducted a survey of organizational improvement strategies and
methods at over 70 international businesses in the early 1990s, identifying two broad classes of
organizational improvement strategies, Process Improvement strategies and Process Innovation
strategies (see Table 29). Process Improvement strategies include, Activity-Based Costing
(ABC), Process Value Analysis (PVA), Business Process Improvement (BPI), Total Quality
Management (TQM), and Industrial Engineering (IE). Davenport reports that Process Innovation
is an entire class unto itself that is sharply distinguished from ordinary process improvement
consisting of heavy doses of automation and information technology (IT) to make broad-based
sweeping organizational changes. The first fourteen of Davenport’s Process Innovation strategies
include, computer aided software engineering (CASE), code generation, conferencing,
conventional programming, current applications, data gathering and analysis tools, decision
analysis software, desktop graphics tools, executive information systems (EIS), fourth-generation
languages, general communications technologies, group decision-support systems, hypermedia,
and idea generation tools. The second fourteen of Davenport’s Process Innovation strategies
include, information engineering, object-oriented programming, PC-based prototyping tools,
process modeling tools, programmable databases and spreadsheets, project management tools,
prototyping, rapid systems development techniques, simulation, storyboarding, strategic
application databases, systems reengineering products, technology trend databases, and very
high-level languages.
Davenport further identifies Process Innovation strategies that accompany common
organizational functions, such as, prototyping, research processes, engineering and design
processes, manufacturing processes, logistics processes, marketing processes, sales and order
management processes, service processes, and management processes (see Tables 30 and 31).

Using Cost 83
Process Innovation strategies for prototyping include, fourth-generation languages,
object-oriented languages, subroutine libraries, databases, spreadsheets, hypermedia,
storyboarding packages, and code-generating CASE tools. Process Innovation strategies for
research processes include, computer-based laboratory modeling, computer-based field trials,
Organizational Function
Process Innovation Strategies Mapped to Organizational Functions
Table 30
Process Innovation StrategyPrototyping
Research
Engineering and Design
Manufacturing
Logistics
Fourth Generation LanguagesObject Oriented Languages
DatabasesSubroutine Libraries
SpreadsheetsHypermedia
Code Generating CASE ToolsStoryboarding Packages
Computer-Based Laboratory ModelingComputer-Based Field Trials
Project Status Information Dissemination SystemsTracking and Project Management Systems
Computer-Aided Design and Physical ModelingIntegrated Design Databases
Design for Manufacturability Expert SystemsStandard Component Databases
Component Performance History DatabasesConferencing Systems Across Design Functions
Linkages to Sales Systems for Build-to-OrderCross Functional Teams
Real-Time Systems for Custom ConfigurationMaterials and Inventory Management Systems
Diagnostic Systems for MaintenanceRobotics and Cell Controllers
Quality and Performance InformationWork Teams
Configuration SystemsElectronic Data Interchange and Payment Systems
Third-Party Shipment and Location Tracking SystemsClose Partnerships with Customers and SuppliersRich and Accurate Information Exchange

Using Cost 84
tracking and project management systems, and project status information dissemination systems.
Process Innovation strategies for engineering and design processes include, computer-aided
design and physical modeling, integrated design databases, standard component databases,
design-for-manufacturability expert systems, component performance history databases,
conferencing systems across design functions, and cross-functional teams. Process Innovation
strategies for manufacturing processes include, linkages to sales systems for build-to-order, real-
time systems for custom configuration and delivery commitment, materials and inventory
management systems, robotics and cell controllers, diagnostic systems for maintenance, quality
and performance information, and work teams. Process Innovation strategies for logistics
processes include, electronic data interchange and payment systems, configuration systems,
third-party shipment and location tracking systems, close partnerships with customers and
suppliers, and rich and accurate information exchange with suppliers and customers. Process
Innovation strategies for marketing processes include, customer relationship databases/frequent
buyer programs, point-of-sale systems tied to individual customer purchases, expert systems for
data and trend analysis, statistical modeling of dynamic market environments, and close linkages
to external marketing firms. Process Innovation Strategies for sales and order management
processes include, prospect tracking and management systems, portable sales force automation
systems, portable networking for field and customer site communications, and customer site
workstations for order entry and status checking. More of Process Innovation strategies for sales
and order management include, “choosing machines” that match products and services to
customer needs, electronic data interchange between firms, expert systems for configuration,
shipping, and pricing, and predictive modeling for continuous product replenishment.

Using Cost 85
The final set of Process Innovation strategies for sales and order management processes
include, composite systems that bring cross-functional information to desktops, customer,
product, and production databases, integration of voice and data, third-party communications and
videotext, case management roles or teams, and empowerment of frontline workers. Process
Innovation strategies for service processes include, real-time, on-site service delivery through
portable workstations, customer database-supported individual service approaches, service
personnel location monitoring, portable communications devices and network-supported
dispatching, built-in service diagnostics and repair notification, service diagnostics expert
Organizational Function
Process Innovation Strategies Mapped to Organizational Functions
Table 31
Marketing
Sales and Ordering
Service
Management
Process Innovation StrategyCustomer Relationship Databases/Frequent Buyer ProgramsPoint-of-Sale Systems Tied to Individual Customer Purchases
Statistical Modeling of Dynamic Market EnvironmentsExpert Systems for Data and Trend Analysis
Close Linkages to External Marketing FirmsProspect Tracking and Management Systems
Portable Networking for Field and Customer Site CommunicationsPortable Sales Force Automation Systems
Customer Site Workstatioins for Order Entry and Status Checking"Choosing Machines" that Match Products and Services to Customer Needs
Expert Systems for Configuration, Shipping, and PricingElectronic Data Interchange Between Firms
Predictive Modeling for Continuous Product ReplenishmentComposite Systems that bring Cross-Functional Information to Desktops
Third-Party Communications and VideotextIntegration of Voice and Data
Case Management Roles or TeamsEmpowerment of Frontline Workers
Customer Database-Supported Individual Service ApproachesReal-Time, On-Site Service Delivery through Portable Workstations
Service Personnel Location MonitoringPortable Communications Devices and Network-Supported Dispatching
Service Diagnostics Expert SystemsBuilt-In Service Diagnostics and Repair Notification
Composite Systems-Based Service Help DesksExecutive Information Systems that Provide Real-Time Information
Computer-Based Simulations that Support Learning-Oriented PlanningElectronic Linkages to External Parnters in Strategic Processes
Electronic Conferencing and Group Decision-Support Systems

Using Cost 86
systems, and composite systems-based service help desks. Process Innovation strategies for
management processes include, executive information systems that provide real-time
information, electronic linkages to external partners in strategic processes, computer-based
simulations that support learning-oriented planning, and electronic conferencing and group
decision-support systems. The final set of Process Innovation strategies for management
processes include, expert systems for planning an capital allocation, standard technology
infrastructure for communication and group work, standard reporting structures and information,
acknowledgement and understanding of current management behavior as a process, and
accountability for management process measurement and performance.
Maurer (1996), a Washington D.C.-based organization change consultant, identified two
distinct organization change or process improvement approaches and strategies, conventional or
default, and unconventional or resistance-embracement model (see Table 32). Conventional or
default organization change or process improvement strategies include, using power, manipulate
those who oppose, applying force of reason, ignore resistance, play off relationships, make deals,
Resistance Embracement Organizational Change Strategy
Table 32
Conventional or Default
Strategy Technique
Resistance-Embracement
Use powerManipulate those who opposeApply force of reasonIgnore resistancePlay off relationshipsMake dealsKill the messengerGive in too soon
Maintain clear focusEmbrace resistanceRespect those who resistRelaxJoin with the resistance
Threaten adversaries into conformance
Overwhelm adversaries with factsDeceive adversaries with half-truths
Refuse to recognize adversarial positionsRely on friendships to enable changeMake mutually beneficial tradeoffsFire or destroy your adversariesGive up at the first sign of resistance
Keep long and short term view/persevereMove toward and comprehend resistanceTreat people with respect and dignityStay calm and listen without overreactingAlly and befriend adversary's positions
Description

Using Cost 87
kill the messenger, and give in too soon. Unconventional or resistance-embracement model
organization change or process improvement strategies include, maintain a clear focus, embrace
resistance, respect those who resist, relax, and join with the resistance.
Hammer (1996) identifies two forms of organizational process improvement strategies,
Total Quality Management (TQM)—incremental process redesign, and Reengineering—radical
process redesign (see Table 33). Hammer defines TQM or incremental redesign as a means of
modifying processes to solve problems that prevent them from attaining the required
performance level. Hammer defines Reengineering or radical redesign as a means of completely
redesigning business processes for dramatic improvement or completely replacing existing
process designs with entirely new ones, in order to achieve quantum leaps. Ishikawa’s seven
basic tools are typically associated with Total Quality Management (TQM), checklists, pareto
diagrams, histograms, run charts, scatter diagrams, control charts, and cause-and-effect diagrams.
Reengineering is composed of process intensification, process extension, process augmentation,
process conversion, process innovation, and process diversification.
Reengineering and Total Quality Management (TQM) Strategies
Table 33
Total Quality Management
Strategy Impact
Reengineering
Incremental
Technique
Radical
HistogramsPareto Diagrams
Run ChartsScatter DiagramsControl ChartsCause-And-Effect Diagrams
Process IntensificationProcess ExtensionProcess AugmentationProcess ConversionProcess InnovationProcess Diversification
Checklists
Bar charts/chartingData categorization
Statistical analysisLinear regressionStatistical analysisRoot cause analysis
Better customer serviceEnter new marketsAdd more servicesSpinoff core strengthsAdd new offeringsCreate new offerings
Process and procedures
Description
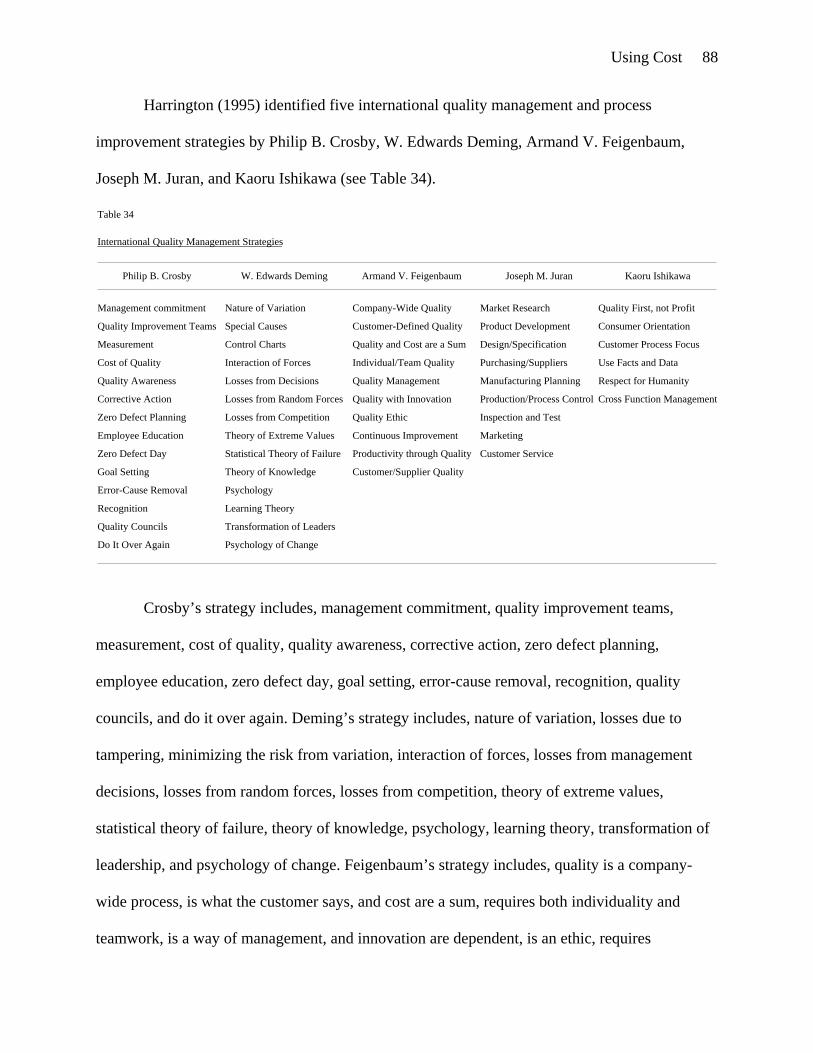
Using Cost 88
Harrington (1995) identified five international quality management and process
improvement strategies by Philip B. Crosby, W. Edwards Deming, Armand V. Feigenbaum,
Joseph M. Juran, and Kaoru Ishikawa (see Table 34).
Crosby’s strategy includes, management commitment, quality improvement teams,
measurement, cost of quality, quality awareness, corrective action, zero defect planning,
employee education, zero defect day, goal setting, error-cause removal, recognition, quality
councils, and do it over again. Deming’s strategy includes, nature of variation, losses due to
tampering, minimizing the risk from variation, interaction of forces, losses from management
decisions, losses from random forces, losses from competition, theory of extreme values,
statistical theory of failure, theory of knowledge, psychology, learning theory, transformation of
leadership, and psychology of change. Feigenbaum’s strategy includes, quality is a company-
wide process, is what the customer says, and cost are a sum, requires both individuality and
teamwork, is a way of management, and innovation are dependent, is an ethic, requires
International Quality Management Strategies
Table 34
Management commitment
Philip B. Crosby
Quality Improvement Teams
Measurement
Cost of Quality
Quality Awareness
Corrective Action
Zero Defect Planning
Employee Education
Zero Defect Day
Goal Setting
Error-Cause Removal
Recognition
Quality Councils
Do It Over Again
Nature of Variation
W. Edwards Deming
Special Causes
Control Charts
Interaction of Forces
Losses from Decisions
Losses from Random Forces
Losses from Competition
Theory of Extreme Values
Statistical Theory of Failure
Theory of Knowledge
Psychology
Learning Theory
Transformation of Leaders
Psychology of Change
Company-Wide Quality
Armand V. Feigenbaum
Customer-Defined Quality
Quality and Cost are a Sum
Individual/Team Quality
Quality Management
Quality with Innovation
Quality Ethic
Continuous Improvement
Productivity through Quality
Customer/Supplier Quality
Market Research
Joseph M. Juran
Product Development
Design/Specification
Purchasing/Suppliers
Manufacturing Planning
Production/Process Control
Inspection and Test
Marketing
Customer Service
Quality First, not Profit
Kaoru Ishikawa
Consumer Orientation
Customer Process Focus
Use Facts and Data
Respect for Humanity
Cross Function Management

Using Cost 89
continuous improvement, is the route to productivity, and is connected to customers and
suppliers. Juran’s strategy includes, market research, product development, product
design/specification, purchasing/suppliers, manufacturing planning, production and process
control, inspection and test, marketing, and customer service. Ishikawa’s strategy includes,
quality first—not short term profit, consumer orientation—not producer orientation, the next
process is your customer, using facts and data to make presentations, respect for humanity as a
management philosophy, and cross-function management.
Davidson (1993) conducted a study of fifty firms with the support of the IBM Advanced
Business Institute in Palisades, New York. Davidson identified and developed an organizational
process improvement framework composed of three major business organizational improvement
strategies or phases, the Operating Excellence phase, Business Enhancement phase, and New
Business Development phase, characterized by unique goals, objectives, techniques, and metrics
(see Table 35). The goals of the Operating Excellence phase are cost reduction, capacity
increases, organizational downsizing, yields, cost reduction, customer satisfaction, cycle time,
asset turnover, response time, retention, enhancement, customer satisfaction, marketing
sophistication, and flexible business systems. The objectives of the Operating Excellence phase
are productivity, quality, velocity, customer service, and business precision. The techniques of
the Operating Excellence phase are automation, process simplification, total quality
management, statistical quality control, just-in-time, time-based competition, electronic data
interchange, focus groups, market research, mass customization, microsegmentation, and
activity-based costing. The metrics of the Operating Excellence phase are units per person, peak
output level, cost per unit, cost per activity, revenue per employee, headcount, defect rates,
yields, standards and tolerances, variance, life-cycle costs, inventory and sales, and throughput.

Using Cost 90
More metrics of the Operating Excellence phase are cycle times, and time to market,
response ratios, retention, revenue per customer, repeat purchase, brand loyalty, customer
acquisition cost, referral rate, cost of variety, number of new products, number of product,
service, and delivery configurations, and customer self-design and self-pricing flexibility. The
goals of the Business Enhancement phase are retention, enhancement, customer satisfaction,
marketing sophistication, flexible business systems, business augmentation, broader market
Three Phases of Business Transformation
Table 35
Operating Excellence
Phase
Business Enhancement
New Business Development
Technique
AutomationProcess SimplificationTotal Quality ManagementStatistical Quality ControlJust-in-TimeTime-Based CompetitionElectronic Data InterchangeFocus GroupsMarket ResearchMass CustomizationMicrosegmentationActivity-Based Costing
Embedded Information TechnologyTurbochargingEnhanced Products and ServicesChannel DevelopmentMarket ExpansionAlliances
Business DevelopmentEntrepreneurialismSpin-Off Units
Focus GroupsMarket ResearchMarket ResearchMass CustomizationMicrosegmentation
Productivity
Objective
Quality
Velocity
Customer Service
Business Precision
Customer Service
Business Precision
Enhancement
Extension
Business Redefinition

Using Cost 91
scope, and new customer acquisition. The objectives of the Business Enhancement phase are
customer service, business precision, enhancement, and extension. The techniques of the
Business Enhancement phase are focus groups, market research, mass customization,
microsegmentation, activity-based costing, embedded information technology, turbocharging,
enhanced products and services, channel deployment, market expansion, and alliances. The
metrics of the Business Enhancement phase are retention, revenue per customer, repeat purchase,
brand loyalty, customer acquisition cost, referral rate, cost of variety, number of new products,
number of product, service, and delivery configurations, and customer self-design and self-
pricing flexibility. More metrics of the Business Enhancement phase are number of features,
functions, and services, information flow to customer, product and service revenue ratio,
customer performance, secondary revenue streams, customer diversity, number of new
customers, channel diversity, new revenue sources, and broader product and market scope. The
goals of the New Business Development phase are market value and start-up activity. The
objective of the New Business Development phase is business redefinition. The techniques of the
New Business Development phase are business development, entrepreneurialism, and spin-off
units. The metrics of the New Business Development phase are market value, new lines of
business, and percent of revenue from new units and services.
Reid (1997) conducted case studies of seven Internet and World-Wide-Web startups,
Marc Andreessen’s Netscape, Rob Glaser’s Progressive Networks, Kim Polese’s Java and
Marimba, Mark Pesce’s Virtual Reality Markup Language (VRML), Arial Poler’s I/PRO, Jerry
Yang’s Yahoo, Andrew Anker’s HotWired, and Halsey Minor’s CNET (see Table 36). Reid
concluded that the Internet is directly responsible for business, social, and cultural changes at
unprecedented rates in scope, speed, and scale. The scope of Internet-enabled change includes

Using Cost 92
publishing, education, entertainment, banking, industrial arts, health care, government, travel, the
olympics, employment, retailing, cellular phones, and the first amendment. The speed of
Internet-enabled change is five to ten times faster than previous technological change intervals of
five to ten years. The scale of Internet-enabled change includes instant market penetration to
hundreds of millions of users.
Internet Technologies for Organizational Change
Table 36
Internet Service Providers
Strategic Element
Equipment
Software
Enabling Services
Professional Services
Tactical Element
UUNETNETCOMPSInetBBNDigex@Home
CiscoAscendCascadeSilicon GraphicsSun MicrosystemsUS Robotics
NetscapeOpen MarketCheck PointMarimbaDimensionXIntervista
Organic Online
I/PROYahoo!CyberCashInfoSeekLycosExcite
Function
Business/personal websites/e-mailBusiness/personal websites/e-mailBusiness/personal websites/e-mailBusiness/personal websites/e-mailBusiness/personal websites/e-mailBusiness/personal websites/e-mail
Network communication routersInternet computer network equipmentInternet computer network equipmentHigh performance graphics computersUNIX-based webserversMODEMs
Browsers/website administration/serviceInternet commerce softwareSecure enterprise networking solutionsInternet content deliveryWebsite graphics technologyWebsite graphics technology
Business/e-commerce website design
Website traffic analysis softwareSearch engine/e-mail/business contentElectronic commerce/transactionsSearch engine/business contentSearch engine/business contentSearch engine/business content

Using Cost 93
Reid reports that five basic Internet technologies are responsible for these sweeping
changes in business, social, and cultural change, Internet service providers, Internet equipment,
Internet software, Internet enabling services, and Internet professional services. Six major
Internet service providers at the time of the study included, UUNET, NETCOM, PSInet, BBN,
Digex, and @Home, providing business and personal website and e-mail services. Six major
Internet equipment companies at the time of the study included, Cisco, Ascend, Cascade, Silicon
Graphics, Sun Microsystems, and US Robotics, providing Internet computers, networking, and
communication devices and equipment. Six major Internet software companies at the time of the
study included, Netscape, Open Market, Check Point, Marimba, DimensionX, and Invervista,
providing website administration, browsers, intranet, content delivery, and media tools and
technologies. Six major Internet enabling services at the time of the study included, I/PRO,
Yahoo!, CyberCash, InfoSeek, Lycos, and Excite, providing website management, content
management, and electronic commerce tools, technologies, and services. A major Internet
professional services firm at the time of the study included Organic Online, providing website
design and development services.
Downes and Mui (1998), directors and visiting fellows of the Diamond Exchange, an
executive forum that brings together senior executives with leading strategy, technology, and
learning experts, have developed a new approach to Strategic Planning for organizational
performance improvement called Digital Strategy. Digital Strategy is a supercharged or
hypercharged form of process improvement or reengineering, more appropriately associated with
Davenport’s (1993) Process Innovation strategy or Davidson’s (1993) Business Transformation
strategy, and is composed of three major phases, Reshaping the Landscape, Building New
Connections, and Redefining the Interior (see Table 37).

Using Cost 94
Reshaping the Landscape phase is composed of the first four of twelve principles,
outsource to the customer, cannibalize your markets, treat each customer as a market segment of
one, and create communities of value. Building New Connections phase is composed of the next
four principles, replace rude interfaces with learning interfaces, ensure continuity for the
customer, not yourself, give away as much information as you can, and structure every
transaction as a joint venture. And, finally, Redefining the Interior phase is composed of the last
four of twelve principles, treat your assets as liabilities, destroy your value chain, manage
innovation as a portfolio of options, and hire the children. Digital Strategy fully exploits Internet
economics previously outlined by Reid (1997), in order to minimize or eliminate inefficiencies in
the market caused by non-value adding organizations that manage transactions, otherwise known
as Coasian Economics (Coase 1994).
Digital Strategy for Organizational Change
Table 37
Reshaping the Landscape
Phase
Building New Connections
Redefining the Interior
Description
Outsource to the customerCannibalize your marketsTreat each customer as a market segment of oneCreate communities of value
Replace rude interfaces with learning interfacesEnsure continuity for the customer, not yourselfGive away as much information as you canStructure every transaction as a joint venture
Treat your assets as liabilitiesDestroy your value chainManage innovation as a portfolio of optionsHire the children

Using Cost 95
Slywotzky, Morrison, Moser, Mundt, and Quella (1999) founders, presidents, executives,
and principals of Mercer Management Consulting analyzed more than 200 firms, identifying
seven categories of thirty profit patterns which enable organizational change in order to increase
market competitiveness and profitability (see Table 38).
Profit Patterns for Organizational Performance Improvement
Table 38
Mega
Category
Value Chain
Customer
Channel
Product
Knowledge
Organizational
Pattern
No ProfitBack to ProfitConvergenceCollapse of the MiddleDe Facto StandardTechnology Shifts the BoardDeintegrationValue Chain AnalysisStrengthening the Weak LinkReintegrationProfit ShiftMicrosegmentationPower ShiftRedefinitionMultiplicationChannel ConcentrationCompression/DisintermediationReintermediationProduct to BrandProduct to BlockbusterProduct to Profit MultiplierProduct to PyramidProduct to SolutionProduct to Customer KnowledgeOperations to KnowledgeKnowledge to ProductSkill ShiftPyramid to NetworkCornerstoningConventional to Digital Business Design
Technique
Walk away or invent a new way of doing businessBuild new business design for unmet customer needsIdentify and master new rules of competitionBe the first to go to the extremesCreate or align with emerging standards earlyGo where the power will beDominate components of disintegrated value chainImprove performance faster than the competitionFix weak link with proprietary/exclusive solutionReintegrate profitable components of value chainDynamically adjust pricing to optimize profitabilityDominate profitably small segments of marketRebalance power or redefine customersSeek out profitable markets, beyond customer baseDominate or create new business channelsInnovate and create new model generations firstBe the first to disinvest obsolete channelsAccelerate investment in new channelsBuild and invest in valuable brands and brandingCreate market-dominating products and servicesIdentify top avenues for selling products/servicesCater to low to high end of vertical marketsAnalyze and master competitor products/servicesAnalyze your customer transactions for patternsTurn proprietary processes into products/servicesIdentify, perfect, and sell core competenciesInvest in emerging skill requirementsMaximize external exposure and adapt organizationIncrementally expand core products and servicesUse changing technology to shed the industrial age

Using Cost 96
The seven categories of profit patterns or process improvement strategies included, Mega
Patterns, Value Chain Patterns, Customer Patterns, Channel Patterns, Product Patterns,
Knowledge Patterns, and Organizational Patterns. Mega Patterns are composed of six
components, No Profit, Back to Profit, Convergence, Collapse of the Middle, De Facto Standard,
and Technology Shifts the Board. Value Chain Patterns are composed of four components,
Deintegration, Value Chain Squeeze, Strengthening the Weak Link, and Reintegration. Customer
Patterns are composed of four components, Profit Shift, Microsegmentation, Power Shift, and
Redefinition. Channel Patterns are composed of four components, Multiplication, Channel
Concentration, Compression and Disintermediation, and Reintermediation. Product Patterns are
composed of five components, Product to Brand, Product to Blockbuster, Product to Profit
Multiplier, Product to Pyramid, and Product to Solution. Knowledge Patterns are composed of
three components, Product to Customer Knowledge, Operations to Knowledge, and Knowledge
to Product. Organizational Patterns are composed of four components, Skill Shift, Pyramid to
Network, Cornerstoning, and Conventional to Digital Business Design.

Using Cost 97
Metrics and Models
The previous section surveyed 72 scholarly studies of software process improvement
(SPI) techniques, methods, and strategies, attempting to provide the reader with a good sense of
the wide-ranging approaches to SPI. This section examines 14 well known studies and
expositions of metrics and models for software management and engineering, and more
importantly software process improvement (SPI), identifying 74 broad metrics classes and 487
individual software metrics (see Table 39).
While Table 39 provides a quick overview of the kinds of metrics classes the 14 studies
refer to, it was necessary to reexamine and reclassify the 487 individual software metrics, based
on a more consistent set of criteria. The analysis identified 12 common classes of software
metrics from the 74 broad classes identified by the 14 sources, based on a more consistent set of
criteria (see Table 40).
Survey of Metrics for Software Process Improvement (SPI)
Table 39
Author
Davidson
Garrison
Kan
Grady
Daskalantonakis
Barnard
Florac
Herbsleb
McGibbon
Hays
Jones
Burr
Rosenberg
Rico
Rico
Rico
Metric Class
Productivity, Quality, Velocity, Customer Service, Precision, Enhancement, Extension, Redefinition
Prevention Costs, Appraisal Costs, Internal Failure Costs, External Failure Costs
Software Quality, Reliability, Quality Management, Structural Design, Customer Satisfaction
Process and Product Descriptions, High-Level Process Measurements, Defect Failure Analysis
Planning, Containment, Reliability, Defect Density, Customer Service, Non-Conformance, Productivity
Cost, Cycle Time, Quality, Conformity, Efficiency, Effectiveness, Productivity
Things Received or Used, Activities and their Elements, Things Consumed, Things Produced
Cost, Productivity, Calendar Time, Quality, Business Value
Reuse, Clean Room, Inspections, Walkthroughs, Traditional, Full
Personal Software Process (PSP)
Process Improvement, Application/System, Productivity, Cost, Quality
Size, Complexity, Conformity, Defectiveness, Time, Cost
Personnel Resources, Software Analysis, Changes to Code
Defect Density
Relational Design Metrics, Object Oriented Design Metrics, Universal/Structural Design Metrics
Planning, Overall, Review Rate, Substage Duration, Substage Interval, Substage Efficiency
Metrics
39
36
35
15
18
21
80
7
24
35
28
32
9
6
63
39

Using Cost 98
It’s not surprising that productivity, design, quality, and effort were the most frequently
cited software metrics in the 14 studies, given that academic and industry use of these metrics,
especially productivity and design, dates back nearly three decades. Size came in sixth place with
only an 8% rate of occurrence, probably because function point proponents stigmatize the use of
size metrics as incompetence, despite their continuing strategic importance.
The software metrics were reclassified using the following criteria, productivity—units
per time, design—complexity, quality—defect density, effort—hours, cycle time—duration,
size—lines of code or function points, cost—dollars, change—configuration management,
customer—customer satisfaction, performance—computer utilization, ROI—return-on-
investment, and reuse—percent of reused source code. The strength of this reclassification
strategy is that the 487 individual software metrics fell succinctly into one of the 12 software
metric classes without exception. The weakness of the reclassification is that it hides exactly
what is being measured, such as productivity of a software life cycle versus software process.
Reclassification of 487 Metrics for Software Process Improvement (SPI)
Table 40
Author
Davidson
Garrison
Kan
Grady
Daskalantonakis
Barnard
Florac
Herbsleb
McGibbon
Hays
Jones
Burr
Rosenberg
Rico
Productivity Design Quality Effort Cycle Time Size Cost Change Customer Performance ROI Reuse
18 4 1 5 5 6
28 1 7
5 9 14 2 4 1
2 3 4 3 2 1
4 11 1 1 1
21
15 7 14 9 4 9 7 12 3
2 1 1 2 1
7 1 6 7 2 1
7 3 1 13 11
14 2 6 3 1 2
10 6 6 2 5
3
2 1
1 2 1 1 1
12 63 9 13 11

Using Cost 99
While some metrics are cited as high as 22% of the time in the case of productivity,
versus only 1% for ROI, there is no prioritization and importance placed on the software metrics
by the software metrics classes. As mentioned before, quality is a strategic and powerful metric,
though only cited 15% of the time, and size is a principle input to most cost models, though only
cited 8% of the time. The importance of using customer satisfaction measurement cannot be
understated though it is only cited 2% of the time. And, reuse will begin to emerge as one of the
most strategic metrics of the next millenium, though it is only cited 0% of the time on average
(see Figure 11).
Figure 11. Citation frequency of metrics for software process improvement (SPI).
Customer2%
Performance1%
ROI1%
Change4%
Reuse0%
Cost6%
Size8%
Cycle Time9%
Effort14%
Quality15%
Productivity22%
Design18%
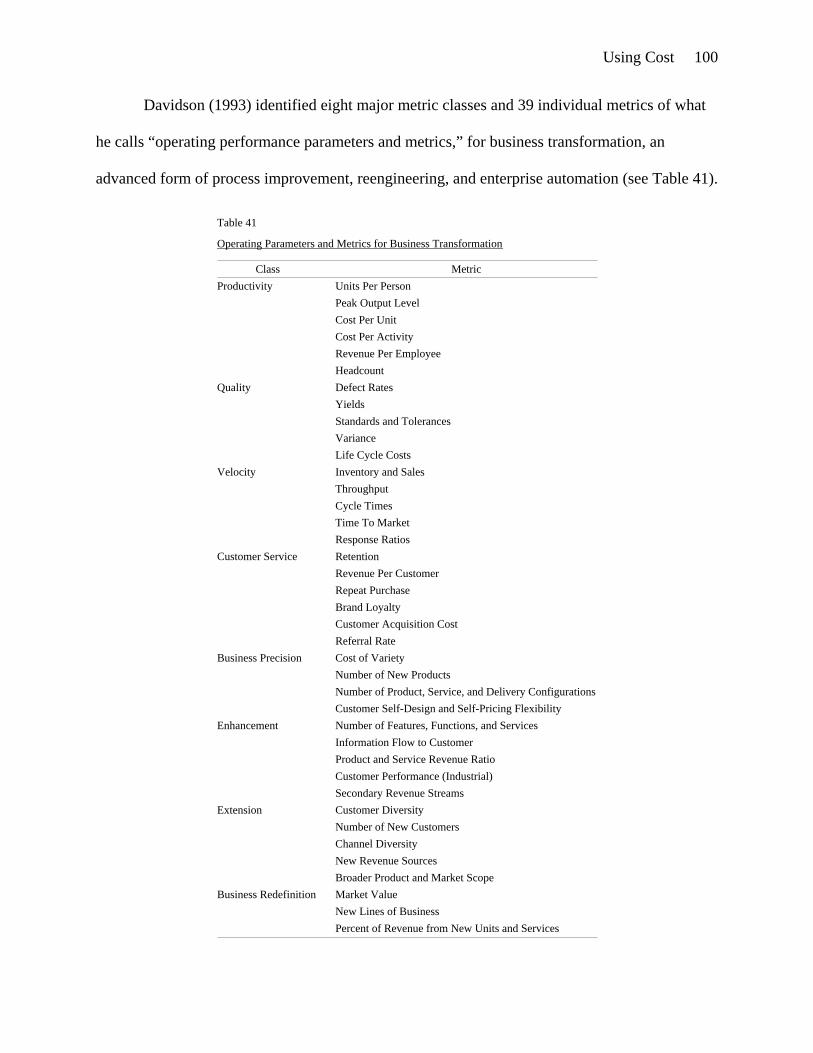
Using Cost 100
Davidson (1993) identified eight major metric classes and 39 individual metrics of what
he calls “operating performance parameters and metrics,” for business transformation, an
advanced form of process improvement, reengineering, and enterprise automation (see Table 41).
Operating Parameters and Metrics for Business Transformation
Table 41
ClassProductivity
Quality
Velocity
Customer Service
Business Precision
Enhancement
Extension
Business Redefinition
MetricUnits Per PersonPeak Output LevelCost Per UnitCost Per ActivityRevenue Per EmployeeHeadcountDefect RatesYieldsStandards and TolerancesVarianceLife Cycle CostsInventory and Sales
Revenue Per CustomerRepeat PurchaseBrand LoyaltyCustomer Acquisition CostReferral RateCost of VarietyNumber of New ProductsNumber of Product, Service, and Delivery ConfigurationsCustomer Self-Design and Self-Pricing Flexibility
ThroughputCycle TimesTime To MarketResponse RatiosRetention
Number of Features, Functions, and ServicesInformation Flow to CustomerProduct and Service Revenue RatioCustomer Performance (Industrial)Secondary Revenue StreamsCustomer DiversityNumber of New CustomersChannel DiversityNew Revenue SourcesBroader Product and Market ScopeMarket ValueNew Lines of BusinessPercent of Revenue from New Units and Services

Using Cost 101
Garrison and Noreen (1997a) identify four major metrics classes and 36 individual
metrics for what they call “typical quality costs,” for cost measurement, cost control, and cost
minimization (see Table 42).
Typical Costs for Measuring Quality of Conformance
Table 42
ClassPrevention Costs
Appraisal Costs
Internal Failure Costs
External Failure Costs
MetricSystems developmentQuality engineeringQuality trainingQuality circlesStatistical process control activitiesSupervision of prevention activitiesQuality data gathering, analysis, and reportingQuality improvement projectsTechnical support provided to suppliersAudits of the effectiveness of the quality systemTest and inspection of incoming materialsTest and inspection of in-process goodsFinal product testing and inspectionSupplies used in testing and inspectionSupervision of testing and inspection activitiesDepreciation of test equipmentMaintenance of test equipmentPlant utilities in the inspection areaField testing and appraisal at customer siteNet cost of scrapNet cost of spoilageRework labor and overheadReinspection of reworked productsRetesting of reworked productsDowntime caused by quality problemsDisposal of defective productsAnalysis of the cause of defects in productionRe-entering data because of keying errorsDebugging of software errorsCost of field servicing and handling complaintsWarranty repairs and replacementsRepairs and replacements beyond the warranty periodProduct recallsLiability arising from defective productsReturns and allowances arising from quality problemsLost sales arising from a reputation for poor quality

Using Cost 102
Kan (1995) identified five major metrics classes and 35 individual metrics for what he
called “metrics and models,” for software quality engineering, an established, yet advanced form
of measurement-based management for software development (see Table 43).
Subclass
IBM Rochester Software Process Improvement (SPI) Metrics
Table 43
Metrics and Models
Product Quality
Class
Software Quality
Reliability
Quality Management
Structural Design
Customer Satisfaction
In-Process Quality
Maintenance
Exponential
Reliability Growth
Defect Arrival Pattern During Machine Testing
Phase-Based Defect Removal Model PatternDefect Removal Effectiveness
Defect DensityCustomer ProblemsCustomer SatisfactionFunction PointsDefect Density During Machine Testing
Fix Response TimePercent Delinquent FixesFix Quality
Fix Backlog and Backlog Management IndexSpecial Case Two-Phase Model
Cumulative Distribution Function (CDF)Probability Density Function (PDF)
Goel-OkumotoMusa-Okumoto Logarithmic Poisson Execution
LittlewoodJelinski-Moranda
Delayed S and Inflection S
Rayleigh
Rayleigh Life Cycle ReliabilityProblem Tracking Report
Life CycleTesting Phase
Reliability GrowthSource Lines of Code (SLOC)Halstead's Software ScienceCyclomatic ComplexitySyntactic ConstructsInvocation Complexity
Complexity
StructureSystem PartitioningInformation FlowFan-In and Fan-Out
Survey In-Person, Phone, and MailSampling Random, Systematic, and StratifiedAnalysis CUPRIMDA

Using Cost 103
Grady (1997) identified three major metrics classes and 15 individual metrics for what he
called “baseline measurements for all software process improvement programs,” as part of his
plan, do, check, and act (PDCA)-based methodology—specifically the check phase—evaluate
results, ensure success, and celebrate (see Table 44).
Grady and Caswell (1986) report that Hewlett Packard uses 12 other strategic software
metrics. Hewlett Packard’s first six software metrics include, average fixed defects per working
day, average engineering hours per fixed defect, average reported defects per working day, bang,
branches covered per total branches, and defects per thousands of non-commented source
statements. Hewlett Packard’s last six software metrics include, defects per line of
documentation, defects per testing time, design weight, non-commented source statements per
engineering month, percent overtime per 40 hours per week, and (phase) engineering months per
total engineering months.
Hewlett Packard Software Process Improvement (SPI) Metrics
Table 44
MetricClass
Process and Product Descriptions
High-Level Process Measurements
Defect Failure Analysis
Development TypeComputer Programming LanguageType of Product
Product SizeEffortProductivity before ChangesProductivity after ChangesActivity Breakdown before ChangesActivity Breakdown after ChangesDefects before ChangesDefects after ChangesProject Calendar Time before ChangesProject Calendar Time after Changes
Defect Failure Analysis before ChangesDefect Failure Analysis after Changes

Using Cost 104
Daskalantonakis (1992) identified seven major metrics classes and 18 individual metrics
for what he called a “practical and multi-dimensional view of software measurement,” in support
of Motorola’s company-wide metrics program (see Table 45).
Diaz and Sligo (1997) report that Motorola uses three strategic metrics for measuring the
effects of software process improvement (SPI), quality, cycle time, and productivity. Quality is
defined as defects per million earned assembly-equivalent lines of code (a form of defect density
measurement). Cycle time is defined as the amount of calendar time for the baseline project to
develop a product divided by the cycle time for the new project. And, productivity is defined as
the amount of work produced divided by the time to produce that work.
Motorola Software Process Improvement (SPI) Metrics
Table 45
Class
Project Planning
Defect Containment
Software Reliability
Software Defect Density
Customer Service
Non-Conformance Cost
Software Productivity
Metric
Schedule Estimation AccuracyEffort Estimation Accuracy
Total Defect Containment EffectivenessPhase Containment Effectivess
Failure Rate
In-Process FaultsIn-Process DefectsTotal Release DefectsTotal Release Defects DeltaCustomer-Found Defects
New Open ProblemsTotal Open ProblemsMean Age of Open ProblemsMean Age of Closed Problems
Cost of Fixing Problems
Software ProductivitySoftware Productivity Delta
Customer-Found Defects Delta

Using Cost 105
Barnard and Price (1994) identified seven major metrics classes and 21 individual metrics
for what they called “managing code inspection information,” in support of AT&T’s efforts to
ensure a more consistently effective Software Inspection Process (see Table 46).
The Software Inspection Process metric classes answer these questions: How much do
inspections cost? How much calendar time do inspections take? What is the quality of the
inspected software? To what degree did the staff conform to the procedures? What is the status
of inspections? How effective are inspections? What is the productivity of inspections?
AT&T Software Inspection Process (SPI) Metrics
Table 46
Class
Cost
Cycle Time
Quality
Conformity
Efficiency
Effectiveness
Productivity
Metric
Average Effort per Thousand Lines of CodePercentage of Re-Inspections
Average Effort per Thousand Lines of CodeTotal Thousand Lines of Code Inspected
Average Faults Detected per Thousand Lines of CodeAverage Inspection RateAverage Preparation Rate
Average Lines of Code InspectedPercentage of Re-Inspections
Total Thousand Lines of Code Inspected
Average Faults Detected per Thousand Lines of CodeAverage Inspection RateAverage Preparation RateAverage Lines of Code Inspected
Average Effort per Fault DetectedAverage Inspection RateAverage Preparation Rate
Defect Removal Efficiency
Average Lines of Code Inspected
Average Inspection RateAverage Preparation Rate

Using Cost 106
Florac and Carleton (1999) identified four major metrics classes, 19 metrics subclasses,
and 80 individual metrics for what they call “measurable attributes of software process entities,”
in support of statistical process control (SPC) for software process improvement (see Table 47).
SEI Software Process Improvement (SPI) Metrics
Table 47
ChangesThings Received or Used Activities & their Elements Things Consumed Things Produced
TypeDateSize# Received
Requirements ChangesRequirements Stability# Identified% Traced to Design% Traced to Code
Problem ReportsTypeDateSizeOriginSeverity# Received
FundsMoneyBudgetStatus
PeopleYears of ExperienceType of Education% Trained in XYZEmployment Codes
Facilities & EnvironmentSpace per EmployeeNoise LevelLighting# of Staff in Cubicles# of Staff Sharing OfficeInvestment in ToolsComputer Usage Hours% Capacity Utilization
Flow PathsProcessing TimeThroughput RatesDiversionsDelays
Length, SizeQueuesBuffersStacks
Backlogs
Effort# Development Hours# of Rework Hours# of Support Hours# of Preparation Hours# of Meeting Hours
TimeStart Time or DateEnding Time or DateDuration of ProcessWait Time
MoneyCost to DateCost VarianceCost of Rework
Status of Work Units# Designed# Coded# Tested
Size of Work Units# of Requirements# of Function Points# of Lines of Code# of Modules# of Objects# of Bytes in Database
Output Quantity# of Action Items# of Approvals# of Defects Found
Test Results# of Passed Test Cases% Test Coverage
Program ArchitectureFan-InFan-Out
ChangesTypeDateSizeEffort Expended
Problems & Defects# of ReportsDefect DensityTypeOriginDistribution by TypeDistribution by Origin# Open# Closed
Resource Utilization% Memory Utilized% CPU Capacity Used% I/O Capacity Used

Using Cost 107
Herbsleb, Carleton, Rozum, Siegel, and Zubrow (1994) identified five major metrics
classes and seven individual metrics for measuring the benefits of SEI Capability Maturity
Model for Software (SW-CMM)-based software process improvement (see Table 48).
Herbsleb et al. also recommend that organizations use four more additional classes of
metrics to measure software process improvement (SPI), balanced scorecard, CMM/SEI core
measures, business value, and quality metric classes. Balanced scorecard consists of financial,
customer satisfaction, internal processes, and innovation and improvement activity metrics.
CMM/SEI core measures consist of resources expended on software process improvements,
resources expended to execute the software processes, amount of time (calendar time) it takes to
execute the process, size of the products that result from the software process, and quality of the
products produced metrics. Business value consists of increased productivity, early error
detection and correction, overall reduction of errors, improved trends in maintenance and
warranty work, and eliminating processes or process steps metrics. Quality consists of mean time
between failures, mean time to repair, availability, and customer satisfaction metrics.
SEI CMM-Based Software Proces Improvement (SPI) Metrics
Table 48
Class Metric
Thousands of Dollars per Year Spent on SPICost
Productivity
Calendar Time
Quality
Business Value
Gain per Year in ProductivityGain per Year in Early Detection of Defects
Reduction per Year in Calendar Time to Develop Software Systems
Dollars per Software Engineer per Year Spent on SPI
Reduction per Year in Post-Release Defect Reports
Business Value Ratio of SPI Efforts

Using Cost 108
McGibbon (1996) identified three major metrics classes and 24 individual metrics for
what he called “a business case for software process improvement” comparing Software Reuse,
the Software Inspection Process, and the Clean Room Methodology (see Table 49).
McGibbon identified another six major metric classes and 23 individual metrics for
performing a detailed analysis and comparison of the Software Inspection Process and what he
called "Informal Inspections,” otherwise known as Walkthroughs.
DACS Software Process Improvement (SPI) Metrics
Table 49
Class
Without, 30% Reuse, 60% Reuse, & 90% Reuse
Metric
Estimated Source Lines of Code
Clean Room, Inspections, & Walkthroughs
Traditional, Inspections, Reuse, Clean Room, & Full
% ReuseEquivalent Ratio on ReuseEquivalent CodeCOCOMO Effort EstimateEquivalent CostEstimated Rework (New Code)Estimated Rework (Reused Code)Estimated Rework (Total Rework)Estimated Maintenance CostsDevelopment Effort + MaintenanceSavings of Reuse Over No Reuse% Reduction
Estimated Source Lines of CodeEquivalent RatioEquivalent CodeEffort EstimateEquivalent Cost
Development CostsRework CostsMaintenance CostsDevelopment + Maintenance SavingsSoftware Process Improvement (SPI) CostsReturn-on-Investment (ROI)
Using Cost 109
Hays and Over (1997) identified 34 individual strategic software metrics in support of the
Personal Software Process (PSP) pioneered by Watts S. Humphrey (see Table 50).
Various forms of defect density metrics and appraisal to failure ratio are the key metrics
to focus on. Appraisal to failure ratio must reach a modest 67% in order achieve zero defects.
Personal Software Process (PSP) Metrics
Table 50
DefinitionMetric
Interruption TimeDelta TimePlanned Time in PhaseActual Time in PhaseTotal TimeTime in Phase to DateTotal Time to DateTime in Phase to Date %Compile TimeTest TimeDefectDefect TypeFix Time
Lines of Code TypeLines of Code/HourEstimating AccuracyTest Defects/KLOCCompile Defects/KLOCTotal Defects/KLOCYieldAppraisal TimeFailure TimeCost of QualityAppraisal/Failure RatioReview Rate
Base Lines of CodeDeleted Lines of CodeModified Lines of CodeAdded Lines of CodeReused Lines of CodeNew Lines of Code
Total Lines of CodeTotal New Reused
Changed Lines of Code
Elapsed time for small interruptions from project work such as a phone callElapsed time in minutes from start to stop less interruptionsEstimated time to be spent in a phase for a projectSum of delta times for a phase of a projectSum of planned or actual time for all phases of a project
Sum of time in phase to date for all phases of all projectsSum of time in actual time in phase for all completed projects
100 * time in phase to date for a phase divided by total time in phase to dateTime from the start of the first compile until the first clean compileTime from the start of the initial test until test completionAny element of a program design or implementation that must be changedProject defect type standardTime to find and fix a defect
Lines of code from a previous versionDeletions from the base lines of codeModifications to the base lines of codeNew objects, functions, procedures, or any other added lines of codeLines of code from a previous program that is used without modificationSum of added lines of codeSum of modified lines of codeTotal program lines of codeNew or added lines of code that were written to be reusableBase, deleted, modified, added, reused, new, changed, total, total new reusedTotal new & changed lines of code developed divided by development hoursDegree to which the estimate matches the resultDefects removed in the test phase per new and changed KLOCDefects removed in compile per new and changed KLOCTotal defects removed per new and change KLOCPercent defects injected before the first compile removed before first compileTime spent in design and code reviewsTime spent in compile and testAppraisal time plus failure timeAppraisal time divided by failure timeLines of code reviewed per hour
Lines of Code Logical line of code as defined in the engineer's counting & coding standard

Using Cost 110
Jones (1997a) identified five major metrics classes and 24 individual metrics for what he
called “the six stages of software excellence” for quantifying the impact of software process
improvements (see Table 51).
SPR Software Process Improvement (SPI) Metrics
Table 51
Class
Process Improvement
Application/System
Productivity
Cost
Quality
Metric
Process Improvement Expenses per CapitaProcess Improvement Stages in Calendar MonthsImprovements in Delivered DefectsImprovement in Development ProductivityImprovements in Development Schedule
Application ClassProgramming LanguageSize in Function PointsSize in Lines of Code
Work Hours per Month (Function Points)Average Monthly SalaryFunction Points per MonthLines of Code per MonthCost per Function PointCost per Line of Code
Organization Size in Number of People
Work Hours per Function Point per ActivityStaff (Number of People) per ActivityEffort (Months) per ActivitySchedule (Months) per ActivityCosts per ActivityPercent of Costs per Activity
Capability Maturity Model for Software Level
Potential Defects (Estimated)Defect Removal EfficiencyDelivered DefectsDefects per Function PointDefects per Thousand Lines of Code

Using Cost 111
Burr and Owen (1996) identified seven major metrics classes and 32 individual metrics
for what he called “commonly available metrics” with which to perform statistical process
control (SPC) for software process improvement (SPI) (see Table 52).
Software Process Improvement (SPI) Metrics for SPC
Table 52
Class
Product
Subclass
Size
Process
Complexity
Conformity
Defectiveness
Time
Cost
Defectiveness
Subclass
Lines of Code per ModuleModules per FunctionFunctions per SystemData Types per AreasVariablesMcCabe'sPath CountCall CountData TypesCompletenessFunctional DifferencesSupplier ConfidenceCustomer ConfidenceDefect CountFunction FailuresData FaultsMachine or System FailuresReliabilityLines of Code per Day
Modules per MonthReview TimeStage TimePreventative per Total TimeCorrective per Total TimeSystems UtilizationCost per Line of Code
Cost of CorrectionCost of FailureError CountError Rate per Module
Lines of Code per Hour
Cost per Line of Module

Using Cost 112
Rosenberg, Sheppard, and Butler (1994) identified three broad metrics classes, three
metrics subclasses, and nine individual metrics for what they called “Software Process
Assessment (SPA) metrics” in support of software process improvement (SPI) (see Table 53).
Rico (1998) identified five forms of defect density metrics for what he called “Quality
Metrics” in direct support of software process improvement (SPI) measurement (see Table 54).
NASA GSFC Software Process Improvement (SPI) Metrics
Table 53
Class
Process
Subclass Metric
Personnel Resources Form
Product Software Analysis
Changes to Code
Effort by Phase
ComplexityReadabilitySize
Component Origination (% Complete)Component Origination (Amount Reused)Change Report (Type)Change Report (Date)Change Report (Effort)
Metric Algorithm
IEEE
IBM (Michael Fagan)
IBM (NASA Space Shuttle)
Dunn
Motorola
Motorola
Source
Defect Density
Defect Removal Effectiveness
Early Detection Percentage
Effectiveness
Total Defect Containment Effectiveness
Phase Containment Effectiveness
Metric Name
DefectsKSLOC
Inspection DefectsInserted Defects
x 100 %
Major Inspection DefectsInserted Defects
x 100 %
DefectsCurrent Phase + Post Phase
x 100 %
Pre-Release DefectsPre-Release + Post-Release Defects
Phase ErrorsPhase Errors + Phase Defects
Defect Density Metrics for Software Process Improvement (SPI)
Table 54

Using Cost 113
Rico (1998) identified three metric classes and 63 individual metrics for what he called
“software product metrics” in support of software process improvement (SPI), relational design
metrics, object oriented design metrics, and universal/structural design metrics (see Table 55).
Rico (1996) identified six metric classes and 39 individual metrics for what he called
“Software Inspection Process metrics” in support of software process improvement (SPI),
publishing a comprehensive set of software inspection process cost models (see Table 56).
Unnecessary Keys
Foreign Key Indexes
Relationships (Multiple Paths)
Relationships (Infinite Loops)
Keys on Similar Attributes
Use of Domains
Attribute Consistency
Unnecessary Denormalization
Missing Indexes (Implied Relationships)
Excessive Indexes
Unnecessary Indexes
Relationships (Implied)
Index Consistency
Missing Indexes (Defined Relationships)
Unique Constraint
No Unique Identifier
Use of Surrogate Keys
Homonym Attributes
Redundant Attributes
Repeating Groups
Inconsistent Attribute Definition
Inconsistent Constraint Definition
Incorrect Relationship Definition
Missing Tables
Disabled Constraints
Number of Independent Classes
Number of Single Inheritance
Number of Internal Classes
Number of Abstract Classes
Number of Multiple Inheritance
Number of Hierarchies
System Size in Classes
Average Depth of Inheritance
Measure of Functional Abstraction
Measure of Attribute Abstraction
Data Access Metric
Number of Leaf Classes
Average Width of Inheritance
Average Number of Ancestors
Operation Access Metric
Class Interface Size
Number of Attributes
Number of Abstract Data Types
Class Size in Bytes
Number of Methods
Number of Inline Methods
Number of Polymorphic Methods
Direct Class Coupling
Direct Attribute Based Coupling
Fan Out
Dependencies
Historical Defectiveness
Current Defectiveness
Design Changes
Fan In
Cyclomatic Complexity
Static Graph Theoretic Complexity
Unit Test Case Determination
Design Structure
Data Flow Complexity
Software Science
Generalized Graph Theoretic Complexity
Dynamic Graph Theoretic Complexity
Relational Design Metrics Object Oriented Design Metrics Universal/Structural Design Metrics
Universal/Structural Design Metrics for Software Process Improvement (SPI)
Table 55

Using Cost 114
Metric Class
Software Inspection Process Metrics for Software Process Improvement (SPI)
Table 56
Planning
Overall
Review Rate
Substage Duration
Substage Interval
Substage Efficiency
50 * KSLOC
SLOC / (Rate * 2) * (Team Size * 4 + 1)
SLOC / (Rate * 2) * (5.76 * Team Size)
SLOC / (Rate * 2) * 25
3 * KSLOC * 4 * 8
Metric
Total Defects
Minor Defects per Hour
Defects per Hour
Defect Removal Efficiency
Major Defects
Total Hours
Major Defects per Hour
Duration
Minor Defects
PeopleOverview Rate
Inspection RatePreparation Rate
Rework RatePlanning Hours
Inspection Hours
Overview Hours
Rework Hours
Preparation Hours
Followup HoursPlanning/Overview Interval
Planning/Preparation Interval
Overview/Preparation Interval
Planning/Inspection Interval
Preparation/Inspection Interval
Planning/Rework Interval
Inspection/Rework Interval
Planning/Followup Interval
Rework/Followup Interval
Inspection/Followup IntervalPreparation Efficiency
Inspection Gain RateInspection Efficiency
Inspection Suppression
Rico
AT&TBell Northern Research
Hewlett Packard
Tom Gilb
Model

Using Cost 115
Costs and Benefits
Table 1, Figure 2, and Table 39 demonstrate that a uniform, industry standard definition
of Software Process Improvement (SPI) doesn’t yet exist as of this writing. This section
identifies the costs and benefits of SPI as reported by 24 of the most quantitative, authoritative,
and complete descriptions of SPI efforts and their results known. Nevertheless, the survey and
identification of SPI costs and benefits revealed a lack of uniform, industry standard metrics for
measuring and reporting the costs and benefits of SPI.
Of the 24 quantitative studies, 78% reported quality, 28% reported cycle time reduction,
28% reported productivity increase, 17% reported cost reduction, 11% report cost estimation
Mays
Quality
Cost
Cycle Time
Productivity
ROI Ratio
ROI Dollars
ISO 9000
Years
Baldrige
Sizing
Costing
Precision
Total DREa
SEI Level 5
ArthurImprovement
Source of SPI Costs and Benefits
Survey of Software Process Improvement (SPI) Costs and Benefits
Table 57
Cost/Person
Oldham Wigle Grady Ferguson Hays Jones Diaz Haley Kan Herbsleb Kajihara
50% 10X 98% 67X 137:1 95% 86% 77% 67% 39% 100X
50% 99%
50% 83% 75% 8X 19%
365% 3X 190% 35% 100%
100% 99.8% 99.9%
99.9%
100:1 93%
250:1
19:1 8:1 1.35:1 5:1 482:1
$100M $450M
$15K $15K $21K $483
8 6 15 10 .05 .05 3.5 6.5 7 4 3.5 9
People 400 350 1,200 1,375 15,032 414
aRepresents defect removal efficiency of product appraisal activities such as inspection and test (not an improvement percentage).
2
10X

Using Cost 116
accuracy, 6% reported size estimation accuracy, 6% reported employee satisfaction, and 6%
reported product availability improvements. Of the studies reporting measurements on traversing
SEI CMM Levels, 11% reported Level 1 to 2, 11% reported Level 2 to 3, 6% reported Level 3 to
4, 6% reported Level 4 to 5, and 33% reported Level 1 to 5 time measurements. Of those
reporting major accomplishments, 6% reported to be ISO 9000, 6% reported to have won the
U.S. Malcolm Baldrige National Quality Award, and 28% reported to have achieved CMM
Level 5.
In addition, 28% reported return-on-investment (ROI) data, 28% reported the amount of
money spent per person on SPI, 28% reported the number of software managers and developers,
11% reported the amount of money saved by SPI, and 6% reported shareholder value increase.
And, finally, 33% reported defect removal efficiency measurements, 11% reported rework cost
reductions, 11% reported defect insertion rate reductions, 6% reported quality estimation
accuracy, and 6% reported product failure reductions.
Of the 26 individual measurement data points reported by the 24 studies, 50% of them
were directly related to software quality. Only 6% of the reported metrics and 11% of the
reported measurements were related to cost reduction. This doesn’t necessarily show a positive
correlation between cost and quality. ROI measurements actually show a negative correlation;
that is, the higher the quality, the lower the cost. Table 57 summarizes some of the most
important metrics and measurement values for the cost and benefits of SPI found in the 24
principle references.
Arthur (1997) reports that U.S. West Technologies experienced 50% or greater
reductions in cycle time, defects, and cost. Arthur reports that in six months of SPI efforts to
examine computer system reliability issues, U.S. West reduced system outage by 79% and

Using Cost 117
increased system availability to 99.85%. U.S. West also examined other areas of their business
such as service order errors, long distance errors, billing cycle time, billing errors, billing
strategy, postage costs, and new product development time. Manual operations were automated
reducing costs by 88%. Postage costs were reduced from $60 million to $30 million, resulting in
savings of 50%. Cash flow was improved by 50%, and service order errors were decreased by
over 50%.
The CMM is the Software Engineering Institute’s Capability Maturity Model for
Software pioneered in its current form by Humphrey (1989). The CMM is a framework for
evaluating software management and development sophistication, one being the worst and five
being the best. The Software Engineering Institute (1999) reports that one-half of one percent of
software development organizations worldwide are at CMM Level 5, and 80% are at or below
Figure 12. SEI CMM maturity profile (domestic).
0%
10%
20%
30%
40%
50%
60%
70%
80%
90%
100%
Num
ber o
f Org
aniz
atio
ns a
t Mat
urity
Lev
el
Level 1(Initial)
Level 2(Repeatable)
Level 3(Defined)
Level 4(Managed)
Level 5(Optimizing)
Software Engineering Institute (SEI) Capability Maturity Model for Software (CMM)
51.1%
28.9%
15.7%
0.6%3.7%

Using Cost 118
CMM Level 2, as in Figure 12. Achieving CMM Level 5 is the rough equivalent of winning the
Malcolm Baldrige National Quality Award, a rare and prestigious state of organizational quality.
Cosgriff (1999a) reports that the Ogden Air Logistic Center Software Engineering
Division of Hill Air Force Base (AFB) in Utah went from CMM 1 to CMM Level 5 in six years.
Cosgriff reports that Hill’s Software Engineering Division took two and a half years to progress
from CMM Level 1 to 2, six months to go from Level 2 to 3, and about 2 years to go from Level
3 to 4. Finally Cosgriff reports Hill took about a year to go from Level 4 to 5.
Oldham, Putman, Peterson, Rudd, and Tjoland (1999) report that Hill AFB’s SPI efforts
yielded an order of magnitude improvement in software quality (10X), an 83% reduction in
software development and maintenance cycle times, and a 19:1 return-on-investment ratio for
Hill’s SPI efforts, equating to $100 million.
Fowler (1997) reports an 86% improvement in software quality for Boeing Defense and
Space Group of Seattle, Washington, also an elite member of the CMM Level 5 club. Yamamura
and Wigle (1997) also of Boeing’s CMM Level 5 outfit, show a 98% improvement in software
quality, an improvement in defect removal efficiency of nearly 100%, and report earning 100%
of possible incentive fees from their clients. Yamamura and Wigle also report that employee
satisfaction has increased from 26% to 96%. Finally, Yamamura and Wigle report that Boeing
yields a 7.75:1 return-on-investment for using highly effective product appraisal activities.
Grady (1997) reports that Hewlett-Packard (HP) has determined the return-on-investment
costs for 11 different SPI strategies. Grady reports return-on-investments of 9% for product
definition, 12% for detailed design method, 12% for rapid prototyping, 12% for system design,
and 20% for inspection software process improvements. Grady also reports returns of 35% for
reuse, 5% for complexity analysis, 10% for configuration management, 6% for process

Using Cost 119
certification, 6% for software asset management, and 7% for program understanding software
process improvements. Grady goes on to report that HP achieved a 58X improvement in product
failures, a 10X improvement in product defects, and savings of over $450 million from the use of
inspections between 1987 and 1999, nearly $77 million in 1999 alone, as shown in Figure 13.
Ferguson, Humphrey, Khajenoori, Macke, and Matvya (1997) report a 67X increase in
software quality for Advanced Information Services’ SPI efforts. Ferguson et al. report an
appraisal to failure ratio of 3.22:1, a review efficiency of 76.2%, a 99.3% test efficiency, a 99.8%
total defect removal efficiency, and only one fielded defect in 18 software product releases for
Motorola’s SPI efforts, as described in Table 58.
Hays and Over (1997) report a 250:1 improvement in software size estimation and a
100:1 improvement in effort estimation accuracy as shown in Figure 14. Hays and Over reported
a 7:1 improvement in SPI efforts using specific software quality methodologies for achieving
SPI. Hays and Over also report a 120:1 improvement in software quality during software
1989
Mill
ions
1990 1991 1992 1993 1994 1995 1996 1997 1998
$10
$20
$30
$40
$50
$60
$70
Year
Figure 13. Hewlett packard annual software inspection process savings.

Using Cost 120
compilation and a 150:1 improvement in software quality during testing. Hays and over also
report a 75% defect removal efficiency before software compilation in the best case and an
average programming productivity of 25 sources lines of code per hour, while still achieving
near zero defect delivery.
Jones (1997a) reports to have measurements, costs, and benefits for SPI involving 7,000
software projects, 600 software development organizations, and six industries. Jones reports that
22 2 0 02 9% 100% 0%6
5 0 0 00 0% 0% 0%5
3,381 47 22 069 2% 68% 100%4
1,571 39 8 047 3% 83% 100%3
4,565 59 10 069 2% 86% 100%2
463 8 5 013 3% 62% 100%1
1 1 0 01 100% 100% 0%7
Defects FieldedSize Insertion Review TestEfficiency EfficiencyProject
Defect Containment Analysis
Motorola Personal Software Process (PSP) Benefits
Table 58
364 27 2 029 8% 93% 100%10
114 13 2 015 13% 87% 100%9
2,081 33 0 134 2% 97% 0%8
7 0 0 00 0% 0% 0%11
25,114 438 136 1575 2% 76% 99%Total
3,494 89 50 0139 4% 64% 100%18
467 14 3 017 4% 82% 100%17
1,270 19 1 020 2% 95% 100%16
2,075 52 27 079 4% 66% 100%15
3,894 18 2 020 1% 90% 100%14
720 7 2 09 1% 78% 100%13
620 10 2 012 2% 83% 100%12

Using Cost 121
200 of the 600 organizations in his database are actively pursuing SPI efforts. Jones reports that
it takes an average of $21,281 per person to conduct assessments, improve management and
technical processes, institute software tools and reuse, and ultimately achieve industry
leadership. Jones reports that it takes 34 months in the best case and 52 months in the worst case
to achieve industry leadership using a concerted SPI effort, resulting in a 95% reduction in
defects, 365% increase in productivity, and 75% reduction in cycle time.
Diaz and Sligo (1997) report SPI data from Motorola’s Government Electronics Division
(GED) in Scottsdale, Arizona, involving a 1,500 engineer enterprise, 350 of whom are involved
in software management and development, and 34 major programs or products. Diaz and Sligo
report that the GED is currently at SEI CMM Level 5. Diaz and Sligo report that three GED
programs are at CMM Level 1, nine at Level 2, five at Level 3, eight at Level 4, and nine GED
programs are at SEI CMM Level 5. Diaz and Sligo report a 54% defect removal efficiency
increase from CMM Level 2 to 3, a 77% defect removal efficiency increase from Level 2 to 4,
and an 86% defect removal efficiency increase from Level 2 to 5. Diaz and Sligo report a cycle
time improvement of nearly 8X and a productivity improvement of nearly 3X from CMM Level
Effo
rt Es
timat
ion
Acc
urac
y
1 2 3 4 5 6 7 8 9Software Project
-100%
-75%
-50%
-25%
0%
25%
50%
Software Project
Size
Est
imat
ion
Acc
urac
y
100%
1 2 3 4 5 6 7 8 9
-250%
-200%
-150%
-100%
-50%
0%
50%
100%
Figure 14. SEI personal software process (PSP) results.

Using Cost 122
1 to 5. Diaz and Sligo report that it took Motorola GED approximately 6 to 7 years to journey
from SEI CMM Level 1 to Level 5 (see Figure 15).
Haley (1996) reports SPI data from Raytheon Electronic Systems’ Equipment Division in
Marlborough, Massachusetts, involving 1,200 software engineers and a diverse variety of
programs. Haley reports some of the programs as air traffic control, vessel traffic management,
transportation, digital communications, ground-based and shipboard radar, satellite
communications, undersea warfare, command and control, combat training, and missiles. Haley
reports as a result of Raytheon’s extensive SPI efforts, rework was reduced by over 50%, defects
found in testing dropped by 80%, productivity increased by 190%, software cost estimation
accuracy increased by 93%, and software quality increased by 77%. Haley reports that these SPI
results were in conjunction with transitioning from SEI CMM Level 1 to Level 3, over a seven
year period from 1988 to 1995, as shown in Figure 16.
Level 1
Software Engineering Institute (SEI) Capability Maturity Model for Software (CMM)
Level 2 Level 3 Level 4 Level 5
1
2
3
4
5
6
7
8
9
10So
ftwar
e Pr
oces
s Im
prov
emen
t (SP
I) F
acto
rProductivity Increase
Defect Reduction
Cycle Time Reduction
Figure 15. Motorola CMM-based software process improvement (SPI).

Using Cost 123
McGibbon (1996), Director of the Data and Analysis Center for Software (DACS) at
Rome Laboratory in Rome, New York conducted a quantitative analysis of SPI costs, benefits,
and methods. McGibbon found an 82% decrease in software development costs, a 93% decrease
in software rework costs, a 95% decrease in software maintenance costs, and a 99% reduction in
software defects using SPI versus traditional software management and development methods
(see Figure 17).
Kan (1995) reported that the IBM Federal Systems Division, in Gaithersburg, Maryland,
developed a quality estimation technique used on nine software projects consisting of 4,000,000
source lines of code, that predicted the accuracy of final software quality within 6 one-
hundredths of a percent of accuracy (see Figure 18).
1988 1989 1990 1991 1992 1993 1994 1995 1996
Year
1
2
3
4
5
6
7
8
9
10So
ftwar
e Pr
oces
s Im
prov
emen
t (SP
I) F
acto
r
Figure 16. Raytheon CMM-based software productivity improvements.
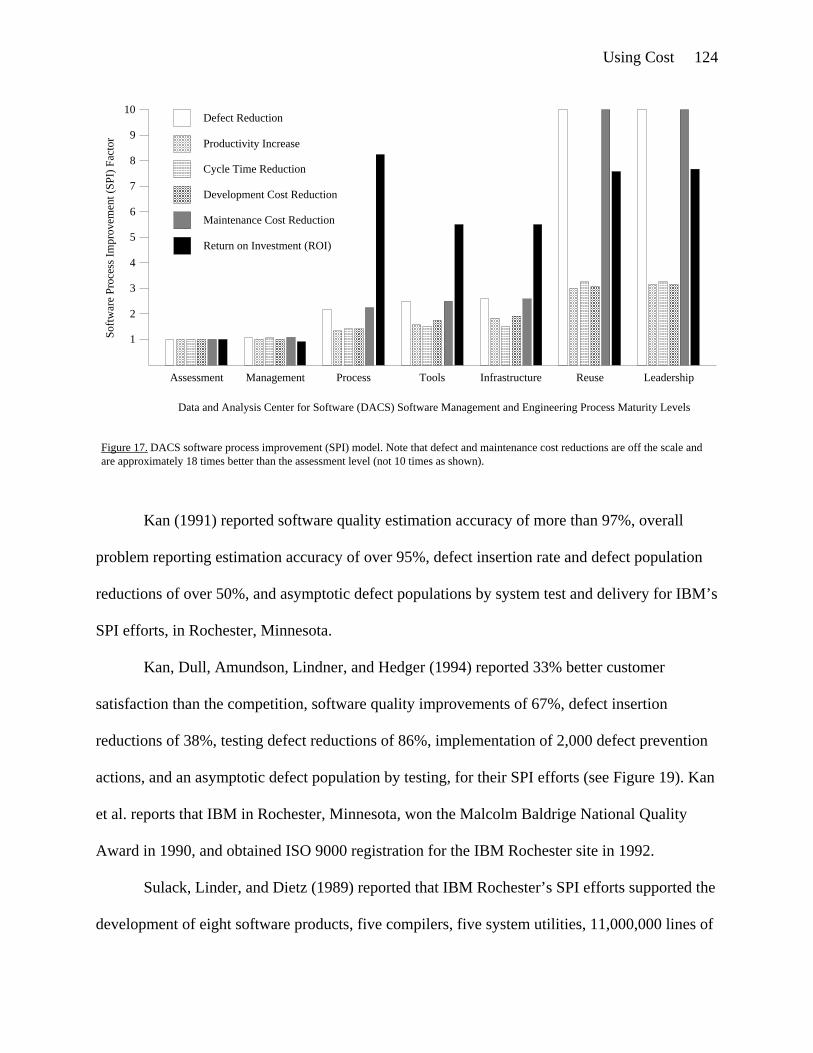
Using Cost 124
Kan (1991) reported software quality estimation accuracy of more than 97%, overall
problem reporting estimation accuracy of over 95%, defect insertion rate and defect population
reductions of over 50%, and asymptotic defect populations by system test and delivery for IBM’s
SPI efforts, in Rochester, Minnesota.
Kan, Dull, Amundson, Lindner, and Hedger (1994) reported 33% better customer
satisfaction than the competition, software quality improvements of 67%, defect insertion
reductions of 38%, testing defect reductions of 86%, implementation of 2,000 defect prevention
actions, and an asymptotic defect population by testing, for their SPI efforts (see Figure 19). Kan
et al. reports that IBM in Rochester, Minnesota, won the Malcolm Baldrige National Quality
Award in 1990, and obtained ISO 9000 registration for the IBM Rochester site in 1992.
Sulack, Linder, and Dietz (1989) reported that IBM Rochester’s SPI efforts supported the
development of eight software products, five compilers, five system utilities, 11,000,000 lines of
Figure 17. DACS software process improvement (SPI) model. Note that defect and maintenance cost reductions are off the scale andare approximately 18 times better than the assessment level (not 10 times as shown).
Assessment
Data and Analysis Center for Software (DACS) Software Management and Engineering Process Maturity Levels
1
2
3
4
5
6
7
8
9
10So
ftwar
e Pr
oces
s Im
prov
emen
t (SP
I) F
acto
rDefect Reduction
Productivity Increase
Cycle Time Reduction
Development Cost Reduction
Maintenance Cost Reduction
Management Process Tools Infrastructure Reuse Leadership
Return on Investment (ROI)

Using Cost 125
online help information, 32,000 pages of manuals, a 500,000 line automated help utility, and
1,100 lines of questions and answers. Sulack, Lindner, and Dietz also reported that IBM’s SPI
efforts resulted in the development of native support for 25 international languages. Sulack,
Lindner, and Dietz reported that in total, IBM Rochester’s SPI efforts supported the development
of 5,500,000 new source lines of code and the conversion of more than 32,000,000,000 source
lines of code for a new mid range computer system. Finally, Sulack, Lindner, and Dietz reported
a 38% cycle time reduction for not only introducing SPI efforts at IBM Rochester, but achieving
the aforementioned results as well.
Herbsleb, Carleton, Rozum, Siegel, and Zubrow (1994) of the SEI conducted a cost-
benefit analysis of CMM-based SPI involving 13 software management and development
organizations (see Figure 20). Herbsleb’s et al. study involved Bull HN, GTE Government
Project 1(680,000)
Software Development Projects (Source Lines of Code)
Def
ects
per
Tho
usan
d So
urce
Lin
es o
f Cod
eQuality Estimate
Quality in First Year
Actual Quality Level
Figure 18. IBM rayleigh life cycle reliability model accuracy.
0.0
0.2
0.4
0.6
0.8
1.0
1.2
1.4
1.6
1.8
2.0
2.2
Project 2(70,000)
Project 3(1,700,000)
Project 4(290,000)
Project 5(70,000)
Project 6(540,000)
Project 7(700,000)

Using Cost 126
Systems, Hewlett Packard, Hughes Aircraft Co., Loral Federal Systems, Lockheed Sanders,
Motorola, Northrop, Schlumberger, Siemens Stromberg-Carlson, Texas Instruments, the United
States Air Force Oklahoma City Air Logistics Center, and the United States Navy Fleet Combat
Direction Systems Support Activity. Herbsleb’s et al. study surveyed organizational
characteristics such as organizational environment and business characteristics and SPI efforts
such as SPI effort descriptions, process maturity information, measures and techniques in use,
and description of data collection activities.
Herbsleb’s et al. study also surveyed results such as impact of SPI on business objectives,
impact of SPI on social factors, and actual performance versus projections. Herbsleb et al.
reported costs and lengths of SPI efforts for five of thirteen organizations. Herbsleb et al.
reported one organization spent $1,203,000 per year for six years, one spent $245,000 in two
years, one spent $155,000 in six years, one spent $49,000 dollars in four years, and one spent
$516,000 in two years. Herbsleb et al. reports that yearly costs per software developer for the
same five organizations were, $2,004, $490, $858, $1,619, and $1,375 respectively. Herbsleb et
al. reported that yearly productivity increases for four of the thirteen organizations were 9% for
Analysis PreliminaryDesign
DetailedDesign
UnitTest
SystemTest
FieldOperation
ComponentTest
Software Life Cycle Phases
Code IntegrationTest
20
15
10
5
0
Def
ects
per
Tho
usan
d So
urce
Lin
es o
f Cod
e
Figure 19. IBM rayleigh life cycle reliability model.

Using Cost 127
three years, 67% for one year, 58% for four years, and 12% for five years. Herbsleb et al.
reported defect removal efficiency improvements of 25%, cycle time reductions of 23%,
software quality improvements of 94%, and return-on-investments of nearly 9:1. Herbsleb et al.
reported that the median SPI performance for all thirteen organizations included $245,000 yearly
costs, 3.5 years of SPI, $1,375 per software developer, 35% productivity increase, 22% defect
removal efficiency increase, 19% cycle time reduction, 39% software product quality increase,
and a 5:1 return-on-investment.
Kajihara, Amamiya, and Saya (1993) report a 100% increase in productivity from 1989
to 1993 and a 10:1 decrease in the number of software defects from 1984 to 1993, both as a
result of NEC’s SPI efforts in Tokyo, Japan (see Figure 21). Kajihara, Amamiya, and Saya go on
Return onInvestment
1
2
3
4
5So
ftwar
e Pr
oces
s Im
prov
emen
t (SP
I) F
acto
r
Figure 20. SEI software process improvement (SPI) survey of 13 organizations.
2.23X
1.77X1.67X
2.37X
5X
ProductQuality
CycleTime
DefectDetectionProductivity
Software Process Improvement (SPI) Metric

Using Cost 128
to report that the number of defect analysis reports associated with NEC Tokyo’s SPI efforts
increased by 33X, from 50 in 1981 to 1,667 at their peak in 1990. Kajihara, Amamiya, and Saya
report that the number of groups and people involved in NEC Tokyo’s SPI efforts grew from 328
groups and 2,162 people in 1981 to 2,502 groups and 15,032 people in 1990.
Weller (1993) reported that Bull HN Information System’s Major Systems Division
performed over 6,000 Software Inspections as part of their SPI-related efforts between 1990 and
1991 on mainframe computer operating systems. Weller reported that Bull HN Information
Systems managed 11,000,000 source lines of code, adding up to 600,000 source lines of code
every year. Weller reported that the number of software defects removed were 2,205, 3,703, and
5,649 in 1990, 1991, and 1992, respectively. Weller reported a 76% increase in defect removal
efficiency, 33% increase in software quality, and a 98.7% defect removal efficiency before
testing in the best case.
1984
Softw
are
Proc
ess I
mpr
ovem
ent (
SPI)
Fac
tor
1985 1986 1987 1988 1989 1990 1991 1992 1993
Year
2
4
6
8
10
9
7
5
3
1
0
Figure 21. NEC (tokyo, japan) defect prevention results.

Using Cost 129
Mays, Jones, Holloway, and Studinski (1990) reported that IBM Communications
Systems at Research Triangle Park, North Carolina, achieved a 50% defect insertion rate
reduction for their SPI related efforts, involving 414 software developers (see Figure 22). Mays
et al. reported that the total cost was less than half a percent of the total organizational resources,
in order to achieve the 50% defect insertion rate reduction. The 50% reduction in defects resulted
in four staff years of saved Software Inspection time, 41 staff years of saved testing time without
Software Inspections, and 410 staff years of saved post release defect removal time without
Software Inspections and testing. The total return-on-investment for IBM’s SPI related efforts
was over 482:1 in the best case.
Lim (1998) conducted an extensive survey of the costs and benefits of using Software
Reuse as a SPI strategy throughout international industry, as well as comprehensive Software
Reuse cost-benefit analyses at Hewlett Packard’s (HP’s) Manufacturing Productivity Section and
1.83.7
7.9
6.9
18.617.4
8.7 3.3
Analysis Design Code Unit Test System Test
Def
ects
per
Tho
usan
d So
urce
Lin
es o
f Cod
e
20.8
11.4
Software Life Cycle Phase
Figure 22. IBM defect prevention results.
25
20
15
10
5
0

Using Cost 130
San Diego Technical Graphics Division from 1983 to 1994 (see Table 59). Lim reports 100%
quality increases at HP, 50% decreases in time-to-market at AT&T, $1.5M in savings at
Raytheon, a 20X increase in productivity at SofTech, and a 25% increase in productivity at DEC
as a result of using Software Reuse. Lim also reports a 57% increase in productivity at HP, 461%
increase in productivity in an HP firmware division, 500% cycle time reduction in HP, and a
310% return-on-investment (ROI) at HP (in the best case) as a result of using Software Reuse.
Poulin (1997) cites similar benefits for Software Reuse from 10 software companies world-wide.
Poulin reports that NEC achieved a 6.7X productivity increase, GTE saved $14M, Toshiba
reduced defects 30%, DEC reduced cycle times 80%, CAP-Netron achieved 90% reuse levels,
Raytheon increased productivity 50%, and Software Architecture and Engineering reached 90%
reuse levels.
ManufacturingCost Category
Hewlett Packard Software Reuse Costs and Benefits
Table 59
Graphics
Net Present Value EffortReturn-on-Investment
TimespanYears
Initial EffortInitial Cost
Sustaining EffortSustaining Cost
Total EffortTotal Cost
Effort SavedCost Saved
Net Present Value DollarsBreak-Even Point
1983-19921026 Staff Months$0.3M54 Staff Months$0.7M80 Staff Months$1.0M328 Staff Months$4.1M310%125 Staff Months$1.6MSecond Year
1987-19948107 Staff Months$1.3M99 Staff Months$1.3M206 Staff Months$2.6M446 Staff Months$5.6M115%75 Staff Months$0.9MSixth Year
Division

Using Cost 131
Kaplan, Clark, and Tang (1995) of IBM Santa Teresa conducted a survey of 40 SPI
strategies, briefly describing them, identifying the process steps where possible, and enumerating
the costs and benefits as well. Kaplan, Clark, and Tang identified the Clean Room Methodology
as a strategically important SPI strategy (see Table 60). Kaplan, Clark, and Tang identified
resulting quality levels for 15 software projects at 2.3, 3.4, 4.5, 3.0, 0, 0, 2.6, 2.1, 0.9, 5.1, 3.5,
4.2, 1.8, 1.8, and 0.8 defects per thousand software source lines of code, for an average defect
density of 2.4.
Clean Room Methodology Benefits
Table 60
Year
1987
Software Size Defect Density
2.3
1988 3.4
1989 4.5
1990 3.0
1990 0.0
1991 0.0
1991 2.6
1991 2.1
1991 0.9
1992 5.1
1992 3.5
1992 4.2
1993 1.8
1993 1.8
1993 0.8
Organization
IBM
IBM
NASA
University
Martin Marietta
IBM
IBM
IBM
IBM
IBM
IBM
NASA
IBM
IBM
IBM
Product
Flight control
Software tool
Satellite control
Software tool
Word processor
Operating system
Operating system
Compiler
Imaging product
Printer driver
Expert system
Satellite control
Device driver
Database
Network software
33,000
85,000
40,000
12,000
1,800
600
10,000
21,900
3,500
6,700
17,800
170,000
39,900
8,500
4,800
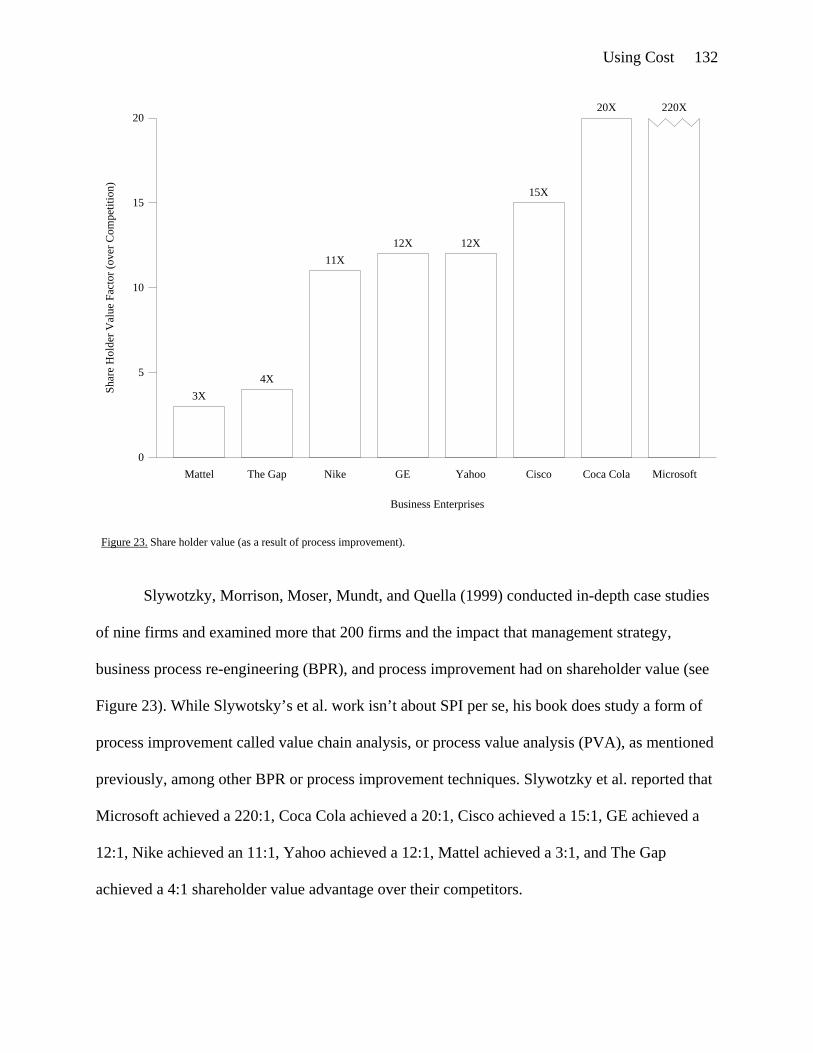
Using Cost 132
Slywotzky, Morrison, Moser, Mundt, and Quella (1999) conducted in-depth case studies
of nine firms and examined more that 200 firms and the impact that management strategy,
business process re-engineering (BPR), and process improvement had on shareholder value (see
Figure 23). While Slywotsky’s et al. work isn’t about SPI per se, his book does study a form of
process improvement called value chain analysis, or process value analysis (PVA), as mentioned
previously, among other BPR or process improvement techniques. Slywotzky et al. reported that
Microsoft achieved a 220:1, Coca Cola achieved a 20:1, Cisco achieved a 15:1, GE achieved a
12:1, Nike achieved an 11:1, Yahoo achieved a 12:1, Mattel achieved a 3:1, and The Gap
achieved a 4:1 shareholder value advantage over their competitors.
Yahoo
20Sh
are
Hol
der V
alue
Fac
tor (
over
Com
petit
ion)
Figure 23. Share holder value (as a result of process improvement).
220X
15X
12X 12X
3X
GENikeThe GapMattel
Business Enterprises
15
10
5
0
20X
4X
11X
Cisco Coca Cola Microsoft

Using Cost 133
Comparative Analyses
So far this study, specifically the literature review, has examined the definition of SPI,
the quantitative costs and benefits of SPI, and a broad-based examination of SPI techniques,
methods, methodologies, approaches, and strategies. This section attempts to examine the best
SPI strategies based on existing analytical comparative analyses of the various SPI approaches.
The reason previous sections have examined such a broad base of SPI methods, rather than
rushing right into to this section’s analyses, was to expose the reader to an authoritatively wide
variety of SPI techniques that are available for later individual analysis.
This section examines 18 quantitative and qualitative SPI models, comparative analyses,
and decision analysis models to introduce candidate and foundational approaches for identifying
and selecting from multiple SPI strategies based on individual costs and benefits (see Table 61).
Survey of Software Process Improvement (SPI) Comparative Analyses
Table 61
Quantitative Benefits Criteria Techniques, Methods, StrategiesModel
Decision Analysis
n/a
2
5
4
6
14
29
11
11
12
16
3
6
444
444
5
11
12
Author
Humphrey
Austin
McConnell
Grady
McGibbon
Rico
McGibbon
n/a
Kettinger
Tingey
Harrington
Jones
Haskell
Wang
Wang
Wang
McConnell
Rico
SEI SW-CMM
Decision Matrix
Decision Matrix
Decision Matrix
Decision Matrix
Defect Removal
Defect Removal
Decision Matrix
Decision Matrix
Decision Matrix
Decision Matrix
Decision Matrix
Decision Matrix
Decision Matrix
Decision Matrix
Decision Matrix
Decision Matrix
No
No
No
Yes
Yes
Yes
Yes
No
No
No
No
No
Yes
Yes
Yes
Yes
No
Yes
Costs
No
No
No
Yes
Yes
Yes
Yes
No
No
No
No
No
Yes
No
No
No
No
Yes
No
Yes
Yes
Yes
Yes
Yes
Yes
Yes
No
No
Yes
No
Yes
No
No
No
Yes
Yes
18 Key Process Areas (KPAs)
13 Various
29 Various
11 Various
Clean Room, Inspection, Reuse
PSP, Inspection, Test
Clean Room, Inspection, Walkthrough
Reviews, Inspection, Walkthrough
72 Various
Baldrige, ISO 9001, SEI SW-CMM
6 Various Quality Management Systems
49 Various
SEI SW-CMM, ISO 9001
SPRM, SPICE, CMM, BOOTSTRAP, ISO 9000
50 Various
10 Various
Vertical Process, Vertical Life Cycle
SPICE, CMM, BOOTSTRAP, ISO 9000
Best SPI Method
Requirements Analysis
Cost Estimation
Evolutionary Life Cycle
Program Understanding
Software Inspections
PSP
Clean Room
Software Inspections
n/a
Baldrige
TQM
Quality Metrics
ISO 9001
SPRM
SPICE
Software Architecture
Spiral Life Cycle
PSP

Using Cost 134
Humphrey (1987 and 1989) and Paulk, Weber, Curtis, and Chrissis (1995) created the
Capability Maturity Model for Software (CMM) as a prescriptive framework for software
process improvement (SPI)—note that the CMM is prescriptive for software process
improvement (SPI), not necessarily software management, engineering, or process definition.
The CMM is designed to identify key or strategic processes, group and arrange them according
to importance and priority, and direct the order of software process improvement (SPI) priorities,
activities, and implementation (see Figure 24).
Figure 24. SEI capability maturity model for software (CMM).
Level 2 - Repeatable
Software Configuration Management Software Quality Assurance Software Subcontract Management Software Project Tracking & Oversight Software Project Planning Requirements Management
Level 3 - Defined Peer Reviews Intergroup Coordination Software Product Engineering Integrated Software Management Training Program Organizational Process Definition Organizational Process Focus
Level 4 - Managed Software Quality Management Quantitative Process Management
Level 5 - Optimizing Process Change Management Technology Change Management Defect Prevention
Level 1 - Initial

Using Cost 135
According to the CMM, organizations should first focus on the six Level 2 (Repeatable)
Key Process Areas (KPAs), Requirements Management, Software Project Planning, Software
Project Tracking and Oversight, Software Subcontract Management, Software Quality
Assurance, and then Software Configuration Management. Then software organizations should
focus on the seven Level 3 (Defined) Key Process Areas (KPAs), Organizational Process Focus,
Organizational Process Definition, Training Program, Integrated Software Management,
Software Product Engineering, Intergroup Coordination, and then Peer Reviews. Then software
organizations should focus on the Level 4 (Managed) Key Process Areas (KPAs), Quantitative
Process Management and then Software Quality Management. Finally, software organizations
should focus on the Level 5 (Optimizing) Key Process Areas (KPAs), Defect Prevention,
Technology Change Management, and Process Change Management.
The CMM seems to be consistent with W. Edwards Deming’s first three of fourteen
points, nature of variation, losses due to tampering (making changes without knowledge of
special and common causes of variation), and minimizing the risk from the above two (through
the use of control charts). In other words, W. Edwards Deming believed that minimizing
variation is the key to organizational performance improvement (but, only if the techniques to
minimize variation are based on measurable decisions). Likewise, the CMM asks that processes
be stabilized, defined, and measured before software process changes are implemented.
Unfortunately, it takes many years to reach CMM Level 5 and less than 1% of worldwide
organizations are at CMM Level 5. Therefore, the CMM would have virtually no worldwide
organizations attempt process improvement. On the contrary, W. Edwards Deming meant that
organizations should take measurements on day one and then make process changes based on
measurement data (not wait many years to perform process improvements).

Using Cost 136
Austin and Paulish (1993), then of the Software Engineering Institute (SEI), conducted a
qualitative analysis and comparison of 13 “tactical” software process improvement (SPI)
methods beyond the strategic organizational nature of the CMM (see Table 62).
Austin and Paulish identified qualitative pros and cons of the 13 software process
improvement (SPI) methods, as well as a mapping them to the CMM (as shown in Table 28).
Only SEI CMM Level 4 organizations should attempt the Clean Room Methodology and the
Defect Prevention Process. Only SEI CMM Level 3 organizations should attempt Total Quality
Management, Quality Function Deployment, and Software Reliability Engineering. Only SEI
CMM Level 2 organization should attempt Interdisciplinary Group Methods, CASE Tools,
Software Metrics, the Software Inspection Process, Process Definition, and Software Process
Assessment. Finally, SEI CMM Level 1 organizations may attempt to use ISO 9000 and
estimation. Since many worldwide software organizations aren’t at SEI CMM Levels 3, 4, and 5,
Austin and Paulish recommend that organizations shouldn’t use many powerful SPI methods.
SEI Comparison of Software Process Improvement (SPI) Methods
Table 62
Software Reliability Engineering
Strategy Pros
ISO 9000
Software Metrics
Interdisciplinary Group Method
Total Quality Management
Software Inspection Process
Quality Function Deployment
Estimation
Software Process AssessmentProcess Definition
CASE Tools
Defect Prevention ProcessClean Room Methodology
Fundamental to project planningRequired for many marketsGood first step to improvementProvides improvement baselineEasy to beginUsed with other methodsAutomates processPromotes better teamworkProvides field defect predictionsHelps build the "right" productsBuilds a "quality culture"Makes classes of errors extinctCan result in high product quality
ConsCMM Level
Requires historical dataEmphasis on evidence onlyProvides findings onlyLack of skills with toolsCommonly used for codeMust be tailored to goalsHigh investment costsCommunication overheadLack of training and skillsDifficult to manageRequires organization buy-inOnly for mature organizationsRadically different approach
11
1 - 21 - 21 - 21 - 21 - 21 - 22 - 32 - 32 - 33 - 43 - 4

Using Cost 137
McConnell (1996) identified, defined, and compared 29 software process improvement
(SPI) methods in terms of potential reduction from nominal schedule (cycle-time reduction),
improvement in progress visibility, effect on schedule risk, chance of first-time success, and
chance of long-term success (see Table 63).
Construx Comparison of Software Process Improvement (SPI) Methods
Table 63
SPI Method
Change BoardDaily Build and Smoke TestDesigning for ChangeEvolutionary DeliveryEvolutionary PrototypingGoal Setting (shortest schedule)
Software Inspection ProcessJoint Application DevelopmentLife Cycle Model SelectionMeasurementMiniature MilestonesOutsourcingPrincipled NegotiationProductivity EnvironmentsRapid-Development LanguagesRequirements ScrubbingReuseSigning UpSpiral Life Cycle ModelStaged DeliveryTheory-W ManagementThrowaway PrototypingTimebox DevelopmentTools GroupTop-10 Risks ListUser-Interface PrototypingVoluntary Overtime
Fair Fair Decreased Very Good Excellent
Cycle-TimeReduction
ProgressVisibility
ScheduleRisk
First-TimeSuccess
Long-TermSuccess
Good Good Decreased Very Good ExcellentFair None Decreased Good Excellent
Good Excellent Decreased Very Good ExcellentExcellent Excellent Increased Very Good Excellent
Very Good None Increased Good Very Good
Very Good Fair Decreased Good ExcellentGood Fair Decreased Good ExcellentFair Fair Decreased Very Good Excellent
Very Good Good Decreased Good ExcellentFair Very Good Decreased Good Excellent
Excellent None Increased Good Very GoodNone Very Good Decreased Very Good ExcellentGood None No Effect Good Very GoodGood None Increased Good Very Good
Very Good None Decreased Very Good ExcellentExcellent None Decreased Poor Very Good
Very Good None Increased Fair GoodFair Very Good Decreased Good Excellent
None Good Decreased Very Good ExcellentNone Very Good Decreased Excellent ExcellentFair None Decreased Excellent Excellent
Excellent None Decreased Good ExcellentGood None Decreased Good Very GoodNone Very Good Decreased Excellent ExcellentGood Fair Decreased Excellent ExcellentGood None Increased Fair Very Good
Goal Setting (least risk) None Good Decreased Good Very GoodGoal Setting (max visibility) None Excellent Decreased Good Very Good

Using Cost 138
Evolutionary prototyping, outsourcing, reuse, and timebox development are excellent for
potential reduction from nominal schedule (cycle-time reduction). Evolutionary delivery,
evolutionary prototyping, and goal setting (for maximum visibility) are excellent for
improvement in progress visibility. Most software process improvement (SPI) methods are
reported to have a positive effect on schedule risk. Theory-W management, throwaway
prototyping, top-10 risk lists, and user-interface prototyping have a good chance of first-time
success. Finally, many of the software process improvement (SPI) methods are reported to result
in a good chance of long-term success.
Grady (1997) identified, defined, and compared 11 software process improvement (SPI)
methods in use throughout Hewlett Packard in terms of difficulty of change, cost of change,
break-even time of change, and percent expected cost improvement (see Table 64).
Grady reports that software reuse is the most difficult, most expensive, and has the
longest breakeven point, but has the greatest payoff. Grady reports that complexity analysis and
program understanding are the simplest, least expensive, and have short breakeven points, with
the smallest payoffs. Rapid prototyping and the Software Inspection Process are also attractive.
HP Comparison of Software Process Improvement (SPI) Methods
Table 64
DifficultyStrategy
Product Definition ImprovementDetailed Design MethodsRapid PrototypingSystems Design ImprovementsSoftware Inspection ProcessSoftware ReuseComplexity AnalysisConfiguration ManagementCertification ProcessSoftware Asset ManagementProgram Understanding
Cost Breakeven Savings
Low Medium Medium 3 - 9%High Medium Long 3 - 12%Low Low Medium 5 - 12%
Medium Medium Long 5 - 12%Low Medium Short 8 - 20%High High Long 10 - 35%Low Low Short 2 - 5%High High Long 3 - 10%
Medium Medium Medium 3 - 6%High Medium Long 3 - 6%Low Low Short 3 - 7%
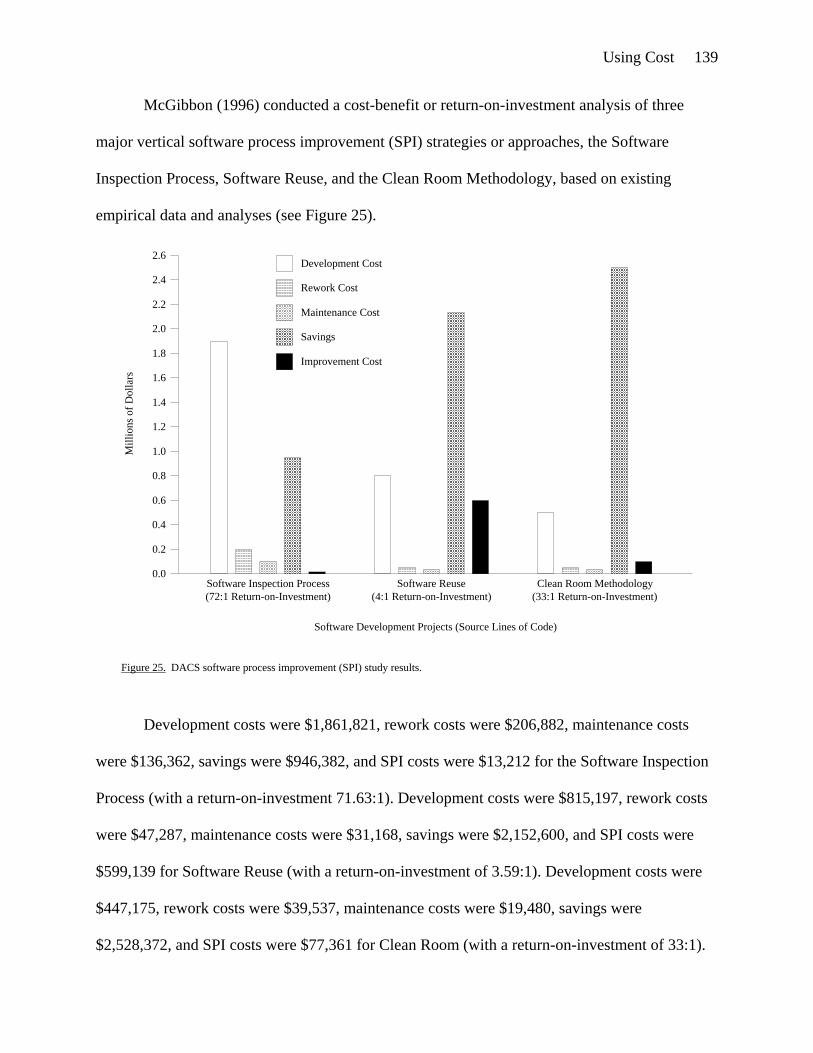
Using Cost 139
McGibbon (1996) conducted a cost-benefit or return-on-investment analysis of three
major vertical software process improvement (SPI) strategies or approaches, the Software
Inspection Process, Software Reuse, and the Clean Room Methodology, based on existing
empirical data and analyses (see Figure 25).
Development costs were $1,861,821, rework costs were $206,882, maintenance costs
were $136,362, savings were $946,382, and SPI costs were $13,212 for the Software Inspection
Process (with a return-on-investment 71.63:1). Development costs were $815,197, rework costs
were $47,287, maintenance costs were $31,168, savings were $2,152,600, and SPI costs were
$599,139 for Software Reuse (with a return-on-investment of 3.59:1). Development costs were
$447,175, rework costs were $39,537, maintenance costs were $19,480, savings were
$2,528,372, and SPI costs were $77,361 for Clean Room (with a return-on-investment of 33:1).
Software Development Projects (Source Lines of Code)
Mill
ions
of D
olla
rs
Figure 25. DACS software process improvement (SPI) study results.
0.0
0.2
0.4
0.6
0.8
1.0
1.2
1.4
1.6
1.8
2.0
2.2
2.4
2.6Development Cost
Rework Cost
Maintenance Cost
Software Inspection Process(72:1 Return-on-Investment)
Software Reuse(4:1 Return-on-Investment)
Clean Room Methodology(33:1 Return-on-Investment)
Savings
Improvement Cost
Using Cost 140
Rico (1999) conducted a cost-benefit or return-on-investment analysis of three major
vertical software process improvement (SPI) strategies or approaches, the Personal Software
Process (PSP), the Software Inspection Process, and Testing, based on existing empirical data
and analyses (see Table 65).
Review hours were 97.24, review efficiency was 67%, test hours were 60.92, total hours
were 400, and delivered defects were zero, for a quality benefit of 100X and a cost benefit of
29X over testing, using the Personal Software Process (PSP). Review hours were 708, review
efficiency was 90%, test hours were 1,144, total hours were 1,852, and delivered defects were
10, for a quality benefit of 10X and a cost benefit of 6X over testing, using the Software
Inspection Process. Test hours were 11,439, test efficiency was 90%, and delivered defects were
100, using Testing. PSP hours included both development and test, while the others did not.
PSP, Software Inspection Process, and Testing Comparison
Table 65
PSPCost/Benefits Inspection Test
10 KSLOC 10 KSLOC 10 KSLOC1,000 1,000 1,00097.24 708 n/a666 900 n/a
333 100 1,00060.92 1,144 11,439333 90 9005.47 12.71 12.71400 * 1,852 11,4391,000 990 900
0 10 100
Program SizeStart DefectsReview HoursReview Defects
Start DefectsTest HoursTest DefectsDefects per HourTotal HoursTotal Defects
Delivered Defects
Defects per Hour 6.85 1.27 n/a
* PSP hours include development time--others only validation time
29X 6X n/aCost Benefit
100X 10X n/aQuality Benefit
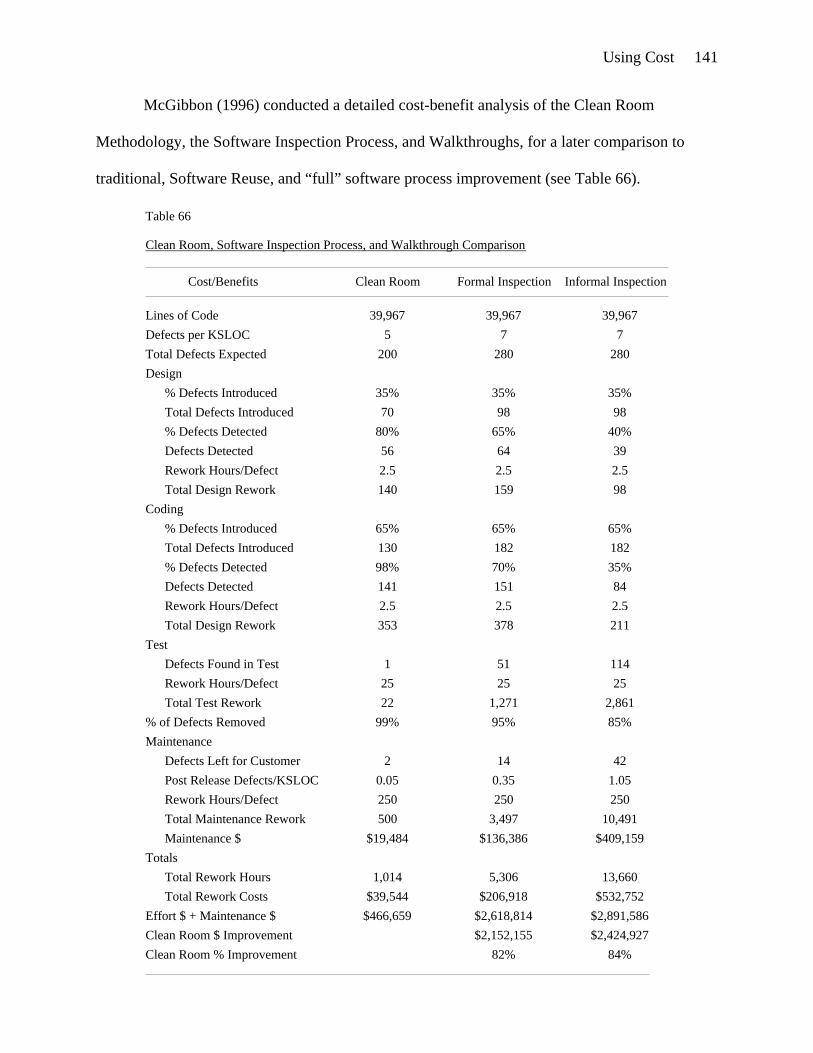
Using Cost 141
McGibbon (1996) conducted a detailed cost-benefit analysis of the Clean Room
Methodology, the Software Inspection Process, and Walkthroughs, for a later comparison to
traditional, Software Reuse, and “full” software process improvement (see Table 66).
Clean Room, Software Inspection Process, and Walkthrough Comparison
Table 66
Clean RoomCost/Benefits Formal Inspection Informal Inspection
39,967 39,967 39,9675 7 7
200 280 280
35% 35% 35%70 98 98
80% 65% 40%56 64 392.5 2.5 2.5140 159 98
65% 65% 65%130 182 18298% 70% 35%141 151 842.5 2.5 2.5353 378 211
1 51 11425 25 2522 1,271 2,861
1,014 5,306 13,660$39,544 $206,918 $532,752
$466,659 $2,618,814 $2,891,586$2,152,155 $2,424,927
82% 84%
99% 95% 85%
2 14 420.05 0.35 1.05250 250 250500 3,497 10,491
$19,484 $136,386 $409,159
Total Defects Introduced% Defects DetectedDefects DetectedRework Hours/DefectTotal Design Rework
% Defects Introduced
Total Defects Introduced% Defects DetectedDefects DetectedRework Hours/DefectTotal Design Rework
% Defects Introduced
Rework Hours/DefectTotal Test Rework
Defects Found in Test
Post Release Defects/KSLOCRework Hours/DefectTotal Maintenance ReworkMaintenance $
Defects Left for Customer
% of Defects Removed
Lines of CodeDefects per KSLOCTotal Defects ExpectedDesign
Coding
Test
Totals
Effort $ + Maintenance $Clean Room $ ImprovementClean Room % Improvement
Maintenance
Total Rework HoursTotal Rework Costs

Using Cost 142
Total development defect removal efficiencies for the Clean Room Methodology and
Formal and Informal Inspections were 99%, 95%, and 85%, respectively. Total development
rework hours for the Clean Room Methodology and Formal and Informal Inspections were 515,
1,808, and 3,170, respectively. Total Maintenance Rework for the Clean Room Methodology,
Formal and Informal Inspections were 500, 3,497, and 10,491, respectively. Total maintenance
costs for the Clean Room Methodology and Formal and Informal Inspections were $19,484,
$136,386, and $409,159, respectively. Total development and maintenance costs for the Clean
Room Methodology and Formal and Informal Inspections were $466,659, $2,618,814, and
$2,891,586, respectively.
The IEEE Standard for Software Reviews and Audits (IEEE Std 1028-1988) compares
four types of reviews for software management and engineering, Management Review,
Technical Review, the Software Inspection Process, and Walkthroughs (see Table 67). The
objective of Management Reviews is to ensure progress, recommend corrective action, and
ensure proper allocation of resources. The objective of Technical Reviews is to evaluate
conformance to specifications and plans and ensure change integrity. The objective of the
Software Inspection Process is to detect and identify defects and verify resolution. And, the
objective of Walkthroughs is to detect defects, examine alternatives, and act as a forum for
learning. Management Reviews, Technical Reviews, and Walkthroughs are informal gatherings
of usually large numbers of people for the purpose of status reporting, information gathering,
team building, and information presentation and brainstorming. The Software Inspection Process
is a highly structured gathering of experts to identify defects in software work products ranging
from requirement specifications to the software source code. The Software Inspection Process
has concise objectives, steps, time limits, and lends itself to measurement and analysis.

Using Cost 143
Kettinger, Teng, and Guha, (1996) conducted a survey of 72 business process
reengineering (BPR) methods and 102 automated BPR tools, designing an empirically derived
contingency model for devising organizational-specific BPR strategies by selecting from
multiple BPR methods and tools. The model works by first assessing individual organizational
BPR requirements and propensity for change (see Table 68).
Comparison of Reviews, Software Inspection Process, and Walkthroughs
Table 67
Management ReviewCharacteristics
Objective
Delegated Controls
Decision Making
Change Verification
Group Dynamics
Recommended Size
Attendance
Leadership
Procedures
Material Volume
Presenter
Data Collection
Outputs
Reports
Data Base Entries
Technical Review Software Inspection Walkthrough
Change verification left toother project controls.
Leader verifies as part ofreview report.
Moderator verifiesrework.
Change verification left toother project controls.
Management team chartscourse of action.Decisions are made at themeeting or as a result ofrecommendations.
Evaluate conformance tospecifications and plans.Ensure change integrity.
Detect and identifydefects. Verify resolution.
Detect defects. Examinealternatives. Forum forlearning.
Two or more persons. Three or more persons. Three to six persons. Two to seven persons.
Moderate to high,depending on the specificstatement of objectives forthe meeting.
Moderate to high,depending on the specificstatement of objectives forthe meeting.
Relatively low. Relatively low.
Ensure progress.Recommend correctiveaction. Ensure properallocation of resources.
Evaluate conformance tospecifications and plans.Ensure change integrity.
Detect and identifydefects. Verify resolution.
Detect defects. Examinealternatives. Forum forlearning.
Management, technicalleadership, and peer mix.
Technical leadership andpeer mix.
College of peers meet withdocumented attendance.
Technical leadership andpeer mix.
Usually the responsiblemanager.
Usually the lead engineer. Trained moderator. Usually producer.
Usually the responsiblemanager.
Usually the lead engineer. Trained moderator. Usually producer.
As required by applicablepolicies, standards, orplans.
Not a formal projectrequirement. May be donelocally.
Formally required. Not a formal projectrequirement. May be donelocally.
Management reviewreport.
Technical review reports. Defect list and summary.Inspection report.
Walkthrough report.
Any schedule changesmust be entered into theproject tracking database.
No formal data baserequired.
Defect counts,characteristics, severity,and meeting attributes arekept.
No formal databaserequirement.

Using Cost 144
Kettinger’s, Teng’s, and Guha’s BPR methodology is composed of three steps, Assessing
Project Radicalness (project radicalness planning worksheet), Customizing the Stage-Activity
(SA) Methodology (a separate model for selecting appropriate BPR stages and activities), and
Selecting Reengineering Techniques (based on a categorization of BPR techniques). The project
radicalness planning worksheet (Table 68) is used to determine if a specific organization is best
suited by low-impact process improvement techniques, or whether the organization needs to be
redesigned from the ground-up. The stage-activity framework is applied by answering these four
questions: How radical is the project? How structured is the process? Does the process have high
customer focus? Does the process require high levels of IT enablement? Selecting reengineering
Business Process Reengineering (BPR) Contingency Model
Table 68
Strategic Centrality
Feasibility of IT to changeprocess
Process breadth
Senior managementcommitment
Performance measurementcriteria
Process functionality
Project resourceavailability
Structural flexibility
Cultural capacity forchange
Management's willingessto impact people
Value chain target
Is the targeted process merely tangential (1) or integral (5) to thefirm's strategic goals and objectives?
Does IT enable only incidental change (1) or fundamental processchange (5)?
Is the scope of the process intra-functional (1) orinterorganizational (5)?
Is the senior management visibly removed (1) or actively involved(5) in the BPR efforts?
Are the preferred performance measurement criteria efficiencybased (1) or effectiveness based (5)?
Is the process functioning marginally (1) or is the process notfunctioning well at all (5)?
Are only minimal resources (1) available to support the processchange or are resources abundant (5)?
Is the organizational structure rigid (1) or is it flexibly conducive(5) to change and learning?
Does the culture support the status quo (1) or actively seekparticipatory change (5)?
Are only modest impacts on people tolerable (1) or is managementwilling to deal with the consequences of distruptive impacts (5)?
Is the BPR effort targeted at an internal support process (1) or acore process (5)?
Factor Question ProcessImprovement
ProcessRedesign
RadicalReengineering
1 ----- 2Tangential
----- 3 ----- 4 ----- 5Integral
1 ----- 2Incidental
----- 3 ----- 4 ----- 5Integral
1 ----- 2Intra-functional
----- 3 ----- 4 ----- 5Interorganizational
1 ----- 2Removed
----- 3 ----- 4 ----- 5Involved
1 ----- 2Efficiency
----- 3 ----- 4 ----- 5Effectiveness
1 ----- 2Marginally
----- 3 ----- 4 ----- 5Not Well
1 ----- 2Scarce
----- 3 ----- 4 ----- 5Abundant
1 ----- 2Rigid
----- 3 ----- 4 ----- 5Flexible
1 ----- 2Status quo
----- 3 ----- 4 ----- 5Adaptable
1 ----- 2Modest
----- 3 ----- 4 ----- 5Disruptive
1 ----- 2Support
----- 3 ----- 4 ----- 5Core

Using Cost 145
techniques is accomplished by selecting from 11 technique groupings, project management,
problem solving and diagnosis, customer requirement analysis, process capture and modeling,
process measurement, process prototyping and simulation, IS systems analysis and design,
business planning, creative thinking, organizational analysis and design, and change
management.
Tingey (1997) conducted a comparison of the Malcolm Baldrige National Quality Award,
ISO 9001, and the SEI’s Capability Maturity Model for Software (CMM), in order to help
organizations choose the best quality management system (see Table 69). According to Tingey,
the Malcolm Baldrige National Quality Award is the best quality management system. Malcolm
Baldrige is 2.5X better than CMM for Leadership, 44X better than ISO 9001 for Human
Resources, 1.4X better than ISO 9001 for implementing, 9.4X better than ISO 9001 for
managing, 1.8X better than ISO 9001 for improving, and 3.6X better than CMM for motivating.
Malcolm Baldrige, ISO 9001, and SEI CMM Comparison
Table 69
Criteria Malcolm Baldrige
LeadershipInformation and AnalysisStrategic PlanningHuman ResourcesProcess ManagementBusiness ResultsCustomer Satisfaction
PlanningImplementingManagingImprovingCommunicatingTraining
Malcolm Baldrige
Total Quality Management
Motivating
ISO 9001 SEI CMM
23.5 15.7 9.719.9 32.2 38.417.6 44.5 26.930.9 0.7 8.51.5 5.5 5.22.2 1.4 11.34.4 0 0
10.3 7.5 16.313.2 9.6 11.46.6 0.7 0
12.5 6.9 9.529.4 66.4 56.34.4 0 0
23.6 8.9 6.5

Using Cost 146
Harrington (1995) conducted an analysis and comparison of six major organizational
improvement approaches, Total Business Management (TBM), Total Cost Management (TCM),
Total Productivity Management (TPM), Total Quality Management (TQM), Total Resource
Management (TRM), and Total Technology Management (TTM) frameworks or models (see
Table 70).
Total Quality Management (TQM) seems to be the best organizational improvement
model, scoring affirmatively in 12 of 16 (75%) of the categories. Total Resource Management
(TRM) comes in a close second place, scoring affirmatively in 11 of 16 (69%) of the categories.
Total Business Management (TBM), Total Cost Management (TCM), and Total Technology
Management (TTM) tied for third place, scoring affirmatively in 10 of 16 (63%) of the
categories. All six of the organizational improvement frameworks seemed to be about the same
on Harrington’s evaluation (demonstrating a good overall effect of using all approaches).
Comparison of Enterprise Quality Management Models
Table 70
Criteria TBM
Increases Market ShareIncreases Return-on-InvestmentIncreases Value Added per EmployeeIncreases Stock PricesImproves MoraleImproves Customer SatisfactionImproves Competitive PositionImproves ReliabilityImproves MaintainabilityImproves SafetyDecreases WasteDecreases OverheadDecreases InventoryCauses LayoffsIncreases the Number of EmployeesIncreases Profit
TCM TPM TQM TRM TTM
Yes Yes Yes Yes Yes YesYes Yes Yes Yes Yes YesYes Yes Yes No Yes NoYes Yes Yes Yes Yes YesNo No No Yes No NoNo No No Yes No YesYes Yes Yes Yes No YesNo No No Yes No YesNo No No No No YesNo No No No Yes NoNo Yes Yes Yes Yes NoYes Yes Yes Yes Yes NoYes Yes No No Yes No
Sometimes Yes YesNo No
Yes Yes Yes Yes Yes YesSometimes
Sometimes
Sometimes
Sometimes
Sometimes
Sometimes
Sometimes

Using Cost 147
Rico (1998) conducted a cost-benefit or return-on-investment analysis of software
process improvement (SPI) strategies, identifying three major classes of SPI strategies,
Indefinite, Vertical Process, and Vertical Life Cycle, creating a highly structured, empirically-
derived analytical model to classify, evaluate, and select SPI strategies (see Figure 26).
Indefinite SPI strategies include, Kaizen, ISO 9000, Experience Factory, Goal Question
Metric, Total Quality Management, Capability Maturity Model, and Business Process
Reengineering. Vertical Process SPI strategies include, Configuration Management, Test,
Inspection, Quality Estimation, Statistical Process Control (SPC), Defect Classification, and
Defect Prevention. Vertical Life Cycle SPI strategies include, Personal Software Process, Defect
Removal Model, and Product Line Management. Indefinite SPI strategies involve inventing
software processes by non-experts, Vertical Process Strategies involve using proven software
processes, and Vertical Life Cycle SPI strategies involve using proven software life cycles.
Power
Effe
ctiv
enes
s
VerticalLife Cycle
VerticalProcess
Indefinite
Figure 26. Software process improvement (SPI) strategy empirical analytical model.

Using Cost 148
Jones (1997b) conducted an analysis and comparison of ten major software process
improvement (SPI) strategy classes their applicability based on organization size (see Table 71).
SPR Comparison of Software Process Improvement (SPI) Methods
Table 71
SPI Class SPI Technique
Enterprise Quality Programs
Quality Awareness and Training
Quality Standards and Guidelines
Quality Analysis Methods
Quality Measurement Methods
Defect Prevention Methods
Non-Test Defect Removal Methods
Testing Methods
User Satisfaction Methods
Post-Release Quality Methods
In-House SeminarsPublic SeminarsOnline Quality ForumsRisk-Analysis Training
Baldrige AwardsQuality Assurance DepartmentsExecutive Quality GoalsManagement Quality GoalsSEI CMM Level 3, 4, or 5
In-House StandardsIEEE StandardsISO StandardsAssessmentsBaseline StudiesBenchmark ComparisonsRisk AnalysisFunction Point NormalizationDefect Aging MeasuresDefect Distribution MeasuresDefect Severity MeasuresRoot Cause AnalysisConfiguration Control ToolsChange Control BoardsDesign InspectionsCode InspectionsGraphical Specification MethodsPrototypingRisk AnalysisQuality Function DeploymentCertified Reusable MaterialsDesign InspectionsCode InspectionsUsability ReviewsUnit Test by ProgrammersComplexity AnalysisRegression Test by SpecialistsPerformance Test by SpecialistsSystem Test by SpecialistsField Test by Clients or CustomersTest Coverage AnalysisTest Library Control ToolsTest Case ReviewsTest Script AutomationUsability LaboratoriesUser Focus GroupsUser Satisfaction SurveysAutomated Defect TrackingCustomer Support SpecialistsOnline Defect Reporting
Large Medium SmallOrganization Size
Maybe Maybe NoYes Maybe NoYes Yes MaybeYes Yes YesYes Maybe NoYes Maybe NoYes Yes YesYes Yes YesYes Maybe NoYes Maybe No
Maybe Maybe MaybeYes Yes Maybe
Yes Yes Yes
Yes Yes MaybeYes Yes MaybeYes Yes MaybeYes Yes Maybe
Yes Maybe Maybe
Yes Yes YesYes Yes YesYes Yes Yes
Yes Yes YesYes Maybe NoYes Maybe Yes
Maybe Maybe No
Yes Yes YesYes Yes YesYes Yes YesYes Maybe Maybe
Yes Yes Maybe
Yes Maybe MaybeYes Yes YesYes Yes YesYes Maybe MaybeYes Yes Yes
Yes Maybe No
Maybe Maybe Maybe
Yes Maybe NoYes Maybe NoYes Yes YesYes Yes YesYes Yes Yes
Yes No NoYes Yes Yes
Yes Maybe MaybeYes Maybe MaybeYes Yes YesYes Yes MaybeYes Yes Yes

Using Cost 149
The ten SPI strategy classes included, enterprise quality programs, quality awareness and
training, quality standards and guidelines, quality analysis methods, quality measurement
methods, defect prevention methods, non-test defect removal methods, testing methods, user
satisfaction methods, and post-release quality methods. Jones' analysis merely indicates that most
SPI strategies apply to organizations of all sizes, without any sharply discriminating factors.
Haskell, Decker, and McGarry (1997) conducted an economic analysis and comparison
of Software Engineering Institute (SEI) Capability Maturity Model for Software (CMM)
Software Capability Evaluations (SCEs) and ISO 9001 Registration Audits at the Computer
Sciences Corporation (CSC), between 1991 and 1997 (see Table 72). CSC required seven years
of elapsed calendar time and 4,837 staff hours or 2.33 staff years of actual effort to achieve SEI
CMM Level 3 compliance, while requiring one year of elapsed calendar time and 5,480 staff
hours or 2.63 staff years of actual effort to achieve ISO 9001 Registration. Some of the major
differences include a 7:1 advantage in elapsed calendar time to become ISO 9001 Registered in
one attempt, versus multiple SEI SCE attempts over a seven-year period.
Software Capability Evaluations (SCEs) and ISO 9001 Registration Audits
Table 72
SCE
10/91
2
850
Internal Assessments
Few KPAs Satisfied
Factors
Date
Staff Months
Staff Hours
External Consultants
Preparation Strategy
Result
SCE
2/96
4
1,800
Gap Analysis Lessons Learned Deployment Focus
13 KPAs Satisfied
ISO 9001
5/97
12
3,400
Implement Plan External Experts Train Staff Deployment Focus
ISO 9001 Registration
Minimal None 200 Hours Consultant Internal Auditor Pre-Registration
Assessment
SCE
11/97 to 1/98
2
800
Action Items Awareness Seminars Internal Assessments
SEI CMM Level 3
None
ISO 9001
11/97
6
500
Process Improvements Management Reviews Internal Audits Corrective Actions
ISO 9001 Registration
None

Using Cost 150
Wang, Court, Ross, Staples, King, and Dorling (1997a) conducted a technical analysis
and comparison of international software process improvement (SPI) strategies, identifying five
leading models, Software Process Reference Model (SPRM), Software Process Improvement and
Capability Determination (SPICE), Capability Maturity Model for Software (CMM),
BOOTSTRAP, and ISO 9000 (see Table 73).
According to Wang et al. the Software Engineering Institute’s (SEI’s) Capability
Maturity Model for Software (CMM) is the weakest SPI model by far, accounting for only
33.7% of the necessary software management and engineering requirements suggested by the
SPRM SPI model. SPICE and BOOTSTRAP are reported to account for 45% of SPRM’s
requirements, while IS0 9000 helps bring up the rear, meeting 40% of SPRM’s requirements.
SPRM is reported to be a super SPI model composed of all of SPICE’s 201, BOOTSTRAP’s
201, ISO 9000’s 177, and the SEI CMM’s 150 requirements. After redundancy elimination,
SPRM is left with 407 common requirements plus 37 new ones for a total of 444.
Comparison of SPRM, SPICE, CMM, BOOTSTRAP, and ISO 9000
Table 73
SPRM Subsystem
Organization
Software Engineering
Management
Organizational StructureOrganizationCustomer Service
Software Engineering MethodologySoftware DevelopmentSoftware Development Environment
Software Quality Assurance (SQA)Project PlanningProject ManagementContract & Requirement ManagementDocument ManagementHuman Management
SPRM Process Category
13
SPRM SPICE CMM BOOTSTRAP ISO 9000
10 0 5726 21 20 2842 30 1 188
23 7 8 01060 29 12 304332 11 0 1411
78 22 18 524545 24 22 161855 11 42 122542 27 16 181417 5 5 6811 4 6 44
444 201 150 177201

Using Cost 151
Wang, Court, Ross, Staples, King, and Dorling (1997b) conducted a technical analysis
and comparison of international software process improvement (SPI) strategies, identifying four
leading models, BOOTSTRAP, ISO 9000, Capability Maturity Model for Software (CMM), and
Software Process Improvement and Capability Determination (SPICE) (see Table 74).
After aggregating the individual requirements for each of the four SPI models,
BOOTSTRAP, ISO 9000, CMM, and SPICE, Wang et al. divided each model’s requirements by
the aggregate number of requirements for each of the 12 SPRM Process Categories. While
individual models performed widely for individual SPRM Process Categories, the average of all
of the SPRM Process Categories for each of the four SPI models was surprisingly similar. SPICE
led the way meeting an average of 16% of the total aggregate requirements for the four models.
BOOTSTRAP came in second place with 13%, ISO 9000 with 11%, and the CMM trailing with
an average of 10% of the overall aggregate requirements. This analysis and comparison differs
from Wang et al. (1997a) in that each of the four SPI models were only compared to each other.
Comparison of BOOTSTRAP, ISO 9000, CMM, and SPICE
Table 74
SPRM Subsystem
Organization
Software Engineering
Management
Organizational StructureOrganization ProcessCustomer Service
Software Engineering ModelingSoftware Development ProcessSoftware Development Environment
Software Quality AssuranceProject PlanningProject ManagementContract & Requirement ManagementDocument ManagementHuman Resource Management
SPRM Process Category SPICECMMBOOTSTRAP ISO 9000
8%1%4%8%20%12%3%7%30%1%12%7%
7%7%1%7%24%11%20%24%12%1%7%9%
23%15%39%35%24%16%14%18%11%31%9%25%28%12%14%8%5%3%5%6%4%5%3%7%
16%10%11%13%

Using Cost 152
Wang, King, Dorling, Patel, Court, Staples, and Ross (1998) conducted a survey of
worldwide software engineering practices, identifying six major process classes (see Table 75).
Worldwide Survey of Software Best Practices
Table 75
Business Process Class Business Process Activity Weight
Development Process Definition
Requirements Analysis
Design
Coding
Module Testing
Integration and System Testing
Document Process ActivitiesIdentify Control Point of ProjectMaintain Consistency across all ProcessesDevelop Software according to Defined Process
Evaluate Software Development MethodologiesModel Software ProcessDescribe Activities and ResponsibilitiesEstablish Task SequencesIdentify Process Relationships
Derive Project Process from Organization StandardApproval Processes and EquipmentIdentify Special Requirements for Special SystemsAnalyze Requirement according to Defined ProcessSpecify Formal RequirementsDefine Requirements Feasibility/TestabilityPrevent Ambiguities in SpecificationInterpret/Clarify RequirementsSpecify Acceptance CriteriaAllocate Requirements for ProcessesAdopt Requirements Acquisition ToolsDesign System according to Defined ProcessDesign Software ArchitectureDesign Module InterfacesDevelop Detailed DesignEstablish Document TraceabilitySpecify Final DesignDefine Design Change ProcedureAdopt Architectural Design ToolsAdopt Module Design ToolsCode according to Defined ProcessChoose proper Programming Language(s)Develop Software ModulesDevelop Unit Verification ProceduresVerify Software ModulesDocument Coding StandardsDefine Coding StylesAdopt Coding-Support/Auto-Generation ToolsTesting according to a Defined ProcessDetermine Test StrategySpecify Test MethodsGenerate TestConduct TestingAdopt Module Testing ToolsIntegration Test according to Defined ProcessAcceptance Test according to Defined ProcessSystem Tests GenerationTest Integrated SystemAdopt Software Integration ToolsAdopt Module Cross-Reference ToolsAdopt System Acceptance Testing Tools
Priority In-Use Effect
3.9 93.8 87.5 78.63.8 94.1 81.3 1004.3 100 87.5 1003.8 81.3 93.3 93.33.7 93.3 92.9 92.93.9 87.5 92.9 86.73.8 93.8 71.4 84.63.6 80.0 57.1 76.94.3 100 78.6 92.94.3 100 72.7 92.93.5 85.7 71.4 76.9
4.1 100 84.6 83.33.0 73.3 53.3 79.63.8 93.3 76.9 75.03.9 93.3 78.6 84.63.7 94.1 68.8 84.63.8 87.5 100 86.73.1 90.9 44.4 87.52.1 28.6 7.7 80.03.9 93.8 78.6 84.64.2 100 100 1004.1 100 81.3 87.53.6 88.2 93.8 76.53.9 88.9 63.6 78.63.8 86.7 64.3 78.64.0 100 53.3 91.72.9 56.3 43.8 80.02.9 62.5 73.3 76.93.8 87.5 68.8 85.73.8 93.8 81.3 92.94.0 93.3 100 92.33.8 93.8 68.8 86.74.1 100 80.0 92.94.1 88.2 82.4 93.33.6 82.4 56.3 66.72.9 60.0 28.6 50.04.5 100 82.4 93.84.4 100 76.5 93.84.1 94.1 76.5 92.93.8 93.8 75.0 84.64.3 100 86.7 85.73.1 71.4 57.1 69.24.3 100 80.0 92.94.1 100 80.0 92.93.8 92.3 69.2 83.34.1 100 84.6 91.72.8 53.8 16.7 63.63.1 76.9 16.7 81.83.1 76.9 25.0 90.9
4.3 100 85.7 93.3

Using Cost 153
The worldwide opinion survey results for each of the 49 individual Business Process
Activities (BPAs) look surprisingly similar. The median weight appears to be about four, on a
scale of one to five, for all 49 BPAs. The median weight for Priority (percentage of organizations
rating the BPA highly significant), In-Use (percentage of organizations that used the BPA), and
Effect (percentage rating the BPA effective) appears to be homogeneously in the 80s. The
Design Software Architecture BPA scored 100s for Priority, In-Use, and Effective, and some
testing BPAs had a surprising abundance of 100s. According to Rico (1999), testing is one of the
least effective verification and validation activities from a quantitative standpoint.
McConnell (1996) performed a qualitative analysis of ten software life cycle models,
pure waterfall, code-and-fix, spiral, modified waterfall, evolutionary prototyping, staged
delivery, evolutionary delivery, design-to-schedule, design-to-tools, and commercial-off-the-
shelf (see Table 76). Works with poorly understood requirements, works with unprecedented
systems, produces highly reliable system, produces system with large growth envelope, manages
risks, can be constrained to a predefined schedule, has low overhead, allows for midcourse
corrections, provides customer with process visibility, provides management with progress
visibility, and requires little manager or developer sophistication, were 11 criteria used.
Construx Comparison of Software Development Life Cycles
Table 76
Software Life Cycle
Pure Waterfall
Code-and-Fix
Spiral
Modified Waterfall
Evolutionary Prototyping
Staged Delivery
Evolutionary Delivery
Design-to-Schedule
Design-to-Tools
Commercial-Off-The-Shelf
Ambiguity
Poor
Poor
Excellent
Fair-Excel
Excellent
Poor
Fair-Excel
Poor-Fair
Fair
Excellent
Innovation
Poor
Poor
Excellent
Fair-Excel
Poor-Fair
Poor
Poor
Poor
Poor-Excel
Poor-Excel
Reliability
Excellent
Poor
Excellent
Excellent
Fair
Excellent
Fair-Excel
Fair
Poor-Excel
Poor-Excel
Growth
Excellent
Poor-Fair
Excellent
Excellent
Excellent
Excellent
Excellent
Fair-Excel
Poor
N/A
High Risk
Poor
Poor
Excellent
Fair
Fair
Fair
Fair
Fair-Excel
Poor-Fair
N/A
Schedule
Fair
Poor
Fair
Fair
Poor
Fair
Fair
Excellent
Excellent
Excellent
Overhead
Excellent
Fair
Excellent
Fair
Fair
Fair
Fair
Fair-Excel
Excellent
Poor
Change
Poor
Poor-Excel
Fair
Fair
Excellent
Poor
Fair-Excel
Poor-Fair
Excellent
Poor
Oversight
Poor
Fair
Excellent
Fair
Excellent
Fair
Excellent
Fair
Excellent
N/A
Manage
Fair
Poor
Excellent
Fair-Excel
Fair
Excellent
Excellent
Excellent
Excellent
N/A
Difficulty
Fair
Excellent
Poor
Poor-Fair
Poor
Fair
Fair
Poor
N/A
Fair

Using Cost 154

Using Cost 155
METHODOLOGY
As stated, the objective of this study involves “Using Cost Benefit Analyses to Develop a
Pluralistic Methodology for Selecting from Multiple Prescriptive Software Process Improvement
(SPI) Strategies.” This Chapter satisfies these objectives by designing, constructing, and
exercising a multi-part methodology consisting of a Defect Removal Model, Cost and Benefit
Data, Return-on-Investment Model, Break Even Point Model, and Costs and Benefits of
Alternatives, which all lead up to a Cost and Benefit Model (as shown in Figure 27).
Costs and benefits of SPI strategies will be evaluated by a variety of interrelated
techniques, starting with the Defect Removal Model. The Defect Removal Model, as explained
later, is a technique for evaluating SPI method effectiveness, and once economic models are
Defect RemovalModel
Cost and BenefitData
Cost and BenefitModel
Costs and Benefitsof Alternative 2
Costs and Benefitsof Alternative 1
Costs and Benefitsof Alternative n
Return-on-InvestmentModel
Figure 27. Methodology for evaluating and selecting costs and benefits.
Break Even PointModel

Using Cost 156
factored in, provides an empirically valid approach for comparing the costs and benefits of SPI
methods. Obviously, existing cost and benefit data for SPI methods selected from the Literature
Survey will be judiciously factored into, and drive, each of the individual analytical models. A
Return-on-Investment (ROI) Model will be designed, based on the Defect Removal Model and
populated by empirical cost and benefit data, in order to arrive at quality, productivity, cost,
break even, and of course, ROI estimates. Eventually, a SPI strategy Cost and Benefit Model will
be constructed from Cost and Benefit Criteria, SPI Strategy Alternatives, and Cost and Benefits
of Alternatives.
The design of the Methodology was significantly influenced by McGibbon’s (1996),
Jones’ (1996 and 1997a), Grady’s (1994 and 1997), and Rico’s (1999) Defect Removal Model-
based comparisons of SPI costs and benefits. An analysis of SPI costs and benefits by Herbsleb,
Carleton, Rozum, Siegel, and Zubrow (1994), perhaps the most common SPI method cost and
benefit study in existence, also served as primary influence for the design of the Methodology.
McGibbon’s (1996) study, however, was the primary influence for two reasons, it is
comprehensive in nature, and it exhibits a uniquely broad range of comparative economic
analyses between SPI methods. In addition, McGibbon’s study stands alone in unlocking
economic analyses associated with the Clean Room Methodology, Software Reuse, and even the
Software Inspection Process. McGibbon’s study goes even further than that, in creating and
establishing a valid empirically-based methodology for using existing cost and benefit data and
analyses, for evaluating and selecting SPI methods. Furthermore, McGibbon’s study implicitly,
perhaps incidentally or accidentally, focuses on “prescriptive” SPI methods, which is the
principal objective of this study.

Using Cost 157
Grady’s (1997) text on SPI strategies also influenced the design and direction of the
Methodology, explicitly identifying the Software Inspection Process as having an overwhelming
impact on bottom line organizational performance (as shown in Figure 13). Thus, Grady’s works
helped justify the creation and significance of the ROI Model, which will be explained in greater
detail later.
Rico’s (1999) Defect Removal Model-based SPI method comparison, however, was the
final influence in selecting and fully designing the Methodology, highlighting the vast economic
advantages that one SPI strategy may have over another. In fact, Rico’s study was the starting
point for implementing the Methodology, which quickly picked up a lot of momentum and took
on an entire life of its own. After only a few minutes of briefly extending Rico’s analyses, the
results proved mesmerizingly phenomenal, and thus the Methodology was conceived. In fact, the
results of the Methodology, and later the Data Analyses, exceeded all expectations. And, just to
imagine that the final results were preliminarily yielded after only a few moments of additional
permutations involving Rico’s study is truly amazing.
Herbsleb’s, Carleton’s, Rozum’s, Siegel’s, and Zubrow’s (1994) study also helped justify
the use of existing empirical data for analyzing and evaluating SPI methods and strategies. In
fact, their study significantly influenced the selection of the Cost and Benefit Criteria.
Herbsleb’s, Carleton’s, Rozum’s, Siegel’s, and Zubrow’s study involved averaging of reported
cost and benefits, much like McGibbon’s (1996), helping justify the use of this technique here.
Kan’s (1995) seminal masterpiece created the final justification, validation, and
foundation of this Defect Removal Model-based Methodology. Kan’s (1991 and 1995) in vivo
(industrial) experiments and applications of the Defect Removal Model were invaluable to
justifying the basis for this Methodology, and providing the confidence to advance this study.

Using Cost 158
Cost and Benefit Criteria
Three cost criteria and five benefit criteria for a total of eight criteria were chosen with
which to evaluate, assess, and analyze SPI alternatives: Training Hours, Training Cost, Effort,
Cycle Time, Productivity, Quality, Return-on-Investment, and Break Even Hours. These criteria
were chosen because of their commonality and availability as exhibited by Table 40,
Reclassification of 487 Metrics for Software Process Improvement (SPI), Figure 11, Citation
Frequency of Metrics for Software Process Improvement (SPI), and Table 57, Survey of
Software Process Improvement (SPI) Costs and Benefits (see Table 77).
Table 39, Survey of Metrics for Software Process Improvement (SPI), showed 74 broad
metric classes and 487 individual software metrics. However, Figure 11, Citation Frequency of
Criteria for Evaluating Software Process Improvement (SPI) Alternatives
Table 77
Criterion Definition
Training hours refer to the number of person-hours of formal classroom instructionapplied for teaching a software process
Training Hours
Training Cost
Effort
Cycle Time
Productivity
Quality
Return-on-Investment
Break Even Hours
Training cost refers to the number of training hours plus training fees and travelexpenses such as air fare, meals, hotels, car rental, and other applicable training costs
Effort refers to development effort--the effort required to design, code, unit test, andsystem test, measured in person-months (Conte, Dunsmore, and Shen, 1986)
Cycle time or duration is defined as the elapsed time in hours or months during whichdevelopment effort proceeds without interruption (Conte, Dunsmore, and Shen, 1986)
Productivity is the number of lines of source code produced per programmer-month(person-month) of effort (Conte, Dunsmore, and Shen, 1986)
Quality or defect density is the number of software defects committed per thousandlines of software source code (Conte, Dunsmore, and Shen, 1986)
Return-on-investment metrics are collected for the purpose of measuring themagnitude of the benefits relative to the costs (Lim, 1998)
Break even hours are defined as the level of activity at which an organization neitherearns a profit nor incurs a loss (Garrison and Noreen, 1997)

Using Cost 159
Metrics for Software Process Improvement (SPI), reclassified the 74 classes of 487 metrics into
11 classes: Productivity (22%), Design (18%), Quality (15%), Effort (14%), Cycle Time (9%),
Size (8%), Cost (6%), Change (4%), Customer (2%), Performance (1%), and Reuse (1%). This
helped influence the selection of the eight criteria for SPI cost/benefit analysis, since later
quantitative analyses will be based on the existence and abundance of software metrics and
measurement data available in published sources.
But, availability is not the only reason these eight criteria were chosen. These eight
criteria were chosen because it is believed that these are the most meaningful indicators of both
software process and software process improvement (SPI) performance, especially, Effort, Cycle
Time, Productivity, Quality, Return-on-Investment, and Break Even Hours. Effort simply refers
to cost, Cycle Time refers to duration, Productivity refers to number of units produced, Quality
refers to number of defects removed, ROI refers to cost saved, and Break Even refers to length of
time to achieve ROI. So, “face validity” is an overriding factor for choosing these criteria,
organizations have chosen these software metrics to collect and report upon, doing exactly that
over the years. Thus, this is the reason these data are so abundantly available.
Quality software measurement data will prove to be a central part of this analysis (and
this thesis, as reported earlier), and the direct basis for a return-on-investment (ROI) model that
will act as the foundation for computing ROI itself. Thus, the Quality criterion is an instrumental
factor, and it is fortunate that SPI literature has so abundantly and clearly reported Quality metric
and measurement data, despite Quality’s controversial and uncommon usage in management and
measurement practice. The SEI reports that approximately 95.7% of software organizations are
below CMM Level 4. CMM Level 4 is where software quality measurement is required. It is safe
to assert that 95.7% of software organizations do not use or collect software quality measures.

Using Cost 160
Training Hours. Training Hours refers to the number of direct classroom hours of formal
training required to instruct and teach software managers and engineers to use a particular SPI
method. Some authors, most notably McGibbon (1996), assert that Training Hours are a
significant factor when considering the choice of SPI methods. For instance, the Personal
Software Process (PSP) requires 80 hours of formal classroom instruction per person, in order to
teach the PSP’s software engineering principles. While, some methods, such as the Software
Inspection Process, are reported to use as little as 12 hours of formal classroom instruction. So,
one might assert that PSP training takes nearly seven times as many resources as the Software
Inspection Process, these numbers will prove to be far less significant. For instance, due to the
efficiency and productivity of using the PSP, the PSP will exhibit an ROI of 143:1 over the
Software Inspection Process. However, while Training Hours were initially thought to be a
significant discriminating factor in choosing SPI methods that doesn’t seem to play out, Training
Hours are no less important. For both small and large organizations on a tight schedule and
budget, Training Hours may still be considered an important issue. This is a fruitful area for
future research, optimal Training Hours for both teaching a SPI method and achieving optimal
process efficiency and effectiveness. One and half days for any SPI method seems too short,
while it has to be questioned whether 80 hours is too much for the fundamental precepts of a
method such as the PSP. Another topic of controversy is whether Training Hours should be
charged to organizational overhead (that is, profits) or to project time. Conventional wisdom
holds that Training Hours would negatively impact schedule. Later analysis will challenge these
notions indicating that it is possible to directly incur Training Hours and still show a significant
ROI over the absence of the SPI method. This is also a fruitful area for future research.

Using Cost 161
Training Cost. Training Cost is the conversion of Training Hours into monetary units,
principally fully-burdened person-hours (base rate of pay plus benefits and corporate profits), in
addition to ancillary costs such as air fare, transportation, hotels, meals, per diem, training
charges, materials, consultant costs, and other fees. This becomes especially significant when the
SPI method is of a uniquely proprietary nature, such as SEI CMM, Authorized Lead Evaluator
(Software Capability Evaluation—SCE), Authorized Lead Assessor (CMM-Based Assessment
for Internal Process Improvement—CBA-IPI), Authorized PSP Instructor, and even basic PSP
Training. Each of the training courses mentioned are closely guarded trademarked SPI methods
of the SEI (of which Training Cost over Training Hours comes at a high price). McGibbon
(1996) didn’t mention Training Cost as defined here, in his SPI cost/benefit analysis of Software
Reuse, Clean Room Methodology, and the Software Inspection Process. Again, later analysis
will show that Training Costs are seemingly dwarfed by the ROI of using particular SPI
methods. However, PSP, SCE, and CBA-IPI costs of 15 to 25 thousand dollars per person (not
including labor costs) appears daunting at first and may cause many not to consider the use of
these seemingly premium-priced SPI methods. However, as mentioned earlier, carefully planned
and managed Training Costs, may still prove to have a positive ROI, even when directly charged
to a project.
Effort. Effort refers to the number of person-hours required in order to use a SPI method
when constructing (planning, managing, analyzing, designing, coding, and testing) a software-
based product. Effort translates directly into cost, which is by far the single most influential
factor when choosing a SPI method (or at least it should be). Effort establishes a basis for
measuring cost, time, effectiveness, efficiency, ROI, and acts a basis for comparative analyses.
Unfortunately, Effort is a software metric, and software organizations don’t usually apply

Using Cost 162
software metrics (less than 95.7% according to the SEI). What this means is that organizations
don’t usually track the costs of individual activities, and rarely track macro-level costs, such as
overall project cost. It’s not unusual for organizations to spend large amounts of overhead before
projects begin, engage in projects without firmly defined beginning and end-points, and then
continue spending money on projects well after their formal termination. In other words, it is
quite rare for an organization to firmly assert the cost of even a single project, much less a single
process, activity, or SPI method. Once again, it’s not unusual for organizations to spend
hundreds or even thousands of uncounted person-hours, and then re-plan or redirect without the
slightest concern for person-hours spent-to-date. (These numbers may range into the hundreds of
thousands or even millions untracked and unaccounted-for person-hours in monolithic programs
and projects, especially in defense and aerospace.) For the purposes of this study and analysis,
relatively concise effort is asserted, used, and analyzed, especially for the PSP, Software
Inspection Process, Clean Room Methodology, and Software Test. Very authoritative studies
were used to quantify the costs of Software Reuse and the Defect Prevention Process. The costs
associated with ISO 9000 were also confidently authoritative, while the SEI’s CMM costs were
the least rigorously understood, yet very well analyzed by Herbsleb, Carleton, Rozum, Siegel,
and Zubrow (1994). In other industries, such as microprocessor design and development, process
improvement costs are primarily in the form of research and development and in capital
investments, overseas expansion, real estate, facilities, state-of-the-art equipment, and long-term
process calibration (Garrison and Noreen, 1997). While, each of the SPI methods examined in
this study were 100% human intensive (not involving expenditures in capital investments).
Cycle Time. According to Garrison and Noreen (1997), Cycle Time is “The time required
to make a completed unit of product starting with raw materials.” In simple terms, Cycle Time is

Using Cost 163
the length or duration of a software project constrained by a finite beginning and ending date,
measured in person-hours, person-days, or person-months. Cycle Time answers the question,
“How long does it take?” Cycle Time and Effort are not the same. For instance, whether a
software product takes eight person-hours or twelve person-hours over the course of a single 24-
hour period such as a business day, the Cycle Time is still a single day. For example, eight
people can work eight hours each on a Monday jointly producing a software product. While, 64
person-hours or eight person-days were consumed, the Cycle Time is a single day. When time-
to-market is a concern, or just plainly meeting a software project schedule, Cycle Time is an
extremely important factor in addition to Effort. Measuring Cycle Time, or Cycle Time
reduction, becomes an important aspect of measuring the use of a particular SPI method. Cycle
Time is especially important in producing software products before competitors, or fully
realizing the revenue potential of existing products. For instance, being the first-to-market and
extending market presence as long as possible before competitive market entrance allows for
maximization of revenue. In addition, releasing a new product before existing products reach full
revenue potential prematurely interrupts the revenue potential of existing products. Most
organizations rarely have the maturity to concisely control revenue potential and would be
satisfied to manage Cycle Time predictability. Only extremely rare organizations have the
management discipline and maturity to plan and manage a continuous stream of products over
extended periods of time based on Cycle Time measurements.
Productivity. According to Conte, Dunsmore, and Shen (1986), “Productivity is the
number of lines of source code produced per programmer-month (person-month) of effort.”
Humphrey (1995) similarly states, “Productivity is generally measured as the labor hours
required to do a unit of work.” Humphrey goes on to state, “When calculating Productivity, you

Using Cost 164
divide the amount of product produced by the hours you spent.” Therefore, Productivity is a
measure of how many products and services are rendered (per unit of time). Productivity is a
useful measure of the efficiency or inefficiency of a software process. So, Productivity is a
naturally useful measure for SPI. Productivity can be a measure of the number of final or
intermediate products. For instance, Productivity may be measured as the number of final
software products such as word processors per unit of time (typically every one or two years).
Or, Productivity may be measured as the number of intermediate software work products.
Software Productivity has historically taken on this latter form of measurement, intermediate
software work products. The intermediate software work product most commonly measured is
source lines of code (SLOC) per person month. Thus, this is the most commonly available
software productivity data measured, collected, and available in published literature.
Unfortunately, SLOC isn’t the only intermediate software work product available for software
Productivity measurement. Other common intermediate software work products available for
counting are requirements, specifications, design elements, designs, tests, and software
management artifacts such as project plans, schedules, estimates, and work breakdown
structures. Software Productivity measurement is a highly controversial and much maligned
discipline. First, is a misunderstanding of what is being represented by typical software
Productivity measurements, SLOC per person-month. This metric can typically be measured in
the following way, divide the total number of SLOC produced as part of a final software product
by total Effort (previously discussed). This yields normalized productivity for a given software
product. This is the source of common confusion surrounding software Productivity
measurement. Many consider this measurement (SLOC/Effort) to be useful only for measuring
the programming phase of development, and a grossly insufficient measure of overall software

Using Cost 165
life cycle Productivity measurement (arguing that SLOC/Effort is not applicable to measuring
analysis, design, or testing Productivity). Nothing could be further from the truth. SLOC/Effort is
a simple but powerful measure of overall software life cycle Productivity measurement in its
normalized form. This doesn’t mean that measuring productivity in other terms isn’t as equally
useful or powerful. For example, number of requirements produced per analysis phase hour
would be an exemplary software Productivity measure. This however, doesn’t discount the
usefulness of SLOC/Effort as a powerful software Productivity measure in any way, shape, or
form. While, software life cycle-normalized software Productivity measurements using SLOC
are commonly misunderstood, there’s another controversy surrounding software Productivity
measurement associated with SLOC. Jones (1998) argues that SLOC is a poor measure to be
used as a basis for software Productivity measurements because of the difficulty in generalizing
organizational software Productivity measurements using SLOC. There are many programming
languages of varying levels of power, usability, abstraction, and difficulty. What might take one
SLOC in Structured Query Language (SQL) may take 27 SLOCs of Assembly. This may lead
some to believe that SQL is low-productivity language because it results in fewer SLOC, while
in fact is it may actually result in higher Productivity. There are two basic problems with Jones’
arguments. The first is that it doesn’t take the same Effort and cost to analyze, design, code, test,
and maintain one line of SQL as it does 27 lines of Assembly. If it did (and it doesn’t), it would
be 27 times more productive to program in Assembly than SQL. In fact, we know this to be the
exact opposite. According to Jones’ own data, it is 27 times more productive to program in SQL
than Assembly. An ancillary problem, but nevertheless more important, is Jones’ insistence on
generalizing software Productivity measurement data across organizations. Statistical process
control (SPC) theory (Burr and Owen, 1996) asserts that even if two organizations used the same

Using Cost 166
programming language or even the identical software Productivity measurement strategy (even
Jones’ non-SLOC based software Productivity measurement methodology—Function Points),
mixing software Productivity data between disparate organizations is not a useful strategy. In
other words, SPC tells us that software Productivity of one organization does not imply software
Productivity of another because of the differences in process capability (even with extremely
stable and automated-intensive processes). This fails to even mention the gross structural
inadequacy of the Function Points method itself (Humphrey, 1995).
Quality. Quality, as defined and measured here, will take the common form of Defect
Density. According to Conte, Dunsmore, and Shen (1986), “Defect Density is the number of
software defects committed per thousand lines of software source code.” Once again, Defect
Density is a simple but extremely powerful method, for not only measuring Quality, but also
efficiently managing software projects themselves. Defect Density, like Productivity, commonly
takes the software life cycle-normalized form of total number of defects found in all life cycle
artifacts divided by the total number of SLOC. Like Productivity, many consider Defect Density
metrics to be of overall limited usefulness to the software life cycle, being only applicable to
programming phases of software product development (ignoring planning, analysis, design, test,
and maintenance). However, Kan (1995) and Humphrey (1995) have convincingly demonstrated
that Defect Density, in its software life cycle-normalized form, is a highly strategic, single point
metric upon which to focus all software life cycle activity for both software development and
SPI. While, Kan’s seminal masterpiece gives a much greater scholarly portrait of sophisticated
metrics and models for software quality engineering, Humphrey breaks Defect Density down
into its most practical terms, Appraisal to Failure Ratio. Humphrey has demonstrated that an
optimal Appraisal to Failure Ratio of 2:1 must be achieved in order to manage software

Using Cost 167
development to the peak of efficiency. While, Kan encourages the use of Rayleigh equations to
model defect removal curves, Humphrey presents us with the practical saw-tooth form, two parts
defects removed before test and one part during test, resulting in very near zero defect levels in
finished software products. Since, defects found in test cost 10 times more than defects found
before test, and 100 times more after release to customers, Humphrey has found that finding 67%
of defects before test leads to optimal process performance, minimal process cost, and optimal
final software product quality. The other common argument against the use of Defect Density
metrics is that they seem to rather limited in scope, ignoring other more encompassing software
life cycle measurements. Again, Humphrey’s Defect Density Metrics Appraisal to Failure Ratio-
based methodology has proven that metrics need not be inundating, overwhelming, all
encompassing, and sophisticated. People seem to insist on needless sophistication in lieu of
powerful simplicity. Probably the more prevalent objection to the use of Defect Density Metrics
seems to be an intuitive objection to the notion that Quality cannot be adequately represented by
Defect Density. Quality, rather intuitively, takes the form market success, popularity, usefulness,
good appearance, price, market share, good reputation, good reviews, and more importantly
innovation. Defect Density doesn’t capture any of the aforementioned characteristics. In fact,
defect-prone products have been known to exhibit the intuitive characteristics of high product
quality, and software Products with exemplary Defect Densities have been considered of utterly
low quality. This is merely a common confusion between product desirability and Quality.
Customer satisfaction and market share measurement is a better form of measuring product
desirability while Defect Density is an excellent form of measuring software Quality. Kan gives
an excellent exposition of over 35 software metrics for measuring many aspects of software

Using Cost 168
Quality, including customer satisfaction measurement, while reinforcing the strategic nature of
Defect Density metrics for measuring software quality associated with SPI.
Return-on-Investment. According to Lim (1998), “Return-on-Investment metrics are
collected for the purpose of measuring the magnitude of the benefits relative to the costs.”
According to Herbsleb, Carleton, Rozum, Siegel, and Zubrow (1994) and Garrison and Noreen
(1997), there seems to be wide disparity in the definition, meaning, application, and usefulness of
Return-on-Investment (ROI). Herbsleb, Carleton, Rozum, Siegel, and Zubrow claim that
Business Value (value returned on each dollar invested) is actually be measured, and not ROI
itself. Garrison and Noreen define ROI as Margin (Net Operating Income/Sales) multiplied by
Turnover (Sales/Average Operating Assets)—or rather a ratio of sales (or revenue) to operating
expenses (or process costs). All three definitions have more commonality than differences,
primarily, a ratio of revenue to expenses. If the revenue of employing a particular SPI method
exceeds the cost of implementing the SPI method, then a positive ROI has been yielded. For
example, if a 10,000 SLOC software product requires 83.84 person years (174,378 staff hours)
using conventional methods, but only 400 person hours of Effort using the Personal Software
Process (PSP), then PSP’s ROI is determined to be (174, 378 – 400) divided by 400, or a
whopping 435:1. ROI is not all that difficult, convoluted, or meaningless as Herbsleb, Carleton,
Rozum, Siegel, and Zubrow, and Garrison and Noreen seem to assert. The next question
becomes “at what point will the ROI be achieved?”
Break Even Hours. According to Garrison and Noreen (1997), break even point is
defined as “the level of activity at which an organization neither earns a profit nor incurs a loss.”
Reinertsen (1997) similarly defines break even point as “the time from the first dollar spent until
the development investment has been recovered.” Garrison and Noreen present the equation of

Using Cost 169
total fixed expenses divided by selling price per unit, less variable expenses per unit, resulting in
the number of break even units. So, the break even point is when the total sales intersect the total
expenses, according to Garrison and Noreen. Garrison’s and Noreen’s rendition of break even
point is time-independent. In other words, Garrison’s and Noreen’s formulas indicate at what
sales volume a break even point will be achieved, but make no assertion as to what point in
“time” the sales volume will be achieved (since sales volume is determined by unpredictable
market forces). However, for the purposes of this study, the break even point will be referred to
as Break Even Hours and fully tied to time. Break Even Hours in software development may be
computed a number of ways. Break Even Hours may be computed as the total cost of
implementing a new SPI method. Break even point analysis in this study yielded some
interesting results. Because, SPI method investment costs in Training Hours and Training Costs
represent such small fractions of total lifecycle costs, and sometimes large gains in Productivity,
SPI break even points are surprisingly measured in hours or programming a few SLOC. On the
other hand, break even analysis in traditional manufacturing industries usually involves the cost-
justification of large capital investments in real estate, building construction, and equipment
modernization (Garrison and Noreen, 1997). Therefore, process improvement in traditional
industries generally involves capital investments measured in thousands and even millions of
dollars. Break even analysis is imperative when large economies of scale are traditionally
involved. However, SPI methods are typically measured in dozens and sometimes a few hundred
hours, compared to total life cycle costs measuring in the hundreds of thousands of hours. So for
a good SPI method, break even points must be searched for in micro-scales involving hours,
versus months, years, and even decades. SPI method break even analysis surprisingly challenges
many conventional myths, holding that SPI takes years and decades to yield beneficial results.

Using Cost 170
Alternative Strategies
Eight SPI alternatives were chosen with which to evaluate, assess, and analyze cost and
benefit data, the Personal Software Process (PSP), Clean Room Methodology, Software Reuse,
Defect Prevention Process, Software Inspection Process, Software Test Process, Capability
Maturity Model, and ISO 9000 (see Table 78).
Six of the SPI alternatives are vertical or prescriptive SPI methods offering relatively
concise step-by-step guidance, Personal Software Process (PSP), Clean Room Methodology,
Software Reuse, Defect Prevention Process, Software Inspection Process, and Software Test
Process. Two of the SPI alternatives are indefinite or descriptive SPI methods that offer high-
level strategic and non-prescriptive guidance, Capability Maturity Model (CMM) and ISO 9000.
Three of the SPI alternatives are vertical life cycle methods offering complete, end-to-end
processes or methodologies for building software products, Personal Software Process (PSP),
Clean Room Methodology, and Software Reuse. Three of the SPI alternatives are verfical
Alternatives for Evaluating Costs and Benefits
Table 78
Alternative Type
Personal Software Process
Clean Room Methodology
Software Reuse
Defect Prevention Process
Software Inspection Process
Software Test Process
Capability Maturity Model
ISO 9000
Product Appraisal
Formal Method
Design Method
Preventative
Product Appraisal
Product Appraisal
SPI Model
Quality Standard
Class
Vertical Life Cycle
Vertical Life Cycle
Vertical Process
Vertical Process
Vertical Process
Vertical Process
Indefinite
Indefinite
Typically Reported Data
Cost, Productivity, Quality
Cost, Quality, ROI
Cost, Productivity, Quality
Cost, Quality, ROI
Cost, Productivity, Quality, ROI
Cost, Quality
Cycle Time, Productivity, Quality
Cost, Productivity, Quality

Using Cost 171
process methods offering only partial software life cycle support (usually product appraisal or
validation), Defect Prevention Process, Software Inspection Process, and Software Test Process.
All eight of the SPI alternatives were chosen for a number of reasons, maturity, completeness,
acceptability, and most especially an abundance of quantitative cost and benefit data. However, it
wasn’t just the availability of abundant cost and benefit data that drove their selection, but also
the magnitude of the cost and benefit data (e.g., low implementation cost and high quality
benefit). The reason that the Capability Maturity Model (CMM) and ISO 9000 were chosen is
because one is a de facto international standard and the other a certified international standard for
SPI and SPI-related activity (e.g., software quality management). The Literature Survey proved
instrumental in the identification and selection of these eight SPI alternatives for cost and benefit
analyses, particularly in the case of the Clean Room Methodology and Software Reuse, because
of their reportedly impressive costs and benefits. The Literature Survey also surfaced other SPI
alternatives, but failed to justify their continued analyses because of the lack of reported cost and
benefit data, most notably, Orthogonal Defect Classification (ODC), Product Line Management
(PLM), and Software Process Improvement and Capability dEtermination (SPICE). Ironically,
each of the eight SPI alternatives are principally aimed at improving quality, and may rightly be
classified as software quality methodologies, with the one possible exception of Software Reuse,
which is principally a design or a compositional method. Orthogonal Defect Classification
(ODC) is a very promising software quality methodology that should not be overlooked in future
analyses, nor should Product Line Management (PLM), which is a software design management
methodology. It is reasonably safe to assert that no other SPI method exists with reported costs
and benefits as impressive as the ones selected and examined here. While, broad and impressive
studies do exist (McConnell, 1996), very little cost and benefit data is available to justify them.

Using Cost 172
Personal Software Process (PSP). The PSP is a relatively new software development life
cycle, and software quality methodology (Humphrey, 1995). The PSP consists of five main
software life cycle phases, Planning, High-Level Design, High-Level Design Review,
Development, and Postmortem. The PSP is characterized by deliberate project planning and
management, quantitative resource estimation and tracking, quality planning and management,
highly structured individual reviews of software work products, and frequent software process
and product measurements. Johnson and Disney (1998) report that the PSP requires at least “12
separate paper forms, including a project plan summary, time recording log, process
improvement proposal, size estimation template, time estimation template, object categories
worksheet, test report template, task planning template, schedule planning template, design
checklist, and code checklist.” Johnson and Disney go on to state that a single PSP project results
in 500 individual software measurements, and that a small group of PSP projects easily results in
tens of thousands of software measurements. The PSP is a highly prescriptive, step-by-step,
measurement-intensive software process for developing software with the explicit goal of
improving software process performance, achieving SPI, and resulting in measurably high
quality software products. The PSP has emerged in an age and backdrop of qualitative,
ambiguous, and highly undefined software development standards, life cycles, processes, and
methodologies. The PSP is small, efficient, tangibly examinable, and yields an abundance of data
for SPI research and analysis. Despite the newness of the PSP, and its popular but incorrect
reputation as an academic classroom software methodology, the PSP has yielded a phenomenally
large amount of examinable data for research and analysis. And, surprisingly still, despite the
PSP’s growing reputation as an overly bureaucratic software methodology (Johnson and Disney,
1998), the PSP is the smallest and most efficient SPI method ever recorded, yielding the highest
Using Cost 173
recorded ROI and productivity for any SPI method known to the industry. Since the PSP was
primarily conceived as a SPI method, the PSP is very inexpensive to operate, the PSP results in
measurably high quality and productivity, and the PSP produces an abundance of measurement
data, the PSP becomes a natural candidate for analysis and comparison in this study. Ironically,
despite the PSP’s newness, there was more PSP data available for examination and analysis than
from any other SPI method examined by this study.
Clean Room Methodology. The Clean Room Methodology, like the PSP, is a software
development lifecycle and software quality methodology (Pressman, 1997; Kaplan, Clark, and
Tang, 1995). Clean Room consists of seven main software life cycle phases, Function
Specification, Usage Specification, Incremental Development Plan, Formal Design and
Correctness Specification, Random Test Case Generation, Statistical Testing, and Reliability
Certification Model, according to Kaplan, Clark, and Tang. Another variation presented by
Kaplan, Clark, and Tang, defines Clean Room software life cycle phases as, Define Box
Structures, Define Stimuli and Responses, Define State Boxes, Define Clear Boxes, Plan
Statistical Reliability Certification, Define Usage Specification, Create Incremental Development
Plan, and Develop Verifiable Designs. Pressman defines Clean Room as an eight phase software
life cycle consisting of, Requirements Gathering, Statistical Test Planning, Box Structure
Specification, Formal Design, Correctness Verification, Code Generation, Inspection, and
Verification, Statistical Usage Testing, and Certification. Clean Room is characterized by
rigorous requirements analysis, incremental development, formal specification and design,
deliberate test planning, formal verification, rigorous testing, and testing-based reliability growth
modeling. Clean Room is also somewhat prescriptive, with the explicit goal of improving
software quality and resulting in measurably high quality software products. Unlike the PSP,

Using Cost 174
however, Clean Room wasn’t targeted at SPI and places little emphasis on process definition,
performance, and measurement. The bottom line is that Clean Room is a formal methods-based
methodology making use of basic mathematical proofs and verification. Clean Room has the
explicit goal of reducing the number of software defects committed, reducing reliance on the
Software Inspection Process and Testing, and measurably increasing software quality levels
beyond those achievable by the Software Inspection Process. Clean Room was chosen because of
an abundance of software quality measurement data available as a result of using this
methodology. Clean Room was also chosen for examination because of a recent study of this
methodology by McGibbon (1996), exhibiting the costs and benefits of using Clean Room, and
comparing it to other candidate SPI methods chosen for examination in this study, most notably,
the Software Inspection Process and Software Reuse. Ironically, other than McGibbon’s study,
very little is known about the mechanics of Clean Room, despite the existence of several books
devoted exclusively to Clean Room. In addition, these books tend to vaguely define Clean
Room, don’t seem to provide a coherent project planning and management framework, such as
that explicitly provided by the PSP, and provide very little cost and benefit data, being woefully
short of reported Clean Room measurements. Perhaps, that’s because Clean Room is more of a
technical, versus management, based methodology that relies on introducing the use of basic
formal specification and verification techniques, and a loosely associated post-process
measurement framework only reporting one measurement, software quality (in terms of Defect
Density). Clean Room suffers from an unshakable reputation as being overly difficult, because it
employs formal methods, and vaguely applicable to modern information technologies and
application domains (particularly business, database, and data warehousing domains). In addition
to the high cost of implementation and perception as being overly difficult to apply, Clean Room

Using Cost 175
offers little evidence that it results in quality levels beyond those of much maligned product
appraisal techniques, such as the Software Inspection Process. However, one surprising element
of Clean Room revealed by McGibbon, was that Clean Room (as a formal method), results in
smaller software source code sizes. Smaller software sizes naturally imply fewer opportunities to
commit software defects, and subsequently, longer-term efficiencies in software maintenance
productivity. As mentioned before, this study views McGibbon’s analysis as the Rosetta stone or
key to unlocking the secrets of Clean Room for examination and comparative analysis as a
candidate SPI method.
Software Reuse. According to Poulin (1997), Software Reuse is defined as “the use of
existing components of source code to develop a new software program, or application.” Lim
(1998) states that, “reuse is the use of existing assets in the development of other software with
the goal of improving productivity, quality, and other factors (e.g., usability).” Both, Poulin and
Lim explain that Software Reuse exploits an allegedly simple axiom, build and pay for software
source code once, and reuse it many times. Software Reuse attempts to do for the software
industry what the industrial revolution, interchangeable parts, and integrated circuits have done
for 20th century manufacturing and even the more recent phenomenon of the high technology
electronics industry. The fundamental notion behind Software Reuse is to reduce Cycle Time,
reduce Effort, increase Productivity, increase Return on Investment, increase Quality, and enable
predictable software process performance by building and validating software source code once,
and reusing it many times (with much greater ease). Unfortunately, Software Reuse is just that, a
notion. Software Reuse is not characterized by a precisely defined software life cycle or process,
such as those exhibited by the PSP, Clean Room, Software Inspection Process, or even Testing.
According to Lim, Software Reuse consists of four main phases, Managing the Reuse

Using Cost 176
Infrastructure, Producing Reusable Assets, Brokering Reusable Assets, and Consuming Reusable
Assets (see Table 11). Software Reuse consists of five main phases, Characterize, Collect Data,
Analyze Data, Taxonomy, and Evaluate (see Table 10), according to Schafer, Prieto-diaz, and
Matsumoto (1994). Despite Software Reuse’s lack of a standard life cycle or methodology,
Software Reuse is still considered a prescriptive SPI method, because it is characterized by a
pointedly specific tactical element, “reuse software source code.” Even more so than Clean
Room, Software Reuse places little emphasis on process definition, performance, and
measurement. Software Reuse was also chosen because of an abundance of economic analyses,
Productivity, Quality, Cycle Time, and other software measurement data as a result of using
Software Reuse. Like Clean Room, Software Reuse tends to be more of a technical, versus
management, based methodology. Software Reuse had a tremendous amount of momentum and
popularity throughout the 1980s and early 1990s, riding the coat-tails of the object oriented
analysis, design, and programming movement, manifesting themselves in third generation
programming languages such as Ada and C++. Software Reuse was even considered by a few
management scientists, most notably Cusumano (1991), Poulin, and Lim, to be the single most
strategic SPI method. However, Software Reuse seems to have fallen victim to a few
insurmountable maladies, it’s reputation as a technical approach, lack of compelling economic
analyses, lack of firmly defined processes, inability to motivate the actual reuse of software
source code, and the sheer difficulty of managing third generation computer programming
languages. And, once again, this study views Lim’s, Poulin’s, and McGibbon’s books, studies,
and economic analyses as the Rosetta stones to deciphering the costs and benefits of Software
Reuse. And, it is their abundant economic analyses that led to the selection of Software Reuse for
comparative analyses against other SPI methods, as discovered by the Literature Survey.

Using Cost 177
Defect Prevention Process. The Defect Prevention Process “is the process of improving
quality and productivity by preventing the injection of defects into a product,” according to
Mays, Jones, Holloway, and Studinski (1990). According to Humphrey (1989), “the fundamental
objective of software defect prevention is to make sure that errors, once identified and addressed,
do not occur again.” Gilb and Graham (1993) state that “the Defect Prevention Process is a set of
practices that are integrated with the development process to reduce the number of errors
developers actually make.” Paulk, Weber, Curtis, and Chrissis (1996) of the Software
Engineering Institute (SEI) formally assert that “the purpose of Defect Prevention is to identify
the cause of defects and prevent them from recurring.” Latino and Latino (1999) define Root
Cause Failure Analysis (RCFA), which is similar to Defect Prevention, as “a technique for
uncovering the cause of a failure by deductive reasoning down to the physical and human root(s),
and then using inductive reasoning to uncover the much broader latent or organizational root(s).”
Like Software Reuse, Defect Prevention is not characterized by a standard software life cycle or
process, such as those exhibited by the PSP, Clean Room, Software Inspection Process, and
Testing. However, the Defect Prevention Process defined by Jones (1985) serves as a commonly
accepted de facto standard, primarily consisting of five sub-processes, Stage Kickoff Meeting,
Causal Analysis Meeting, Action Database, Action Team, and Repository. Defect Prevention is
characterized by software defect data collection, defect classification, defect tracking, root-cause
analysis, implementation of preventative actions, and most notably in-process education of
commonly committed software defects. Defect Prevention is highly prescriptive, with the
explicit goal of increasing software quality and reliability, and directly results in such. Defect
Prevention is a classical SPI method that like Clean Room, has the explicit goal of reducing the
number of software defects committed, reducing reliance on the Software Inspection Process and
Using Cost 178
Testing. Defect Prevention relies heavily on rigorously collected and highly structured software
defect data that is collected by less than 95% of all software organizations (Software Engineering
Institute, 1999), and thus is the weakness of this approach. Conventional wisdom still holds that
software defect data isn’t representative of software quality in any way, shape, or form, and is
commonly and intuitively believed not to be a strategic part of software development and SPI
(Lauesen and Younessi, 1998; Binder, 1997). If software defect data collection is meaningless,
as popularly held (Lauesen and Younessi; Binder), then the strategic justification for the PSP,
Clean Room, Defect Prevention, Software Inspection Process, and Testing has been removed
completely. It is the fundamental premise of this study that software defect data is the
cornerstone of the software engineering and SPI disciplines (Kan, 1995; Smith, 1993), thus
elevating the importance of Defect Prevention to that of a critically strategic SPI method. These
are the reasons that Defect Prevention was chosen for examination and comparative analyses.
Because, defect data is strategic (Kan; Smith), Defect Prevention is strategic (Mays, Jones,
Holloway, and Studinski; Kan; Humphrey; Gilb; Latino and Latino), Defect Prevention is well
defined (Mays, Jones, Holloway, and Studinski), and there is a good amount of data available
(Mays, Jones, Holloway, and Studinski; Gilb; Latino and Latino).
Software Inspection Process. The Software Inspection Process is an early, in-process
product appraisal activity, and is an instrumental component of contemporary software quality
methodologies (Fagan, 1976). Inspections consist of six main sub-processes, Planning,
Overview, Preparation, Inspection, Rework, and Followup. Inspections are characterized by
highly structured team reviews by qualified peers, software defect identification, and software
quality estimation based on discovered software defects. More importantly, Inspections are
characterized by concisely defined, repeatable, and measurable processes, ushering in

Using Cost 179
sm Team Software Process and TSP are a service marks of Carnegie Mellon University.
blockbuster ideas like the Software Engineering Institute’s (SEI’s) Capability Maturity Model
for Software (Radice, Harding, Munnis, and Phillips, 1985; Radice, Roth, O’Hara, Jr., and
Ciarfella, 1985). Inspections may be considered the cornerstone of modern quantitative software
quality engineering methodologies (Kan, 1995; Humphrey, 1989, 1995, and 2000), such as
Defect Prevention, CMM, software life cycle reliability modeling, software quality modeling,
PSP, and the Team Software Processsm (TSPsm). Inspections are also characterized by software
process metrics and measurements, and may yield more than 30 process and product software
measurements per Inspection. A small product of 10,000 source lines of code may require 42
individual inspections, and may result in up to 1,260 individual software measurements. One
organization performed 5,000 Inspections in three years, potentially yielding 150,000 individual
software measurements (Weller, 1993). Like the PSP, or should it be said that the PSP is like
Inspection, Inspection is a highly prescriptive, step-by-step, measurement-intensive software
process for validating software with the explicit goal of improving software process
performance, achieving SPI, and resulting in measurably high quality software products. While
Inspections are even better defined and prescriptive than the PSP, Inspections only cover one
aspect of software development, validation. Whereas, the PSP is an entire software life cycle that
contains its own validation technique (Humphrey, 2000), though the TSP (Humphrey), a group
form of the PSP, does use Inspections and not the individual validation review employed by the
PSP (Humphrey). Inspections were selected for examination and comparative analysis because
of the abundance of literature on Inspections, in both journals and textbooks, the abundance of
reported and validated costs and benefits, and ability to develop ROI models and analyses based
on Inspections, because of its precise characterization and measurability. In fact, several key
studies motivated the selection of Inspections for comparative analyses, McGibbon (1996),

Using Cost 180
Grady (1997), Weller (1993), Russell (1989), and Rico (1996a and 1996b). McGibbon
performed comparative analyses of Inspections, Clean Room, and Software Reuse, showing that
Inspections exhibit an ROI beyond that of any known SPI method to him. Inspections were a
cornerstone SPI method to Grady’s landmark study and comparison of SPI methods, reporting
that the use of Inspections have saved Hewlett Packard over $400 million. Weller and Russell
demonstrated that Inspections are extremely quantitative and effective, each responsible for
helping change the image of Inspections from a qualitative Walkthrough-style technique to its
real quantitative characterization. Rico (1993, 1996, and 1999) showed how simple it is to
examine the costs and benefits of Inspections, because of their measurability. Still, Inspections,
like Clean Room and the PSP, have an unshakable reputation as being overly bureaucratic, too
expensive, and too difficult to learn, with only marginal benefits. Russell, Weller, McGibbon,
Grady, Humphrey, and Rico begin to show for the first time in three decades that these
misperceptions are exactly that, untrue.
Software Test Process. The Software Test Process is a late, post-process product
appraisal activity, that is commonly misperceived to be software quality assurance, verification
and validation, and independent verification and validation (Rico, 1999). According to IEEE (Std
1012-1986; Std 1059-1993), the Software Test Process consists of eight main sub-processes, Test
Plan Generation, Test Design Generation, Test Case Generation, Test Procedure Generation,
Component Testing, Integration Testing, System Testing, and Acceptance Testing. According to
IEEE (J-Std 016-1995), the Software Test process consists of seven main sub-processes, Test
Planning, Test Environment Preparation, Unit Testing, Unit Integration Testing, Item
Qualification Testing, Item Integration Testing, and System Qualification Testing. According to
IEEE (Std 12207.0-1996), the Software Test process consists of six main sub-processes,

Using Cost 181
Qualification Test Planning, Integration Test Planning, Unit Test Planning, Unit Testing,
Integration Testing, and Qualification Testing. Testing is characterized by dynamic execution of
software upon code and implementation based on predefined test procedures, usually by an
independent test group other than the original programmer. According to Pressman (1997) and
Sommerville (1997), Testing is also characterized by a variety of dynamic white box (e.g., basis
path and control structure) and black box (e.g., specification, interface, and operational) Testing
techniques. Blackburn’s (1998) Testing approach is based on the theory that among the myriad
of Testing techniques, boundary analysis is the most fruitful area for finding defects, and goes on
to assert a direct correlation between the absence of boundary analysis defects and the overall
absence of software product defects. Testing can be prescriptive, with a somewhat misguided,
but honorable, goal of improving software quality. Testing is somewhat misguided for several
important reasons, Testing doesn’t involve estimating defect populations, little time is devoted to
Testing, and Testing is usually conducted in an ad hoc and unstructured fashion, which all
contribute to passing an inordinately large latent defect population right into customer hands
(Rico, 1999). However, there seems to be some controversy as to the strategic importance of
Testing, as Lauesen and Younessi (1998) claim that 55% of defects can only be found by
Testing, while Weller (1993) and Kan (1995) assert that better than 98% of defects can be found
before Testing begins. And, of course, Lauesen and Younessi go on to assert the popular notion
that software defect levels don’t represent ultimate customer requirements, while Kan firmly
shows a strong correlation between defect levels and customer satisfaction. Testing was chosen
because there is an abundance of literature exhibiting the costs and benefits of Testing, primarily
when Testing is being compared to the Software Inspection Process. Testing was also chosen
because interest in Testing-based process improvement is growing at a rapid pace (Burnstein,
Using Cost 182
Suwannasart, and Carlson, 1996a and 1996b; Burnstein, Homyen, Grom, and Carlson, 1998).
Thus, it now becomes imperative to examine various SPI methods, quantify their individual costs
and benefits, and direct SPI resources to important areas yielding optimal ROI. Ironically, highly
structured Testing is practiced by very few organizations, perhaps less than 95% (Software
Engineering Institute, 1999). So, perhaps, Testing-based process improvement isn’t such a bad
strategy, given that there is a substantial ROI for good Testing (as long as it is realized that there
are superior SPI methods to Testing).
Capability Maturity Model for Software (CMM). The CMM is a software process
improvement framework or reference model that emphasizes software quality (Paulk, Weber,
Curtis, and Chrissis, 1995). The CMM is a framework of SPI criteria or requirements organized
by the following structural decomposition, Maturity Levels, Key Process Areas, Common
Features, and Key Practices (Paulk, Weber, Curtis, and Chrissis). There are five Maturity Levels,
Initial, Repeatable, Defined, Managed, and Optimizing (see Table 4 and Figure 24). Key Process
Areas have Goals associated with them. There are 18 Key Process Areas divided among the
Maturity Levels, zero for Initial, six for Repeatable, seven for Defined, two for Managed, and
three for Optimizing (see Table 4 and Figure 24). There are five Common Features associated
with each of the 18 Key Process Areas, Commitment to Perform, Ability to Perform, Activities
Performed, Measurement and Analysis, and Verifying Implementation. And, there are
approximately 316 individual Key Practices or SPI requirements divided among the 90 Common
Features. The CMM is characterized by best practices for software development management,
with a focus on software quality management. That is, the CMM identifies high-priority software
management best practices, and their associated requirements. Thus, a software producing
organization that follows the best practices prescribed by the CMM, and meets their

Using Cost 183
requirements, is considered to have good software management practices. And, software-
producing organizations that don’t meet the CMM’s requirements are considered to have poor
software management practices. The CMM is a series of five stages or Maturity Levels of
software management sophistication, Maturity Level One—Initial being worst and Maturity
Level Five—Optimizing being considered best. At the first stage or Maturity Level, software
management is asserted to be very unsophisticated or “immature” in CMM terminology. At the
last or highest stage or Maturity Level, software management is asserted to be very sophisticated
or “mature” in CMM terminology. The first or Initial Level has no SPI requirements and
characterizes poor software management practices. The second or Repeatable Level has six
major best practices largely centered on software project planning and management. The third or
Defined Level has seven major best practices centered on organizational SPI management,
process definition, and introduces some software quality management practices. The fourth or
Managed Level only has two best practices emphasizing the use of software metrics and
measurement to manage software development, as well as an emphasis on software quality
metrics and measurement. The fifth and highest Optimizing Level focuses on Defect Prevention,
the use of product technologies for process improvement, and carefully managed process
improvement. In essence, the CMM requires the definition of software project management
practices, the definition of organizational software development practices, the measurement of
organization process performance, and finally measurement-intensive process improvement. This
is where the controversy enters the picture, while the CMM is reported to be prescriptive for SPI,
the CMM is not prescriptive for software project management, software development, or
software measurement. The CMM merely identifies or names some important software
processes, vaguely describes their characteristics, and even asserts a priority and order of SPI

Using Cost 184
focus (e.g., Maturity Levels). Common issues are that the CMM doesn’t identify all important
software processes, doesn’t group, prioritize, and sequence SPI requirements appropriately,
doesn’t provide step-by-step prescriptive process definitions, and may actually impede SPI by
deferring software process and quality measurement for several years. Ironically, many
commonly misperceive the CMM’s 316 Key Practices to be the concise prescriptive
requirements for software management and engineering. Fulfilling the CMM’s 316 Key
Practices will merely make an organization CMM-compliant. However, the CMM’s 316 Key
Practices neither fully describe functional software processes nor describe a best-in-class
software life cycle like the PSP, TSP, or even the Clean Room Methodology do. In other words,
the CMM attempts to describe the “essence” of best practices, but doesn’t contain the detail
necessary to define and use the recommended best-practices by the CMM (a common
misconception). One more time for emphasis, the CMM is not a software engineering life cycle
standard like ISO/IEC 12207, EIA/IEEE 12207, or J-STD-016. Nevertheless, the CMM is the de
facto, international SPI method and model, and there is an abundance of software measurement
data associated with its use, particularly in the works of Herbsleb, Carleton, Rozum, Siegel, and
Zubrow (1994), Diaz and Sligo (1997), and Haskell, Decker, and McGarry (1997). While these
studies have exhibited some rather impressive costs and benefits associated with using the CMM,
it is unclear how many additional resources and techniques were required to meet the CMM’s
requirements. And, whether actually meeting the CMM’s requirements may have actually been
due to using other SPI methods such as the Software Inspection Process and the use of software
defect density metrics, and attributing these successful outcomes to use of the CMM.
ISO 9000. According to Kan (1995), “ISO 9000, a set of standards and guidelines for a
quality assurance management system, represent another body of quality standards.” According

Using Cost 185
to NSF-ISR (1999), an international quality consulting firm, “ISO 9000 Standards were created
to promote consistent quality practices across international borders and to facilitate the
international exchange of goods and services.” NSF-ISR goes on to assert that “meeting the
stringent standards of ISO 9000 gives a company confidence in its quality management and
assurance systems.” According the American Society for Quality Control (1999), “The ISO 9000
series is a set of five individual, but related, international standards on quality management and
quality assurance.” The American Society for Quality Control goes on to say ISO 9000 standards
“were developed to effectively document the quality system elements to be implemented in order
to maintain an efficient quality system in your company.” In short, ISO 9000 is a set of
international standards for organizational quality assurance (QA) standards, systems, processes,
practices, and procedures. ISO 9000-3, Quality Management and Quality Assurance Standards—
Part 3: Guidelines for the Application of ISO 9001 to the Development, Supply, and
Maintenance of Software, specifies 20 broad classes of requirements or elements. The first 10
ISO 9000-3 quality system elements are, Management Responsibility, Quality System, Contract
Review, Design Control, Document Control, Purchasing, Purchaser-Supplied Product, Product
Identification and Traceability, Process Control, and Inspection and Testing. The last 10 ISO
9000-3 quality system elements are, Inspection, Measuring, and Test Equipment, Inspection and
Test Status, Control of Nonconforming Product, Corrective Action, Handling, Storage,
Packaging, and Delivery, Quality Records, Internal Quality Audits, Training, Servicing, and
Statistical Techniques. ISO 9000 is characterized by the creation, existence, and auditing of a
“quality manual” that “aids in implementing your quality system; communicates policy,
procedures and requirements; outlines goals and structures of the quality system and ensures
compliance,” according to Johnson (1999), an international quality consulting firm. ISO 9000

Using Cost 186
describes the essence of an organizational quality management system at the highest levels,
much like the CMM, and is thus highly descriptive, like the CMM, and not very prescriptive at
all. While, prescriptive SPI strategies like the PSP, TSP, Clean Room, and Inspections require
actual conformance to step-by-step software quality methodology, there seems to be some
question as to the operational nature of an ISO 9000-compliant “quality manual” or quality
management system. In fact, Johnson claims that it can help organizations become ISO 9000
registered in as little as three to six months. Johnson sends in a team of consultants to actually
write an ISO 9000-compliant “quality manual” for its clients. ISO 9000 was chosen for
examination and comparative analyses as a SPI method, because as Kaplan, Clark, and Tang
(1995) state, “the whole world was rushing to adopt ISO 9000 as a quality standard.” Studies by
Kaplan, Clark, and Tang and Haskell, Decker, and McGarry (1997) were instrumental keys to
unlocking the costs and benefits of ISO 9000 as a SPI method. Ironically, there many
authoritative surveys have been conducted measuring international organizational “perceptions”
of using ISO 9000-compliant quality management systems. According to Arditti (1999), Lloyd
Register reports survey respondent perceptions such as, improved management—86%, better
customer service—73%, improved efficiency and productivity—69%, reduced waste—53%,
improved staff motivation and reduced staff turnover—50%, and reduced costs—40%. Irwin
Publishing reports respondent perceptions such as, higher quality—83%, competitive
advantage—69%, less customer quality audits—50%, and increased customer demand—30%,
according to Arditti. According to Garver (1999), Bradley T. Gale reports survey respondent
perceptions such as, Improved Management Control—83%, Improved Customer Satisfaction—
82%, Motivated Workforce—61%, Increased Opportunity To Win Work—62%, Increased
Productivity/Efficiency—60%, Reduced Waste—60%, More Effective Marketing—52%,

Using Cost 187
Reduced Costs—50%, and Increased Market Share—49%. While these statistics certainly sound
great, these statistics do not reflect “actual” benefits, but merely “perceived” ones. It’s
completely unclear how much, if any, actual benefits arise from using ISO 9000-compliant
quality management systems. However, as mentioned before Kaplan, Clark, and Tang and
Haskell, Decker, and McGarry, among others, have provided enough quantitative cost and
benefit information to include the use of ISO 9000 as a SPI method, given its tremendous
popularity, and perceived ubiquity. It is important to note that very few firms actually employ
ISO 9000, at least domestically. Some large U.S. states have as few as three ISO 9000-registered
firms, which could be considered statistically insignificant.

Using Cost 188
Defect Removal Model
The defect removal model is a tool for managing software quality as software products
are developed, by evaluating phase-by-phase software defect removal efficiency (Kan, 1995).
The defect removal model has historically been used to model software process, software project
management, and software verification and validation effectiveness (Sulack, Lindner, and Dietz,
1989; Humphrey, 1989 and 1995; Gilb, 1993; Kan, 1995; McGibbon, 1996; Ferguson,
Humphrey, Khajenoori, Macke, and Matvya, 1997; Rico, 1999). Software process improvement
(SPI) costs and benefits, particularly return-on-investment (ROI), are also modeled by the defect
removal model (Gilb, 1993; Grady, 1994 and 1997; McGibbon, 1996). The defect removal
model is similarly represented by the dynamics of the Rayleigh life cycle reliability model shown
in Figure 28. The notion being that software defects should be eliminated early in software life
cycles, and that the economics of late defect elimination are cost-prohibitive.
Figure 28. Defect removal model theory.
Analysis Design Code UnitTest System TestComponent
Test
Def
ects
CustomerUse
Testing Cost (10X)
Ad Hoc (100X)
Inspection Cost

Using Cost 189
According to Kan, “the phase-based defect removal model summarizes the interrelations
among three metrics—defect injection, defect removal, and effectiveness.” Or, arithmetically
speaking, “defects at the exit of a development setup = defects escaped from previous setup +
defects injected in current setup – defects removed in current setup.” Kan cautiously and
conservatively warns that the defect removal model is a good tool for software quality
management, not software reliability modeling and estimation. Kan goes on to say that
parametric models such as exponential models and reliability growth models (e.g., Jelinski-
Moranda, Littlewood, Goel-Okumoto, Musa-Okumoto, and the Delayed S and Inflection S
Models) are best for software reliability estimation, not the defect removal model.
While, Kan favors the use of the lesser known, but deadly accurate Rayleigh model for
software quality management, Grady (1994 and 1997), Humphrey (1995), and McGibbon (1996)
have established strong empirical foundations for using defect removal models for evaluating the
costs and benefits of SPI, as well as ROI. Rico’s (1999) basic defect removal model, comparing
the costs and benefits of the Personal Software Process (PSP), Software Inspection Process, and
Software Test Process, was expanded upon to establish the basic framework of the methodology
for this entire study.
In addition to establishing the basic methodology for this study, the defect removal model
was used to design and construct an empirically valid ROI model, as well as the empirical
framework for evaluating the costs and benefits of the targeted SPI methods. As mentioned
earlier, this study will evaluate the costs and benefits of the PSP, Clean Room, Reuse,
Prevention, Inspection, Test, CMM, and ISO 9000. So, if a particular ROI or break even point is
asserted for the PSP, Inspection, or Test, in which these will be critically strategic comparative
factors, then a strong empirical foundation has been established to validate these assertions.

Using Cost 190
Humphrey. One of the first defect removal models was presented by Humphrey (1989) to
explain defect removal efficiency, is his seminal book on the SEI’s CMM (see Table 79).
Humphrey presents seven software life cycle phases or stages, High Level Design, Detailed
Level Design, Code, Unit Test, Integration Test, System Test, and Usage, for software quality
analysis on a stage-by-stage basis. Humphrey also used 10 software measurements for in-process
software quality analysis. Residual defects are the estimated starting defects at the beginning of
each stage. Injected is the number of new defects committed in each stage. Removed is the
number of defects eliminated in each stage. Remaining is injected less removed defects. Injected
Rate is the same as Injected defects in this example. Removal Efficiency is a ratio of Removed to
Residual and Injected defects. Cumulative Efficiency is a ratio of all Removed to all Residual
and Injected defects. Inspection Defects are software defects found by the Software Inspection
Process. Development Defects are software defects committed before product delivery. And
Inspection Efficiency is an estimate of the overall Software Inspection Process effectiveness, or
ratio of software defects found by Inspections to total estimated defects. This is a realistic model
because it portrays modest Inspection efficiencies, and stage-by-stage software defect injection.
Humphrey's Defect Removal Model
Table 79
High DetailedLevel Level Unit Integration System
Defects Design Design Code Test Test Test Usage
Residual 0 4 13 34 19 13 9Injected 10 21 63 5 2 2 3Removed 6 12 42 20 8 6 12Remaining 4 13 34 19 13 9 0Injection Rate 10 21 63 5 2 2 3Removal Efficiency 60% 48% 55% 51% 38% 40% 100%Cumulative Efficiency 60% 58% 64% 81% 87% 91% 100%Inspection Defects 6 18 60 - - - -Development Defects 6 18 60 80 88 94 -Inspection Efficiency - - - - - 63.8% -

Using Cost 191
Sulack. If Humphrey’s (1989) defect removal model was the first quantitative analyses of
defect removal efficiencies in strategic “what-if” terms, Sulack, Linder, and Dietz (1989)
presented the first qualitative, though holistic, defect removal model in tactical “how-to” terms
(see Table 80). Actually, Sulack, Linder, and Dietz show four defect removal models, three for
existing software products, and one notional or “future” defect removal model. Nine software
life cycle stages or phases are shown for each defect removal model, Product Objectives,
Architecture, Specification, High-Level Design, Intercomponent Interfaces, Low-Level Design,
Code, Test Plan, and Test Cases. The first product, System/36, used informal reviews for the first
half of the life cycle and the Software Inspection Process for the second half. The second
product, System/38, extended Inspections into software design, and structured walkthroughs into
Architecture and Specification. A Future, or ideal, defect removal model would systematically
employ Inspections throughout the software life cycle, with an informal initial review. Instead,
the third product, AS/400, used Inspections throughout the software life cycle, on a phase-by-
phase, product-by-product basis, in order to identify software defects as early as possible. This
strategy helped generate $14B in revenue, win the Malcolm Baldrige National Quality Award,
become ISO 9000 Registered, and employ a world-class software quality management system.
Sulack's Defect Removal Model
Table 80
Phase System/36 System/38 Future AS/400
Product Objectives Review Review Review WalkthruArchitecture Review Walkthru Inspection InspectionSpecification Review Walkthru Inspection InspectionHigh-Level Design Review Inspection Inspection InspectionIntercomponent Interfaces Review Inspection Inspection InspectionLow-Level Design Inspection Inspection Inspection InspectionCode Inspection Inspection Inspection InspectionTest Plan Inspection Inspection Inspection InspectionTest Cases Inspection Inspection Inspection Inspection

Using Cost 192
Gilb. While, defect removal models by Humphrey (1989) and Sulack, Lindner, and Dietz
(1989) were some of the earliest works, depicting strategic and tactical models, Gilb (1993) was
one of the first to attach the costs and benefits to his defect removal model (see Table 81). Gilb’s
model presents five notional stages of software product evolution, System Construction, Testing
Execution, Early Field Use, Later Field Use, and Final Use. Gilb’s defect removal model also
introduced seven basic software metrics, Where Defects Found, Defects Found, Estimated
Effectiveness, Cost to Fix, Cost with Inspection, Defects Found w/o Inspection, and Cost w/o
Inspection, being one the first models to introduce the notion of cost. Where Defects Found
identifies the activity that uncovered the software defect, Inspection, Test, or customer use.
Defects Found are the proportional number of software defects uncovered by the activity,
Inspection, Test, or customer use, and the phase in which they were found. Estimated
Effectiveness is the percentage of defects found by Inspection, Testing, or customer use for that
phase. Cost to Fix is the dollars per defect for the given phase and activity. Cost with Inspection
is total dollars per phase and activity, with Inspections used in the System Construction Phase.
Defects Found w/o Inspection is the number of software defects found per phase and activity
without use of Inspections. Cost w/o Inspection is the cost per phase and activity without use of
Inspections. For a modest $600 investment in Inspections, $623,400 is saved according to Gilb.
Gilb's Defect Removal Model
Table 81
System Testing Early LaterLife Cycle Phase Construction Execution Field Use Field Use Final Use
Where Defects Found Inspection Testing Use Use UseDefects Found 60 24 10 4 2Estimated Effectiveness 75% 71% 63% 61% 60%Cost to Fix $10 $100 $1,000 $1,000 $1,000Cost with Inspection $600 $3,000 $13,000 $17,000 $19,000Defects Found w/o Inspection 0 60 48 10 2Cost w/o Inspection $0 $6,000 $540,000 $64,000 $66,000

Using Cost 193
Kan. The defect removal model by Kan (1995) is very similar to Humphrey’s (1989),
only simplified and more focused (see Table 82). In this model, Kan shows eight software
development phases, Requirements, High Level Design, Low Level Design, Code, Unit Test,
Component Test, System Test, and Field. Kan also introduces six software metrics to measure
software quality, Defect Escaped from Previous Phase (per KSLOC), Defect Injection (per
KSLOC), Subtotal (A + B), Removal Effectiveness, Defect Removal (per KSLOC), and Defects
at Exit of Phase (per KSLOC). Defect Escaped from Previous Phase (per KSLOC) is the number
of software defects present before phases begin (normalized to thousands of source lines of
code—KSLOC). Defect Injection (per KSLOC) is the number of software defects created during
a phase (normalized to KSLOC). Subtotal (A + B) is the sum of software escaped and injected
defects, that are present during any given phase. Removal Effectiveness is the percentage of
software defects eliminated by Inspections or Test per phase. Defect Removal (per KSLOC) is
the number of software defects eliminated by Inspections or Test per phase (normalized to
KSLOC). And, Defects at Exit of Phase (per KSLOC) are the number of residual software
defects present, or not eliminated by Inspections or Test per phase (normalized to KSLOC).
Kan's Defect Removal Model
Table 82
(A)Defect
Escapedfrom (B) Defects
Previous Defect Defect at ExitPhase Injection Subtotal Removal Removal of Phase
Phase (per KSLOC) (per KSLOC) (A + B) Effectiveness (per KSLOC) (per KSLOC)
Requirements - 1.2 1.2 - - 1.2High Level Design 1.2 8.6 9.8 74% 7.3 2.5Low Level Design 2.5 9.4 11.9 61% 7.3 4.6Code 4.6 15.4 20 55% 11 9Unit Test 9 - 9 36% 3.2 5.8Component Test 5.8 - 5.8 67% 3.9 1.9System Test 1.9 - 1.9 58% 1.1 0.8Field 0.8 - - - - -

Using Cost 194
McGibbon. Like Humprey’s (1989) and Kan’s (1995) defect removal models, McGibbon
(1996) designed a detailed model and attached costs like Gilb (1993), but upped the ante by
comparing the costs and benefits of Formal and Informal Inspections (see Table 83). McGibbon
uses four major software life cycle phases, Design, Coding, Test, and Maintenance, also
introducing 23 individual software metrics for evaluating the costs and benefits of defect
removal efficiencies for Formal and Informal Inspections. % Defects Introduced represents the
McGibbon's Defect Removal Model (Part I)
Table 83
Formal InformalPhase Inspections Inspections
Design% Defects Introduced 35% 35%
Total Defects Introduced 98 Defects 98 Defects% Defects Detected 65% 40%
Defects Detected 64 Defects 39 DefectsRework Hours/Defect 2.5 Hours 2.5 HoursTotal Design Rework 159 Hours 98 Hours
Coding% Defects Introduced 65% 65%
Total Defects Introduced 182 Defects 182 Defects% Defects Detected 70% 35%
Defects Detected 151 Defects 84 DefectsRework Hours/Defect 2.5 Hours 2.5 HoursTotal Coding Rework 378 Hours 211 Hours
TestDefects Found in Test 51 Defects 114 DefectsRework Hours/Defect 25 Hours 25 Hours
Total Test Rework 1,271 Hours 2,861 Hours
% of Defects Removed 95% 85%
MaintenanceDefects Left for Customer 14 Defects 42 Defects
Post Release Defects/KSLOC 0.35/KSLOC 1.05/KSLOCRework Hours/Defect 250 Hours 10,491 Hours
Total Maintenance Rework 3,497 Hours 3,497 Hours
TotalsTotal Rework 5,306 Hours 13,660 Hours
Total Rework Costs $206,918 $532,752Total Savings $325,834

Using Cost 195
proportion of software defects created during the Design and Coding phases. Total Defects
Introduced represents the number of software defects created during the Design and Coding
phases. % Defects Detected represent the proportion of software defects eliminated by Formal
and Informal Inspections during the Design and Coding phases. Defects Detected represent the
number of software defects eliminated by Formal and Informal Inspections during the Design
and Coding phases. Rework Hours/Defect are the effort required to eliminate each software
defect by Formal and Informal Inspections during the Design and Coding phases. Total Design
Rework is the effort required to repair all defects found by Formal and Informal Inspections
during the Design and Coding phases. Defects Found in Test are residual or remaining software
defects escaping Formal and Informal Inspections into the Test phase. Rework Hours/Defect are
the effort to eliminate each software defect by dynamic analysis during the Test phase. Total Test
Rework is the effort required to repair all defects found by dynamic analysis during the Test
phase. % of Defects Removed are the proportion of software defects eliminated by Formal and
Informal Inspections, as well as dynamic analysis, during the Design, Coding, and Test phases.
Defects Left for Customer are the total number of software defects remaining in software
products delivered to customers, not found by Formal and Informal Inspections, or dynamic
analysis, during the Design, Coding, and Test phases. Post Release Defects/KSLOC are the
number of Defects Left for Customer normalized to thousands of source lines of code (KSLOC).
Rework Hours/Defect are the effort to eliminate each software defect during the Maintenance
phase. Total Maintenance Rework is the effort required to repair all defects during the
Maintenance phase. Total Rework is the effort required to repair all defects found during the
Design, Coding, Test, and Maintenance phases. Total Rework Cost is Total Rework in dollars.
And, Total Savings are the benefit of using Formal Inspections over Informal Inspections.

Using Cost 196
McGibbon. After designing his defect removal model in Table 83, McGibbon (1996)
extended his analysis to include comparing the Clean Room Methodology, a formal methods-
based software development approach, to Formal Inspections and Informal Inspections (see
Table 84). McGibbon’s model reported a 6:1 cost advantage of Clean Room over Inspections.
McGibbon's Defect Removal Model (Part II)
Table 84
Clean RoomCost/Benefits Formal Inspection Informal Inspection
39,967 39,967 39,9675 7 7
200 280 280
35% 35% 35%70 98 98
80% 65% 40%56 64 392.5 2.5 2.5140 159 98
65% 65% 65%130 182 18298% 70% 35%141 151 842.5 2.5 2.5353 378 211
1 51 11425 25 2522 1,271 2,861
1,014 5,306 13,660$39,544 $206,918 $532,752
$466,659 $2,618,814 $2,891,586$2,152,155 $2,424,927
82% 84%
99% 95% 85%
2 14 420.05 0.35 1.05250 250 250500 3,497 10,491
$19,484 $136,386 $409,159
Total Defects Introduced% Defects DetectedDefects DetectedRework Hours/DefectTotal Design Rework
% Defects Introduced
Total Defects Introduced% Defects DetectedDefects DetectedRework Hours/DefectTotal Design Rework
% Defects Introduced
Rework Hours/DefectTotal Test Rework
Defects Found in Test
Post Release Defects/KSLOCRework Hours/DefectTotal Maintenance ReworkMaintenance $
Defects Left for Customer
% of Defects Removed
Lines of CodeDefects per KSLOCTotal Defects ExpectedDesign
Coding
Test
Totals
Effort $ + Maintenance $Clean Room $ ImprovementClean Room % Improvement
Maintenance
Total Rework HoursTotal Rework Costs

Using Cost 197
Ferguson. This defect removal model (as shown in Table 85) was created from data by
Ferguson, Humphrey, Khajenoori, Macke, and Matvya (1997). Size is the number of source lines
of code. Defects are the total number of software defects created. Insertion is the ratio of Defects
to Size. Review is the number of software defects eliminated by reviews. Efficiency is the ratio
of Review to Defects. Test is the number of defects eliminated by Test. Efficiency is the ratio of
Test to Defects (less Review). Fielded is the number of residual defects. 76% of software defects
are found by individual review, 24% by dynamic analysis, and 0% are released to customers.
22 2 0 02 9% 100% 0%6
5 0 0 00 0% 0% 0%5
3,381 47 22 069 2% 68% 100%4
1,571 39 8 047 3% 83% 100%3
4,565 59 10 069 2% 86% 100%2
463 8 5 013 3% 62% 100%1
1 1 0 01 100% 100% 0%7
Defects FieldedSize Insertion Review TestEfficiency EfficiencyProject
Defect Containment Analysis
Ferguson's Defect Removal Model
Table 85
364 27 2 029 8% 93% 100%10
114 13 2 015 13% 87% 100%9
2,081 33 0 134 2% 97% 0%8
7 0 0 00 0% 0% 0%11
25,114 438 136 1575 2% 76% 99%Total
3,494 89 50 0139 4% 64% 100%18
467 14 3 017 4% 82% 100%17
1,270 19 1 020 2% 95% 100%16
2,075 52 27 079 4% 66% 100%15
3,894 18 2 020 1% 90% 100%14
720 7 2 09 1% 78% 100%13
620 10 2 012 2% 83% 100%12

Using Cost 198
Rico. The defect removal model in Table 86 was created by Rico (1999), and is a hybrid
of models by Ferguson, Humphrey, Khajenoori, Macke, and Matvya (1997), and McGibbon
1996. Program Size is thousands of source lines of code. Start Defects are the estimated software
defects. Review Hours are the number of static analysis hours. Review Defects are the number of
defects found by static analysis. Defects per Hour are the ratio of Review Defects to Review
Hours. Start Defects are the number of defects escaping reviews. Test Hours are the number of
dynamic analysis hours. Test Defects are the number of defects found by dynamic analysis.
Defects per Hour are the ratio of Test Defects to Test Hours. Total Hours are the sum of Review
Hours and Test Hours (except PSP, which includes total effort). Total Defects are the sum of
Review Defects and Test Defects. Quality Benefit is a ratio of poorest Delivered Defects to next
best Delivered Defects. Delivered Defects are the numbers of defects escaping static and
dynamic analysis. Cost Benefit is a ratio of poorest Total Hours to next best Total Hours.
Rico's Defect Removal Model
Table 86
PSPCost/Benefits Inspection Test
10 KSLOC 10 KSLOC 10 KSLOC1,000 1,000 1,00097.24 708 n/a666 900 n/a
333 100 1,00060.92 1,144 11,439333 90 9005.47 12.71 12.71400 * 1,852 11,4391,000 990 900
0 10 100
Program SizeStart DefectsReview HoursReview Defects
Start DefectsTest HoursTest DefectsDefects per HourTotal HoursTotal Defects
Delivered Defects
Defects per Hour 6.85 1.27 n/a
* PSP hours include development time--others only validation time
29X 6X n/aCost Benefit
100X 10X n/aQuality Benefit

Using Cost 199
Humphrey. While Figure 20 represents a Rayleigh life cycle reliability model (Kan,
1995), it is an excellent illustration of a grossly simplified defect removal model developed for
the Personal Software Process (PSP) by Humphrey (1995). Humphrey introduced a model, he
called the Appraisal to Failure Ratio (A/FR). Mathematically, Appraisal (A) is expressed as 100
* (design review time + code review time) / total development time. And, Failure Ratio (FR) is
expressed as 100 * (compile time + test time) / total development time. A/FR is simply the ratio
of static analysis effort to dynamic analysis effort. While, Kan advocates the use of Rayleigh
models, Humphrey has discovered the much simpler, but extremely powerful, axiom or software
engineering law stating that if more than twice as much effort is spent on static analysis than
dynamic analysis, few, if no software defects will be delivered to customers. And, the corollary
to A/FR is, if more than twice as many software defects are found by static analysis than
dynamic analysis, no defects will be delivered to customers. These axioms prove valid for the 18
software releases depicted in Table 85, where 76% of software defects were found by static
analysis, 24% of software defects were found by dynamic analysis, and none by customers.
1/3 by Failure(dynamic analysis)
2/3 by Appraisal(static analysis))
Analysis Design Code UnitTest System TestComponent
Test
Def
ects
Figure 29. Humphrey's defect removal model (Part II).

Using Cost 200
Return-on-Investment Model
Since very little ROI data is reported, available, and known for SPI methods, it became
necessary to design a new ROI model in order to act as an original source of ROI data, and
establish a fundamental framework and methodology for evaluating SPI methods (see Table 87).
This original software quality-based ROI model is a direct extension of an earlier work
by Rico (1999) as exhibited by Table 65, that was designed for the express purpose of evaluating
ROI. It is a seemingly simple, though intricately complex composite of multiple sub-models,
Basic Quality-Based Return-on-Investment (ROI) Model
Table 87
Software SizeStart DefectsReview EfficiencyReview HoursReview DefectsReview Defects/HourReview Hours/DefectRemaining DefectsTest EfficiencyTest HoursTest DefectsTest Defects/HourTest Hours/DefectValidation DefectsReleased DefectsMaintenance Hours/DefectDevelopment HoursValidation HoursMaintenance HoursTotal HoursQBreak Even/Ad HocPBreak Even/Ad HocPBreak Even/TestPBreak Even/InspectionSlope (Life Cycle Cost)Y Intercept (w/Investment)HBreak Even/Ad HocHBreak Even/TestHBreak Even/InspectionROI/Ad HocROI/TestROI/Inspection
10,000 10,000 10,000 10,000 10,000 10,000 10,000 10,0001,000 1,000 1,000 1,000 1,000 1,000 1,000 1,00067% 67% 67% 67% 67% 67% 0% 0%
97 500 708 960 970 1,042 0 0667 667 667 667 667 667 0 0
6.86 1.33 0.94 0.69 0.69 0.64 0 00.15 0.75 1.06 1.44 1.46 1.56 0 0333 333 333 333 333 333 1,000 1,000
100% 67% 67% 67% 67% 67% 67% 0%61 1,667 2,361 3,200 3,233 3,472 8,360 0
333 222 222 222 222 222 667 05.47 0.13 0.09 0.07 0.07 0.06 0.08 00.18 7.50 10.63 14.40 14.55 15.63 12.54 0
1,000 889 889 889 889 889 667 00 111 111 111 111 111 333 1,0002 75 106 144 146 156 125 125
242 5,088 5,088 5,088 5,088 5,088 5,088 5,088158 2,167 3,069 4,160 4,203 4,514 8,360 0
0 8,333 11,806 16,000 16,167 17,361 41,800 125,400400 15,588 19,963 25,248 25,458 26,963 55,248 130,488
0.78 6.67 6.67 6.67 6.67 6.67 66.676.15 1.65 1.72 1.81 1.81 1.84 10.37
14.59 4.79 5.38 6.33 6.38 6.7235.9625.00 0.64 0.50 0.40 0.39 0.37 0.18 0.08
-2000.00 -12.19 -9.52 -7.53 -7.46 -7.05 -14.1280.25 21.58 22.43 23.56 23.61 23.95 135.2780.58 26.47 29.75 34.99 35.24 37.1181.44
1,290:1 234:1 160:1 114:1 113:1 104:1 10:1430:1 67:1 42:1 27:1 26:1 23:1143:1
AT&T Basic BNR Gilb HPPSP Inspection Inspection Inspection Inspection Inspection Test Ad Hoc

Using Cost 201
simulating the effects of several SPI methods on efficiency, productivity, quality, cost, break-
even points, and ROI. Some of the sub-models represented include a defect removal model and
multiple empirical statistical parametric linear and log-linear software cost models.
The defect removal model or defect containment analysis model is an experimentally,
scientifically, empirically, and commercially validated software quality-based approach to
examining SPI method effectiveness and ROI, introduced and used extensively by several major
studies (Kan, 1995; Grady, 1994 and 1997; McGibbon, 1996). The defect removal model is
based on statistically modeling software defect populations and the costs and efficiencies of SPI
methods for eliminating those same software defect populations. The method involves estimating
software defect populations, estimating the efficiency of SPI methods for eliminating software
defects, estimating the residual software defect population after applying a particular SPI
method, and estimating the cost of eliminating the residual software defect population delivered
to customers. If a particular SPI method is expensive and inefficient, then a large and expensive
software defect population is delivered to customers. Likewise, if a SPI method is inexpensive
and efficient then a small and inexpensive software defect population is delivered to customers.
It is these relationships that establish an empirically valid basis for analyzing and comparing the
costs, benefits, and ROI of using several similar software quality-based SPI methods. While, Kan
warns that defect removal models may not be good for precision software reliability modeling,
Kan does identify them as a strategic software quality management tools. Like, Gilb (1993),
Grady, and McGibbon, this model has been extended to approximate ROI.
Software Size. The Software Size chosen for this ROI model is 10,000 source lines of
code (SLOCs). When this model was originally designed (Rico, 1999), it was thought that this
Software Size was too small and non-representative of software-based products and services.

Using Cost 202
Classical Software Sizes ranged in the hundreds of thousands and even millions of SLOCs for
second and third generation programming languages (Kan, 1995). However, this number may
not be too small, but too large, as modern websites range in the dozens and hundreds of SLOCs.
A typical software maintenance release may involve as little as a single SLOC, and average
around five to ten SLOCS. So, an input into an ROI model of only 10,000 SLOCs doesn’t seem
so unreasonably small after all.
Start Defects. The Start Defects chosen for this ROI model are 1,000, or about 10%. This
number wasn’t arbitrarily chosen, and isn’t necessarily unreasonably high. It was based on
empirical studies that report software defect insertion rates ranging from 10% to 15%, and
occasionally as high as 150% (Humphrey, 1995 and 1996). This ROI model input is a little more
controversial, since several authoritative studies report Start Defects as low as 1% to 3%. What
these numbers represent is number of defective SLOCs before any kind of Testing. For a person
to have a 1% Start Defect rate, would be for only one in a hundred SLOCs to be defective upon
initial computer programming. A 10% Start Defect rate means that ten out of a hundred SLOCs
are defective upon initial computer programming. Start Defects of 1,000 or 10% is a good and
solid assumption. If anything, Start Defects probably exceed 10%, driving the ROI of the best
performing SPI methods up rather sharply. Varying this input would make an excellent study.
Review Efficiency. Review Efficiency refers to the ratio of software defects eliminated to
remaining software defects, after applying a pre-Test-based SPI method, such as the Personal
Software Process (PSP) or the Software Inspection Process. Review Efficiency is also based on
estimating statistical defect populations, and evaluating the number of software defects
eliminated by a SPI method, versus the estimated residual software defect population. In other
words, the number of software defects before and after applying a SPI method are estimated, and

Using Cost 203
the Review Efficiency is estimated based on the number of software defects eliminated by the
SPI method. For example, if a software defect population is estimated to be 10 and a SPI method
eliminates seven software defects, then the Review Efficiency of the SPI method is estimated to
be 70%. Siy (1996) identified three basic kinds of software defect estimation methods, Capture-
Recapture, Partial Estimation of Detection Ratio, and Complete Estimation of Detection Ratio.
Siy reported Capture-Recapture to be invalid, and Complete Estimation of Detection Ratio to be
best. Ironically, Capture-Recapture methods are emerging as one of the most useful techniques
for these purposes as reported by the Fraunhofer-Institute (Briand, El Emam, Freimut, and
Laitenberger, 1997; Briand, El Emam, and Freimut, 1998; Briand, El Emam, Freimut, and
Laitenberger, 1998). Humphrey (2000) also reports that a form of Capture-Recapture methods is
the preferred software quality estimation method of the Team Software Process (TSP). Review
Efficiencies for the Software Inspection Process are pessimistically reported to hover around
67% (McGibbon, 1996; Gilb, 1993). However, Fagan (1986) reports 93% Review Efficiencies
and Weller (1993) reports a high of 98.7%. A Review Efficiency of 67% is very solid
assumption, and doesn’t risk offending Software Inspection Process Review Efficiency
conservatives. In the case of the PSP, a 67% Review Efficiency was derived from a PSP study by
Ferguson, Humphrey, Khajenoori, Macke, and Matvya (1997). Increasing Review Efficiency
increases the ROI of using the Software Inspection Process, and decreases the ROI of using the
PSP. Varying this input would also make an excellent study.
Review Hours. Review Hours were estimated from six-different software cost models
(see Table 88). PSP Review Hours came from a custom software cost model developed by Rico
(1998), which itself was derived from software productivity data for the PSP, as reported by
Hays and Over (1997). Average PSP Review Hours were derived from Hays’ and Over’s study.

Using Cost 204
Hays and Over reported an average PSP design and code Review Hour percentage of
24.31% for Programs seven, eight, and nine, involving data from 298 engineers. Review Hours
of 97 is a factor of 24.31% and 400 total PSP hours as derived from Rico’s PSP software cost
model for 10,000 SLOCs. Review Hours of 500, 708, 960, 970, and 1,042 were derived from the
Software Inspection Process software cost models shown in Table 88 as derived by Rico (1993
and 1996). Figure 30 depicts the architecture of Rico’s (1993) Software Inspection Process cost
model and how it was designed. Rico used Russell’s study (1991) as a basis for designing and
validating his model. Rate refers to the number of SLOCs per hour to be reviewed, and was input
as 120, twice as much as optimally recommended. Team Size was input as four inspectors. These
five Software Inspection Process effort estimates were part of a sensitivity analysis exhibiting the
range of costs and benefits for the Software Inspection Process in industrial use, and the
associated ROI. While this study refrained from varying Start Defects and Review Efficiency as
too low level of a sensitivity analysis, it was felt that exhibiting a wide range of authoritative
Software Inspection Process cost models would lend authority and validity to this newly
designed ROI model. Average ROIs will be used for later SPI method cost and benefit analyses.
Six Software Cost Models for Two Strategies
Table 88
50 * KSLOC
SLOC / (Rate * 2) * (Team Size * 4 + 1)
SLOC / (Rate * 2) * (5.76 * Team Size)
SLOC / (Rate * 2) * 25
3 * KSLOC * 4 * 8
SLOC / 25
Method Software Cost Model Author
PSP
Inspection
Rico (1998)
Rico (1993)
Grady (1994)
Barnard (1994)
Russell (1991)
Gilb (1993)
Source
Hays (1997)
Russell (1991)
Hewlett Packard
AT&T
Bell Northern
Fagan (1976)

Using Cost 205
Review Defects. Review Defects, that is the number of software defects eliminated by the
SPI method from the total estimated software defect population, were estimated by multiplying
Start Defects by Review Efficiency, yielding 667 Review Defects out of 1,000 Start Defects.
While, these numbers may seem small and inefficient, the economic savings of these relatively
conservative numbers will yield extremely beneficial results, as reported later. A Testing-only
approach, which is quite common, involves no pre-Test reviews, SPI methods, or Review
Efficiencies, nor does an ad hoc software development approach.
Review Defects/Hour. Review Defects/Hour are estimated by dividing estimated Review
Defects by the estimated Review Hours, yielding 6.86, 1.33, 0.94, 0.69, 0.69, 0.69, and 0.64.
This is actually a phenomenal computation, especially for the PSP. Historically (Russell, 1991;
0.5
1.0
1.5
2.0
Hou
rs
0.5 * M 1.0 * P 1.0 * I
Hours = Product Size / ( Inspection Rate * 2 ) * ( Team Size * 4 + 1)
+ +
OverviewSubstage
2.0 * P 1.0 * C 0.5 * M+ + +
PlanningSubstage
FollowupSubstage
10,000 Lines
People 180 SLOCPer Hour
120 SLOCPer Hour
60 SLOCPer Hour
4 1,417 708 472
5 1,750 875 583
6 2,083 1,042 694
7 2,417 1,208 806
100,000 Lines
180 SLOCPer Hour
120 SLOCPer Hour
60 SLOCPer Hour
1,000,000 Lines
180 SLOCPer Hour
120 SLOCPer Hour
60 SLOCPer Hour
20,833
17,500
14,167
24,167
10,417
8,750
7,083
12,083
6,944
5,833
4,722
8,056
208,333
175,000
141,667
241,667
104,167
87,500
70,833
120,833
69,444
58,333
47,222
80,556
PreparationSubstage
InspectionSubstage
ReworkSubstage
Figure 30. Software inspection process cost model architecture.
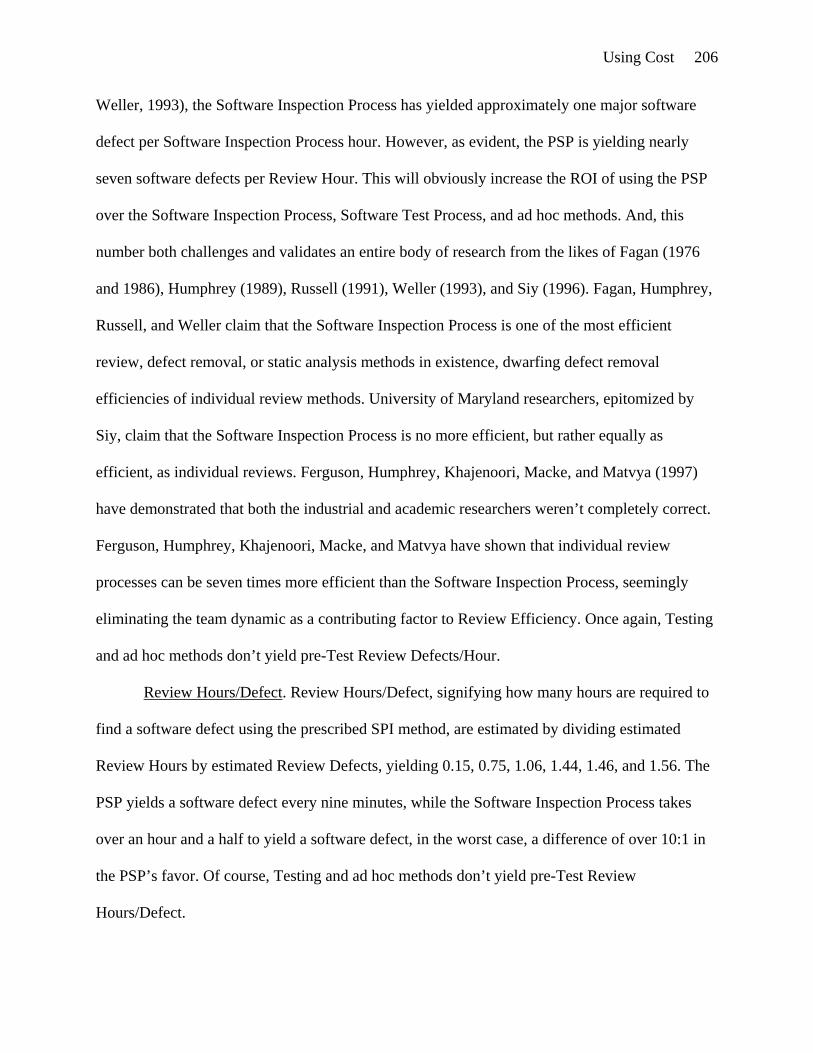
Using Cost 206
Weller, 1993), the Software Inspection Process has yielded approximately one major software
defect per Software Inspection Process hour. However, as evident, the PSP is yielding nearly
seven software defects per Review Hour. This will obviously increase the ROI of using the PSP
over the Software Inspection Process, Software Test Process, and ad hoc methods. And, this
number both challenges and validates an entire body of research from the likes of Fagan (1976
and 1986), Humphrey (1989), Russell (1991), Weller (1993), and Siy (1996). Fagan, Humphrey,
Russell, and Weller claim that the Software Inspection Process is one of the most efficient
review, defect removal, or static analysis methods in existence, dwarfing defect removal
efficiencies of individual review methods. University of Maryland researchers, epitomized by
Siy, claim that the Software Inspection Process is no more efficient, but rather equally as
efficient, as individual reviews. Ferguson, Humphrey, Khajenoori, Macke, and Matvya (1997)
have demonstrated that both the industrial and academic researchers weren’t completely correct.
Ferguson, Humphrey, Khajenoori, Macke, and Matvya have shown that individual review
processes can be seven times more efficient than the Software Inspection Process, seemingly
eliminating the team dynamic as a contributing factor to Review Efficiency. Once again, Testing
and ad hoc methods don’t yield pre-Test Review Defects/Hour.
Review Hours/Defect. Review Hours/Defect, signifying how many hours are required to
find a software defect using the prescribed SPI method, are estimated by dividing estimated
Review Hours by estimated Review Defects, yielding 0.15, 0.75, 1.06, 1.44, 1.46, and 1.56. The
PSP yields a software defect every nine minutes, while the Software Inspection Process takes
over an hour and a half to yield a software defect, in the worst case, a difference of over 10:1 in
the PSP’s favor. Of course, Testing and ad hoc methods don’t yield pre-Test Review
Hours/Defect.

Using Cost 207
Remaining Defects. Remaining Defects refer to the estimated residual software defect
population following application of a pre-Test SPI method such as the PSP or the Software
Inspection Process, yielding an estimated pre-Test software defect population of 333, except for
the Software Test Process and ad hoc methods which start at 1,000. Once again, this number is
derived from estimated total software defect populations, less estimated Review Efficiencies.
Higher Review Efficiencies using the Software Inspection Process are practically possible, as
reported by Fagan (1986), Russell (1991), and Weller (1993), reaching almost 99% in some
cases. A best-in-class Review Efficiency of nearly 99% would result in an estimated 10
Remaining Defects and would change the outcomes of the ROI model exhibited by Table 87.
Test Efficiency. Test Efficiency refers to the ratio of software defects eliminated to
remaining software defects, after applying a Software Test Process. Test Efficiency is also based
on estimating statistical defect populations, and evaluating the number of software defects
eliminated by Testing, versus the estimated residual software defect population. In other words,
the number of software defects before and after applying Testing are estimated, and the Test
Efficiency is estimated based on the number of software defects eliminated by Testing. For
example, if a software defect population is estimated to be 10 and Testing eliminates seven
software defects, then the Test Efficiency estimated to be 70%. The PSP yields a Test Efficiency
of 100% as reported by Ferguson, Humphrey, Khajenoori, Macke, and Matvya (1997), which is
further corroborated by a much more detailed study by Hays and Over (1997). 100% is
remarkably impressive for Testing, as is probably due to the highly prescriptive nature of the
PSP. Test Efficiency usually averages around 67% for best-in-class organizations as reported by
Humphrey (1989), and is typically much lower as reported by preliminary findings by Burnstein,
Homyen, Grom, and Carlson (1998). Yamamura (1998) and Asada and Yan (1998) report much

Using Cost 208
higher Test Efficiencies reaching better than 99%, but are certainly not the norm. Sommerville
(1997) reports that organizations typically allocate 30% to 40% of organizational resources to
Test. But, in fact organizations typically allocate about 1% of organizational resources to ad hoc
and highly unstructured Testing yielding Test Efficiencies of much lower than 67%, as alluded to
by Burnstein, Homyen, Grom, and Carlson. In fact, a Test Efficiency of 67% is actually far too
generous, and lowering this to 5% or 10% would not be unreasonable. Even some best-in-class
Testing approaches don’t estimate statistical defect populations, basing software quality
estimation decisions on the use of reliability and exponential growth models (Asada and Yan,
1998), potentially grossly underestimating and ignoring software defect populations. Other best-
in-class Testing approaches that do estimate statistical software defect populations rely largely
on Testing to eliminate them (Yamaura, 1998), spending as much as 10X more than necessary. It
is the economic inefficiency of Testing that is ignored or unknown by Testing advocates
(Yamaura; Asada and Yan; Burnstein, Homyen, Grom, and Carlson), because Testing costs more
than 10X the effort of Inspections. Ad hoc methods have no Test Efficiency.
Test Hours. Test Hours are estimated to be the product of estimated Remaining Defects,
Test Efficiency, and Review Defects/Hour (multiplied by 10), for the Software Inspection
Process and the Software Test Process, yielding 1,667, 2,361, 3,200, 3,233, 3,472, and 8,360.
Test Efficiency for the Software Test Process was derived from the same basic model, except
that Review Defects/Hours were an average of the five Software Inspection Process Review
Defects/Hour. Hays and Over (1997) reported an average PSP Test Hour percentage of 15.23%
for Programs seven, eight, and nine, involving data from 298 engineers. Test Hours of 60.92 is a
factor of 15.23% and 400 total PSP hours as derived from Rico’s (1998) PSP software cost
model for 10,000 SLOCs. Ad hoc methods have no Test Hours.

Using Cost 209
Test Defects. Test Defects, that is the number of software defects eliminated by Testing
from the estimated software defect population, were estimated by multiplying Remaining
Defects by Test Efficiency, yielding 333 for the PSP-based Testing, 222 for post-Inspection-
based Testing, and 667 for Testing alone. Ad hoc methods have no Test Defects.
Test Defects/Hour. Test Defects/Hour are estimated by dividing estimated Test Defects
by the estimated Test Hours, yielding 5.47, 0.13, 0.09, 0.07, 0.07, 0.06, and 0.08, for the PSP,
post-Inspection-based Testing, and Testing alone. What this shows is that post-Inspection-based
Testing and Testing alone yield about a tenth of a defect per Test Hour, while PSP-based Testing
yields nearly six defects per Test Hour, a difference of nearly 66:1 in the PSP’s favor. Ad hoc
methods have no Test Defects/Hour.
Test Hours/Defect. Test Hours/Defect, signifying how many hours are required to find a
software defect using the Software Test Process, are estimated by dividing estimated Test Hours
by estimated Test Defects, yielding 0.18, 7.5, 10.63, 14.4, 14.55, 15.63, and 12.54, for PSP-
based Testing, post-Inspection-based Testing, and Testing alone. The PSP yields a software
defect every 11 minutes, while post-Inspection-based Testing and Testing alone require over
12.5 hours to yield a defect. Ad hoc methods have no Test Hours/Defect.
Validation Defects. Validation Defects are the sum of Review Defects and Test Defects,
signifying the total number of estimated software defects eliminated by the various SPI methods,
yielding, 1,000 or 100% for the PSP, 889 or 89% for Inspections and post-Inspection-based
Testing, and 667 for Testing alone. It’s remarkable that the PSP is reported to have a nearly
100% defect removal efficiency as reported by Ferguson, Humphrey, Khajenoori, Macke, and
Matvya (1997). While, the PSP is reported to have a Review Efficiency of only 67%, the PSP’s
Testing approach is reported to have a 100% Test Efficiency. Once again, this can only be

Using Cost 210
attributed to the highly structured and prescriptive nature of the PSP. For the PSP, it’s time to
start analyzing the benefits. But, for Inspections, Testing, and ad hoc approaches, it’s time to
begin weighing the costs of inefficiency. Ad hoc methods, in the worst case, have no Validation
Defects. This is very significant, because it is theorized that more than 95% of world-wide
software producing organizations neither use Inspections or Test, as alluded to by the Software
Engineering Institute (1999) and Burnstein, Homyen, Grom, and Carlson (1998). What this
means is that the typical software producing organizations probably delivers the majority of a
rather significant software defect population to its customers. It also means, that it wouldn’t be
typical for software producing organizations to be yielding the Validation Defects as exhibited
by the PSP, Inspections, and even the much maligned Testing.
Released Defects. Released Defects are the number of estimated Start Defects less
Review Defects and Test Defects for the various SPI methods, yielding 0.0 for the PSP, 111 for
Inspections and post-Inspection-based Testing, 333 for Testing alone, and 1,000 for ad hoc
methods. A low Release Defect value is the signature of a good quality-based SPI method, such
as the PSP, Inspections, and even good Testing. Unfortunately, Release Defects are the strategic
metric ignored by modern practitioners and even Testing enthusiasts, who couldn’t possibly cost-
effectively remove estimated software defect populations, and end up ignoring Released Defects.
Maintenance Hours/Defect. Maintenance Hours/Defect are estimated by multiplying Test
Hours/Defect by 10, yielding 2, 75, 106, 144, 146, 156, and 125, for the PSP, Inspections, and
Test. What this shows is that software maintenance costs an order of magnitude more than
Testing, as commonly attested to by Russell (1991), Weller (1993), Kan (1995), and McGibbon
(1996). Since ad hoc methods don’t have Test Hours/Defect, 125 is assumed to be the
Maintenance Hours/Defect, which is an average of post-Inspection-based Testing estimates.

Using Cost 211
Development Hours. Development Hours refer to the complete effort to produce a
software product, and were estimated from five different linear and log-linear empirical
statistical parametric software cost estimation models (see Table 89), yielding 242 for the PSP
and 5,088 for Inspections, Testing, and ad hoc methods. Rico’s (1998) PSP software cost model
derived from a study by Hays and Over (1997) was used to yield the 242 PSP Development
Hours. Inspections and Testing are only software validation methods, and their associated effort
reported in Review Hours doesn’t account for total software development effort. Thus, it is
necessary to estimate the total software development effort and add it to Inspection and Test
Effort, in order to arrive at an estimate that can be compared to the PSP and ad hoc methods for
analytical purposes. In this case, it was decided to use an average of software cost models by
Boehm, Walston/Felix, Bailey/Basili, and Doty, as reported by McGibbon (1997). McGibbon’s
models output staff months, so it was necessary to transform their output into staff hours by
multiplying each software cost model output by 2,080/12, before averaging them. Since
Sommerville (1997) reports that 30% to 40% of software development effort is Testing, a
conservative 25% was removed from the software cost model estimates before averaging them.
This last transformation was necessary to remove validation cost built into each model.
Five Software Cost Models for Estimating Software Development Effort
Table 89
5.5 + 0.73 * KSLOC ^ 1.15
3 * KSLOC ^ 1.12
5.2 * KSLOC ^ 0.91
5.288 * KSLOC ^ 1.047
SLOC / 25
Software Cost Model Author
Rico (1998)
McGibbon (1997)
McGibbon (1997)
McGibbon (1997)
McGibbon (1997)
Source
Hays (1997)
Boehm
Walston/Felix
Bailey/Basili
Doty
Linear
Log-Linear
Log-Linear
Log-Linear
Log-Linear
Form
Hours
Months
Months
Months
Months
Output
Using Cost 212
Validation Hours. Validation Hours are the sum of estimated Review Hours and Test
Hours, representing the total validation effort for PSP, Inspection, and Testing, yielding 158,
2,167, 3,069, 4,160, 4,203, 4,514, and 8,360. There are two surprising elements of these
estimates, the unusually small total Validation Hours for the PSP, yielding an advantage of
nearly 22:1 in the PSP’s favor over Inspections, and a 53:1 PSP advantage over Testing. Ad hoc
methods are assumed to have no Validation Hours.
Maintenance Hours. Maintenance Hours are estimated to be the product of Released
Defects and Maintenance Hours/Defect, representing only the cost of eliminating software defect
populations estimated to have escaped elimination, primarily by Inspections, Testing, and ad hoc
methods, yielding 0, 8,333, 11,806, 16,000, 16,167, 17,361, 41,800, and 125,400. A study by
Ferguson, Humphrey, Khajenoori, Macke, and Matvya (1997) estimates that the PSP allows no
defects to escape, thus resulting in no software maintenance effort to remove residual software
defects. Inspection averages a phenomenally large 13,933 software maintenance hours to remove
residual software defects. This is the part of the equation that is dangerously ignored by
lightweight Testing methods such as those advocated by Asada and Yan (1998) or dealt with by
Testing alone, as in the case of Yamaura (1998). Ad hoc methods yield a seemingly astronomical
software maintenance cost of 125,400 hours. This study now begins to explode the contemporary
myth that high software process maturity is more expensive than low software process maturity
as Rico (1998) attempts to debunk SPI myths as well, and explode myths that SPI methods like
PSP and Inspections cost more than not using them at all.
Total Hours. Total Hours are estimated to be the sum of Development Hours, Validation
Hours, and Maintenance Hours, for the PSP, Inspections, Testing, and ad hoc methods, yielding
400, 15,588, 19,963, 25,248, 25, 458, 26,963, 55,248, and 130,488. Total Hours for the PSP are a

Using Cost 213
miniscule 400, compared to an average Inspection-based cost of 22,644 hours, for a 57:1 PSP
advantage. Total Testing-based Hours are 138X larger the PSP, and a surprisingly small 2.44X
larger than Inspection-based hours. Total ad hoc hours are 326X larger than PSP, 2.36X larger
than Testing-based hours, and 5.76X larger than Inspection-based hours.
QBreak Even/Ad Hoc. QBreak Even/Ad Hoc is estimated by dividing the Review Hours
or Testing Hours by the Maintenance Hours/Defect, which is based on estimating software
maintenance hours saved or avoided by applying the SPI methods, yielding 0.78 hours for the
PSP, 6.67 hours for Inspections, and 66.67 hours for Testing. QBreak Even/Ad Hoc is a special
software quality-based break even point algorithm, which derives its estimate based the number
of defects eliminated by a particular SPI method in order to pay for itself. PSP QBreak Even/Ad
Hoc was uniquely calculated by dividing its Review Hours by the average Inspection-based
Maintenance Hours/Defect, in order to have a normalizing effect for comparison to Inspection-
based QBreak Even/Ad Hoc. Otherwise, the PSP QBreak Even/Ad Hoc would appear rather
large, because the cost of PSP-based software maintenance is 63X lower than Inspection-based
software maintenance. QBreak Even/Ad Hoc is one of the single most interesting results yielded
by this study, because it averages a ridiculously low 14.4 hours. This means that after only 14
hours into the application of the PSP, Inspections, and Testing, each of these SPI methods have
already paid for themselves based on the QBreak Even/Ad Hoc algorithm. Let’s state this
another way, an organization could apply these methods without additional special funding and
come in under budget. Yet another contemporary myth surrounding the application of SPI
methods has been surprisingly and unexpectedly exploded or shattered by this study. While,
QBreak Even/Ad Hoc is a valid software quality-based model for break even analysis, it is
unconventional, demanding a more conventional break-even algorithm called PBreak Even.

Using Cost 214
PBreak Even/Ad Hoc. PBreak Even/Ad Hoc, signifying “productivity-based” break even
point, is estimated by dividing the investment in the higher productivity SPI method by the
difference in SPI method productivity, and multiplying the result by the product of the SPI
method productivity, as shown in Figure 31. This SPI break even point algorithm is a new
custom model created especially for this study, based on classical linear programming methods
as found in textbooks, such as those by Turban and Meridith (1994) and Garrison and Noreen
(1997). PBreak Even/Ad Hoc yields 6.15, 1.65, 1.72, 1.81, 1.81, 1.84, and 10.37 break even
SLOCs for SPI methods over ad hoc software development approaches. PSP’s PBreak Even/Ad
Hoc is 6.15 SLOCs, while Inspection-based development averages 1.77 SLOCs, and Testing-
based development needs to produce a mere 10.37 SLOCs before each of these SPI methods pay
for themselves, based on classical productivity analysis and data derived from Table 87. If it
Software Effort
Softw
are
Prod
uctiv
ity
Figure 31. Custom software process improvement (SPI) break even model.
SPI Method
SPI
Meth
od
Investment
Break Even Point
Break Even Point = Investment / Productivity Difference * Productivity Product

Using Cost 215
hasn’t started to sink in yet, these numbers are astonishingly low, given that three decade long
resistance to SPI methods is rooted in the myth and fallacy that SPI methods never pay for
themselves, and must be used at a loss in profit. The plain fact of the matter is that SPI method
benefits in quality and productivity can be invested in and achieved while still yielding an
excellent profit. SPI doesn’t seem to be the “long journey” that it once was believed to be
(Billings, Clifton, Kolkhorst, Lee, and Wingert, 1994).
PBreak Even/Test. PBreak Even/Test, once again, is estimated by dividing the investment
in the higher productivity SPI method by the difference in SPI method productivity, and
multiplying the result by the product of the SPI method productivity, as shown in Figure 31.
PBreak Even/Test yields 14.59, 4.79, 5.38, 6.33, 6.38, and 6.72 break even SLOCs for SPI
methods over Testing. PSP’s PBreak Even/Test is 14.59 SLOCs, while Inspection-based
development need only produce an average of 5.92 SLOCs before overtaking the benefits of
Testing alone. The reason the PSP and Inspection PBreak Even/Test rose slightly, but
insignificantly, is because of the increased productivity of Testing over ad hoc software
development approaches.
PBreak Even/Inspection. PBreak Even/Inspection is estimated by dividing the investment
in the higher productivity SPI method by the difference in SPI method productivity, and
multiplying the result by the product of the SPI method productivity, as shown in Figure 31.
PBreak Even/Inspection yields 35.96 break even SLOCs for PSP over an average of Inspection
productivity. The PSP need only produce 35.96 SLOCs before overtaking the benefits of
Inspection-based development alone. The reason the PSP PBreak Even/Inspection rose sharply,
but still insignificantly, is because of the increased productivity of Inspection over Testing. This
study has examined two break even point algorithms, one based on software quality and the other

Using Cost 216
based on productivity, yielding 19.5 SLOCs (0.78 PSP hours by 25 PSP SLOCs per Hour) for
the first and 35.96 SLOCs for the second. One of the reasons, other than being fundamentally
different ROI algorithms and approaches, is that QBreak Even doesn’t factor in initial SPI
method investment costs. All of these results are first-time findings yielded by this study. They
were not anticipated and were quite surprising. It took several months of effort to analyze the
preliminary findings and validate the results, which are likely, due to the fact that software
development isn’t a capital-intensive industry, like manufacturing.
Slope (Life Cycle Cost). Slope (Life Cycle Cost) is a linear model or equation
representing total software life cycle costs, estimated by dividing Software Size by Total Hours,
yielding 25, 0.64, 0.5, 0.4, 0.39, 0.37, 0.18, and 0.8, for each of the SPI methods (including ad
hoc). The larger the slope is, the higher the productivity. Larger slopes should always overtake
smaller slopes at some point in time. The trick is analyzing whether a higher productivity SPI
method will overtake lower productivity methods in a reasonable length of time. That is, before
the schedule expires. That doesn’t seem to be a problem with these SPI methods, as they
overtake the lower productivity ones in a matter of hours, not even days.
Y Intercept (w/Investment). Y Intercept (w/Investment) is a key term in a new linear
model or equation representing total software life cycle costs, factoring in initial SPI method
investment costs, yielding –2000, –12.19, –9.52, –7.53, –7.46, –7.05, and –14.12, for each of the
SPI methods (except ad hoc). The literal Y Intercept (w/Investment) equation is, (Slope (Life
Cycle Cost) – Slope (Life Cycle Cost) * (Investment * 2 + 1)) / 2. The higher the Y Intercept
(w/Investment) is, the higher the initial investment cost is and the later it will break even.
HBreak Even/Ad Hoc. HBreak Even/Ad Hoc determines the break even point in effort
for each SPI method over ad hoc approaches, estimated by dividing the sum of PBreak Even/Ad

Using Cost 217
Hoc and Y Intercept (w/Investment) by the Slope (Life Cycle Cost), yielding 80.25, 21.58,
22.43, 23.56, 23.61, 23.95, and 135.27 hours. Now we start getting to some meaningful numbers.
Again, HBreak Even/Ad Hoc represents the effort required to break even using each SPI method
over ad hoc approaches. PSP requires 80.25 hours of investment effort to break even, over ad
hoc approaches, based on total software life cycle costs. Be careful, not to mistakenly equate
HBreak Even/Ad Hoc with the initial investment effort itself. For instance, the initial investment
effort for PSP is 80 hours, while PSP HBreak Even/Ad Hoc is 80.25. The reason that the PSP
requires only 15 minutes more effort over its initial investment effort is because the PSP is a
highly productive SPI method, when total software life cycle costs are factored in. It is
conceivable that a SPI method could have a much longer HBreak Even/Ad Hoc because its
associated productivity is very low.
HBreak Even/Test. HBreak Even/Test determines the break even point in effort for each
SPI method over Test, estimated by dividing the sum of PBreak Even/Test and Y Intercept
(w/Investment) by the Slope (Life Cycle Cost), yielding 80.58, 26.47, 29.75, 34.99, 35.24, and
37.11 hours. Again, HBreak Even/Test represents the effort required to break even using each
SPI method over Test. PSP requires 80.58 hours of investment effort to break even, over Test
approaches, based on total software life cycle costs. See the previous paragraph for a caution on
interpreting this result.
HBreak Even/Inspection. HBreak Even/Inspection determines the break even point in
effort for PSP over Inspection, estimated by dividing the sum of PBreak Even/Inspection and Y
Intercept (w/Investment) by the Slope (Life Cycle Cost), yielding 81.44 hours. Again, HBreak
Even/Inspection represents the effort required to break even using PSP over Inspection. PSP
requires 81.44 hours of investment effort to break even, over Inspection approaches, based on

Using Cost 218
total software life cycle costs. PBreak Even/Inspection highlights an important point. Notice that
PBreak Even/Inspection is 35.96 while Hbreak Even/Inspection is 81.44. And, PBreak
Even/Inspection is 2.46X larger than PBreak Even/Test. However, HBreak Even/Inspection is
merely 1.01X larger than HBreak Even/Test. What this means is that for an additional 8.4
minutes of PSP effort, PSP not only breaks even over Test, but highly lauded Inspections as well.
ROI/Ad Hoc. ROI/Ad Hoc is estimated by subtracting Maintenance Hours for each SPI
method from Maintenance Hours for ad hoc methods and then dividing the result by Review
Hours or Test Hours, characterizing the difference as ROI, yielding 1,290:1, 234:1, 160:1, 113:1,
104:1, and 10:1. PSP’s ROI continues the trend of astonishing cost and benefit analysis, while
Inspections average a sobering 145:1 advantage over ad hoc methods, and Testing brings up the
rear with a 10:1 ratio. Inspections have carried an unjustifiable stigma as being too expensive to
implement, while this study shows that it costs more not to use Inspections than to use them.
Humphrey’s (2000) Team Software Process (TSP), one of the newest team-based software
quality methodologies continues to feature Inspections as the principal validation method.
ROI/Test. ROI/Test is estimated by subtracting Maintenance Hours for each SPI method
from Maintenance Hours for Testing and then dividing the result by Review Hours,
characterizing the difference as ROI, yielding 430:1, 67:1, 42:1, 27:1, 26:1, and 23:1. PSP’s
ROI/Test is an extremely high 430:1, barely justifying improvement of the Testing process
alone, while Inspections average a 37:1 ROI advantage over Testing.
ROI/Inspection. ROI/Inspection is estimated by subtracting PSP Maintenance Hours from
the average of Inspection-based Maintenance Hours and then dividing the result by PSP Review
Hours, characterizing the difference as ROI, yielding an ever impressive 143:1 PSP ROI
advantage over Inspections. The PSP still garners a seemingly astronomical ROI/Inspection.

Using Cost 219
Break Even Point Model
Eight software life cycle cost models and seven software life cycle cost models with
initial investment effort factored into them were designed for the seven SPI methods and ad hoc
approach, previously identified in the ROI model, for supporting graphical break even point
analyses (see Table 90).
While only an afterthought at first, minor break even analyses were initially performed.
However, initial break even analyses proved instrumental to understanding fundamental SPI
method costs and benefits, as well as management implications of implementing, and even not
implementing various SPI methods. The first approach was to conduct graphical break even
analyses. These attempts were initially inadequate and led to mathematical break even analyses,
and the formulation of QBreak Even. QBreak Even didn’t support classical break even analyses,
Graphical Break Even Point Analysis with Software Life Cycle Cost Models
Table 90
Method
Ad Hoc
Test
HP Inspection
Gilb Inspection
BNR Inspection
Basic Inspection
AT&T Inspection
PSP
Life Cycle Cost * Life Cycle Cost **
Yields effort in hours
SLOC / 0.39
SLOC / 0.18
SLOC / 0.37
SLOC / 0.40
SLOC / 0.08
SLOC / 0.64
SLOC / 0.50
SLOC / 25.0
Yields effort in hours (includes initial investment effort)*
**
(SLOC + 07.46) / 0.39
(SLOC + 14.12) / 0.18
(SLOC + 07.05) / 0.37
(SLOC + 07.53) / 0.40
(SLOC + 12.19) / 0.64
(SLOC + 09.52) / 0.50
(SLOC + 2000) / 25.0

Using Cost 220
because it didn’t factor in initial investment costs. This led to the formulation of PBreak Even,
which did factor in initial investment costs, calculating the number of units (SLOCs) that had to
be produced to break even. Further graphical analyses indicated that break even analyses were
somewhat inadequate and initially misinterpreted, leading to the formulation of HBreak Even.
HBreak Even, like PBreak Even factored in initial investment costs, calculating effort required to
break even. So, both mathematical and graphical break even analyses were instrumental to
identifying break even points, formulating break even algorithms and models, validating break
even analyses, and making correct interpretations. Graphical break even analyses using software
life cycle cost models identified in Table 90, that may now be considered the lynch pin of this
entire study—certainly the ROI model, are now illustrated.
Once again, graphical break even analysis proved infinitely valuable to finding some
initial problems in software life cycle cost model formulation, precision calibration in the
graphical analysis itself, and overall validation of PBreak Even and HBreak Even equations and
models. For instance, the axes on the graphs were initially formatted for display as whole
numbers without fractional or decimal portions. So, when the break-even points were circled and
identified, this simple technique pointed out multiple problems or errors. The graphical solution
didn’t match the mathematical solution. The second problem was with the software life cycle
cost models in Table 90. The cost models were placed there for a reason, to serve as the basis for
graphical analyses and solutions. That is, the cost models were exhibited in order to validate the
break even analysis model. But, when the cost models were exercised, they yielded incorrect
values. Without graphical analyses, it may have been difficult at best to identify mathematical
and interpretation errors. In fact, it was more of an iterative process of mathematical modeling,
graphical modeling, mathematical modeling, graphical modeling, and so on.

Using Cost 221
Test versus Ad Hoc. Testing-based SPI methods overtake ad hoc software development
after only 135.25 hours of effort (as shown in Figure 32). This is both surprising and perhaps
troubling to some. It’s surprising, because for large projects, little more than three staff weeks are
needed to both train Testers and have Testing pay for itself. For large projects, the Testing
HBreak Even/Ad Hoc more than justifies investment in sound Testing methodologies. For small
projects and websites, three staff weeks may just about consume an entire program’s cost. Keep
in mind, however, that this graph only represents a one-time “startup” cost. Once sound Testing
methodologies have been invested in, then Testing begins paying for itself after only one hour,
because its slope is greater than the slope of ad hoc approaches. Keep in mind, that this break
even analysis is only calibrated for the cost of one individual. None of the software life cycle
cost models were derived to input variable size organizational groups. It’s not to say that more
robust break even equations and models can’t be formulated. But, that the software life cycle
models in this study weren’t designed for that purpose. This would be a great independent study,
developing software life cycle cost models for variable organizational sizes. Once again, these
models were for analytical purposes, and are not currently scaleable for industrial use, as shown.
Figure 32. Test versus ad hoc graphical break even analysis.
130 131 132 133 134 135 136 137Effort in Hours
Sour
ce L
ines
of C
ode
(SLO
C) Test
Ad Hoc
10.0010.2010.4010.6010.80
8.608.809.009.209.409.609.80 10.37
Effort =
SLOC =
135.27
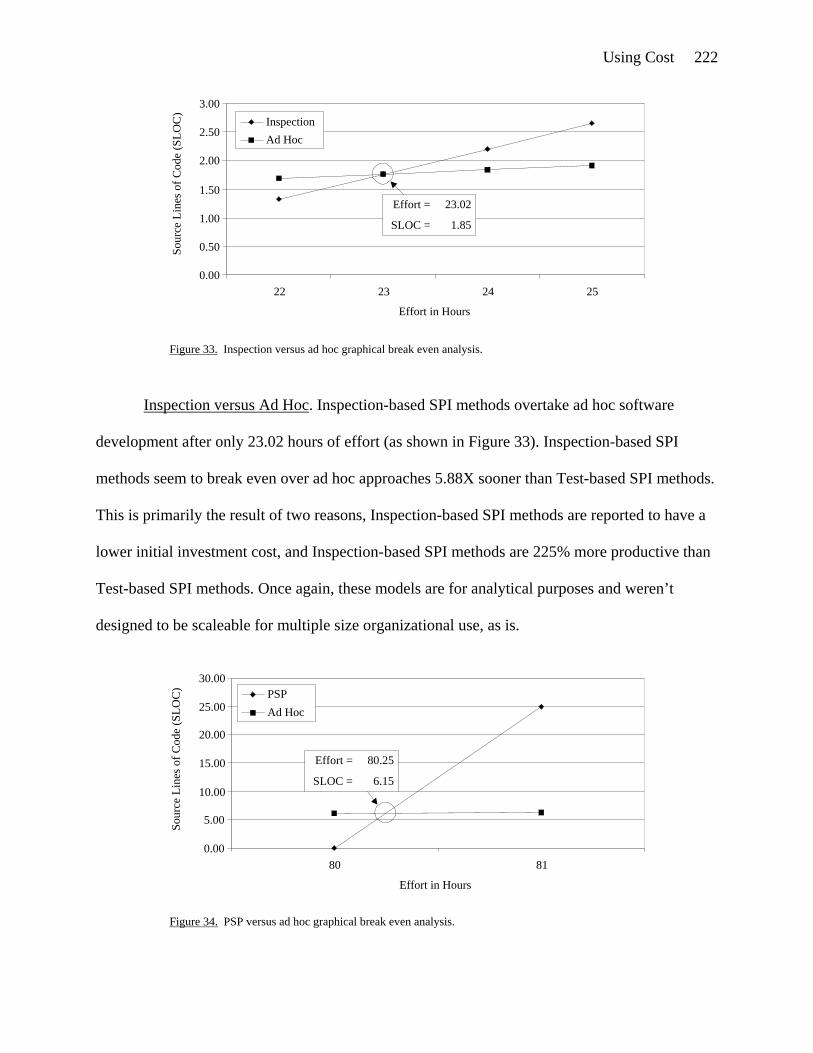
Using Cost 222
Inspection versus Ad Hoc. Inspection-based SPI methods overtake ad hoc software
development after only 23.02 hours of effort (as shown in Figure 33). Inspection-based SPI
methods seem to break even over ad hoc approaches 5.88X sooner than Test-based SPI methods.
This is primarily the result of two reasons, Inspection-based SPI methods are reported to have a
lower initial investment cost, and Inspection-based SPI methods are 225% more productive than
Test-based SPI methods. Once again, these models are for analytical purposes and weren’t
designed to be scaleable for multiple size organizational use, as is.
Figure 33. Inspection versus ad hoc graphical break even analysis.
22 23 24 25
Effort in Hours
Sour
ce L
ines
of C
ode
(SLO
C)
InspectionAd Hoc
0.00
0.50
1.00
1.50
2.00
2.50
3.00
1.85
Effort =
SLOC =
23.02
Figure 34. PSP versus ad hoc graphical break even analysis.
80 81
Effort in Hours
Sour
ce L
ines
of C
ode
(SLO
C) PSP
Ad Hoc
10.00
15.00
20.00
25.00
30.00
0.00
5.00
6.15
Effort =
SLOC =
80.25

Using Cost 223
PSP versus Ad Hoc. PSP-based SPI methods overtake ad hoc software development after
only 80.25 hours of effort (as shown in Figure 34). PSP-based SPI methods seem to break even
over ad hoc approaches 3.49X later than Inspection-based SPI methods, because initial PSP
investment costs are 4.21 times higher than those of Inspection. However, PSP is 54.35X more
productive than Inspection-based SPI methods. Once again, these models are for analytical
purposes and weren’t designed to be scaleable for multiple size organizational use, as is.
Inspection versus Test. Inspection-based SPI methods overtake Test-based SPI methods
after 32.71 hours of effort (as shown in Figure 35). Inspection-based SPI methods are 2.56X
more productive than Test-based SPI methods, though the graphical analysis doesn’t seem to
illustrate the disparity in productivity. This is probably because of the scale of the graph, with
increments of single digit hours and SLOCs. This graph doesn’t seem to have the dramatic
spread between productivity slopes, such as those exhibited by the PSP. However, 32.71 hours
are less than a single staff week, and are no less impressive for projects of all sizes, small,
medium, and large. Once again, these models are for analytical purposes and weren’t designed to
Figure 35. Inspection versus test graphical break even analysis
31 32 33 34
Effort in Hours
Sour
ce L
ines
of C
ode
(SLO
C)
InspectionTest
0.00
1.00
2.00
3.00
4.00
5.00
6.00
7.00
5.92
Effort =
SLOC =
32.71
Figure 35. Inspection versus test graphical break even analysis.
31 32 33 34
Effort in Hours
Sour
ce L
ines
of C
ode
(SLO
C)
InspectionTest
0.00
1.00
2.00
3.00
4.00
5.00
6.00
7.00
5.92
Effort =
SLOC =
32.71

Using Cost 224
be scaleable for multiple size organizational use, as is. Keep in mind that these break even point
models only factor in a one-time initial investment cost.
PSP versus Test. PSP-based SPI methods overtake Test-based SPI methods after 80.58
hours of effort, and then rapidly dwarf the productivity of Testing (as shown in Figure 36). Note
how flat the Testing-based productivity curve is, and how sharply pronounced the PSP
productivity curve is. PSP’s productivity 138.89X greater than that of Test’s productivity. Keep
in mind that the 80.58 hours of initial effort are only for one-time initial investment costs. PSP’s
associated productivity seems to make it the SPI method of choice. It’s hard to ignore the merits
Figure 36. PSP versus test graphical break even analysis.
80 81Effort in Hours
Sour
ce L
ines
of C
ode
(SLO
C) PSP
Test
10.00
15.00
20.00
25.00
30.00
0.00
5.00 14.59
Effort =
SLOC =
80.58
Figure 37. PSP versus inspection graphical break even analysis.
0.0080 81 82
Effort in Hours
Sour
ce L
ines
of C
ode
(SLO
C) PSP
Inspection
10.00
20.00
30.00
40.00
50.00
60.00
35.96
Effort =
SLOC =
81.44

Using Cost 225
of the PSP’s performance characteristics. Once again, these models are for analytical purposes,
and aren’t designed to be scaleable for multiple size organizational use.
PSP versus Inspection. Finally, PSP-based SPI methods overtake Inspection-based SPI
methods after 81.44 hours of effort, and then rapidly dwarf the productivity of Inspections, much
like PSP performs against Testing (as shown in Figure 37). But, then remember how close the
Inspection and Test graphs were in Figure 35. Once again, note how flat the Inspection-based
productivity curve is, and how sharply pronounced the PSP productivity curve is. PSP’s
productivity 54.35X greater than that of Inspection’s productivity. Keep in mind that the 81.44
hours of initial effort are only for one-time initial investment costs. And finally don’t forget,
these models are for analytical purposes, and aren’t designed to be scaleable for multiple size
organizational use.

Using Cost 226
Cost and Benefit Model
The Cost and Benefit Model is a composite summary of economic analyses as a result of
analyzing the eight SPI strategies, PSP, Clean Room, Reuse, Defect Prevention, Inspections,
Testing, CMM, and ISO 9000 (as shown in Table 91).
As explained in the Methodology introduction, the Cost and Benefit Model is a complex
composite of multiple models, most notably the Costs and Benefits of Alternatives (appearing
later in this section), Break Even Point Model, Return-on-Investment Model, and ultimately the
Defect Removal Model. The Cost and Benefit Model, as carefully explained throughout the
Methodology, is also composed of a complex network of predictive empirical statistical
parametric cost estimation models. And, of course, the Cost and Benefit Model is composed of
empirically based costs and benefits extracted or derived from authoritative studies.
The results of Table 91 will be addressed by the Data Analysis chapter, and won’t be
explained in detail here. However, differences between best and worst performers include
1,432X for Break Even Hours, 175X for Training Hours/Person, 40X for Training Cost/Person,
236X for Effort (Hours), 144X for Cycle Time Reduction, 97X for Productivity Increase, 59X
for Quality Increase, and 430X for Return-on-Investment.
Costs and Benefits of Eight Software Process Improvement (SPI) Strategies
Table 91
PSP Cleanroom Reuse Prevent Inspect Test CMM ISO Average
Breakeven Hours 80 53 8,320 527 7 3,517 10,021 4,973 3,437Training Hours/Person 80 201 3,316 31 19 78 227 64 502Training Cost/Person $7,456 $8,089 $298,440 $5,467 $1,794 $13,863 $12,668 $9,475 $44,656Effort (Hours) 400 3,245 16,212 2,100 836 37,510 94,417 53,800 26,065Cycle Time Reduction 164.03x 3.53x 3.69x 1.69x 5.47x 6.15x 2.99x 1.14x 23.58xProductivity Increase 109.49x 4.27x 2.70x 1.88x 5.47x 6.15x 2.92x 1.13x 16.75xQuality Increase 253.62x 42.22x 4.33x 4.77x 9.00x 5.75x 4.55x 12.44x 42.09xReturn-on-Investment 1,290:1 27:1 3:1 75:1 133:1 9:1 6:1 4:1 193:1

Using Cost 227
Personal Software Process (PSP). Data for the PSP primarily came from six authoritative
sources (as shown in Table 92), the ROI model (Table 87), Carnegie Mellon University (1999),
Ferguson, Humphrey, Khajenoori, Macke, and Matvya (1997), Webb and Humphrey (1999),
Hays and Over (1997), and the Software Engineering Institute (1998). The ROI model yielded
Breakeven Hours of 80.25. The Software Engineering Institute reports that it takes 80 Training
Hours/Person of training for PSP courses I and II, 40 hours each. Training Cost/Person comes
from two sources, $13,917 from the Software Engineering Institute and $995 from Carnegie
Mellon University, for an average of $7,496. The ROI model yielded Effort (Hours) of 400,
based on an input of 10,000 source lines of code (SLOC) into Rico’s (1998) PSP cost model,
which was derived from Hays’ and Over’s study. A Cycle Time Reduction of 326.22X was
convincingly yielded by the ROI model, and 1.85 Hours was reported by Motorola in a study by
Ferguson, Humphrey, Khajenoori, Macke, and Matvya, for an average of 164.03X. A
Productivity Increase of 326.22X, once again, was yielded by the ROI model, while AIS reported
a 1.07X Productivity Increase in a study by Ferguson, Humphrey, Khajenoori, Macke, and
Matvya, and Webb and Humphrey came up with a 1.19 Productivity Increase, for an average of
109.49X. A 1,000X Quality Increase was determined by the ROI Model, AIS reported a
Costs and Benefits of Personal Software Process (PSP)
Table 92
ROI Model CMU AIS Motorola Webb Hays SEI Average
Breakeven Hours 80.25 80.25Training Hours/Person 80 80Training Cost/Person $995 $13,917 $7,456Effort (Hours) 400 400Cycle Time Reduction 326.22x 1.85x 164.03xProductivity Increase 326.22x 1.07x 1.19x 109.49xQuality Increase 1,000.00x 4.47x 1.62x 8.40x 253.62xReturn-on-Investment 1,290:1 1,290:1

Using Cost 228
respectable 4.47X Quality Increase, Webb and Humphrey came up with 1.62X, and Hays and
Over had a convincing finding of an 8.4X Quality Increase, for an average of 253.62X. Finally,
the ROI model yielded a phenomenal ROI of 1,290:1. The reason that such a large disparity
exists between the ROI model and the authoritative independent studies is because the ROI
model responsibly calculates total life cycle costs, including software maintenance, while the
other studies merely report development cycle attributes.
Clean Room Methodology. As mentioned earlier, data for Clean Room primarily came
from four sources (as shown in Table 93), or Rosetta Stones as previously stated, McGibbon
(1996), Kaplan, Clark, and Tang (1995), Prowell, Trammell, Linger, and Poor (1999), and
Cleanroom Software Engineering (1996). McGibbon and Kaplan, Clark, and Tang reported
approximate Cleanroom Breakeven Hours of 42 and 64, for an average of 53 hours. Training
Hours/Person were a quite diverse 318 and 84, as reported by the same two studies, for an
average of 201. McGibbon’s training hours were based on a study by the U.S. Army’s Life Cycle
Software Engineering Center at Picatinny Arsenal, New Jersey. Training Cost/Person comes to
$12,398 and $3,780, for an average of $8,089, based on the same two studies. McGibbon
Costs and Benefits of Clean Room Methodology
Table 93
McGibbon Kaplan Prowell CSR Average
Breakeven Hours 42 64 53Training Hours/Person 318 84 201Training Cost/Person $12,398 $3,780 $8,089Effort (Hours) 3,245 3,245Cycle Time Reduction 3.53x 3.53xProductivity Increase 3.53x 5.00x 4.27xQuality Increase 100.00x 16.67x 10.00x 42.22xReturn-on-Investment 33:1 20:1 27:1
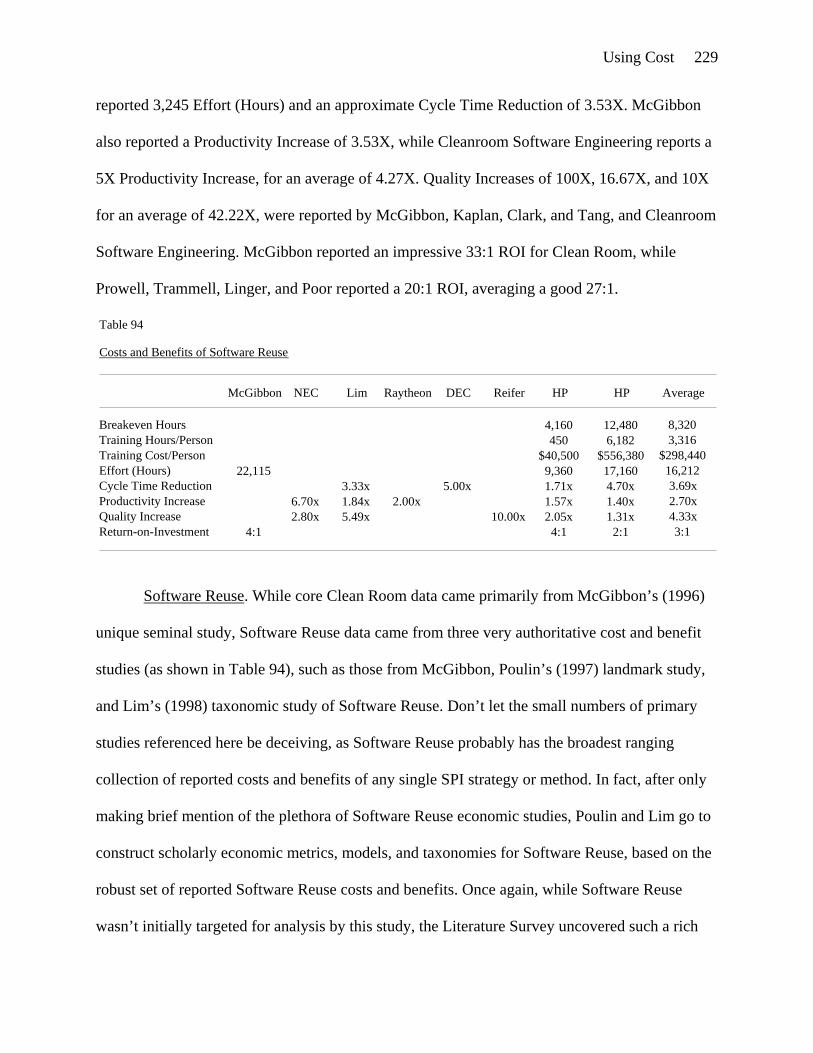
Using Cost 229
reported 3,245 Effort (Hours) and an approximate Cycle Time Reduction of 3.53X. McGibbon
also reported a Productivity Increase of 3.53X, while Cleanroom Software Engineering reports a
5X Productivity Increase, for an average of 4.27X. Quality Increases of 100X, 16.67X, and 10X
for an average of 42.22X, were reported by McGibbon, Kaplan, Clark, and Tang, and Cleanroom
Software Engineering. McGibbon reported an impressive 33:1 ROI for Clean Room, while
Prowell, Trammell, Linger, and Poor reported a 20:1 ROI, averaging a good 27:1.
Software Reuse. While core Clean Room data came primarily from McGibbon’s (1996)
unique seminal study, Software Reuse data came from three very authoritative cost and benefit
studies (as shown in Table 94), such as those from McGibbon, Poulin’s (1997) landmark study,
and Lim’s (1998) taxonomic study of Software Reuse. Don’t let the small numbers of primary
studies referenced here be deceiving, as Software Reuse probably has the broadest ranging
collection of reported costs and benefits of any single SPI strategy or method. In fact, after only
making brief mention of the plethora of Software Reuse economic studies, Poulin and Lim go to
construct scholarly economic metrics, models, and taxonomies for Software Reuse, based on the
robust set of reported Software Reuse costs and benefits. Once again, while Software Reuse
wasn’t initially targeted for analysis by this study, the Literature Survey uncovered such a rich
Costs and Benefits of Software Reuse
Table 94
McGibbon NEC Lim Raytheon DEC Reifer HP HP Average
Breakeven Hours 4,160 12,480 8,320Training Hours/Person 450 6,182 3,316Training Cost/Person $40,500 $556,380 $298,440Effort (Hours) 22,115 9,360 17,160 16,212Cycle Time Reduction 3.33x 5.00x 1.71x 4.70x 3.69xProductivity Increase 6.70x 1.84x 2.00x 1.57x 1.40x 2.70xQuality Increase 2.80x 5.49x 10.00x 2.05x 1.31x 4.33xReturn-on-Investment 4:1 4:1 2:1 3:1

Using Cost 230
availability of cost and benefit data that the economic characteristics of Software Reuse couldn’t
be ignored, and had to be included in the final analysis. Lim starts off the Software Reuse cost
and benefit survey by reporting Breakeven Hours for two Hewlett Packard divisions of $4,160
and $12,480, averaging $8,320. Lim also reports Training Hours/Person of $450 and $6,182, for
an average of $3,316. Lim also provides one of the most in-depth studies and analyses of
Training Cost/Person, at a whopping $40,500 and $556,380, averaging an uncomfortably high
$298,440. McGibbon and Lim report Effort (Hours) of 22,115, 9,360, and 17,160, for an average
of 16,212. A modest 3.33X and 5X Cycle Time Reduction, averaging 3.69X, is reported by Lim
and Poulin. A broader array of Productivity Increases are reported by Poulin and Lim, including
6.7X, 1.84X, 2X, 1.57X, and 1.4X, for a relatively flat Productivity Increase average of 2.7X.
Quality Increases of 2.8X, 5.49X, 2.05X, and 1.31X, are also revealed by Poulin and Lim,
averaging 2.7X. But, probably the most surprisingly low performance indicators were ROI data
of 4:1, 4:1, and 2:1, averaging a convicting 3:1 ROI for Software Reuse.
Defect Prevention Process. Data for Defect Prevention came from a six excellent sources
(as shown in Table 95), Kaplan, Clark, and Tang (1995), Gilb (1993), Mays, Jones, Holloway,
and Studinski (1990), Humphrey (1989), Grady (1997), Kajihara (1993), and Latino and Latino
Costs and Benefits of Defect Prevention Process
Table 95
Kaplan Gilb Mays Humphrey Grady Kajihara Latino Latino Average
Breakeven Hours 1,560 10 11 527Training Hours/Person 12 40 40 31Training Cost/Person $900 $7,500 $8,000 $5,467Effort (Hours) 4,680 1,625 1,747 347 2,100Cycle Time Reduction 2.00x 1.37x 1.69xProductivity Increase 2.00x 1.76x 1.88xQuality Increase 2.00x 2.17x 4.55x 4.00x 10.00x 7.00x 3.67x 4.77xReturn-on-Investment 7:1 40:1 179:1 75:1

Using Cost 231
(1999). Mays, Jones, Holloway, and Studinski were the seminal source for works by Kaplan,
Clark, and Tang, Gilb, and Humphrey. Kajihara was an original piece coming from the world-
class software laboratories of NEC in Japan. And, finally Latino and Latino is one of the newest
and comprehensive examinations of the dynamics of Defect Prevention, what they call Root
Cause Analysis (RCA), including highly structured economic analyses of Defect Prevention. All
in all, though Defect Prevention was initially perceived to be sorely lacking in data, it turned out
to be a strong SPI method or strategy for cost and benefit analysis. Kaplan, Clark, and Tang,
Gilb, and Mays reported Breakeven Hours of 1,560, 10, and 11, averaging 527 hours. Training
Hours/Person were 12, 40, and 40, averaging 31, as reported by Kaplan, Clark, and Tang, and
Latino and Latino. Once again, this duo reported Training Cost/Person to be $900, $7,500, and
$8,000, for an average cost of $5,467. Kaplan, Clark, and Tang, Gilb, Mays, Jones, Holloway,
and Studinski, and Latino and Latino, reported a wide variety of Effort (Hours), including 4,680,
1,625, 1,747, and 347, averaging 2,100. Two sources, Mays, Jones, Holloway, and Studinski,
and Grady reported Cycle Time Reductions of 2X and 1.37X, averaging a modest 1.69X.
Productivity Increases of 2X and 1.76X, for another modest average of 1.88X, were reported by
Mays, Jones, Holloway, and Studinski, and included Kajihara this time. The most commonly
reported Defect Prevention results were reported for Quality Increase, by Kaplan, Clark, Tang,
Mays, Jones, Holloway, and Studinski, Humphrey, Grady, Kajihara, and Latino and Latino. They
ganged up to report seemingly small Quality Increases of 2X, 2.17X, 4.55X, 4X, 10X, 7X, and
3.67X, averaging 4.77X. ROI came from two principle sources, Gilb and Latino and Latino,
reporting 7:1, 40:1, and 179:1. Latino and Latino gave the most convincing accounts of ROI
associated with Defect Prevention, and were a late addition to this study.

Using Cost 232
Software Inspection Process. Cost and benefit data for Inspections came from eight solid
sources (as shown in Table 96), McGibbon (1996), Fagan (1986), Barnard and Price (1994),
Rico (1993), the ROI Model (Table 87), Russell (1991), Gilb (1993), and Grady (1997). The
most significant contributors to Inspection cost and benefit data were the ROI model designed
for this study, which was unexpected, and Grady’s excellent text on SPI showing total Inspection
savings of better than $450 million. The ROI model yielded a convincing Breakeven Hours
average of 7 for Inspection cost models by Barnard and Price, Rico, Russell, Gilb, and Grady.
Training Hours/Person primarily came from McGibbon, Fagan, and Gilb, reporting 12, 24, and
20, for an insignificant average of 19. The same three sources reported a Training Cost/Person of
$468, $2,800, and $2,114, averaging $1,794. Barnard and Price, Rico, Russell, Gilb, and Grady
reported Effort (Hours) of 500, 708, 960, 970, and 1,042, for a modest average of 836. A flat
Cycle Time Reduction and Productivity Increase of 5.47X was the average of 1.55X, 6.77X,
8.37X, 6.54X, 5.17X, 5.13, and 4.84X, from all seven sources. Quality Increase was a uniform
9X from all sources other than McGibbon and Fagan as primarily derived from the ROI model.
And lastly, McGibbon, Barnard and Price, Rico, Russell, Gilb, and Grady reported relatively
high ROI figures of 72:1, 234:1, 160:1, 114:1, 113:1, and 104:1, averaging a solid 133:1.
Costs and Benefits of Software Inspection Process
Table 96
McGibbon Fagan AT&T ROI Model BNR Gilb HP Average
Breakeven Hours 7 7 7 7 7 7Training Hours/Person 12 24 20 19Training Cost/Person $468 $2,800 $2,114 $1,794Effort (Hours) 500 708 960 970 1,042 836Cycle Time Reduction 1.55x 6.67x 8.37x 6.54x 5.17x 5.13x 4.84x 5.47xProductivity Increase 1.55x 6.67x 8.37x 6.54x 5.17x 5.13x 4.84x 5.47xQuality Increase 9.00x 9.00x 9.00x 9.00x 9.00x 9.00xReturn-on-Investment 72:1 234:1 160:1 114:1 113:1 104:1 133:1

Using Cost 233
Software Test Process. Cost and benefits for Testing came from seven sources (as shown
in Table 97), the ROI model (Table 87), Farren and Ambler (1997), Rice (1999), Yamaura
(1998), Graham (1999), Ehrlich, Prasanna, Stampfel, and Wu (1993), and Asada and Yan (1998).
Breakeven Hours were reported to be 135, 5,400, and 5,017 by the ROI model, Ehrlich,
Prasanna, Stampfel, and Wu, and Asada and Yan, averaging 3,517. Rice and Graham reported
extensive Training Hours/Person to be 84 and 72, averaging 78, as input into the ROI model.
Training Cost/Person was subsequently derived from Rice and Graham, being $16,800 and
$10,926, for an average of $13,863. Effort (Hours) were quite high at 8,360, 54,000, and 50,170,
as reported or derived by the ROI model, Ehrlich, Prasanna, Stampfel, and Wu, and Asada and
Yan, averaging an astronomical 37,510. Cycle Time Reduction and Productivity Increase were
both computed to be 2.36X, 5X, 3.37X, 10X, and 10X, averaging 6.15X, by the ROI model,
Farren and Ambler, Yamaura, Ehrlich, Prasanna, Stampfel, and Wu, and Asada and Yan. Quality
Increase is 3X, 2X, 9X, and 9X, for an average of 5.75X, as reported by the ROI model, Farren
and Ambler, Ehrlich, Prasanna, Stampfel, and Wu, and Asada and Yan. Finally, the same sources
yield 10:1, 5:1, 10:1, and 10:1, for a respectable average ROI of 9:1 for Testing.
Costs and Benefits of Software Test Process
Table 97
ROI Model Farren Rice Yamaura Graham Ehrlick Asada Average
Breakeven Hours 135 5,400 5,017 3,517Training Hours/Person 84 72 78Training Cost/Person $16,800 $10,926 $13,863Effort (Hours) 8,360 54,000 50,170 37,510Cycle Time Reduction 2.36x 5.00x 3.37x 10.00x 10.00x 6.15xProductivity Increase 2.36x 5.00x 3.37x 10.00x 10.00x 6.15xQuality Increase 3.00x 2.00x 9.00x 9.00x 5.75xReturn-on-Investment 10:1 5:1 10:1 10:1 9:1

Using Cost 234
Capability Maturity Model (CMM). Cost and benefit data for the CMM came from seven
of the most authoritative sources thus far (as shown in Table 98), Herbsleb, Carleton, Rozum,
Siegel, and Zubrow (1994), Putnam (1993), Haskell, Decker, and McGarry (1997), Vu (1998),
Diaz and Sligo (1997), Haley (1996), and Jones (1997a). Breakeven Hours are reported to be
2,318, 345, 1,092, and 36,330 by Herbsleb, Carleton, Rozum, Siegel, and Zubrow, Haskell,
Decker, and McGarry, Diaz and Sligo, and Jones, for an average of 10,021. Training
Hours/Person came out to be 64 and 389, according to Herbsleb, Carleton, Rozum, Siegel, and
Zubrow and Jones, for an average of 227. The same two sources reported Training Cost/Person
to be $9,820 and $15,516 for an average of $12,668. Herbsleb, Carleton, Rozum, Siegel, and
Zubrow, Haskell, Decker, and McGarry, Diaz and Sligo, and Jones report Effort (Hours) to be
around 23,184, 3,450, 10,920, and 363,298, for a rather large average of 94,417. According to
Herbsleb, Carleton, Rozum, Siegel, and Zubrow, Putnam, Vu, Diaz and Sligo, Haley, and Jones,
Cycle Time Reduction is 1.85X, 7.46X, 1.75X, 2.7X, 2.9X, and 1.26X, averaging 2.99X. The
same researchers and studies report Productivity Increase to be 2.89X, 7.46X, 2.22X, 0.80X,
2.9X, 1.26X, averaging 2.92X. And, once again, this same group reports Quality Increase to be
3.21X, 8.25X, 5X, 2.17X, 3X, and 5.68X, for a noticeable average of 4.55X. Only, Herbsleb,
Costs and Benefits of Capability Maturity Model (CMM)
Table 98
Herbsleb Putnam Haskell Vu Diaz Haley Jones Average
Breakeven Hours 2,318 345 1,092 36,330 10,021Training Hours/Person 64 389 227Training Cost/Person $9,820 $15,516 $12,668Effort (Hours) 23,184 3,450 10,920 363,298 94,417Cycle Time Reduction 1.85x 7.46x 1.75x 2.70x 2.90x 1.26x 2.99xProductivity Increase 2.89x 7.46x 2.22x 0.80x 2.90x 1.26x 2.92xQuality Increase 3.21x 8.25x 5.00x 2.17x 3.00x 5.68x 4.55xReturn-on-Investment 5:1 4:1 8:1 6:1Years to SEI Level 3 3.50 7.00 5.00 3.00 7.00 3.56 4.84
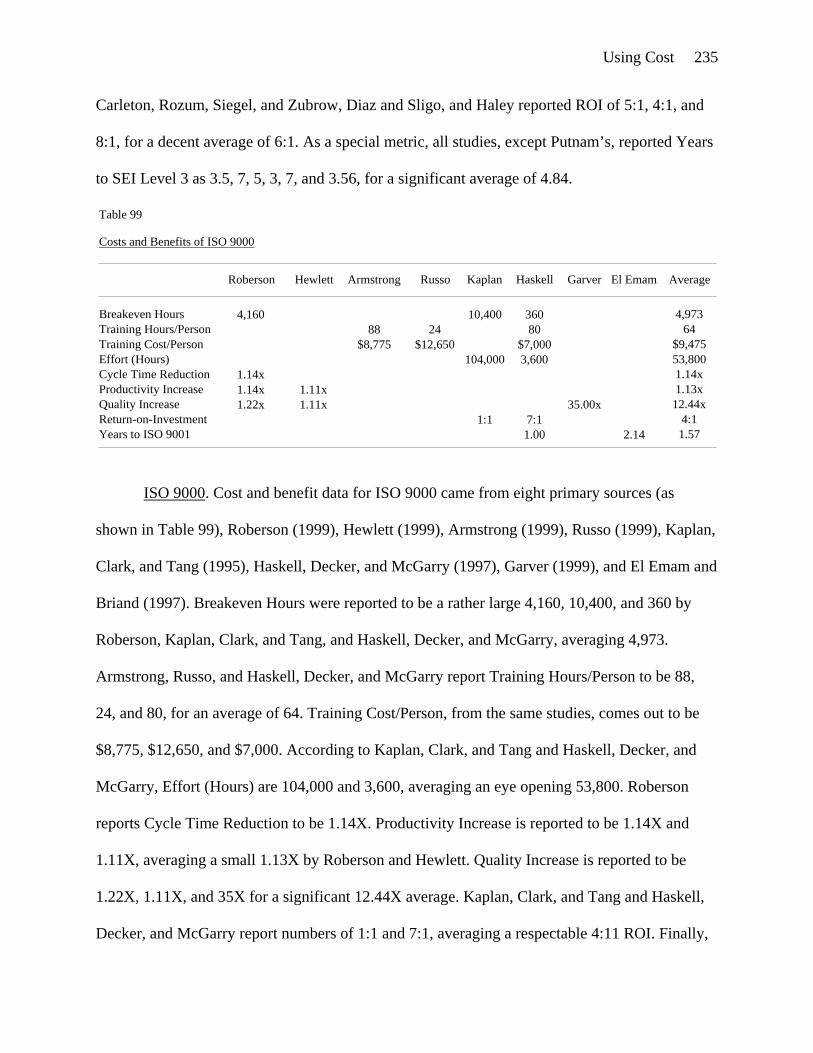
Using Cost 235
Carleton, Rozum, Siegel, and Zubrow, Diaz and Sligo, and Haley reported ROI of 5:1, 4:1, and
8:1, for a decent average of 6:1. As a special metric, all studies, except Putnam’s, reported Years
to SEI Level 3 as 3.5, 7, 5, 3, 7, and 3.56, for a significant average of 4.84.
ISO 9000. Cost and benefit data for ISO 9000 came from eight primary sources (as
shown in Table 99), Roberson (1999), Hewlett (1999), Armstrong (1999), Russo (1999), Kaplan,
Clark, and Tang (1995), Haskell, Decker, and McGarry (1997), Garver (1999), and El Emam and
Briand (1997). Breakeven Hours were reported to be a rather large 4,160, 10,400, and 360 by
Roberson, Kaplan, Clark, and Tang, and Haskell, Decker, and McGarry, averaging 4,973.
Armstrong, Russo, and Haskell, Decker, and McGarry report Training Hours/Person to be 88,
24, and 80, for an average of 64. Training Cost/Person, from the same studies, comes out to be
$8,775, $12,650, and $7,000. According to Kaplan, Clark, and Tang and Haskell, Decker, and
McGarry, Effort (Hours) are 104,000 and 3,600, averaging an eye opening 53,800. Roberson
reports Cycle Time Reduction to be 1.14X. Productivity Increase is reported to be 1.14X and
1.11X, averaging a small 1.13X by Roberson and Hewlett. Quality Increase is reported to be
1.22X, 1.11X, and 35X for a significant 12.44X average. Kaplan, Clark, and Tang and Haskell,
Decker, and McGarry report numbers of 1:1 and 7:1, averaging a respectable 4:11 ROI. Finally,
Costs and Benefits of ISO 9000
Table 99
Roberson Hewlett Armstrong Russo Kaplan Haskell Garver El Emam Average
Breakeven Hours 4,160 10,400 360 4,973Training Hours/Person 88 24 80 64Training Cost/Person $8,775 $12,650 $7,000 $9,475Effort (Hours) 104,000 3,600 53,800Cycle Time Reduction 1.14x 1.14xProductivity Increase 1.14x 1.11x 1.13xQuality Increase 1.22x 1.11x 35.00x 12.44xReturn-on-Investment 1:1 7:1 4:1Years to ISO 9001 1.00 2.14 1.57

Using Cost 236
Haskell, Decker, and McGarry were able to get a CSC unit ISO 9000 Registered after only one
year, while El Emam and Brian find an average of 2.14 years for ISO 9000 Registration.

Using Cost 237
DATA ANALYSIS
This Chapter sets forth to analyze, evaluate, and interpret the results of the Methodology,
primarily the Cost and Benefit Model depicted by Table 91, which was identified as a key part of
satisfying the objectives of this study. The Data Analysis will provide the reader with an
interpretive analysis of the costs and benefits of the eight SPI strategies, PSP, Clean Room,
Reuse, Defect Prevention, Inspection, Testing, CMM, and ISO 9000 (as shown in Table 100).
Table 100 normalizes the Cost and Benefit Criteria values for each of the eight SPI
strategies against one another, based on the raw data in Table 91. While the raw cost and benefit
data in Table 91 is interesting and useful, normalized representations of the data will aid in rapid
comprehension and interpretive analysis of the costs and benefits of the eight SPI strategies.
Since costs are considered undesirable, normalization for the costs was computed by inverting
the raw criterion value divided by the sum of all the values for the given criterion, and
multiplying the result by 10. Since benefits are considered desirable, normalization for the
benefits was computed by dividing the raw criterion value by the sum of all the values for the
given criterion, and multiplying the result by 10. The normalization technique, as described here,
yields a table populated with uniform data values between 0 and 10, for rapid comprehension and
Normalized Costs and Benefits of Eight Strategies
Table 100
PSP Cleanroom Reuse Prevent Inspect Test CMM ISO Average
Breakeven Hours 9.97 9.98 6.97 9.81 10.00 8.72 6.36 8.19 8.75Training Hours/Person 9.80 9.50 1.74 9.92 9.95 9.81 9.44 9.84 8.75Training Cost/Person 9.79 9.77 1.65 9.85 9.95 9.61 9.65 9.73 8.75Effort (Hours) 9.98 9.84 9.22 9.90 9.96 8.20 5.47 7.42 8.75Cycle Time Reduction 8.69 0.19 0.20 0.09 0.29 0.33 0.16 0.06 1.25Productivity Increase 8.17 0.32 0.20 0.14 0.41 0.46 0.22 0.08 1.25Quality Increase 7.53 1.25 0.13 0.14 0.27 0.17 0.14 0.37 1.25Return-on-Investment 8.34 0.17 0.02 0.49 0.86 0.06 0.04 0.03 1.25
72.28 41.03 20.13 40.34 41.68 37.35 31.46 35.73

Using Cost 238
analysis. Low numbers are considered poor, and high numbers are considered better. The
criterion values for each SPI strategy were also summed vertically, in order to yield an overall
score that could be used for comparing the SPI strategies themselves very simply.
Several preliminary results seem to be evident from Table 100 and Figure 38, little
variation seems to exist between costs, and wide disparity exists between the benefits. The PSP
scores values near ten for each of its costs and scores near eight and nine for each of its benefits.
Clean Room scored near ten for each of its costs, but scored well under one for each of its
benefits. Reuse scored the worst for cost and near zero for its benefits. Defect Prevention scored
extremely well for its costs, but surprisingly low for its benefits. Inspection scored the only ten
for costs or benefits, scoring around 0.5 for most of its benefits. Test also scored well for costs
and low for benefits. CMM scored moderately for cost and low for benefits. ISO 9000 scored
well for costs, but probably worst for benefits. Several results became immediately visible from
these analyses, costs, at least identified by this study don’t seem to be a differentiator, and the
PSP benefits seem to dwarf the benefits of the other seven SPI strategies.
Figure 38. Normalized costs and benefits of eight strategies.
0.00
2.00
4.00
6.00
8.00
10.00
12.00
PSP Cleanroom Reuse Prevent Inspect Test CMM ISO
Software Process Improvement (SPI) Strategy
Nor
mal
ized
/Unw
eigh
ted
Scor
es
Breakeven Hours
Training Hours/Person
Training Cost/PersonEffort (Hours)
Cycle Time Reduction
Productivity Increase
Quality IncreaseReturn-on-Investment

Using Cost 239
Cost/Benefit-Based Comparison of Alternatives
A composite graph averaging all of the costs and benefits together for each SPI strategy
and then comparing them to one another seems to yield some useful comparative analyses (as
shown in Figure 39).
Overall, this analysis seems to indicate uniformity in the average costs and benefits for
each SPI strategy, and may mislead one to assert that any SPI strategy is the right one. Table
100, Figure 38, and later analyses will reveal that the seeming uniformity in costs and benefits is
largely due to the homogeneity of the costs, and any differentiation is due to disparity in the
benefits. This analysis reveals a modest factor of 3.59X between the best and worst performer,
PSP and Reuse. Aside from PSP, the difference between the best and worst performer is a factor
of 2X, Inspection and Reuse. The overall costs and benefits of Clean Room, Defect Prevention,
Inspection, Test, CMM, and ISO 9000 seem to be surprisingly uniform. Following is a closer
look at each of the individual criterion, in order to highlight differentiation between costs and
benefits for each of the SPI strategies.
Figure 39. Average costs and benefits of eight strategies.
0.00
10.00
20.00
30.00
40.00
50.00
60.00
70.00
80.00
PSP Cleanroom Reuse Prevent Inspect Test CMM ISO
Software Process Improvement (SPI) Strategy
Cum
ulat
ive/
Nor
mal
ized
/Unw
eigh
ted
Scor
es

Using Cost 240
Breakeven Hours. Normalized values for Breakeven Hours range from six to near ten for
as many as four of the SPI strategies (as shown in Figure 40). Breakeven Hours from left to right
are 9.97, 9.98, 6.97, 9.81, 10, 8.72, 6.36, and 8.19, for an average of 8.75. Inspection is the best
and CMM is the worst in this analysis. The difference between best and worst is a factor of
1.43X.
Figure 40. Breakeven hours comparison of eight strategies.
0.00
2.00
4.00
6.00
8.00
10.00
12.00
PSP Cleanroom Reuse Prevent Inspect Test CMM ISO
Software Process Improvement (SPI) Strategies
Bre
akev
en H
ours
(Nor
mal
ized
/Unw
eigh
ted)
Figure 41. Training hours/person comparison of eight strategies.
0.00
2.00
4.00
6.00
8.00
10.00
12.00
PSP Cleanroom Reuse Prevent Inspect Test CMM ISO
Software Process Improvement (SPI) Strategy
Trai
niin
g H
ours
/Per
son
(Nor
mal
ized
/Unw
eigh
ted)

Using Cost 241
Training Hours/Person. Normalized values for Training Hours/Person range from just
under two to near ten for as many as seven of the SPI strategies (as shown in Figure 41).
Training Hours/Person from left to right are 9.8, 9.5, 1.74, 9.92, 9.95, 9.81, 9.44, and 9.84, for an
average of 8.75. Inspection is the best and Reuse is the worst in this analysis. The difference
between best and worst is a factor of 5.72X.
Training Cost/Person. Normalized values for Training Cost/Person once again range from
just under two to near ten for as many as seven of the SPI strategies (as shown in Figure 42).
Training Cost/Person from left to right is 9.79, 9.77, 1.65, 9.85, 9.95, 9.61, 9.65, and 9.73, for an
average of 8.75. Once again, Inspection is the best and Reuse is the worst in this analysis. The
difference between best and worst is a factor of 6.03X. The technique of collecting consultant
costs for both Training Hours/Person and Training Cost/Person was most likely responsible for
the uniformity in most of the values, as well as the disparity in the case of Reuse. Consulting
costs seem to be relatively uniform, despite the SPI strategy, for competitive reasons, while
Reuse costs were derived from McGibbon’s (1996) study factoring in life cycle considerations.
Figure 42. Training cost/person comparison of eight strategies.
0.00
2.00
4.00
6.00
8.00
10.00
12.00
PSP Cleanroom Reuse Prevent Inspect Test CMM ISO
Software Process Improvement (SPI) Strategy
Trai
ning
Cos
t/Per
son
(Nor
mal
ized
/Unw
eigh
ted)

Using Cost 242
Effort (Hours). Normalized values for Effort (Hours) range from around five to near ten
for as many as four of the SPI strategies (as shown in Figure 43). Effort (Hours) from left to right
are 9.98, 9.84, 9.22, 9.9, 9.96, 8.2, 5.47, and 7.42, for an average of 8.75. PSP is the best and
CMM is the worst in this analysis. The difference between best and worst is a factor of 1.82X.
This normalization technique seems to be hiding some significant differentiation between
criterion values, so the raw values in Table 91 should be analyzed and compared as well.
Figure 43. Effort (hours) comparison of eight strategies.
0.00
2.00
4.00
6.00
8.00
10.00
12.00
PSP Cleanroom Reuse Prevent Inspect Test CMM ISO
Software Process Improvement (SPI) Strategy
Effo
rt (H
ours
) (N
orm
aliz
ed/U
nwei
ghte
d)
Figure 44. Cycle time reduction comparison of eight strategies.
0.001.002.003.004.005.006.007.008.009.00
10.00
PSP Cleanroom Reuse Prevent Inspect Test CMM ISO
Software Process Improvement (SPI) Strategy
Cyc
le T
ime
Red
uctio
n(N
orm
aliz
ed/U
nwei
ghte
d)

Using Cost 243
Cycle Time Reduction. Normalized values for Cycle Time Reduction range from near
zero to around nine for the PSP (as shown in Figure 44). Cycle Time Reduction from left to right
is 8.69, 0.19, 0.20, 0.09, 0.29, 0.33, 0.16, and 0.06, for an average of 1.25. PSP is the best and
ISO 9000 is the worst in this analysis. The difference between best and worst is a factor of 145X.
Productivity Increase. Normalized values for Productivity Increase range from near zero
to around eight for the PSP (as shown in Figure 45). Productivity Increase from left to right is
8.17, 0.32, 0.20, 0.14, 0.41, 0.46, 0.22, and 0.08, for an average of 1.25. PSP is the best and ISO
9000 is the worst in this analysis. The difference between best and worst is a factor of 102X.
What’s now becoming evident is that the PSP’s benefits seem to be outweighing the benefits of
the other seven SPI strategies by two orders of magnitude. Rather than let this singular result
dominate and conclude this study, it is now becoming evident that PSP performance will have to
be duely noted, and its data segregated for further analyses and evaluation of SPI strategy costs
and benefits. One thing however, the PSP’s excellent performance was not predicted going into
this study. Further detailed analyses of the PSP’s performance may be found in the ROI Model.
Figure 45. Productivity increase comparison of eight strategies.
0.00
1.00
2.00
3.00
4.00
5.00
6.00
7.00
8.00
9.00
PSP Cleanroom Reuse Prevent Inspect Test CMM ISO
Software Process Improvement (SPI) Strategy
Prod
uctiv
ity In
crea
se(N
orm
aliz
ed/U
nwei
ghte
d)

Using Cost 244
Quality Increase. Normalized values for Quality Increase range from near zero to under
eight for the PSP (as shown in Figure 46). Quality Increase from left to right is 7.53, 1.25, 0.13,
0.14, 0.27, 0.17, 0.14, and 0.37, for an average of 1.25. PSP is the best and Reuse is the worst in
this analysis. The difference between best and worst is a factor of 58X.
Figure 46. Quality increase comparison of eight strategies.
0.00
1.00
2.00
3.00
4.00
5.00
6.00
7.00
8.00
PSP Cleanroom Reuse Prevent Inspect Test CMM ISO
Software Process Improvement (SPI) Strategy
Qua
lity
Incr
ease
(Nor
mal
ized
/Unw
eigh
ted)
Figure 47. Return-on-investment comparison of eight strategies.
0.00
1.00
2.00
3.00
4.00
5.00
6.00
7.00
8.00
9.00
PSP Cleanroom Reuse Prevent Inspect Test CMM ISO
Software Process Improvement (SPI) Strategy
Ret
urn-
on-I
nves
tmen
t(N
orm
aliz
ed/U
nwei
ghte
d)

Using Cost 245
Return-on-Investment. Normalized values for Return-on-Investment range from near zero
to just over eight for the PSP (as shown in Figure 47). Return-on-Investment from left to right is
8.34, 0.17, 0.02, 0.49, 0.86, 0.06, 0.04, and 0.03, for an average of 1.25. PSP is the best and
Reuse is the worst in this analysis. The difference between best and worst is a factor of 417X.
As mentioned earlier, these analyses revealed little differentiation in the costs and wide
disparity in the benefits. The following sections and analyses were created to highlight
differentiation between strategies that was not evident in the first round of analyses.
However, these analyses have revealed some significant findings. Inspection dominated
the first three cost criteria with performances of 1.43X, 5.72X, and 6.03X, for an average 4.39X
better than the worst performer. There is a correlation between these criteria in that they are all
related to training costs, which are reported to be the lowest for Inspections.
The PSP seems to have taken over from where Inspections left off. PSP dominated the
final five criteria with performances of 1.82X, 145X, 102X, 58X, and 417X, for an average of
145X better than the worst performers. The explanation for the PSP’s performance lies in two
factors, the dominant productivity, and subsequently total life cycle cost over the other methods
as revealed by the ROI Model, and that the PSP yields phenomenally high quality, resulting in
near zero software maintenance costs (at least to repair defects).
But, these analyses really hide the merits of the other six SPI strategies, Clean Room,
Reuse, Defect Prevention, Test, CMM, and ISO 9000. Further analyses will highlight the costs
and benefits of these SPI strategies as well. Overall Inspection benefits are also hidden in the
outstanding performance of the PSP. Further analyses will also highlight the benefits of
Inspections. So much so, that it will be necessary to segregate out Inspection data and analyses in
order to fully comprehend the benefits of the other SPI strategies in greater detail.

Using Cost 246
Benefit-Based Comparison of Alternatives
This section is designed to focus on, highlight, and further analyze only the “benefits” of
the eight SPI strategies, PSP, Clean Room, Reuse, Defect Prevention, Inspection, Test, CMM,
and ISO 9000, from Tables 100, and subsequently Table 91 (as shown in Table 101).
The preliminary Data Analysis revealed uniformity, homogeneity, and non-differentiation
among the costs. Therefore, it is now necessary to begin focusing on the benefits of the eight SPI
strategies. Now, differentiation between the SPI strategies hidden in the mire of Figure 38 and
the averaging found in Figure 39 starts to become evident (as shown in Figure 48).
Normalized Benefits of Eight Strategies
Table 101
PSP Cleanroom Reuse Prevent Inspect Test CMM ISO Average
Cycle Time Reduction 8.69 0.19 0.20 0.09 0.29 0.33 0.16 0.06 1.25Productivity Increase 8.17 0.32 0.20 0.14 0.41 0.46 0.22 0.08 1.25Quality Increase 7.53 1.25 0.13 0.14 0.27 0.17 0.14 0.37 1.25Return-on-Investment 8.34 0.17 0.02 0.49 0.86 0.06 0.04 0.03 1.25
32.74 1.93 0.55 0.86 1.82 1.01 0.55 0.54
Figure 48. Normalized benefits of eight strategies.
0.00
1.00
2.00
3.00
4.00
5.00
6.00
7.00
8.00
9.00
10.00
PSP Cleanroom Reuse Prevent Inspect Test CMM ISO
Software Process Improvement (SPI) Category
Nor
mal
ized
/Unw
eigh
ted
Scor
es
Cycle Time ReductionProductivity IncreaseQuality IncreaseReturn-on-Investment

Using Cost 247
Table 100 and Figure 48 reveal two items of interest, the benefits of the PSP overwhelm
the benefits of the remaining seven SPI strategies, and there exists further differentiation among
the Clean Room, Reuse, Defect Prevention, Inspection, Test, CMM, and ISO, that needs to be
examined in greater detail later.
Figure 49 is a composite average of benefits for PSP, Clean Room, Reuse, Defect
Prevention, Inspection, Test, CMM, and ISO 9000, from Table 101 and Figure 48. Figure 49
shows that the average PSP benefits outperform the benefits of the other seven SPI strategies by
a factor of 31.57X, while the factor between the PSP and the worst SPI strategy is a factor of
59.53X. In fact, Figure 49 shows that the difference between the worst PSP criterion and the best
non-PSP criterion is a factor of 5.02X. PSP’s Cycle Time Reduction is 46.6X greater than an
average of the others. PSP’s Productivity Increase is 31.28X greater. PSP’s Quality Increase is
21.37X greater. And, PSP’s Return-on-Investment is 35.25X greater. Figure 49 does reveal a
3.51X difference between the best and worst non-PSP SPI strategy.
Figure 49. Average benefits of eight strategies.
0.00
5.00
10.00
15.00
20.00
25.00
30.00
35.00
PSP Cleanroom Reuse Prevent Inspect Test CMM ISO
Software Process Improvement (SPI) Category
Cum
ulat
ive/
Nor
mal
ized
/Unw
eigh
ted
Scor
es

Using Cost 248
Benefit-Based Comparison of Worst Alternatives
This section is designed to analyze and evaluate the benefits of the seven worst SPI
strategies according to the Methodology, Clean Room, Reuse, Defect Prevention, Inspection,
Test, CMM, and ISO 9000, by masking out the PSP (as shown in Table 102).
The PSP’s benefits exhibited by Table 101, Figure 48, and Figure 49, previously dwarfed
the benefits of the seven worst SPI strategies, necessitating the design of Table 102. This
analysis reveals greater differentiation between these strategies, exhibiting high scores for
Inspection and Clean Room, surprisingly mediocre scores for Defect Prevention, surprisingly
high scores for Test, and low scores for Reuse, CMM, and ISO 9000 (as shown in Figure 50).
Normalized Benefits of Worst Strategies
Table 102
Cleanroom Reuse Prevent Inspect Test CMM ISO Average
Cycle Time Reduction 1.43 1.50 0.68 2.22 2.49 1.21 0.46 1.43Productivity Increase 1.74 1.10 0.77 2.23 2.51 1.19 0.46 1.25Quality Increase 5.08 0.52 0.57 1.08 0.69 0.55 1.50 1.25Return-on-Investment 1.03 0.13 2.94 5.18 0.34 0.22 0.15 1.25
9.29 3.25 4.97 10.71 6.04 3.17 2.57
Figure 50. Normalized benefits of worst strategies.
0.00
1.00
2.00
3.00
4.00
5.00
6.00
Cleanroom Reuse Prevent Inspect Test CMM ISO
Software Process Improvement (SPI) Category
Nor
mal
ized
/Unw
eigh
ted
Scor
es
Cycle Time ReductionProductivity IncreaseQuality IncreaseReturn-on-Investment

Using Cost 249
A composite picture of the benefits of the seven worst SPI strategies, Clean Room,
Reuse, Defect Prevention, Inspection, Test, CMM, and ISO 9000, provides useful analysis for
determining the overall strengths of each SPI strategy (as shown in Figure 51).
Figure 51 reveals that Inspection has the best overall benefit average, followed closely by
Clean Room, and then Test, Defect Prevention, Reuse, CMM, and ISO 9000. Inspection
outpaces Clean Room by 1.15X, Test by 1.77X, Defect Prevention by 2.15X, Reuse by 3.3X,
CMM by 3.38X, and ISO 9000 by 4.17X.
Test seems to have the best Cycle Time Reduction and Productivity Increase, Clean
Room has the best Quality Increase, and Inspection has the best Return-on-Investment of this
group. Inspection’s high Return-on-Investment and good performance in Cycle Time Reduction
and Productivity propel Inspections to the top of this analysis.
It’s somewhat surprising that Reuse and Defect Prevention are performing so poorly in
this analysis, and that CMM and ISO 9000 seem to be performing so well. Reflecting on the Cost
and Benefit model recalls authoritative data for Defect Prevention, but scant data for ISO 9000.
Figure 51. Average benefits of worst strategies.
0.00
2.00
4.00
6.00
8.00
10.00
12.00
Cleanroom Reuse Prevent Inspect Test CMM ISO
Software Process Improvement (SPI) Category
Cum
ulat
ive/
Nor
mal
ized
/Unw
eigh
ted
Scor
es

Using Cost 250
Benefit-Based Comparison of Poorest Alternatives
Once again, the overarching and overshadowing benefits of a few SPI strategies, Clean
Room and Inspection, overshadow the benefits of the poorest SPI strategies, Reuse, Defect
Prevention, Test, CMM, and ISO 9000, demanding a closer examination and comparative
analyses of these alternatives (as shown in Table 103).
Table 103 highlights the strengths of Test for Cycle Time Reduction and Productivity
Increase, and relative parity among these criteria for Reuse, Defect Prevention, and CMM. ISO
9000 comes out on top for Quality Increase, with parity for Reuse, Defect Prevention, Test, and
CMM. Defect Prevention has a towering Return-on-Investment as show in Figure 52).
Normalized Benefits of Poorest Strategies
Table 103
Reuse Prevent Test CMM ISO Average
Cycle Time Reduction 2.36 1.08 3.93 1.91 0.73 2.00Productivity Increase 1.83 1.27 4.16 1.98 0.76 2.00Quality Increase 1.36 1.50 1.81 1.43 3.91 2.00Return-on-Investment 0.34 7.78 0.90 0.58 0.40 2.00
5.88 11.62 10.80 5.90 5.80
Figure 52. Normalized benefits of poorest strategies.
0.00
1.00
2.00
3.00
4.00
5.00
6.00
7.00
8.00
9.00
Reuse Prevent Test CMM ISO
Software Process Improvement (SPI) Category
Nor
mal
ized
/Unw
eigh
ted
Scor
es
Cycle Time ReductionProductivity IncreaseQuality IncreaseReturn-on-Investment

Using Cost 251
A composite graph of the benefits of the five poorest SPI strategies, Reuse, Defect
Prevention, Test, CMM, and ISO 9000, provides useful analysis for determining the overall
strengths of each SPI strategy (as shown in Figure 53).
Figure 53 reveals that Defect Prevention has the best overall benefit average, followed
closely by Test, and then CMM, Reuse, and ISO 9000. Defect Prevention outperforms Test by
only 1.08X, CMM by 1.97X, Reuse by 1.98X, and ISO 9000 by 2X.
While Test does better than Defect Prevention in three out of four criteria, Defect
Prevention does come out on top of this analysis. However, a composite of their average benefits
places them on par, and reveals that they are an average of 2X better than the other three SPI
strategies, CMM, Reuse, and ISO 9000. Reuse is performing much worse than anticipated at the
outset of this study. While Reuse, wasn’t targeted for initial analysis, Reuse cost and benefit data
revealed by the Literature Survey made Reuse a natural candidate for inclusion in the analyses.
However, Reuse was expected to perform better than the Vertical Process and Indefinite SPI
strategies, which is largely attributed to the way Reuse training costs are computed.
Figure 53. Average benefits of poorest strategies.
0.00
2.00
4.00
6.00
8.00
10.00
12.00
14.00
Reuse Prevent Test CMM ISO
Software Process Improvement (SPI) Category
Cum
ulat
ive/
Nor
mal
ized
/Unw
eigh
ted
Scor
es

Using Cost 252
Cost/Benefit-Based Comparison of Categories
This section is designed to analyze the costs and benefits, not of individual SPI strategies,
but the three classes of SPI strategies referred to throughout this study as Vertical Life Cycle,
Vertical Process, and Indefinite. Vertical Life Cycle SPI strategies included the PSP, Clean
Room, and Reuse, Vertical Process SPI strategies included Defect Prevention, Inspection, and
Test, and Indefinite SPI strategies included CMM and ISO 9000. Vertical Life Cycle, Vertical
Process, and Indefinite strategy costs and benefits are analyzed here (as shown in Table 104).
There are two interesting points to ponder about this analysis in Table 104, validity and
significance. As for validity, it is theorized that the costs and benefits of Vertical Life Cycle SPI
strategies would be superior because of increased efficiencies due to comprehensiveness.
Vertical Process SPI strategies were theorized to be fast, streamlined, and highly efficient. And,
Indefinite SPI strategies were hypothesized to fail in all criteria. The fundamental question is
whether this classification is valid. After much analysis, the answer is a resounding “yes.” PSP’s
costs, benefits, and efficiencies are overwhelming, though the PSP was not initially anticipated to
exhibit these properties as strongly as it has. And, Clean Room and Reuse are much broader life
cycle approaches, though clearly not as efficient and effective as PSP. The Vertical Process SPI
Costs and Benefits of Categories
Table 104
Vertical LifeCycle
VerticalProcess Indefinite
Breakeven Hours 2,818 1,350 7,497Training Hours/Person 1,199 42 145Training Cost/Person $104,662 $7,041 $11,072Effort (Hours) 6,619 13,482 74,108Cycle Time Reduction 57.08x 4.43x 2.06xProductivity Increase 38.82x 4.50x 2.02xQuality Increase 100.06x 6.51x 8.50xReturn-on-Investment 440:1 72:1 5:1

Using Cost 253
strategies ended up much better than expected, behind strong performances in Return-on-
Investment and low initial investment costs (at least as computed by this study). Indefinite SPI
strategies performed extremely well, despite the fact that they were expected to perform
extremely badly. Indefinite SPI strategies may have been helped by cost and benefit data that
may have actually applied Vertical Process SPI strategies, along side the Indefinite approaches.
This may have biased this study in favor of the Indefinite approaches, but not enough to
overcome the raw power of the Vertical Life Cycle and Vertical Process SPI strategies. As for
significance, the overwhelming cost and benefit efficiencies of PSP and Inspection over
Indefinite SPI strategies increases the significance of this analysis, and highlights the continuing
role of Vertical Process SPI strategies in the 21st century.
Cost and benefit data for the SPI categories in Table 104 were normalized to facilitate
further analysis (as shown in Table 105 and Figure 54). Cost normalization was computed by
inverting the raw criterion value divided by the sum of all the values for the given criterion, and
multiplying the result by 10. Benefit normalization was computed by dividing the raw criterion
value by the sum of all the values for the given criterion, and multiplying the result by 10.
Normalized Costs and Benefits of Categories
Table 105
Vertical LifeCycle
VerticalProcess Indefinite
Breakeven Hours 7.58 8.84 3.57Training Hours/Person 1.35 9.69 8.95Training Cost/Person 1.48 9.43 9.10Effort (Hours) 9.30 8.57 2.13Cycle Time Reduction 8.98 0.70 0.32Productivity Increase 8.56 0.99 0.45Quality Increase 8.70 0.57 0.74Return-on-Investment 8.51 1.40 0.09
54.46 40.18 25.36

Using Cost 254
Breakeven Hours. Normalized values for Breakeven Hours range from near four to about
nine for the SPI categories (as shown in Table 105 and Figure 54). Breakeven Hours from left to
right are 7.58, 8.84, and 3.57. Vertical Process is the best and Indefinite is the worst in this
analysis. The difference between best and worst is a factor of 2.39X.
Training Hours/Person. Normalized values for Training Hours/Person range from about
one to nearly ten for the SPI categories (as shown in Table 105 and Figure 54). Training
Hours/Person from left to right are 1.35, 9.69, and 8.95. Vertical Process is the best and Vertical
Life Cyle is the worst in this analysis. The difference between best and worst is a factor of
7.18X. The auspicious and unusually high training costs for Clean Room and Reuse as derived
by this study biased this analysis against Vertical Life Cycle strategies.
Training Cost/Person. Normalized values for Training Cost/Person range from near two
to almost ten for the SPI categories (as shown in Table 105 and Figure 54). Training Cost/Person
from left to right is 1.48, 9.43, and 9.10. Vertical Process is the best and Vertical Life Cycle is
Figure 54. Normalized costs and benefits of categories.
0.00
2.00
4.00
6.00
8.00
10.00
12.00
Vertical Life Cycle Vertical Process Indefinite
Software Process Improvement (SPI) Category
Nor
mal
ized
/Unw
eigh
ted
Scor
es
Breakeven Hours
Training Hours/Person
Training Cost/Person
Effort (Hours)
Cycle Time Reduction
Productivity Increase
Quality Increase
Return-on-Investment

Using Cost 255
the worst in this analysis. The difference between best and worst is a factor of 6.37X. Once
again, the unusual source values for this analysis require caution in interpreting these results.
Effort (Hours). Normalized values for Effort (Hours) range from near two to nine for the
SPI categories (as shown in Table 105 and Figure 54). Effort (Hours) from left to right are 9.30,
8.57, and 2.13. Vertical Life Cycle is the best and Indefinite is the worst in this analysis. The
difference between best and worst is a factor of 4.37X.
Cycle Time Reduction. Normalized values for Cycle Time Reduction range from near
zero to nine for the SPI categories (as shown in Table 105 and Figure 54). Cycle Time Reduction
from left to right is 8.98, 0.70, and 0.32. Vertical Life Cycle is the best and Indefinite is the worst
in this analysis. The difference between best and worst is a factor of 28.06X. Vertical Process
faired nearly as badly as Indefinite.
Productivity Increase. Normalized values for Productivity Increase range from near zero
to nine for the SPI categories (as shown in Table 105 and Figure 54). Productivity Increase from
left to right is 8.56, 0.99, and 0.45. Vertical Life Cycle is the best and Indefinite is the worst in
this analysis. The difference between best and worst is a factor of 19.02X. Vertical Process faired
nearly as badly as Indefinite.
Quality Increase. Normalized values for Quality Increase range from almost one to about
nine for the SPI categories (as shown in Table 105 and Figure 54). Quality Increase from left to
right is 8.7, 0.57, and 0.74. Vertical Life Cycle is the best and Vertical Process is the worst in
this analysis. The difference between best and worst is a factor of 15.26X. Indefinite faired
nearly as badly as Vertical Process.
Return-on-Investment. Normalized values for Return-on-Investment range from near zero
to about nine for the SPI categories (as shown in Table 105 and Figure 54). Return-on-

Using Cost 256
Investment from left to right is 8.51, 1.4, and 0.09. Vertical Life Cycle is the best and Indefinite
is the worst in this analysis. The difference between best and worst is a factor of 94.56X. Vertical
Process was nearly as unimpressive as Indefinite.
A composite of overall cost and benefits for the three SPI categories, Vertical Life Cycle,
Vertical Process, and Indefinite, exhibits greater parity between them (as shown in Figure 55).
Vertical Life Cycle SPI strategies are 1.36X better than Vertical Process, and 2.15X better than
Indefinite, according to this study and analysis. And, Vertical Process SPI strategies are 1.58X
better than Indefinite, according to this study.
The results of this analysis were not completely unexpected, as Vertical Life Cycle was
expected to outperform Vertical Process and Indefinite, and it did. Vertical Process was expected
to outperform Indefinite, and it did. And, it is not even surprising that there wasn’t greater
differentiation in the composite averages for each of the categories. This study will need to focus
on the benefits of the categories, as well as segregate off the Vertical Life Cycle data.
Figure 55. Average costs and benefits of categories.
0.00
10.00
20.00
30.00
40.00
50.00
60.00
Vertical Life Cycle Vertical Process Indefinite
Software Process Improvement (SPI) Category
Cum
ulat
ive/
Nor
mal
ized
/Unw
eigh
ted
Scor
es

Using Cost 257
Benefit-Based Comparison of Categories
Comparison of both the costs and benefits of Vertical Life Cycle, Vertical Process, and
Indefinite SPI strategies suffered from the same dilemma as the earlier analysis did, parity and
perhaps even insignificance of the costs associated with the SPI categories. Therefore, this
section is designed to focus the readers attention on the benefits of the Vertical Life Cycle,
Vertical Process, and Indefinite SPI strategies (as shown in Table 106).
These are the same benefits found in Table 105. Table 106 indicates that PSP has a 9.52X
benefit advantage over Vertical Process, and a 21.72X advantage over Indefinite. These
normalized values are very revealing (as illustrated in Figure 56).
Normalized Benefits of Categories
Table 106
Vertical LifeCycle
VerticalProcess Indefinite
Cycle Time Reduction 8.98 0.70 0.32Productivity Increase 8.56 0.99 0.45Quality Increase 8.70 0.57 0.74Return-on-Investment 8.51 1.40 0.09
34.75 3.65 1.60
Figure 56. Normalized benefits of categories.
0.00
1.00
2.00
3.00
4.00
5.00
6.00
7.00
8.00
9.00
10.00
Vertical Life Cycle Vertical Process Indefinite
Software Process Improvement (SPI) Category
Nor
mal
ized
/Unw
eigh
ted
Scor
es
Cycle Time ReductionProductivity IncreaseQuality IncreaseReturn-on-Investment

Using Cost 258
Figure 56 emphasizes the vast difference in benefits between Vertical Life Cycle SPI
strategies, and Vertical Process and Indefinite SPI strategies. This analysis reveals that there is
much less parity and equality between the SPI categories than previously implied by Figure 55.
This chasm between the benefits of Vertical Life Cycle SPI strategies and the others was not
anticipated (as highlighted in Figure 57).
The composite benefits of the Vertical Life Cycle SPI category tower over the others.
The average benefits of the Vertical Process and Indefinite SPI categories look almost
uninteresting. But this is deceiving as will be later revealed.
Once again, the overwhelming benefits of the Vertical Life Cycle SPI category weren’t
anticipated at the outset of this study. But, even more surprising was the reasonably good benefit
performance of the Indefinite SPI category, and the surprisingly even performance between the
Vertical Process and Indefinite SPI categories.
The remainder of the analysis will focus on comparing the benefits of the Vertical
Process and Indefinite SPI categories. Further analysis will prove interesting and valuable.
Figure 57. Average benefits of categories.
0.00
5.00
10.00
15.00
20.00
25.00
30.00
35.00
40.00
Vertical Life Cycle Vertical Process Indefinite
Software Process Improvement (SPI) Category
Cum
ulat
ive/
Nor
mal
ized
/Unw
eigh
ted
Scor
es

Using Cost 259
There is definitely greater differentiation between the benefits of Vertical Process and
Indefinite SPI categories than revealed by Table 106, Figure 56, and Figure 57 (as shown in
Table 107). The advantages for the Vertical Process over the Indefinite category include 2.14X
for Cycle Time Reduction, 2.23X for Productivity Increase, and 15.13X for Return-on-
Investment. Very surprisingly, the Indefinite category did have one advantage over the Vertical
Process category, a 1.3X for Quality Increase. This was probably due to a single questionable
quality value reported for ISO 9000. Overall, the Vertical Process Category has a 2.18X
advantage over the Indefinite category (as illustrated in Figure 58).
Normalized Benefits of Worst Categories (Part I)
Table 107
VerticalProcess Indefinite
Cycle Time Reduction 6.82 3.18Productivity Increase 6.90 3.10Quality Increase 4.34 5.66Return-on-Investment 9.38 0.62
27.44 12.56
Figure 58. Normalized benefits of worst categories (part I).
0.00
1.00
2.00
3.00
4.00
5.00
6.00
7.00
8.00
9.00
10.00
Vertical Process Indefinite
Software Process Improvement (SPI) Category
Nor
mal
ized
/Unw
eigh
ted
Scor
es
Cycle Time Reduction
Productivity Increase
Quality IncreaseReturn-on-Investment
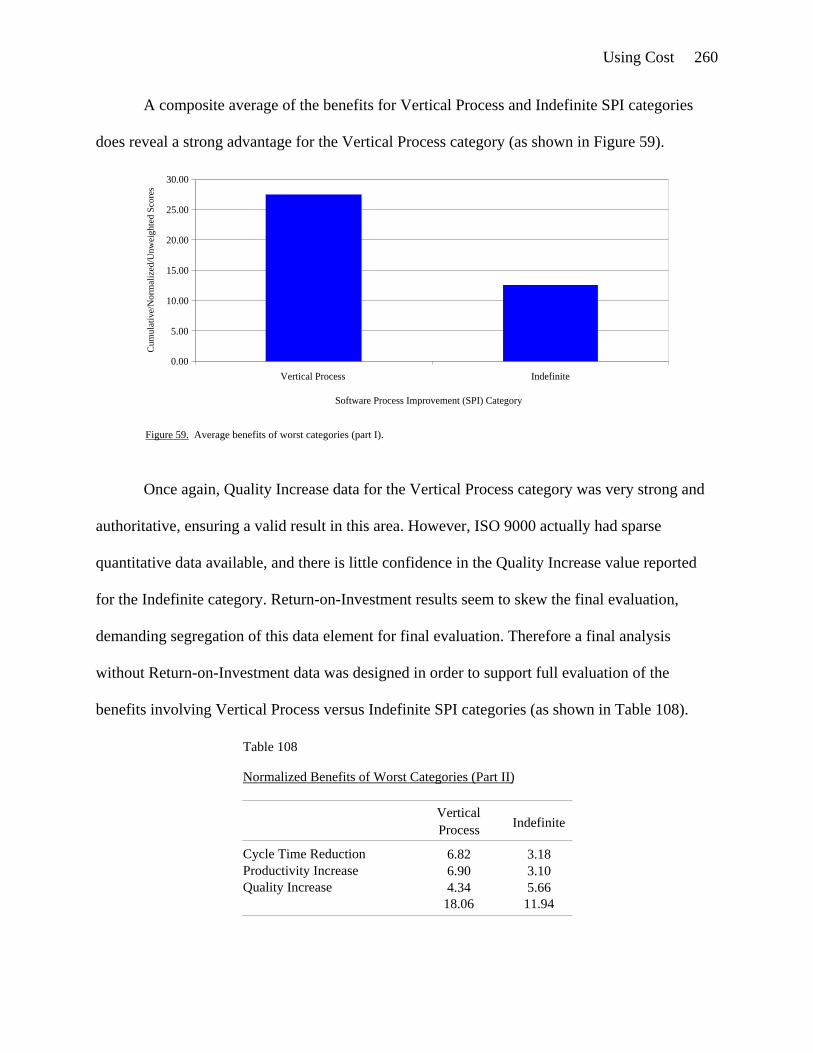
Using Cost 260
A composite average of the benefits for Vertical Process and Indefinite SPI categories
does reveal a strong advantage for the Vertical Process category (as shown in Figure 59).
Once again, Quality Increase data for the Vertical Process category was very strong and
authoritative, ensuring a valid result in this area. However, ISO 9000 actually had sparse
quantitative data available, and there is little confidence in the Quality Increase value reported
for the Indefinite category. Return-on-Investment results seem to skew the final evaluation,
demanding segregation of this data element for final evaluation. Therefore a final analysis
without Return-on-Investment data was designed in order to support full evaluation of the
benefits involving Vertical Process versus Indefinite SPI categories (as shown in Table 108).
Figure 59. Average benefits of worst categories (part I).
0.00
5.00
10.00
15.00
20.00
25.00
30.00
Vertical Process Indefinite
Software Process Improvement (SPI) Category
Cum
ulat
ive/
Nor
mal
ized
/Unw
eigh
ted
Scor
es
Normalized Benefits of Worst Categories (Part II)
Table 108
VerticalProcess Indefinite
Cycle Time Reduction 6.82 3.18Productivity Increase 6.90 3.10Quality Increase 4.34 5.66
18.06 11.94

Using Cost 261
Table 108 still exhibits a substantial advantage for the Vertical Process SPI category over
the Indefinite SPI category, even without Return-on-Investment. The Vertical Process SPI
category still holds a 2.18X advantage over the Indefinite SPI category for Cycle Time
Reduction and Productivity Increase (as shown in Figure 60).
And, finally, the composite average for Vertical Process and Indefinite SPI categories
concludes the Data Analysis for this study (as illustrated in Figure 61).
Figure 61. Average benefits of worst categories (part II).
Vertical Process Indefinite
Software Process Improvement (SPI) Category
Cum
ulat
ive/
Nor
mal
ized
/U
nwei
ghte
d Sc
ores
10.0012.0014.0016.0018.0020.00
0.002.004.006.008.00
Figure 60. Normalized benefits of worst categories (part II).
0.00
1.00
2.00
3.00
4.00
5.00
6.00
7.00
8.00
Vertical Process Indefinite
Software Process Improvement (SPI) Category
Nor
mal
ized
/Unw
eigh
ted
Scor
es
Cycle Time ReductionProductivity IncreaseQuality Increase

Using Cost 262

Using Cost 263
CONCLUSION
As stated in the title, this study involved “Using Cost Benefit Analyses to Develop a
Pluralistic Methodology for Selecting from Multiple Prescriptive Software Process Improvement
(SPI) Strategies.” Rather simply, this study identified as many step-by-step SPI strategies that
could be conclusively analyzed based on cost and benefit data, in order to help software
managers and engineers in choosing SPI strategies, or at least understanding the behavioral
economics of the SPI strategies that they currently employ.
While, it was hoped that more SPI strategies could be conclusively analyzed, such as the
Team Software Process (TSP), Orthogonal Defect Classification (ODC), Software Process
Improvement and Capability dEtermination (SPICE), IEEE 12207, Configuration Management
(CM), or Malcolm Baldrige National Quality Award (MBQNA), we are satisfied with what was
accomplished. In fact, eight well-known SPI strategies were quite impressively analyzed,
Personal Software Process (PSP), Clean Room, Reuse, Defect Prevention, Inspection, Test,
Capability Maturity Model (CMM), and ISO 9000. Not only are we sufficiently satisfied that an
authoritative base of SPI strategies were identified and analyzed, but that this study
accomplished a uniquely quantitative study of this magnitude for the first time (as known by this
author). While the SPI strategies, data, models, conclusions, and fidelity were less than perfect, it
is believed that this study substantially forwards the state-of-the-art in SPI strategy economic
analyses, especially with respect to the Personal Software Process (PSP).
An exhaustive Literature Review was attempted for several reasons, identify an
authoritative body of SPI strategies, metrics and models for evaluating SPI strategies, SPI
strategy costs and benefits for later analyses, and most importantly, a suitable methodology for
evaluating the economics of SPI strategies. While, the Literature Review accomplished all of

Using Cost 264
these goals and objectives, it is believed that a primary accomplishment is the design of the
Methodology, which can continue to be populated with SPI strategy costs and benefits.
As mentioned before, the Literature Survey was instrumental in identifying Clean Room
and Reuse costs and benefits, thus making the decision to include these SPI strategies in this
study. The other six SPI strategies, PSP, Defect Prevention, Inspection, Test, CMM, and ISO
9000 were already selected in advance for economic analyses. More SPI strategies that would
have been valuable would have included Experience Factory, Goal Question Metric (GQM),
Statistical Process Control (SPC), Product Line Management, Initiating, Diagnosing,
Establishing, Acting & Learning (IDEAL), or the plethora of the SEI’s CMM variations. Even
CMM-Based Assessments for Internal Process Improvement (CBA-IPIs) and Software
Capability Evaluations (SCEs) are considered SPI strategies by some. What about
BOOTSTRAP, Trillium, SPRM, and a virtual constellation of various proprietary methods? Yes,
it would really be something if there were quantitative costs and benefits available and associated
with every SPI strategy mentioned here.
There were several major contributions made by this study, an extensible framework and
Methodology that can be populated with higher fidelity economic data, and some rather suprising
economic results for SPI strategies such as PSP, Inspection, and Test. The PSP was initially only
considered to be a minor player that would be overshadowed by SPI strategy legends such as
Clean Room, Defect Prevention, and Inspection. However, the economic advantages of PSP
proved to be far too overwhelming against the seven classical SPI strategies selected for
comparative analysis, Clean Room, Reuse, Defect Prevention, Inspection, Test, CMM, and ISO
9000. In addition, this study continued to advance the tri-fold theoretical taxonomy and
classification of SPI strategies, Vertical Life Cycle, Vertical Process, and Indefinite.

Using Cost 265
Results of Data Analysis
See the Methodology and Data Analysis for detailed economic analyses of the costs and
benefits of the eight SPI strategies, PSP, Clean Room, Reuse, Defect Prevention, Inspection,
Test, CMM, and ISO 9000, as well as the three SPI categories, Vertical Life Cycle, Vertical
Process, and Indefinite. This section will attempt to directly translate the economic and data
analyses into the conceptual terms Good, Average, and Poor. The technique for making this
conceptual translation was to divide the range of values into three parts, and assign the term Poor
if the value fell in the first third, Average if the value fell in the second third, and Good if the
value fell in the last third. This conceptual translation was based directly upon normalized
economic values and was not arbitrarily or qualitatively assigned.
Table 109 illustrates that the normalized economic values for the PSP fell into the upper
third of ranges when compared to the other seven SPI strategies. Clean Room’s costs also fell
into the upper third of ranges, but its benefits fell into the lower third of ranges when compared
to the PSP. Reuse, Defect Prevention, Inspection, Test, CMM, and ISO 9000 faired similarly to
Clean Room when compared to the PSP. This graph indicates relative parity among the costs, but
a minimum 3:1 advantage for PSP benefits over the benefits of the other seven SPI strategies.
Comparative Summary of Eight Strategies
Table 109
PSP Cleanroom Reuse Prevent Inspect Test CMM ISO
Breakeven Hours Good Good Good Good Good Good Average GoodTraining Hours/Person Good Good Poor Good Good Good Good GoodTraining Cost/Person Good Good Poor Good Good Good Good GoodEffort (Hours) Good Good Good Good Good Good Average GoodCycle Time Reduction Good Poor Poor Poor Poor Poor Poor PoorProductivity Increase Good Poor Poor Poor Poor Poor Poor PoorQuality Increase Good Poor Poor Poor Poor Poor Poor PoorReturn-on-Investment Good Poor Poor Poor Poor Poor Poor Poor

Using Cost 266
Since relative parity exists among the costs of the eight SPI strategies, cost data were
factored out for further analysis and summarization. The PSP benefits overshadowed the benefits
of the other seven SPI strategies, reducing and eliminating differentiation among them.
Therefore, PSP data were also factored out for further analysis and summarization. Table 110
illustrates the benefits of the seven worst performing SPI strategies, Clean Room, Reuse, Defect
Prevention, Inspection, Test, CMM, and ISO 9000.
In this analysis, Clean Room yields an average Productivity Increase and a good Quality
Increase when compared to the other six worst performing SPI strategies. Reuse yields poor
Cycle Time Reduction, Productivity Increase, Quality Increase, and Return-on-Investment when
compared against this same set. Defect Prevention only seems to yield an average result for
Return-on-Investment, one of the only SPI strategies to do so in this set. Inspection yields
average results for Cycle Time Reduction and Productivity Increase, surprisingly yields poor for
Quality Increase, and yields the highest value for Return-on-Investment in this set. Test also
surprisingly yields average results for Cycle Time Reduction and Productivity Increase. CMM
and ISO 9000 yield only poor results among the seven worst performing SPI strategies. Once
again, the Clean Room and Inspection results overshadow the results of the other five SPI
strategies, necessitating further analysis of the poorest performing SPI strategies, Reuse, Defect
Prevention, Test, CMM, and ISO 9000 (as shown in Table 111).
Comparative Summary of Strategies (Part I)
Table 110
Cleanroom Reuse Prevent Inspect Test CMM ISO
Cycle Time Reduction Poor Poor Poor Average Average Poor PoorProductivity Increase Average Poor Poor Average Average Poor PoorQuality Increase Good Poor Poor Poor Poor Poor PoorReturn-on-Investment Poor Poor Average Good Poor Poor Poor

Using Cost 267
Unfortunately, since the conceptual terms of Poor, Average, and Good were based on the
total range of values, Defect Prevention scored very high for Return-on-Investment, pushing the
results for the five poorest performing SPI strategies downward. Reuse scored poorly for all
criterion in this analysis. Defect Prevention scored poor for three out of four criterion values.
Test continued to score average for Cycle Time Reduction and Productivity Increase. CMM, like
Reuse, score poor for all criterion. And, ISO 9000 scored average for Quality Increase, and poor
against the other three criteria, when compared to the five poorest SPI strategies.
Finally, the Vertical Life Cycle SPI category yields good and average results for all
criteria. The Vertical Process SPI category yields good and average for all criteria, except
Quality Increase and Productivity Increase. And, the Indefinite SPI category yields good and
average for training costs, as well as Quality Increase and Return-on-Investment.
Comparative Summary of Strategies (Part II)
Table 111
Reuse Prevent Test CMM ISO
Cycle Time Reduction Poor Poor Average Poor PoorProductivity Increase Poor Poor Average Poor PoorQuality Increase Poor Poor Poor Poor AverageReturn-on-Investment Poor Good Poor Poor Poor
Comparative Summary of Categories
Table 112
VerticalLife Cycle
VerticalProcess Indefinite
Breakeven Hours Good Good PoorTraining Hours/Person Average Good GoodTraining Cost/Person Average Good GoodEffort (Hours) Good Good PoorCycle Time Reduction Good Poor PoorProductivity Increase Good Poor PoorQuality Increase Good Average AverageReturn-on-Investment Good Average Average

Using Cost 268
Outcome of Hypotheses
While, this study doesn’t necessarily employ a hypothesis-based methodology and
approach, it is none-the-less interesting to qualitatively evaluate the strategic hypotheses
established in the Introduction. The first two strategic hypotheses deal with qualitative
perceptions associated with the SPI field. The third, fourth, and fifth strategic hypotheses deal
qualitatively with the notion that multiple SPI strategies and categories actually exist, attempting
to point out the simple notion that there is more than one approach to SPI. The last hypothesis
dealt with the identification of criteria for evaluating SPI strategies.
The first hypothesis (emerging definition of SPI). SPI is a discipline of defining,
measuring, and changing software management and development processes and operations in
order to increase productivity, increase quality, reduce cycle times, reduce costs, increase
profitability, and increase market competitiveness. Table 1 indicates that SPI includes perfecting
processes, adding value, adding quality, increasing productivity, increasing speed, increasing
efficiency, reducing cost, providing advantages, profiting, increasing flexibility, downsizing,
substituting better processes, using methods, defining processes, measuring processes,
simplifying processes, adding processes, and incremental change.
The second hypothesis (existence of multiple SPI strategies). Prevalent SPI strategies
such as the PSP, Clean Room, Reuse, Defect Prevention, Inspection, Test, CMM, and ISO 9000
exist and are widely in use. Other mainstream SPI strategies include TSP, ODC, SPICE, IEEE
12207, CM, MBQNA, Experience Factory, GQM, SPC, Product Line Management, IDEAL,
other CMM variations, CBA-IPI, SCE, BOOTSTRAP, Trillium, and SPRM.
The third hypothesis (SPI strategies exhibit favorable costs and benefits). SPI strategies
such as the PSP, Clean Room, Reuse, Defect Prevention, Inspection, Test, CMM, and ISO 9000

Using Cost 269
yield quantitatively favorable results such as increased productivity, increased quality, reduced
cycle time, and favorable return-on-investment. The eight SPI strategies analyzed in this study
yield Cycle Time Reductions of 23.58X, Productivity Increases of 16.75X, Quality Increases of
42.09X, and Return-on-Investments of 193:1.
The fourth hypothesis (existence of multiple SPI categories). SPI categories exist such as
Vertical Life Cycle (PSP, Clean Room, and Reuse), Vertical Process (Defect Prevention,
Inspection, and Test), and Indefinite (CMM and ISO 9000). Other Vertical Life Cycle SPI
strategies include TSP, IEEE 12207, and Product Line Management. Other Vertical Process SPI
strategies include ODC, CM, and SPC. And, other Indefinite SPI strategies include SPICE,
MBQNA, Experience Factory, GQM, IDEAL, other CMM variations, CBA-IPI, SCE,
BOOTSTRAP, Trillium, and SPRM.
The fifth hypothesis (SPI categories exhibit distinct costs and benefits). Vertical Life
Cycle SPI strategies are 1.36X better than Vertical Process and 2.15X better than Indefinite.
Vertical Process SPI strategies are 1.58X better than Indefinite. Cycle Time Reduction,
Productivity Increase, Quality Increase, and Return-on-Investment are 57X, 39X, 100X, and
440:1 for Vertical Life Cycle, 4X, 5X, 7X, and 72:1 for Vertical Process, and 2X, 2X, 9X, and
5:1 for Indefinite.
The sixth hypothesis (existence of criteria for evaluating SPI strategies). Criteria for
evaluating SPI strategies include Breakeven Hours, Training Hours/Person, Training
Cost/Person, Effort (Hours), Cycle Time Reduction, Productivity Increase, Quality Increase, and
Return-on-Investment. 72 scholarly surveys identified by this study organized 487 individual
software metrics into 14 broad metrics classes such as Productivity, Design, Quality, Effort,
Cycle Time, Size, Cost, Change, Customer, Performance, ROI, and Reuse.

Using Cost 270
Reliability and Validity
According to Kan (1995), reliability deals with the predictive accuracy of a metric,
model, or method, and validity deals with whether the predicted value is correct. Reliability and
validity became of paramount concern as the Methodology was being designed and constructed.
This study addresses a very serious issue, cost and benefits associated with software management
and development. The software industry is a critically and strategically important as the world
moves into the 21st century. Therefore, reliability and validity of the metrics, models, methods,
and results of this study have to be dealt with responsibly. We will attempt to do so here, though
reliability and validity were summarily dealt with throughout the Methodology, as necessary.
First, let’s address the design of the Methodology. Kan (1995) firmly asserts that the
Defect Removal Model is good for software quality management, but not accurate for predicting
reliability. Many of the costs and benefits throughout this study were based on empirical
relationships established by the Defect Removal Model. Therefore, the predictive nature of the
Methodology should not be taken for granted. The bottom line results of this study were for
gross analytical purposes, and are probably not good for concisely predicting the costs and
benefits associated with any one application of the aforementioned SPI strategies. In other
words, don’t create an operational budget from the results of this study. The Cost and Benefit
Data used to drive the final analyses were not always related and correlated to one another,
therefore, not exhibiting a direct cause and effect relationship. In other words, applying a
specified amount of cost used in this study may not yield the associated benefit. The Return-on-
Investment Model, while employing valid mathematical methods and relationships, only took
training costs into account, ignoring the much reported high-costs of organizational and cultural
change. In other words, it may take more than a few hours of training to employ and

Using Cost 271
institutionalize the SPI strategies analyzed by this study. The Break Even Point Model, like the
Return-on-Investment Model doesn’t account for the high-costs of organizational and cultural
change. Ironically, the Clean Room and Reuse sources, which had unusually high costs may
have actually done so. The Costs and Benefits of Alternatives should also be used and interpreted
with caution. While some of the data is believed to be very authoritative, particularly for PSP and
Inspections, some data is very questionable, especially for CMM and ISO 9000. This isn’t to say
that the PSP analysis is highly reliable, as there are intermittent sources reporting the high cost of
organizational and cultural change associated with this SPI strategy.
As alluded to here and throughout the Methodology, the cost of training, implementation,
and institutionalization seems to be the least understood, or at least analyzed, element in this
study. While, SPI strategy training and implementation costs may make an excellent topic for
future research and analysis, these costs may be a large suspect source of reliability and validity
associated with this study. As reported earlier, Return-on-Investment and Breakeven Hours were
based on authoritative costs to train a single individual, not an entire organization. When using
this study to aid in software organizational design and SPI strategy rollout, carefully analyze and
estimate the cost to train all strategic personnel, and then reapply the ROI and break even models
suggested by this study. Doing so will yield a more realistic estimate, which once again, should
only be used as a guideline, not an absolute. The Methodology used a sample software defect
population size associated with medium to large-scale software development. Modern website
development tends to deal with small software product sizes and extremely small defect
populations, which would require careful reinterpretation of ROI and Breakeven Hours.
However, if your Internet strategy involves small numbers of engineers, this study may actually
prove very useful for cost and benefit analysis, but not necessarily cost prediction.

Using Cost 272
Future Research
This study has revealed several areas for future research, developing a dynamically
scaleable Return-on-Investment Model, continuing to populate the models in the Methodology
with more authoritative and accurate cost and benefit data, accurately modeling training and
implementation costs, and including exciting new SPI strategies.
Scaleable Return-on-Investment Model. Two interrelated items for future research in this
area include automating the Methodology, so that cost and benefit data may be automatically
entered and reports generated, and allowing the user to input a variety of factors such as
organizational size, product size, efficiencies, and time-scales.
Continuing Cost and Benefit Data Population. Now that our awareness has been
heightened to strategic cost and benefit factors associated with SPI strategies and a highly
structured framework has been designed to capture, classify, and analyze them, increasingly
frequent reports of cost and benefit data should be input into the models.
Accurately Modeling Training and Implementation Costs. Perhaps, additional criteria
need to be added, such as the costs associated with not only training employees in the various
SPI strategies, but the costs associated with organizational and cultural adaptation, change, and
penetration.
Analyzing Emerging Strategies. This will probably be one of the most fruitful areas for
future research. Quantitative benefits for the TSP are rapidly emerging and should’ve been
included in this study as a Vertical Life Cycle. In addition, ODC is reported to be orders of
magnitude more effective than Defect Prevention, and should’ve been included in this study as a
Vertical Process. More and more data is emerging associated with using the CMM, CBA-IPIs,
SCEs, and SPICE. The methodology should include these methods as Indefinite SPI strategies.

Using Cost 273
Recommendations
The recommendations are primarily three-fold, and were not anticipated in advance of
initiating this study, carefully consider the Personal Software Process (PSP), Software Inspection
Process, and Software Test Process, as critically strategic Software Process Improvement (SPI)
strategies. The reason these recommendations weren’t expected to be the final results, was
because the PSP wasn’t expected to perform so well, Inspections were perceived to be obsolete,
and Testing was believed to be far too inefficient.
Personal Software Process (PSP). The PSP yields phenomenal results for Cycle Time
Reduction, Productivity Increase, Quality Increase, and especially Return-on-Investment, such as
164X, 110X, 254X, and 1,290:1. Cost and benefit data for the PSP are by far the most plentiful,
robust, and detailed than for any SPI strategy identified by this study.
Software Inspection Process. Inspections yield excellent results for Cycle Time
Reduction, Productivity Increase, Quality Increase, and once again especially Return-on-
Investment, such as 6X, 6X, 9X, and 133:1. Inspections are widely known and respected
techniques that will continue to prove viable in the 21st century. Cost and benefit data for
Inspection is plentiful and very authoritative.
Software Test Process. Test yields respectable results for Cycle Time Reduction,
Productivity Increase, Quality Increase, and Return-on-Investment, such as 6X, 6X, 6X, and 9:1.
Reluctantly speaking, Test may be a fruitful area for focus and improvement, as Test is a
traditional and widely employed technique in use throughout the world. While, admittedly Test
processes are rather immature, or at least they are in use, they may be excellent candidates for
immediate improvement. PSP and Inspections would require substantially more cultural change
and commitment than Test.

Using Cost 274

Using Cost 275
REFERENCES
American Society for Quality Control (1999/n.d.). ANSI ASC Z-1 committee on quality
assurance answers the most frequently asked questions about the ISO 9000 (ANSI/ASQ Q9000)
series [WWW document]. URL http://www.asq.org/standcert/iso.html
Arditti, E. (1999/n.d.). Benefits of ISO 9000 [WWW document]. URL
http://www.geocities.com/Eureka/Enterprises/9587/benefits1.htm
Armstrong, R. V. (1999/n.d.). ISO 9000 & QS 9000 seminar training [WWW document].
URL http://www.rvarmstrong.com
Arthur, L. J. (1997). Quantum improvements in software system quality.
Communications of the ACM, 40(6), 46-52.
Asada, M., & Yan, P. M. (1998). Strengthening software quality assurance. Hewlett-
Packard Journal, 49(2), 89-97.
Austin, R. D., & Paulish, D. J. (1993). A survey of commonly applied methods for
software process improvement. Pittsburg, PA: Carnegie-Mellon University. (NTIS No. ADA
278595)
Barnard, J., & Price, A. (1994). Managing code inspection information. IEEE Software,
11(2), 59-69.
Bassin, K. A., Kratschmer, T., & Santhanam, P. (1998). Evaluating software
development objectively. IEEE Software, 15(6), 66-74.
Bauer, R. A., Collar, E., & Tang, V. (1992). The silverlake project: Transformation at
IBM. New York, NY: Oxford University Press.
Using Cost 276
Bhandari, I., Halliday, M. J., Chaar, J., Chillarege, R., Jones, K., Atkinson, J. S., Lepori-
Costello, C., Jasper, P. Y., Tarver, E. D., Lewis, C. C., & Yonezawa, M. (1994). In-process
improvement through defect data interpretation. IBM Systems Journal, 33(1), 182-214.
Billings, C., Clifton, J., Kolkhorst, B., Lee, E., & Wingert, W. B. (1994). Journey to a
mature software process. IBM Systems Journal, 33(1), 4-19.
Binder, R. V. (1997). Can a manufacturing quality model work for software? IEEE
Software, 14(5), 101-102, 105.
Blackburn, M. R. (1998). Using models for test generation and analysis. Proceedings of
the IEEE Digital Avionics System Conference, USA, 1-8.
Braham, C. G. (Ed.). (1996). Webster’s dictionary (2nd ed.). New York, NY: Random
House.
Briand, L. C., El Emam, K., & Freimut, B. (1998). A comparison and integration of
capture-recapture models and the detection profile method (IESE-Report 025.98/E).
Kaiserslautern, Germany: University of Kaiserslautern, Fraunhofer-Institute for Experimental
Software Engineering.
Briand, L. C., El Emam, K., Freimut, B., & Laitenberger, O. (1997). Quantitative
evaluation of capture recapture models to control software inspections (IESE-Report 053.97/E).
Kaiserslautern, Germany: University of Kaiserslautern, Fraunhofer-Institute for Experimental
Software Engineering.
Briand, L. C., El Emam, K., Freimut, B., & Laitenberger, O. (1998). A comprehensive
evaluation of capture-recapture models for estimating software defect content (IESE-Report
068.98/E). Kaiserslautern, Germany: University of Kaiserslautern, Fraunhofer-Institute for
Experimental Software Engineering.

Using Cost 277
Burnstein, I., Homyen, A., Grom, R., & Carlson, C. R. (1998). A model to assess testing
process maturity. Crosstalk, 11(11), 26-30.
Burnstein, I., Suwannasart, T., & Carlson, C. R. (1996a). Developing a testing maturity
model: Part I. Crosstalk, 9(8), 21-24.
Burnstein, I., Suwannasart, T., & Carlson, C. R. (1996b). Developing a testing maturity
model: Part II. Crosstalk, 9(9), 19-26.
Burr, A., & Owen, M. (1996). Statistical methods for software quality: Using metrics for
process improvement. Boston, MA: International Thomson Publishing.
Carnegie Mellon University (1999/n.d.). Personal software process [WWW document].
URL http://www.distance.cmu.edu/info/courses/psp.html
Chillarege, R., Bhandari, I. S., Chaar, J. K., Halliday, M. J., Moebus, D. S., Ray, B. K., &
Wong, M. Y. (1992). Orthogonal defect classification—A concept for in-process measurements.
IEEE Transactions on Software Engineering, 18(11), 943-956.
Cleanroom Software Engineering (1996/n.d.). An introduction to cleanroom software
engineering for managers [WWW document]. URL http://www.csn.net/cleansoft/mgrguide.html
Coase, R. H. (1994). Essays on economics and economists. Chicago, IL: University of
Chicago Press.
Conte, S. D., Dunsmore, H. E., Shen, V. Y. (1986). Software engineering metrics and
models. Menlo Park, CA: Benjamin/Cummings.
Cosgriff, P. W. (1999a). The journey to CMM level 5: A time line. Crosstalk, 12(5), 5-6,
30.
Cosgriff, P. W. (1999b). The right things for the right reasons: Lessons learned achieving
CMM level 5. Crosstalk, 12(5), 16-20.

Using Cost 278
Crosby, P. B. (1979). Quality is free. New York, NY: McGraw-Hill.
Cusumano, M. A. (1991). Japan’s software factories: A challenge to U.S. management.
New York, NY: Oxford University Press.
Cusumano, M. A., & Selby, R. W. (1995). Microsoft secrets: How the world’s most
powerful software company creates technology, shapes markets, and manages people. New
York, NY: The Free Press.
Cusumano, M. A., & Selby, R. W. (1997). How Microsoft builds software.
Communications of the ACM, 40(6), 53-61.
Cusumano, M. A., & Yoffie, D. B. (1998). Competing on internet time: Lessons from
netscape and its battle with microsoft. New York, NY: The Free Press.
Daskalantonakis, M. K. (1992). A practical view of software measurement and
implementation experiences within motorola. IEEE Transactions on Software Engineering,
18(11), 998-1010.
Davenport, T. H. (1993). Process innovation: Reengineering work through information
technology. Boston, MA: Harvard Business School Press.
Davidson, W. H. (1993). Beyond re-engineering: The three phases of business
transformation. IBM Systems Journal, 32(1), 65-79.
Diaz, M., & Sligo, J. (1997). How software process improvement helped motorola. IEEE
Software, 14(5), 75-81.
Downes, L., & Mui, C. (1998). Unleashing the killer app: Digital strategies for market
dominance. Boston, MA: Harvard Business School Press.
Ehrlich. W., Prasanna, B., Stampfel, J., & Wu, J. (1993). Determining the cost of a stop-
test decision. IEEE Software, 10(2), 33-42.

Using Cost 279
El Emam, K., & Briand, L. C. (1997). Costs and benefits of software process
improvcment (IESE-Report 047.97/E). Kaiserslautern, Germany: University of Kaiserslautern,
Fraunhofer-Institute for Experimental Software Engineering.
Fagan, M. E. (1976). Design and code inspections to reduce errors in program
development. IBM Systems Journal, 12(7), 744-751.
Fagan, M. E. (1986). Advances in software inspections. IEEE Transactions on Software
Engineering, 15(3), 182-211.
Farren, D., & Ambler, T. (1997). The economics of system-level testing. IEEE Design &
Test of Computers, 14(3), 51-58.
Ferguson, P., Humphrey, W. S., Khajenoori, S., Macke, S., & Matvya, A. (1997). Results
of applying the personal software process. IEEE Computer, 30(5), 24-31.
Florac, W. A., & Carleton, A. D. (1999). Measuring the software process: Statistical
process control for software process improvement. Reading, MA: Addison-Wesley.
Fowler Jr., K. M. (1997). SEI CMM level 5: A practitioner’s perspective. Crosstalk,
10(9), 10-13.
Gale, J. L., Tirso, J. R., & Burchfield, C. A. (1990). Experiences with defect prevention.
IBM Systems Journal, 29(1), 33-43.
Garrison, R. H., & Noreen, E. W. (1997a). Systems design: Activity-based costing and
quality management. In Managerial accounting (pp. 178-237). Boston, MA: McGraw-Hill.
Garrison, R. H., & Noreen, E. W. (1997b). Cost-volume-profit relationships. In
Managerial accounting (pp. 278-323). Boston, MA: McGraw-Hill.
Using Cost 280
Garver, R. (1999/n.d.). Are there benefits to ISO 9000 registration? More importantly,
does superior service really matter? [WWW document]. URL http://www.distribution-
solutions.com/newpage7.htm
Gilb, T., & Graham, D. (1993). Software inspection. Reading, MA: Addison-Wesley.
Grady, R. B. (1997). Successful software process improvement. Saddle River, NH:
Prentice Hall.
Grady, R. B., & Caswell, D. L. (1986). Software metrics: Establishing a company-wide
program. Englewood Cliffs, NJ: Prentice Hall.
Grady, R. B., & Van Slack, T. (1994). Key lessons in achieving widespread inspection
use. IEEE Software, 11(4), 46-57.
Graham, D. (n.d./1999). Grove consultants public courses and events [WWW document].
URL http://www.grove.co.uk
Haley, T. J. (1996). Software process improvement at raytheon. IEEE Software, 13(6),
33-41.
Hammer, M. (1996). Beyond reengineering: How the process-centered organization is
changing our work and our lives. New York, NY: HarperBusiness.
Harrington, H. J. (1991). Business process improvement: The breakthrough strategy for
total quality, productivity, and competitiveness. New York, NY: McGraw Hill.
Harrington, H. J. (1995). Total improvement management: The next generation in
performance improvement. New York, NY: McGraw Hill.
Haskell, J., Decker, W., & McGarry, F. (1997). Experiences with CMM and ISO 9001
benchmarks. Proceedings of the Twenty-Second Annual Software Engineering Workshop, USA,
157-176.

Using Cost 281
Hayes, W., & Over, J. W. (1997). The personal software process (PSP): An empirical
study of the impact of PSP on individual engineers (CMU/SEI-97-TR-001). Pittsburg, PA:
Software Engineering Institute.
Herbsleb, J., Carleton, A., Rozum, J., Siegel, J., & Zubrow, D. (1994). Benefits of CMM-
based software process improvement: Initial results (CMU/SEI-94-TR-013). Pittsburg, PA:
Software Engineering Institute.
Hewlett, M. (1999/n.d.). ISO 9000: The benefits of ISO 9000 registration and quality
system requirements [WWW document]. URL http://www.subnet.co.uk/quest/requirements.html
Humphrey, W. S. (1987). A method for assessing the software engineering capability of
contractors (CMU/SEI-87-TR-23). Pittsburg, PA: Software Engineering Institute.
Humphrey, W. S. (1989). Managing the software process. Reading, MA: Addison-
Wesley.
Humphrey, W. S. (1995). A discipline for software engineering. Reading, MA: Addison-
Wesley.
Humphrey, W. S. (1996). Using a defined and measured personal software process. IEEE
Software, 13(3), 77-88.
Humphrey, W. S. (1997). Introduction to the personal software process. Reading, MA:
Addison-Wesley.
Humphrey, W. S. (1998a). Three dimensions of process improvement part II: The
personal process. Crosstalk, 11(3), 13-15.
Humphrey, W. S. (1998b). Three dimensions of process improvement part III: The team
process. Crosstalk, 11(4), 14-17.

Using Cost 282
Humphrey, W. S. (2000). Introduction to the team software process. Reading, MA:
Addison-Wesley.
IEEE guide for software verification and validation plans (IEEE Std 1059-1993). New
York, NY: Institute of Electrical and Electronic Engineers, Inc.
IEEE standard for information technology—Software life cycle processes (IEEE Std
12107.0-1996). New York, NY: Institute of Electrical and Electronic Engineers, Inc.
IEEE standard for software reviews and audits (IEEE Std 1028-1988). New York, NY:
Institute of Electrical and Electronic Engineers, Inc.
IEEE standard for software verification and validation plans (IEEE Std 1012-1986). New
York, NY: Institute of Electrical and Electronic Engineers, Inc.
IEEE standard glossary of software engineering terminology (IEEE Std 610.12-1990).
New York, NY: Institute of Electrical and Electronic Engineers, Inc.
IEEE trial use standard, standard for information technology software life cycle
processes: Software development, acquirer-supplier agreement (IEEE J-Std 016-1995). New
York, NY: Institute of Electrical and Electronic Engineers, Inc.
Johnson, P. L. (1999/n.d.). ISO 9000: A to Z complete implementation program [WWW
document]. URL http://www.pji.com/atoz.htm
Johnson, P. M., & Disney, A. M. (1998). The personal software process: A cautionary
case study. IEEE Software, 15(6), 85-88.
Jones, C. (1996). The economics of software process improvement. IEEE Computer,
29(1), 95-97.
Jones, C. (1997a). Activity-based costs: Polishing the software process. Software
Development, 47-54.

Using Cost 283
Jones, C. (1997b). Software quality: Analysis and guidelines for success. Boston, MA:
International Thomson Publishing.
Jones, C. (1998). Estimating software costs. New York: NY: McGraw-Hill.
Jones, C. L. (1985). A process-integrated approach to defect prevention. IBM Systems
Journal, 24(2), 150-165.
Kajihara, J., Amamiya, G, & Saya, T. (1993). Learning from bugs. IEEE Software, 10(5),
46-54.
Kan, S. H. (1991). Modeling and software development quality. IBM Systems Journal,
30(3), 351-362.
Kan, S. H. (1995). Metrics and models in software quality engineering. Reading, MA:
Addison-Wesley.
Kan, S. H., Basili, V. R., & Shapiro, L. N. (1994). Software quality: An overview from
the perspective of total quality management. IBM Systems Journal, 33(1), 4-19.
Kan, S. H., Dull, S. D., Amundson, D. N., Lindner, R. J., & Hedger, R. J. (1994). AS/400
software quality management. IBM Systems Journal, 33(1), 62-88.
Kaplan, C., Clark, R., & Tang, V. (1995). Secrets of software quality: 40 innovations
from IBM. New York, NY: McGraw-Hill.
Kettinger, W. J., Teng, J. T. C., & Guha, S. (1996). Business process change: A study of
methodologies, techniques, and tools. MIS Quarterly, 21(1), 55-80.
Latino, R. J., & Latino, K. C. (1999). Root cause analysis: Improving performance for
bottom line results. Boca Raton, FL: CRC Press.
Lauesen, S., & Younessi, H. (1998). Is software quality visible in the code? IEEE
Software, 15(4), 69-73.
Using Cost 284
Lim, W. C. (1998). Managing software reuse: A comprehensive guide to strategically
reengineering the organization for reusable components. Upper Saddle River, NJ: Prentice Hall.
Maurer, R. (1996). Beyond the wall of resistance: Unconventional strategies that build
support for change. Austin, TX: Bard Books.
Mays, R. G., Jones, C. L., Holloway, G. J., & Studinski, D. P. (1990). Experiences with
defect prevention. IBM Systems Journal, 29(1), 4-32.
McConnell, S. (1996). Rapid development: Taming wild software schedules. Redmond,
WA: Microsoft Press.
McGibbon, T. (1996). A business case for software process improvement (Contract
Number F30602-92-C-0158). Rome, NY: Air Force Research Laboratory—Information
Directorate (AFRL/IF), Data and Analysis Center for Software (DACS).
McGibbon, T. (1997). Modern empirical cost and schedule estimation (Contract Number
F30602-89-C-0082). Rome, NY: Air Force Research Laboratory—Information Directorate
(AFRL/IF), Data and Analysis Center for Software (DACS).
McKechnie, J. L. (Ed.). (1983). Webster’s new twentieth century dictionary of the
English language (2nd ed.). New York, NY: Prentice Hall.
Mendonca, G. G., Basili, V. R., Bhandari, I. S., & Dawson, J. (1998). An approach to
improving existing measurement frameworks. IBM Systems Journal, 37(4), 484-501.
NSF-ISR (1999/n.d.). ISO 9000 registration [WWW document]. URL http://www.nsf-
isr.org/html/iso_9000.html
Oldham, L. G, Putman, D. B, Peterson, M., Rudd, B., & Tjoland, K. (1999). Benefits
realized from climbing the CMM ladder. Crosstalk, 12(5), 7-10.

Using Cost 285
Paulk, M. C., Weber, C. V., Curtis, B., & Chrissis, M. B. (1995). The capability maturity
model: Guidelines for improving the software process. Reading, MA: Addison-Wesley.
Poulin, J. S. (1997). Measuring software reuse: Principles, practices, and economic
models. Reading, MA: Addison Wesley.
Pressman, R. S. (1997). Software engineering: A practitioner’s approach. New York, NY:
McGraw-Hill.
Prowell, S. J., Trammell, C. J., Linger, R. C., & Poor, J. H.. (1999). Clean room software
engineering: Technology and process. Reading, MA: Addison-Wesley.
Putnam, L. H. (1993/n.d.). The economic value of moving up the SEI scale [WWW
document]. URL http://www.qualitaet.com/seipaper.html
Radice, R. A., Harding, J. T., Munnis, P. E., & Phillips, R. W. (1985). A programming
process study. IBM Systems Journal, 24(2), 91-101.
Radice, R. A., Roth, N. K., O’Hara, Jr., A. C., Ciarfella, W. A. (1985). A programming
process architecture. IBM Systems Journal, 24(2), 79-90.
Reid, R. H. (1997). Architects of the web: 1,000 days that build the future of business.
New York, NY: John Wiley & Sons.
Reinertsen, D. G. (1997). Managing the design factory: A product developer’s toolkit.
New York, NY: The Free Press.
Rice, R. W. (n.d./1999). Randy rice’s software testing page: Training courses and
workshops [WWW document]. URL http://www.riceconsulting.com
Rico, D. F. (n.d./1993). Software inspection process cost model [WWW document]. URL
http://davidfrico.com/sipcost.pdf

Using Cost 286
Rico, D. F. (n.d./1996). Software inspection process metrics [WWW document]. URL
http://davidfrico.com/ipmov.pdf
Rico, D. F. (n.d./1998). Software process improvement: Impacting the bottom line by
using powerful “solutions” [WWW document]. URL http://davidfrico.com/spipaper.html
Rico, D. F. (n.d./1999). V&V lifecycle methodologies [WWW document]. URL
http://davidfrico.com/vvpaper.html
Roberson, D. (1999/n.d.). Benefits of ISO 9000 [WWW document]. URL
http://www.isocenter.com/9000/benefits.html
Rosenberg, L. H., Sheppard, S. B., & Butler, S. A. (1994). Software process assessment
(SPA). Third International Symposium on Space Mission Operations and Ground Data Systems,
USA.
Russell, G. W. (1991). Experience with inspection in ultralarge-scale developments.
IEEE Software, 8(1), 25-31.
Russo, C. W. R. (1999/n.d.). Charro training and education products and seminars
[WWW document]. URL http://www.charropubs.com/
Schafer, W., Prieto-diaz, R., & Matsumoto, M. (1980). Software reusability. New York,
NY: Ellis Horwood.
Schuyler, J. R. (1996). Decision analysis in projects: Learn to make faster, more
confident decisions. Upper Darby, PA: Project Management Institute.
Siy, H. P. (1996). Identifying the mechanisms driving code inspection costs and benefits.
Unpublished doctoral dissertation, University of Maryland, College Park.

Using Cost 287
Slywotzky, A. J., Morrison, D. J., Moser, T., Mundt, K. A., & Quella, J. A. (1999). Profit
patterns: 30 ways to anticipate and profit from strategic forces reshaping your business. New
York, NY: Times Business.
Smith, B. (1993). Making war on defects. IEEE Spectrum, 30(9), 43-47.
Software Engineering Institute. (1998). 1998-1999 SEI Public Courses [Brochure].
Pittsburgh, PA: Linda Shooer.
Software Engineering Institute (1999, March). Process maturity profile of the software
community: 1998 year end update [WWW document]. URL http://www.sei.cmu.edu/
activities/sema/pdf/1999mar.pdf
Sommerville, I. (1997). Software engineering. Reading, MA: Addison-Wesley.
Sulack, R. A., Lindner, R. J., & Dietz, D. N. (1989). A new development rhythm for
AS/400 software. IBM Systems Journal, 28(3), 386-406.
Szymanski, D. J. & Neff, T. D. (1996). Defining software process improvement.
Crosstalk, 9(2), 29-30.
Tingey, M. O. (1997). Comparing ISO 9000, malcolm baldrige, and the SEI CMM for
software: A reference and selection guide. Upper Saddle River, NJ: Prentice Hall.
Turban, E., & Meredith, J. R. (1994). Fundamentals of management science (6th ed.).
Boston, MA: McGraw Hill.
Vu, J. D. (1998/n.d.). Software process improvement: A business case [WWW
document]. URL http://davidfrico.com/boeingspi.pdf
Wang, Y., Court, I., Ross, M., Staples, G., King, G., & Dorling, A. (1997a). Quantitative
analysis of compatibility and correlation of the current SPA/SPI models. Proceedings of the 3rd
IEEE International Symposium on Software Engineering Standards (ISESS ’97), USA, 36-55.

Using Cost 288
Wang, Y., Court, I., Ross, M., Staples, G., King, G., & Dorling, A. (1997b). Quantitative
evaluation of the SPICE, CMM, ISO 9000 and BOOTSTRAP. Proceedings of the 3rd IEEE
International Symposium on Software Engineering Standards (ISESS ’97), USA, 57-68.
Wang, Y., King, G., Dorling, A., Patel, D., Court, J., Staples, G., & Ross, M. (1998). A
worldwide survey of base process activities towards software engineering process excellence.
1998 International Conference on Software Engineering (ICSE ’98), Japan, 439-442.
Webb, D., & Humphrey, W. S. (1999). Using the TSP on the taskview project. Crosstalk,
12(2), 3-10.
Weller, E. F. (1993). Lessons from three years of inspection data. IEEE Software, 10(5),
38-45.
Wigle, G. B., & Yamamura, G. (1997). Practices of an SEI CMM level 5 SEPG.
Crosstalk, 10(11), 19-22.
Yamamura, G., & Wigle, G. B. (1997). SEI CMM level 5: For the right reasons.
Crosstalk, 10(8), 3-6.
Yamaura, T. (1998). How to design practical test cases. IEEE Software, 15(6), 30-36.