Embed Size (px)
Citation preview

Theoretical Analysis of Light-Weight Truss Construction in Fire Conditions, Including the Use of Fire Retardant Treated Wood
by
Gilead Ziemba
A Thesis
Submitted to the Faculty
of the
WORCESTER POLYTECHNIC INSTITUTE
in partial fulfillment of the requirements for the
Degree of Master of Science
in
Fire Protection Engineering
by
_____________________________ Gilead Ziemba
May 4, 2006
Approved: ___________________________________ Professor Leonard D. Albano, Main Advisor ___________________________________ Professor Robert W. Fitzgerald, Co-Advisor ___________________________________ Professor Frederick L. Hart, CEE Dept. Head

2
Abstract Fire statistics suggest that there is an urgent need for improved performance of
light-weight truss construction in fire scenarios. This thesis proposes the use of Fire
Retardant Treated Wood (FRTW). Several floor truss systems were designed for a
residential living room using sawn lumber and FRTW. A finite difference, heat transfer
model was used to determine time to collapse and to identify modes of failure during a
simulated exposure to the standard ASTM E-119 test fire curve. As part of ongoing
research at WPI, this is an initial effort to use analytical methods in the study of heat
transfer and structural performance of wood construction during fire conditions. Results
were examined for important relationships to further advance the understanding of
collapse mechanisms in wood trusses. Experimental procedures for further testing have
also been developed. Acknowledgment that in-service conditions may alter structural fire
performance is made and the implications are discussed. An alternate fire scenario, more
representative of residential fire loading, was also developed and compared to the ASTM
E-119 fire curve.

3
Acknowledgments
I would like to acknowledge the participants of this project. These people have
intimately helped in its development, and deserve credit for the project’s success, as well
as my sincere gratitude.
Project Co-Advisor: Professor Robert W. Fitzgerald
Research Assistant: Donald Benanti
Special Thanks to:
Project Major Advisor: Professor Leonard D. Albano

4
Table of Contents Abstract ............................................................................................................................... 2 AcknowledgmentsTable of Contents.................................................................................. 3 Table of Contents................................................................................................................ 4 List of Tables ...................................................................................................................... 6 List of Figures ..................................................................................................................... 7 1.0 Introduction................................................................................................................... 8 2.0 Literature Review........................................................................................................ 11
2.1 Firefighting and the Dangers of Structural Collapse .............................................. 11 Fire Statistics............................................................................................................. 11 Structural Integrity .................................................................................................... 12
2.2 Overview of FRTW ................................................................................................ 14 History of FRTW ...................................................................................................... 14 Chemistry of FR Treatment and Strength Degradation ............................................ 14
2.3 Codes and Standards for FRTW ............................................................................. 21 ASTM D 5664-02 ..................................................................................................... 22 ASTM D 6841-03 ..................................................................................................... 25 ASTM D 3201-94(03)............................................................................................... 26 ASTM D 2898-94(99)............................................................................................... 27 International Building Code and NFPA 5000........................................................... 28 NFPA 703 ................................................................................................................. 29
2.4 Commercial FRTW................................................................................................. 30 2.5 Truss Design ........................................................................................................... 31
Structural Analysis.................................................................................................... 31 TRUSS-4................................................................................................................... 32 Designing an Economical Truss ............................................................................... 32 National Design Specification .................................................................................. 34
2.6 Heat Transfer Models ............................................................................................. 34 Finite Element Models.............................................................................................. 35 Finite Difference Models .......................................................................................... 36
3.0 Methodology for Analysis .......................................................................................... 38 3.1 Evaluation of the Chosen Scenario ......................................................................... 38
Truss Members.......................................................................................................... 38 Truss Plates ............................................................................................................... 39 Fire Scenario and Thermal Analysis......................................................................... 39
3.2 Strength Modeling .................................................................................................. 41 Thermal Degradation of Wood ................................................................................. 41 Thermal Degradation of Steel ................................................................................... 43
3.3 Failure Modes and Criterion ................................................................................... 45 Tooth Withdrawal ..................................................................................................... 45 Mechanical Failure.................................................................................................... 46
4.0 Results and Discussion ............................................................................................... 47 4.1 Model Analysis ....................................................................................................... 47 4.2 Failure Analysis ...................................................................................................... 50
5.0 Experimental Design................................................................................................... 57

5
5.1 FRTW Thermophysical Properties ......................................................................... 57 Thermal Conductivity ............................................................................................... 58 Specific Heat Capacity.............................................................................................. 59 Density ...................................................................................................................... 60 Thermal Inertia.......................................................................................................... 62
5.2 Thermal Degradation of FRTW in Fire Scenarios.................................................. 63 5.3 Char Progression in FRTW..................................................................................... 66 5.4 Interaction of Wood Members and Truss Plates in Normal and Fire Scenarios..... 68
6.0 Conclusions................................................................................................................. 71 6.1 Limitations of the Work.......................................................................................... 75 6.2 In-Service Considerations....................................................................................... 76 6.3 Recommendations for Future Research .................................................................. 79
Bibliography ..................................................................................................................... 81 Appendix........................................................................................................................... 84
A.1 Product Specifications for Various Commercial FRTW Products ........................ 84 A.2 Typical Residential Floor Truss Loading............................................................. 105 A.3 Truss-4 Sample Input and Output Files ............................................................... 106 A.4 Strength Properties of FRTW vs. Temperature ................................................... 110 A.5 Residential Fire Ignition Sources......................................................................... 112 A.6 Alternative Fire Scenario Using CFAST ............................................................. 114 A.7 Alternative Model for Char Formation ................................................................ 119 A.8 Combined Stress Index ........................................................................................ 120

6
List of Tables Table 1: Comparison of cyclic temperature with constant temperature (LeVan et al. 1996)........................................................................................................................................... 17 Table 2: Effects of re-dry temperature on mechanical properties of various FR treated plywood specimens. The change in mechanical properties was as compared to untreated control specimens. (LeVan, Winandy 1990) .................................................................... 21 Table 3: Summary of Procedure 1 for the ASTM D5664 test .......................................... 23 Table 4: Summary of Procedure 2 for the ASTM D5664 test .......................................... 23 Table 5: Summary of variable for calculation of strength reduction design factors for FRTW ............................................................................................................................... 25 Table 6: Summary of variable for final equation for determining treatment adjustment factors for FRTW.............................................................................................................. 26 Table 7: Summary of test procedures for ASTM D 3201, test for hygroscopic properties........................................................................................................................................... 27 Table 8: Summary of variable in equations used to determine severity of MC increase in treated lumber after exposure to high-humidity conditions per ASTM D3201................ 27 Table 9: Summary of testing methods for the ASTM D 2898 test for accelerated weathering of FRTW for fire testing ................................................................................ 28 Table 10: Summary of input and output variables involved in using TRUSS-4 .............. 32 Table 11: Explanation of variables for ASD equations provided by the NDS ................. 34 Table 12: Description of input variables for the finite difference equation for thermal analysis.............................................................................................................................. 37 Table 13: Bottom chord member sizes for Type 3 and 4 trusses using sawn lumber and FRTW ............................................................................................................................... 38 Table 14: Design factors for FRTW for service up to the given temperature .................. 42 Table 15: Expected fire endurance times for specific construction components (ASCE SFPE 29 1999) .................................................................................................................. 50 Table 16: Summary of failure times for each truss type and span for sawn lumber, FRTW, and different member orientations. Note the initial load to capacity ratios and the corresponding times to failure. ......................................................................................... 50 Table 17: Summary of failure times for selected trusses when using strength reduction models for the residual cross-sections .............................................................................. 52 Table 18: Summary of failure times and failure modes for the selected trusses when considering tooth deflection failures and comparison to failure times when only considering thermal degradation of wood......................................................................... 53 Table 19: Summary of failure times when considering all modes of failure.................... 55 Table 20: Recommended CFAST compartment dimension limits ................................. 115 Table 21: Summary of CFAST inputs for the delayed ignition scenario ....................... 115 Table 22: Description of additional targets created in CFAST analysis. Locations are typical for all scenarios. .................................................................................................. 117

7
List of Figures Figure 1: Effect of exposure to various RH and temperatures on MOR of untreated plywood (Winandy et al. 1991) ........................................................................................ 18 Figure 2: Effect of exposure to various RH and temperatures on MOR of MAP treated plywood (Winandy et al. 1991) ........................................................................................ 18 Figure 3: Effects of various FR formulations and re-dry temperatures on pH, MOR, and WML (Lebow et al. 1999) ................................................................................................ 20 Figure 4: Hypothetical cutting pattern to obtain specimens for the ASTM D5664 test (ASTM International, Vol. 4.10 2004) ............................................................................. 24 Figure 5: Original choices of truss configurations and the resulting variations ............... 33 Figure 6: Thermal properties of wood as a function of temperature (Lie 1992) .............. 41 Figure 7: Tensile capacity of FRTW versus temperature in terms of manufacturer published design factors.................................................................................................... 43 Figure 8: Temperature of wooden member at various depths when protected by 1/2" gypsum board and exposed to the ASTM E-119 fire curve.............................................. 47 Figure 9: Temperature of wooden member at various depths when protected by double 5/8" gypsum board and exposed to the ASTM E-119 fire curv........................................ 48 Figure 10: Residual tensile capacity of sawn lumber and FRTW when exposed to the ASTM E-119 fire curve and protected by 1/2" gypsum board ......................................... 49 Figure 11: Residual tensile capacity of sawn lumber and FRTW when exposed to the ASTM E-119 fire curve and protected by double 5/8"gypsum board .............................. 49 Figure 12: Schematics of test configuration and instrumentation for ASTM E 1225 (ASTM Int. 2004) ............................................................................................................. 59 Figure 13: Photograph of testing tension/furnace apparatus used by White, et al. when their thermal degradation model was developed for sawn lumber (White, et al. 1993) ... 64 Figure 14: Theoretical sequence of events describing proposed progressive tooth withdrawal model.............................................................................................................. 70 Figure 15: Causes of residential fires with older adult casualties (U.S. Fire Administration June, 2005)...................................................................................................................... 112 Figure 16: Causes of residential fires with child fatalities (U.S. Fire Administration April, 2005) ............................................................................................................................... 113 Figure 17: Room layout of the CFAST model used, provided by a visual package called Smokeview™.................................................................................................................. 116 Figure 18: Most intense CFAST curve compared with the ASTM E-119 standard exposure. ......................................................................................................................... 118

8
1.0 Introduction Light timber construction was a great advancement in modern construction
practices. It saves money, time, and materials while maintaining structural integrity. In
recent years however, it has become evident that light timber construction performs
poorly in fire conditions and is prone to early collapse. This presents a particular hazard
for emergency responders, especially firefighters, who many times must enter these
dwellings to extinguish the blaze.
Advancements in fire protection engineering have brought about a new generation
of Fire Retardant Treated Wood (FRTW), chemically impregnated sawn lumber designed
to retard and eventually cease the process of pyrolysis via chemical intervention in the
release of combustion reactants. But problems with the structural integrity of these
materials arise when exposed to long durations of high service temperatures or high
moisture conditions. However, new chemical treatment formulations and the fact that
most commercial FRTW products are now specified to be used only indoors are helping
to increase the functionality of this material.
The main goal of this project is to explore possible failure modes of trusses under
fire loads when designed using regular sawn lumber and metal connecting plates, and
then to extrapolate those findings to predict the performance of FRTW in light weight
truss construction. In order to achieve this, several problems were addressed. The first
problem was to conduct extensive library research on FRTW and factors affecting its
strength, followed by research of common residential fire scenarios and to model a
similar assumed situation using zone model software. Five different trusses were

9
designed using typical loadings for residential living spaces and the two most economical
of these were used for further analysis.
The next problem was to develop a theoretical heat transfer model to determine
the thermal profile within a wood member and steel plate that would incorporate char
formation and changing thermophysical properties of wood during exposure. A finite
difference model was created using conservation of energy. Empirical thermal
degradation models for both steel and wood were researched, and a model that describes
how FRTW will degrade during exposure was created. By establishing temperatures of
the materials at any given time using the model, the amount of charring in the wood
section and thermal degradation of strength properties in the wood and steel connecting
plates are determined using the empirical and derived formulas.
It is hypothesized that the connector plates would be the primary location of
catastrophic failure; therefore, focus of this project is directed towards the interface
between the wood and the metal teeth that are used to secure each joint. The plates were
modeled to transfer load by the teeth alone, and each tooth was evaluated as a uniformly
loaded cantilever beam with variable section properties.
Expected failure modes can be described via three mechanisms. The first would
be simple mechanical failure of a wood section from a combined effect of charring and
thermal strength degradation. The second, a simple mechanical failure of the truss plate
from reduced strength due to increased temperature. The third mode would be the most
complicated and is described as tooth withdrawal or “peeling” where the metal plate pulls
out of the wood member in the same direction in was inserted.

10
Finally, future testing methods are developed to determine the thermal properties
of FRTW, to evaluate FRTW char formation, and to determine better the characteristics
of the interaction between truss plates and wood members in normal and fire scenarios
with the goal of enabling a more comprehensive evaluation of this topic.

11
2.0 Literature Review Many statistics and publications portray the dangers of light timber construction
to the public and to emergency responders. This chapter is intended to give the reader a
sense of the proportion of this problem.
Also described in this chapter are the chemical behavior of FRTW and how codes
and standards have been developed to deal with this high potential, though challenging,
material.
This chapter will then describe the background work that was necessary to
investigate FRTW as an option in light-weight truss construction. Computer models and
structural designs were developed to simulate a typical structural fire environment that
may be found in the living room of a residential home.
2.1 Firefighting and the Dangers of Structural Collapse
Fire Statistics In a scientific study conducted by the Federal Emergency Management Agency
(FEMA) entitled Trends in Firefighter Fatalities Due to Structural Collapse, 1979-2002,
it was found that firefighter deaths in residential buildings have more than tripled in the
last decade compared to the previous decades (1994-2002: 33 deaths; 1983-1992: 9
deaths) (Brassal, Evans 2002). Moreover, in a FEMA study entitled Wood Truss Roof
Collapse Claims Two Firefighters Memphis, Tennessee, researchers express that
awareness and concern about the hazards of lightweight construction need to be increased
throughout the Fire Service (Routly 1992). Even if a building is defined as “fire-resistive”
by the building codes, this does not guarantee it will survive a fire or the fire fighting
effort (Brannigan 1992).

12
Structural Integrity The way that buildings are constructed using wood has changed significantly
since the beginning of the 20th century. Timber construction was typically done using
members with very large cross sections with the minimum dimension somewhere
between six and ten inches, and is now known as “Heavy Timber” construction. Because
it requires significant cost and effort to construct (e.g. lifting these large beams require
machinery), and building materials are becoming increasingly expensive, it is no longer
economically feasible to construct timber structures in this way (Reading a …2004).
Efficient and cost-effective methods of construction are increasingly prevalent;
unfortunately they are more prone to collapse in the event of a fire. Light-weight
construction materials and methods are praised by the building industry as the answer to
affordable housing in this country. State and independent building codes set minimum
requirements for load-carrying capacity, fire resistance, and spans lengths in order to
maintain a minimum level of safety, yet the dangers of lightweight construction are still
real and ever present to the Fire Service (Brannigan 1992).
Because wood is a combustible material, when it burns, there will be a certain
mass loss rate associated with the combustion and over time, cross-sectional areas of
burning members will decrease therefore decreasing their structural strength and
integrity. Though light timber construction saves the industry money by allowing the use
of smaller, less expensive members, when exposed to fire conditions, these smaller
members heat up, and are consumed more rapidly and after a relatively short period of
time are unable to carry the loads for which they were designed.
The vast majority of structural fires are fought by firefighters standing on or under
wooden structures (Brannigan 1992). Because occupant evacuation is the first objective

13
for the fire department, very few civilians are killed by burning building collapse.
Unfortunately, firefighters are typically involved with a burning building when it has
been weakened by flames and is close to the point of collapse. The fire endurance
characteristics of lightweight construction systems have been discussed and debated
among scholars and within the Fire Service for years. The actual time to collapse, and
the presence or absence of warning signs prior to collapse, are of great interest to the Fire
Service (Dunn 1988).
Recent testing was done by the National Institute of Standards and Technology
(NIST) in association with the Phoenix Fire Department to demonstrate time to collapse
of residential roof truss construction. Typical times were around 20 minutes from the
time of ignition and few if any warning signs were evident before the final collapse. The
suddenness of the failures is one of the most harrowing details to firefighters (Bukowski
2002).
Building codes often require 1 or 2 hour fire resistance ratings for floors and load
bearing structures in commercial occupancies, but are almost never required in residential
buildings. Even though two hours is expected to be more than adequate for evacuation,
smoke obscuration and being in unfamiliar buildings are only two of the unpredictable
variables that can increase the time firefighters will spend in the structure. Also, fire
resistance ratings are only a benchmark developed under standard furnace test exposures
which are often times much less severe than natural fires, making this rating highly
unrepresentative of their actual ability to maintain integrity (Bukowski 2002). Further
discussion of building code requirements can be found in Section 2.3 Codes and
Standards for FRTW.

14
2.2 Overview of FRTW This section is intended to provide the reader with a brief history of how FRTW
has been used and some issues that have arisen while using it. Also discussed is the
chemical means by which FRTW works to inhibit sustained combustion and how this
chemical treatment affects its structural performance.
History of FRTW In the 1980’s, when FRTW was used commonly for roof sheathing, it was
discovered that these materials are extremely prone to strength degradation when exposed
to a natural environment. Under the correct conditions the chemicals used in treatment
would prematurely activate and begin to lower the temperature at which thermal
degradation would occur, effectively increasing char and reducing the production of
flammable volatiles. However, over time this process would affect the entire section of
the wood element and cause a reduction in strength. The wood would darken and
become very brittle. In the worst cases, entire roofs needed to be replaced. The service
life of the early FRTW roof sheathing was anywhere from 3 to 8 years. Since this
occurred on the roofs of many structures, these problems were very visible in nature and
quickly made the industry aware that something was having serious negative effects on
the service life of FRTW and soon led to many studies on the types of factors that caused
its deterioration. (LeVan, Collet 1989)
Chemistry of FR Treatment and Strength Degradation All FR systems use phosphorus nitrogen or boron, and most have phosphorus as
the central element in the form of phosphoric acid. When wood reaches a temperature of
260˚C, cellulose begins to break down and produce tars and flammable volatiles.
Cellulose is the primary contributor to the production of such volatiles and its

15
decomposition can be accelerated when in the presence of water, acids, and oxygen. The
primary reaction in this decomposition is depolymerization caused by the cleavage of
glycosidic linkages which is essentially the process of hydrolysis. In the presence of very
strong acids hydrolysis can occur at room temperatures. Susan L. LeVan and Jerrold E.
Winandy of the Forest Products Laboratory (FPL) explained the most widely agreed upon
theory of how the acids actually act as FR chemicals in their 1990 publication entitled
“Effects of Fire Retardant Treatments on Wood Strength: A Review”:
Acids can catalyze the dehydration of a glucose unit by addition of a proton to the oxygen atom of a hydroxyl group, resulting in formation of the unstable carbonium ion. The carbonium ion rearranges and regenerates the proton, thereby propagating the process… The glycosidic linkages can also undergo attack from a proton, resulting in depolymerization of polysaccharide chains. The proton forms a conjugate acid with the glycosidic oxygen. The C-O bond is cleaved to form an intermediate cyclic carbonium cation, which initiates addition of a water molecule, resulting in a stable end product and release of the proton.
In short, this reaction in the presence of strong acids decomposes the cellulose quicker
than usual (increasing the char), and releases less volatiles and more stable molecules
such as water so that flaming combustion is severely impeded. Flame spread is also
decreased dramatically via the same processes, creating less radiant feedback which
diminishes the possibility of further continued combustion. (LeVan, Winandy 1990)
The effect of FR treatment at high temperatures has been found to be highly
dependent on species. Thermal degradation of wood can be viewed as the sum of the
degradation of its parts. Cellulose and hollocellulose make up 50 to 75% of wood, where
hollocellulose is comprised of alpha-cellulose and hemicellulose, and lignin is the
enzyme that acts as the glue to hold it all together. When each compound (excluding
hemicellulose) was isolated and thermally degraded in nitrogen, it was found that
hollocellulose most closely follows the degradation of actual wood member than any

16
other component separately. This allows for the conclusion that studying the thermal
degradation of hollocellulose, and most specifically hemicellulose, would provide a close
explanation on how wood will degrade in general. (LeVan, et al. 1990)
Xylan is a main component in the hemicellulose of hardwoods and is the least
thermally stable hemicellulose since pentosans (xylan) are very susceptible to
dehydration reactions. Softwood hemicellulose is low in xylan and high in a more stable
molecule called galactoglucomannan. Since FR chemicals are effective by increasing the
rate of hydrolysis, hardwoods are more negatively affected by the treatment than
softwoods, and it is for this reason that today, all commercially available FRTW is
created using softwood species. (LeVan, et al. 1990)
Other research funded by FPL confirms the hypothesis that hemicellulose plays
an important role in determining the strength of FRTW. In this particular study, Winandy
et al determined the percentage of certain types of cellulose and hemicellulose that are
integral in the determination of mechanical strength, then treated the specimens with
monoamonium phosphate (MAP). One group of specimens was exposed to 27˚C for 560
days and then tested for their residual percentages of cellulose and hemicellulose while
the other was tested immediately after treatment to act as the control. The conclusions
state that the degree of polymerization of cellulose did not appear to be related to strength
loss under thermal degradation but the amount of hemicelluloses left undamaged after
treating, especially the mannans in galactoglucomannan, were highly related to residual
modulus of rupture (MOR) and work to maximum load (WML). (Sweet, Winandy 1999)
Since the concern for strength loss in FRTW originated from observations while
in service, the idea that cyclic temperature exposures and in-service changes in moisture

17
content (MC) could have been contributing factors was also investigated. Untreated
specimens and those treated with MAP were exposed to cyclic 65˚C temperatures at 7
hours per day and at 3.5 hours per day, with a control group at a constant 65˚C. Exposure
times ranged from 0 to 215 days with intermediaries at 21, 60, and 160 days. Two target
MC levels were used: 6 and 12 percent. Below, Table 1 shows the slope of the trendlines
of the best fit to all data.
Table 1: Comparison of cyclic temperature with constant temperature (LeVan et al. 1996)
Modulus of elasticity (MOE) values were relatively unchanged while Table 1 shows that
MOR exhibited a slight negative slope. This data suggests that cyclic temperature
exposure cannot be said to be more severe than constant exposure. Other data from this
research showed that treated materials had a greater tendency for degradation than
untreated as was the trend exhibited in past experiments. There was also a slight decrease
in strength from 6% MC to 12% MC, but strength loss due to increase in MC was no
different than that exhibited by untreated lumber. (LeVan et al. 1996)
Further work at the FPL showed the correlation between relative humidity (RH)
and strength loss. Untreated and MAP treated plywood specimens were subjected to
exposures of various combinations of temperature and RH. Their results are summarized
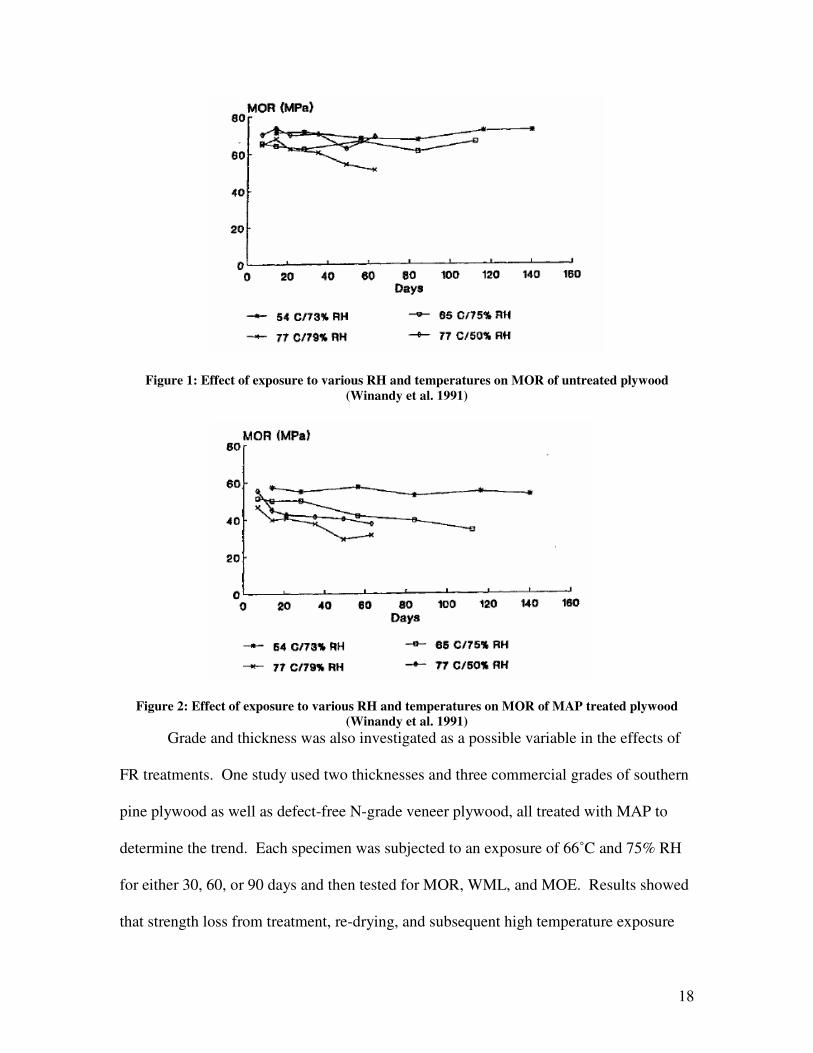
in Figure 1 and Figure 2 below. It was concluded that as RH increased, the rate of
strength loss at elevated temperatures also increased. However, the effect of RH did not
appear to be as influential as that of the temperature exposure. (Winandy et al. 1991)
18
Figure 1: Effect of exposure to various RH and temperatures on MOR of untreated plywood (Winandy et al. 1991)
Figure 2: Effect of exposure to various RH and temperatures on MOR of MAP treated plywood (Winandy et al. 1991)
Grade and thickness was also investigated as a possible variable in the effects of
FR treatments. One study used two thicknesses and three commercial grades of southern
pine plywood as well as defect-free N-grade veneer plywood, all treated with MAP to
determine the trend. Each specimen was subjected to an exposure of 66˚C and 75% RH
for either 30, 60, or 90 days and then tested for MOR, WML, and MOE. Results showed
that strength loss from treatment, re-drying, and subsequent high temperature exposure

19
was dependent on neither quality nor grade of the plywood. Initially the thinner materials
seemed to degrade more severely but when results were adjusted to reflect the volume of
wood affected it was found that thickness as well had no intrinsic effect on the
development of strength loss. (Lebow, Winandy 1998)
Essentially all FR treatments cause large, rapid decreases in pH, first because the
solutions themselves are usually acidic, and second because decomposition reactions in
wood release acetic acid (LeVan et al. 1990). By this reasoning, the possibility that wood
pH could be used as a predictor of strength loss was examined as well. A strong
relationship was noted between changes in pH of the tested plywood specimens and the
reductions in strength and energy properties. Figure 3 below summarizes some of the
data collected from these experiments. The key in the figures shows the number of days
that each specimen was exposed to 66˚C (150˚F) and 75% RH. As seen in the data, as
temperatures increase, the differences in pH resulting from the initial re-drying after
treatment becomes insignificant after extended periods of exposure. In other data
collected, it was determined that the additions of borate compounds produced a
significant buffering effect that slowed or lessened the decreases in pH. (Lebow et al.
1999)

20
Figure 3: Effects of various FR formulations and re-dry temperatures on pH, MOR, and WML (Lebow et al. 1999)
Because kiln drying is by far the number one method used to cure softwood
dimension lumber, the effects of kiln drying were independently examined as a possible
contributor to overall strength loss. Table 2 below shows the difference in the effects of
using a re-dry temperature of 60˚C as compared to that of 110˚C. The table shows a
dramatic decrease in mechanical properties as the re-dry temperature increases. This is
attributed to the fact that when exposed to temperatures above the boiling point of water,
generally referred to as high temperature drying (HTD), hydrolysis is catalyzed even

21
more than is expected from treatment alone, severely increasing the production of acid in
the system and therefore increasing the rate of strength loss. (LeVan et al. 1990)
Table 2: Effects of re-dry temperature on mechanical properties of various FR treated plywood specimens. The change in mechanical properties was as compared to untreated control specimens.
(LeVan, Winandy 1990)
2.3 Codes and Standards for FRTW Much of the research described in the previous section resulted in the formation
of standard test methods for the evaluation of effects of FR treatments and the final
strength properties of FRTW. This also led to the inclusion of FRTW into developing
building codes.
The American Society for Testing and Materials (ASTM) has developed
numerous methods for quantifying the effects of various in-service conditions on strength
properties of FRTW. Building code officials often require that these tests be performed
in order to certify that a particular manufacturer’s product is of sufficient quality to be
used as construction materials.
The purpose of this section is to make the reader aware of some of issues
regarding FRTW that have been addressed by the professional public.
22
ASTM D 5664-02 This test method is for the evaluation of the effects of FR treatments and elevated
temperatures on strength properties of FRTW. The general objectives for this test are to
develop data to adjust allowable design stresses of sawn lumber for the initial effects of
treating with any FR formulation and to develop data for in-service thermal stability up to
66 ± 2˚C (150 ± 4˚F) and �50% RH. This test was created so that all manufacturers of
FRTW can evaluate their products in an effort to maintain the expected level of structural
performance.
There are two test procedures with a third optional test for size effects. The first
two procedures use small clear specimens cut from end-matched nominal 2 x 4
dimension lumber. Procedure 1 compares initial effects of FR treatments to untreated
controls for bending, tension parallel, compression parallel, and horizontal shear
properties. Procedure 2 assesses differential trends between the treated and untreated
specimens for bending and tension parallel properties with prolonged high temperature
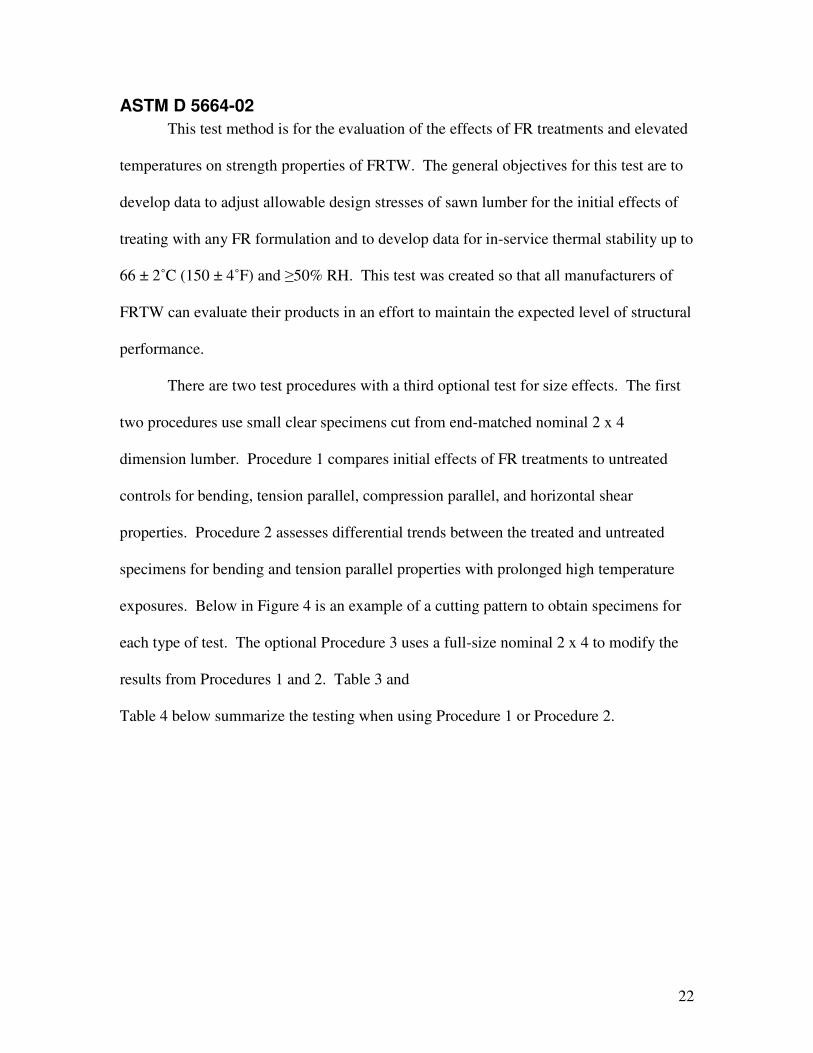
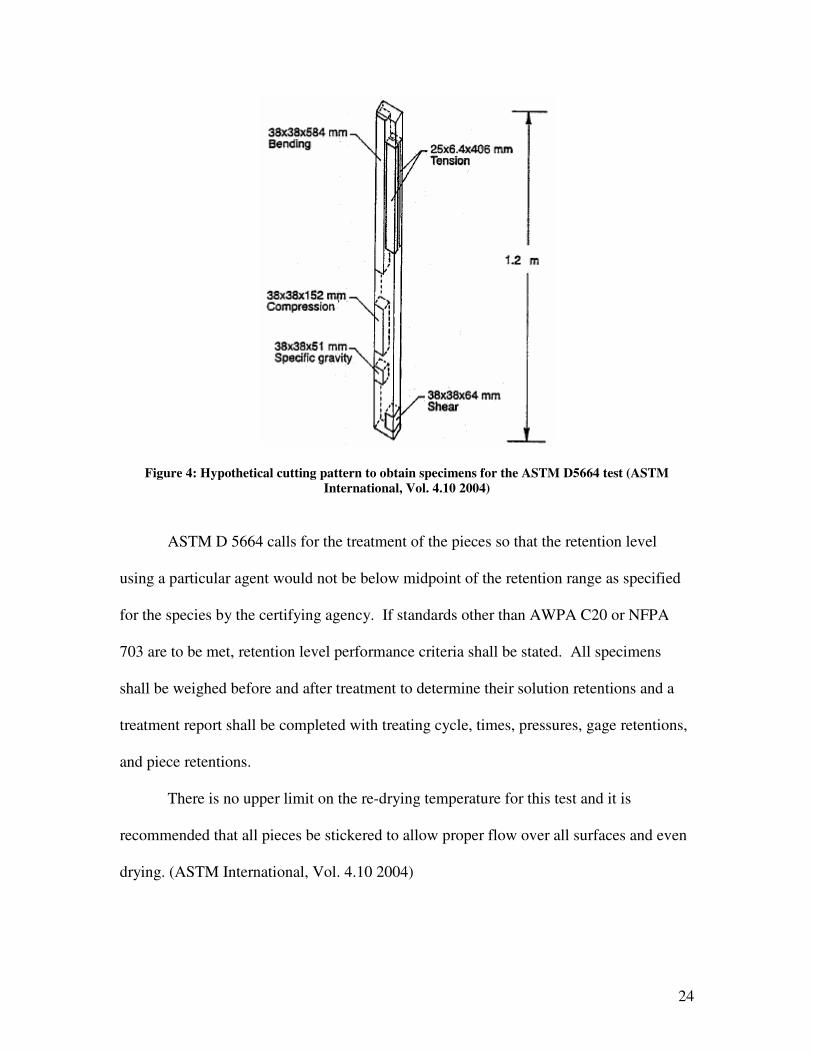
exposures. Below in Figure 4 is an example of a cutting pattern to obtain specimens for
each type of test. The optional Procedure 3 uses a full-size nominal 2 x 4 to modify the
results from Procedures 1 and 2. Table 3 and
Table 4 below summarize the testing when using Procedure 1 or Procedure 2.

23
Table 3: Summary of Procedure 1 for the ASTM D5664 test Procedure 1
Step Description/Requirements Limit Value Method Flame Spread Index � 25 10min ASTM E84 No significant combustion 20min - No flame spread past 10.5 feet from center of burners 30min -
Chemical Treatment
Treatment Report - - Moisture Content �19% Re-dry temperature, first day (-)2˚ tolerance Re-dry duration, first day 21hrs Re-dry temperature, first day (-)3˚ tolerance
Post-Treatment Drying
Re-dry duration, first day Remainder
Manufacturer Designated
Constant Weight 22+5˚C - Equilibration Relative Humidity 65+1% - Bending, Compression Parallel, Horizontal Shear Failure ASTM D143 Testing Tension Parallel Failure ASTM D3500
Table 4: Summary of Procedure 2 for the ASTM D5664 test
Procedure 2 Step Description/Requirements Limit Value Method
Chemical Treatment see Procedure 1 Post-Treatment Drying see Procedure 1
3 groups of specimens unexposed - - 3 groups exposed 66+2˚C 50% RH - Exposure duration 1 36+3days - Exposure duration 2 72+3days -
Exposure
Exposure duration 3 108+3days - Equilibration see Procedure 1
Bending Failure ASTM D143 Testing Tension Parallel Failure ASTM D3500
24
Figure 4: Hypothetical cutting pattern to obtain specimens for the ASTM D5664 test (ASTM International, Vol. 4.10 2004)
ASTM D 5664 calls for the treatment of the pieces so that the retention level
using a particular agent would not be below midpoint of the retention range as specified
for the species by the certifying agency. If standards other than AWPA C20 or NFPA
703 are to be met, retention level performance criteria shall be stated. All specimens
shall be weighed before and after treatment to determine their solution retentions and a
treatment report shall be completed with treating cycle, times, pressures, gage retentions,
and piece retentions.
There is no upper limit on the re-drying temperature for this test and it is
recommended that all pieces be stickered to allow proper flow over all surfaces and even
drying. (ASTM International, Vol. 4.10 2004)

25
ASTM D 6841-03 ASTM D 6841 is the standard practice for calculating design value treatment
adjustment factors for FRTW. This test uses results obtained from ASTM D 5664 and in
conjunction with computer generated thermal distribution curves, allows the user to
calculate design adjustment factors to be applied to published allowable stress values in
order to capture the effects of treatment and service temperatures. This test ensures that
structural engineers are able to effectively design using FRTW by compensating for these
negative effects.
Some simple equations are used to determine the design factors. The first three
equations are shown below and the variables are described in Table 5 below.
( )
( )
( )[ ]21
21
2
50
50
ln
/50
TTRTTE
kk
RHkk
DkaR
a
it
tti
⋅⋅−
=���
����
�
=
+=
Table 5: Summary of variable for calculation of strength reduction design factors for FRTW Equation 1 Equation 3
Symbol Description Symbol Description Rti Ratio of average treated to untreated values k2 Strength loss rate at mean bin temperature D Number of days specimens exposed to elevated
temperatures Ea 21,810 cal/mol-˚K a Intercept R 1.987 cal/mol-˚K kt Slope, strength loss rate T1 Test temperature, ˚K
Equation 2 T2 Bin mean temperature, ˚K k50 Strength loss rate at 50%RH RHi Elevated temperature test RH
Equation (1) determines a regression line that describes the loss of strength over
time. Equation (2) (ASTM Int., Vol. 4.10 2004) calibrates the strength loss rate for and
RH to the strength loss rate at 50%RH. Equation (3) (ASTM Int., Vol. 4.10 2004) then
calculates the strength loss rate per day.
(1) (ASTM Int., Vol. 4.10 2004)
(2) (ASTM Int., Vol. 4.10 2004)
(3) (ASTM Int., Vol. 4.10 2004)

26
Equation (4), shown below is the final equation in the process. This final
equation uses the strength loss rate per day calculated from Equations (1), (2), and (3),
and other values described in Table 6, to finally determine the treatment adjustment
factor for particular species impregnated with a specific fire-retardant. (ASTM
International, Vol. 4.10 2004)
( )( )[ ]CLTCFnITTF −−= 1
Table 6: Summary of variable for final equation for determining treatment adjustment factors for FRTW
Equation 4 Symbol Description
TF Treatment adjustment factor = (1-IT) IT Initial treatment effect = (1-Ro) n Number of iterations = 50
CF Cyclic loading factor = 0.6 CLT Total annual capacity loss Ro Ratio of average treated to untreated values for unexposed specimens
ASTM D 3201-94(03) ASTM D 3201 is the standard test method for hygroscopic properties of FRTW
and wood based products. This test prescribes the procedure for determining the MC of
FRTW samples after being exposed to a standard high relative humidity condition of
90±3%RH at 27±2˚C (ASTM International, Vol. 4.10 2004). Data collected from this
test allows engineers to suitably asses the impact of designing using FRTW in humid
environments.
It is important to test the hygroscopic properties of FRTW because these products
are particularly susceptible to retaining high levels of moisture, especially at high RH.
This can cause staining, decay, poor paint adhesion, migration and excretion of
chemicals, and even fastener corrosion. A summary of the testing procedures can be seen
in Table 7.
(4) (ASTM Int., Vol. 4 2004)
27
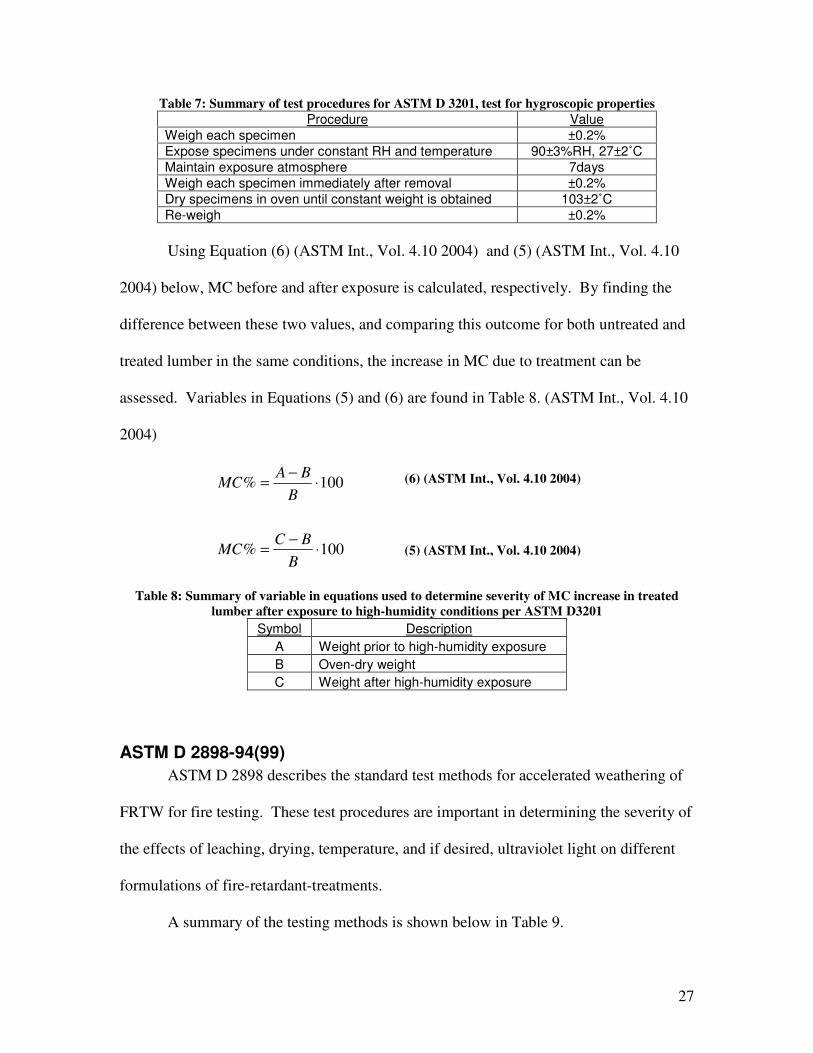
Table 7: Summary of test procedures for ASTM D 3201, test for hygroscopic properties Procedure Value
Weigh each specimen ±0.2% Expose specimens under constant RH and temperature 90±3%RH, 27±2˚C Maintain exposure atmosphere 7days Weigh each specimen immediately after removal ±0.2% Dry specimens in oven until constant weight is obtained 103±2˚C Re-weigh ±0.2%
Using Equation (6) (ASTM Int., Vol. 4.10 2004) and (5) (ASTM Int., Vol. 4.10
2004) below, MC before and after exposure is calculated, respectively. By finding the
difference between these two values, and comparing this outcome for both untreated and
treated lumber in the same conditions, the increase in MC due to treatment can be
assessed. Variables in Equations (5) and (6) are found in Table 8. (ASTM Int., Vol. 4.10
2004)
100%
100%
⋅−=
⋅−=
BBCMC
BBAMC
Table 8: Summary of variable in equations used to determine severity of MC increase in treated lumber after exposure to high-humidity conditions per ASTM D3201
Symbol Description A Weight prior to high-humidity exposure B Oven-dry weight C Weight after high-humidity exposure
ASTM D 2898-94(99) ASTM D 2898 describes the standard test methods for accelerated weathering of
FRTW for fire testing. These test procedures are important in determining the severity of
the effects of leaching, drying, temperature, and if desired, ultraviolet light on different
formulations of fire-retardant-treatments.
A summary of the testing methods is shown below in Table 9.
(5) (ASTM Int., Vol. 4.10 2004)
(6) (ASTM Int., Vol. 4.10 2004)

28
Table 9: Summary of testing methods for the ASTM D 2898 test for accelerated weathering of FRTW for fire testing
ASTM D 2898 Testing Methods Step Description/Requirements Limit Value Note
Twelve, 1 week cycles 96hrs wet, 72hrs dry - Water Application 0.7in/hr at 35-60˚F Fine spray, No recirculation Drying 135-140˚F, 25ft/min Wind Temp measured 1in above specimen
Method A Exposure
Cycle Cycle specimen locations After each cycle Same number cycles in each location 24hr exposure cycle 4hrs dry, 4hrs wet, 4hrs dry,
4hrs wet, 8hrs rest Repeat for 1000hrs total
Water Application 0.3±0.02gal/min-ft^2, < 90˚F No recirculation for 3cycles, then � 5gal fresh water each cycle
Drying 150±5˚F, 25ft/min Wind Temp measured 1in above specimen Ultraviolet Exposure Continuous during drying GE type H275 RUV or Osram Ultra-
Vitalox bulbs
Method B Exposure
Cycle
Cycle specimen locations After one or more cycles Same number cycles in each location Conditioning Equilibrate Moisture
Content Per applicable fire test ASTM E 84, E 108, E286
After conditioning, a flame spread test is conducted to determine if an increase in
classification is warranted. If the sample does not exhibit significant progressive
combustion after a 20-minute period, FSI is at or below 25, and flames do not spread 10.5
feet beyond the centerline of the burners at any time, the sample has passes and can still
be classified as FRTW.
International Building Code and NFPA 5000 The International Building Code (IBC) and NFPA 5000 address the issue of
FRTW in essentially the same way. Each uses the guidelines set out by ASTM D5644
for required chemical retention and references ASTM E84 for flame spread. The same
requirement for flame spread index (FSI) of less than or equal to 25 must be maintained
for both codes. Additionally, significant combustion cannot be observed for 20 minutes,
and the flame front can never extend more than 10.5 feet past the centerline of the
burners for the entire 30 minute of the standard test.
Both of these codes describe how all FR treated materials must be labeled
showing the mark of an approving agency, the identification of the treating manufacturer,

29
the name of the treatment, the species of wood, FSI and smoke development index (SDI),
method of re-drying, its conformance to ASTM E84 and other appropriate standards, and
must include the words “No increase in the listed classification when subjected to the
Standard Rain Test” if it is listed for use in exposed atmospheres (ASTM D2898).
Adjustments for design values shall be based on approved methods of
investigation (any applicable ASTM test) where effects of temperature and humidity of
in-service conditions are anticipated. Each manufacturer shall publish modification
factors for service at ambient temperatures of up to 100˚F for lumber used in roof
framing and also must publish allowable maximum loads and spans for roof sheathing.
If FRTW is exposed to weather, it shall be identified as “exterior” to indicate no
increase in FSI when subjected to ASTM D2898.
Moisture content of interior FTRW shall not exceed 28% when tested in
accordance to ASTM 3201, at 92% RH. Exterior FRTW MC shall not exceed 19% for
lumber and 15% for structural panels. Kiln dried specimens shall be dried at
temperatures not exceeding those used in the applicable testing procedures. (International
Code Council 2002) (National Fire Protection Association 2005)
It is clear that code officials for the IBC and NFPA 5000 have seen significant
worth in the standard testing procedures and the characteristics of FRTW that they asses.
NFPA 703 NFPA 703 is the standard for FRTW and fire retardant (FR) coatings for building
materials. By definition in NFPA 703, FRTW is a wood product impregnated with
chemical by a pressure process or other means during manufacture, which is tested in
accordance with NFPA 255, ASTM E 84, or UL 723, has a listed flame spread index of

30
25 or less, and shown no evidence of significant progressive combustion when the test is
continued for an additional 20-minute period; nor does the flame front progress more
than 10.5 feet beyond the centerline of the burners at any time during the test (NFPA
2005).
For interior applications, NFPA 703 mandates that FRTW shall not have greater
than 28%MC when tested in accordance with ASTM D 3201 at 92%RH, and lumber
shall also be tested in accordance with ASTM D 5664.
For each species tested with ASTM D 5664, NFPA 703 states that design
modification factors shall be developed via ASTM D 6841 and published by each
manufacturer for service temperatures up to 100˚F and for service roof framing which
take into account climatological location.
For exterior applications, NFPA 703 states that all FRTW lumber products have
19%MC or less. It also states that if the lumber is air dried after treatment it must be
protected from the weather, and if it is kiln dried, the drying temperature must not exceed
the temperatures used in drying when being tested with ASTM D 5664.
Per NFPA 703, all FRTW products must be labeled in the same manner described
in both the IBC 2003 and NFPA 5000, discussed in the previous section. (NFPA 2005)
As in the IBC 2003 and NFPA 5000, the steps that NFPA 703 mandates make it
clear that the code officials believe strongly that the issues with FRTW addressed by the
ASTM standard test methods are quite important.
2.4 Commercial FRTW As described in Section 2.2 Overview of FRTW, in the past fire retardant
treatments have depended upon phosphorus based compounds to achieve fire

31
performance properties. These compounds were known to have serious negative effects
on strength and durability. Advancements in chemical research have brought about a
new generation of FRTW formulations that contain no phosphates, but still exhibit
exceptional fire performance properties without compromising critical engineering
properties. (FirePRO™… 2001)
Many different FRTW commercial products have been specially formulated to
target a specific quality in order to enhance their performance for specific tasks. For
example, FRTW specified to be used in outdoor applications has enhanced corrosion
resistance and hygroscopicity while the indoor version has superior structural
capabilities. Because each product is designed to be used for a particular application,
each has its own stipulations for design and installation practices. These procedures are
listed in their respective product specification sheets which are located in Appendix A.1
Product Specifications for Various Commercial FRTW Products.
2.5 Truss Design This section will provide an overview of the design approach used to establish
truss member sizes for the thermal analysis and time to failure analysis to be discussed
later.
Structural Analysis A model living room was developed to obtain a truss design for thermal analysis.
A square room, 16 feet by 16 feet, was used for the preliminary design, with truss joist
spacing of 24 inches center to center. The live load used was 40 pound per square foot
which was taken from the IBC 2003 edition, Table 1607.1 for a residential living room.
The material used was Number 1 Southern Pine. Strength properties for the wood were

32
taken from Table 4B of the National Design Specification (NDS) Supplement, 2001
Edition. Load and Resistance Factor Design (LRFD) was the design method used for
determining the overall loading while Allowable Stress Design (ASD) was used to size
the actual members using the equations provided by the NDS. Hand calculations for the
truss loading are shown in Appendix A.2 Typical Residential Floor Truss Loading while
the computer program “TRUSS-4” was used to obtain each specific member force.
TRUSS-4 The computer program TRUSS was developed by John F. Fleming at the
University of Pittsburg in 1988 for the stiffness analysis of plane trusses. Dr.
Paramasivam Jayachandran revised the program in 1993 at Worcester Polytechnic
Institute and renamed it TRUSS-4, which was the version used for this project.
TRUSS-4 uses Castigliano’s Second Theorem in the form of a series of matrices
to evaluate highly indeterminate structures. Table 10 is a summary of the values
necessary to run the program and those that are returned. Examples of full input and
output files are shown in Appendix A.3 Sample Input and Output Files.
Table 10: Summary of input and output variables involved in using TRUSS-4 TRUSS-4 Input and Output
Number of Joints Number of Members Number of Materials Number of Supports Summary of Input
Initial Input Values
Number of Loaded Joints Joint Displacements Joint Locations Member Axial Forces Material MOE
Output Values Support Reactions
Member Locations and Cross-sectional Areas
Support Restraints Additional Inputs
Joint Loads
Designing an Economical Truss

33
Deciding on the truss configuration to be used began by comparing a simple original
design to a truss that is used in a known fire rated configuration (Southern… 2001-2006).
Both are shown in Figure 5 below as Type 1 and Type 2 respectively.
Figure 5: Original choices of truss configurations and the resulting variations
TRUSS-4 was then used to determine the axial loading each member would undergo
using these particular arrangements. It was discovered that the compressive forces were
significantly larger than the tensile forces, implying that the top chord would need to be
much larger than the bottom. This gave way to the desire to design the most economical
truss configuration for the floor system.
Because the focus of the redesign was to reduce the maximum compressive
forces, each variation was designed using multiple diagonals slanting in towards the
center of the truss because this will cause the members to be loaded compressively rather
than in tension, allowing for a greater number of members to share the loading.

34
Criteria used for the final choice in order of importance was: smallest maximum
compressive load, smallest maximum tensile load, the least number of redundant
members (members with axial force of zero), and the least number of members. Truss
Type 3 and 4 were chosen as the most economical truss configurations.
National Design Specification The NDS provided a guide for the design of wood members using the ASD
method. Basic equations for axially loaded members are shown below.
PiFtMDcc
c
CCCCCCFFAFP
⋅⋅⋅⋅⋅⋅=
⋅′=′' (7) (American Wood Council 2001)
FitMDtt
t
CCCCCFFAFT
⋅⋅⋅⋅⋅=′⋅′=′
(8) (American Wood Council 2001)
Where P’ and T’ are the compressive and tensile capacities of a section with area A.
Other variables in Equations 1 and 2 are described in Table 11 below.
Table 11: Explanation of variables for ASD equations provided by the NDS Equation (1) Equation (2)
F'c Adjusted compressive stress F't Adjusted tensile stress Fc Tabulated compressive stress Ft Tabulated tensile stress CD Load duration factor CD Load duration factor CM Wet service factor CM Wet service factor Ct Temperature factor Ct Temperature factor CF Size factor Ci Incising factor Ci Incising factor CF Size factor CP Column stability factor
2.6 Heat Transfer Models This section will describe strength and weaknesses of two types of models that
could be used for thermal analysis. Reasons for choosing the final model type are also
discussed.

35
Finite Element Models A finite element model (FEM) is beneficial because it uses complex
numerical analysis methods that have the capability to solve very complicated problems
by encompassing multiple modes of heat transfer all at once. But like all models, FEM
has some important limitations that make it difficult to use in this type of analysis.
The most important limitation is something that is inherent to most if not all finite
element models, and is the fact that there is no way to capture the chemical
transformation from wood to char as the members heat up and eventually burn. This is a
problem because char has a much lower thermal conductivity than that of wood,
providing significant insulation after it is formed, therefore any analysis that excludes this
phenomenon is not wholly representative.
One software package that uses FEM was investigated in this project but this
limitation and other complications made it necessary to use a different type of model.
A model of a truss member with an attached plate was set up in a program called
Thermal Analysis System (TAS). The downside to TAS was that it had difficulty
representing the thermal relationship between the steel plate and the wood member. The
wood acted as such a strong insulator that the model kept the steel temperature at
whatever temperature the wood was directly underneath the plate. In reality the high
thermal conductivity of steel would cause the plate to heat up much faster than the wood,
regardless of the wood temperature.
Despite the many limitations of the program, it was intended to provide a measure
of temperature versus time in the wood and steel to be compared to another model.
Unfortunately further difficulty in getting time and temperature dependent variables to
work with the transient analysis package led to its eventual abandonment.

36
Though an FEM analysis was not completed in this project, there are similar type
studies that have been performed. The closest to this scenario would be a Ph.D.
dissertation completed by Barry Wayne Gammon at the University of California,
Berkeley in 1987 entitled “Reliability Analysis of Wood-Frame Wall Assemblies
Exposed to Fire”.
Finite Difference Models A finite difference model (FDM) is a thermal analysis method that uses specific
time step intervals to calculate changes in temperature of a particular material over that
interval. By adding the change in temperature to the initial temperature, the final
temperature after the specified time is determined. This final temperature can then be
used as the initial temperature to run the analysis again, and so on and so forth for as long
as the user likes. This type of model works well when used in conjunction with a
spreadsheet tool, but becomes tedious to set up for complicated problems using multiple
materials and multiple modes of heat transfer.
Equation (9) below is the final form of the equation derived to determine the
change in wood temperature as a function of time at a certain location in the cross-
section.
All input variables are described in Table 12 below.
( ) ( ) ( ) ( ) ( )���
�
�
⋅⋅+⋅⋅⋅
����
�
�
�
∆⋅⋅⋅−∆⋅⋅⋅−++
∆⋅−=∆
iipiwwpwgiipichchchpch
ch
ch
w
w
i
i
gw tctc
TtcTtc
kt
kt
kt
tTTT
ρρρρ
5.01
(9)

37
Table 12: Description of input variables for the finite difference equation for thermal analysis
This equation was developed using the basic principles of conservation of work
and energy for heat transfer. It is a one dimensional model that enabled the determination
of temperature variation through a wooden cross-section and via some assumptions, the
depth of the char layer at any given time.
Finite Difference Equation Input Variables Symbol Description Symbol Description �Tw Change in Wood Temperature �w Wood Density �Tg Change in Gas Temperature �ch Char Density �Tch Change in Char Temperature �i Insulation Density �Ti Change in Insulation Temperature kw Wood Thermal Conductivity T Temperature at Increment Depth kch Char Thermal Conductivity Tg Gas Temperature ki Insulation Thermal Conductivity �t Change in Time cpw Wood Specific Heat tw Wood Thickness cpch Char Specific Heat tch Char Thickness cpi Insulation Specific Heat ti Insulation Thickness A Area Being Heated

38
3.0 Methodology for Analysis This chapter will provide and overview of the member sizes and characteristics of
the truss plates used in the time and temperature dependent analysis of overall structural
integrity. Several modes of failure have been established as well as criteria to determine
the point of failure.
3.1 Evaluation of the Chosen Scenario
Truss Members The design of typical truss members was completed to decide the member cross-
sectional areas should for use during the thermal analysis portion of the project. Heat
will be introduced to the truss as the fire in the room below heats the gypsum board layer,
and is conducted into the bottom chord. The thermal analysis is simplified by assuming
that conduction is the primary form of heat transfer in this situation, and that there are no
radiative effects from the heated gypsum layer to the exposed sides of the members.
Since the bottom chord of the truss is the only member contact with the gypsum board
protection, its dimensions were used in thermal analysis. Member sizes for the bottom
chords of the various trusses are summarized in Table 13 below.
Table 13: Bottom chord member sizes for Type 3 and 4 trusses using sawn lumber and FRTW Sawn Lumber FRTW
Truss Type Span
Chord Size: Nominal (Actual)
Area (in2)
Truss Type Span
Chord Size: Nominal (Actual)
Area (in2)
16' 1"x4" (0.75"x3.5") 2.625 16' 2"x4" (1.5"x3.5") 5.25 20' 1"x6" (0.75"x5.5") 4.125 20' 2"x6" (1.5"x5.5") 8.25 3 24' 2"x6" (1.5"x5.5") 8.25
3 24' 2"x6" (1.5"x5.5") 8.25
16' 2"x4" (1.5"x3.5") 5.25 16' Double 2"x4" (3.0"x7.0") 21.0 20' 2"x6" (1.5"x5.5") 8.25 20' 2"x6" (1.5"x5.5") 8.25 4 24' 2"x6" (1.5"x5.5") 8.25
4 24' Double 2"x6" (3.0"x11.0") 33.0
Each FRTW member was designed as ordinary sawn lumber using the NDS except the
final allowable design value was multiplied by the factor for tensile strength listed in

39
Table 14 in Section 3.2 Strength Modeling for an estimated maximum 100˚F service
temperature.
Truss Plates Because this project is focusing on the tension chord of the truss, a parallel
oriented truss plate is examined. A parallel plate is aligned so that its longest dimension
is parallel to length of the member, or parallel to the wood grain. The type of truss plate
examined was chosen to be the same as one of those examined by White, et al, in their
experiments. Their parallel plate was made of Grade A, 20 gauge steel, with 1/3 inch
long teeth at a density of 9.4 teeth per square inch. The dimensions of the plate were 3
inches by 7.5 inches long.
Fire Scenario and Thermal Analysis Because the strength models described in Section 3.2 Strength Modeling are
based upon experiments using the ASTM E-119 standard exposure, the same
time/temperature curve was also in the FDM to evaluate wood temperature. Temperature
values were taken at 100 second increments from the standard fire curve for ASTM E-
119 and input as the gas temperature for the FDM.
Insulation thicknesses of ½” and double thick 5/8” (1.25 inches) were evaluated
with standard gypsum board as the insulating material.
Wood temperature as a function of time was determined at ½” increments up to
5.5 inches, which is the widest cross-sectional dimension of the largest bottom chord
member determined by the truss design (nominal 2x6).
To account for char formation, the wood thickness at any point was equal to the
increment depth minus the char thickness. Char thickness was defined as the depth

40
where a temperature of 288˚C has reached, which is the approximate temperature that
wood must reach in order to begin char formation. This depth was determined via linear
interpolation between the temperatures at the surface of the wood and at the increment
being evaluated. Because there is interdependency between temperature and char depth,
a spreadsheet was used to iterate between this and several other variables that shared
dependency with temperature (density, thermal conductivity, specific heat), until there
was a closure of 0.001.
Thermal properties of wood are known to change with temperature. Figure 6
shows how density, thermal conductivity and specific heat vary as temperature increases.
To capture this phenomenon, each curve was broken down into its linear parts, and
simple slope-intercept equations written for each of them. Each layer could be assigned
its own thermal properties depending on their respective temperatures. Char was
assigned thermal properties corresponding to the portions of the graph after the 288˚C
mark.

41
Figure 6: Thermal properties of wood as a function of temperature (Lie 1992)
3.2 Strength Modeling
Thermal Degradation of Wood Empirical equations for the thermal degradation of the sawn lumber strength
properties were determined by White et al. and are described in the following equations.
)()( tPeo
eo
o
t
AtTtT
PP
⋅+⋅⋅=
γ
)(215
);/(198
);(100
65.0
BendingTnCompressioTensionTMOET cccP �
�
���
�=γ
32; cs
otTTTTTA +
=−=
(10)
(11)
(12)

42
Where te is the exposure time in minutes, To is the initial room temperature, Tc is the
center temperature of the lumber at time te, Ts is the surface temperature of the lumber at
time te, At is the normalized change in wood temperature and is defined in Equation 6, Pt
is any strength property, Po is the property being evaluated at room temperature, and �p is
a correction factor for each strength property.
Equations (10), (11), and (12) are based upon an idealized plenum
time/temperature exposure equal to that of the ASTM E-119 standard exposure. The
equation for At is derived from trapezoidal rule when using the approximation that the
temperature boundary layer in the wood is parabolic in nature. This research was
structured to exclude the effects of charring in order to define thermal degradation of
wood sections before char forms; therefore there is no reduction in cross-section.
Equations for the thermal degradation of FRTW properties at temperatures seen in
a fire scenario have not yet been developed, making this a topic for further research.
However, the trend can be approximated by inspection of the reduction factors for the
commercially available FRTW which are tabulated below. Typically factors will
decrease as temperature increases though there are some outliers since these values are
taken from specifications for different brand products.
Temp. FRTW Design Factor (Southern Pine) ˚F Tension Comp. MOE Bending
80 0.92 0.94 0.98 0.89 80 0.77 0.93 0.88 0.85
100 0.88 0.94 0.95 0.91 150 0.85 0.67 0.91 0.8 150 0.65 0.85 0.89 0.79 180 0.82 1 0.95 0.84
Table 14: Design factors for FRTW for service up to the given temperature Figure 7 below illustrates a trend that was created for the tensile capacity using the design
values in Table 14. Graphs and trends for the remaining strength properties can be

43
viewed in Appendix A.4 Strength Properties of FRTW vs. Temperature. Values listed for
180˚F created outliers in all categories, so they were eliminated in order to achieve a
more representative trendline. Linear, logarithmic, power, and exponential trendline
functions were each evaluated and best fit was chosen based upon regression values that
are shown in each figure.
Percent Tension Capacity Vs. Temperature
y = -0.0015x + 0.9824R2 = 0.2513
0.6
0.65
0.7
0.75
0.8
0.85
0.9
0.95
70 80 90 100 110 120 130 140 150 160
Temperature (F)
Desi
gn F
acto
r
Figure 7: Tensile capacity of FRTW versus temperature in terms of manufacturer published design
factors
Thermal Degradation of Steel Thermal degradation models for steel have been developed and are published by
the Society of Fire Protection Engineers (SFPE). Equations (13) (SFPE 2002) and (14)
are used to determine the MOE of a steel section at any temperature T, and Equations
(15) (SFPE 2002), and (16) (SFPE 2002) are used to determine the yield stress of steel at
any temperature T.

44
CT
MOET
TMOE o
�60001100
ln20001
≤<
⋅����
�
�
����
�
�
��
���
�⋅+=θ
CT
MOET
TMOE o
�6005.53
69.0690
>
⋅��
���
�
−−=θ
CT
TT
yoy
�60001750
ln9001
≤<
⋅����
�
�
����
�
�
��
���
�⋅+= σσ θ
CTT
Tyoy
�600240
34.0340
>
⋅��
���
�
−−= σσ θ
As described in the following section, an average maximum deflection limit of 30˚ was
used to categorize tooth failure, defined by inspecting photographs from previous work
concerned with peeling failures (Percival, et al 1971). Equation (17), for the maximum
deflection of a uniformly loaded cantilever beam, was used to determine maximum
deflection along the tooth.
EIL
MAX 8
4⋅= ωδ
Equation (17) is dependent upon MOE; therefore it was in this manner that thermal
effects were incorporated into the evaluation of plate failure. Initial plate material
properties for this analysis were taken from product specifications on hot-dipped
galvanized steel, provided by the AK Steel Corporation and obtained via their website
(AK Steel Corp. 2000).
(13) (SFPE 2002)
(14) (SFPE 2002)
(17)
(15) (SFPE 2002)
(16) (SFPE 2002)

45
The plate itself was modeled to fail in tension. By using the simple equation for
tensile capacity, shown below as Equation (18), thermal effects could be incorporated
using the degradation equations for yield stress provided by the SFPE.
syT AF ⋅= σ
3.3 Failure Modes and Criterion
Tooth Withdrawal Tooth withdrawal will occur when the loading on the joint exceeds the total
capacity of the involved connecting teeth. At elevated temperatures, wood begins char
and excessive loading is transferred to the remaining load-carrying teeth if charring
occurs across the tooth or to the tips of the teeth if charring occurs along the tooth. A
combination of the wood being locally crushed under the tooth, and tooth deformation
from loading, will create large tip deflections with less wood surface area for the steel
tooth to grip. At some critical angle and temperature, degraded tooth bending strength,
reduced contact of the wood, and increased localized loading will cause the teeth to peel
out of the section
Because the model developed for this project addresses char in only one direction,
tooth withdrawal via char formation will occur when the char layer passes enough rows
of teeth so that the remaining teeth have insufficient capacity to carry the design load.
Tooth withdrawal could also occur if increased temperature of the teeth causes bending
strength to degrade to the point where the residual tooth capacity is below the required
capacity. A combination of these two events is another possible scenario.
Tooth temperature is approximated as the temperature of the wood section at the
same location. The critical average deflection point used to determine the time of failure
(18)

46
is one third of the tooth length, or about 30˚. This value was established through the
inspection of photographs taken after tension testing was done on sawn lumber and
FRTW joints connected with metal truss plates. This research was conducted at the FPL
and the report is published under the title “Technical Note No. 6” (Percival, Suddarth
1971).
Mechanical Failure Mechanical failure was defined for the wood sections by determining the critical
cross-sectional area needed to carry the design load. When the section has charred to the
point where the critical area is larger than the residual area, the member has failed.
Failure of the steel plate was defined as when the tensile stress in the plate
exceeds the maximum allowable tensile stress after thermal degradation.

47
4.0 Results and Discussion This chapter summarizes the results obtained from the FDM for temperature
variation through the wooded cross-section. With this data, the thermal degradation
models have been evaluated and applied to each truss to determine subsequent failure
times after exposure. Also, failure analysis results are summarized and their overall
implications are discussed.
4.1 Model Analysis Analysis using the FDM described in Section 2.6 Heat Transfer Models resulted
in the data shown in Figure 9 and Figure 18 for ½” and double 5/8” thick gypsum board
protection respectively.
1/2" Gypsum Board Protection
0
200
400
600
800
1000
1200
0 1 2 3 4 5 6
Time (hours)
Tem
pera
ture
(C)
ASTM E119Wood Surfacet=0.5"t=1.0"t=1.5"t=2.0"t=2.5"t=3.0"t=3.5"t=4.0"t=4.5"t=5.0"t=5.5"
Figure 8: Temperature of wooden member at various depths when protected by 1/2" gypsum board
and exposed to the ASTM E-119 fire curve

48
2x5/8" Gypsum Board Protection
0
200
400
600
800
1000
1200
0 1 2 3 4 5 6
Time (hours)
Tem
pera
ture
(C)
ASTM E119Wood Surfacet=0.5"t=1.0"t=1.5"t=2.0"t=2.5"t=3.0"t=3.5"t=4.0"t=4.5"t=5.0"t=5.5"
Figure 9: Temperature of wooden member at various depths when protected by double 5/8" gypsum
board and exposed to the ASTM E-119 fire curve It is shown by these figures that the wood temperature decreases as the depth increases,
and by increasing the thickness of the insulation, thermal penetration was postponed
significantly.
Using this data, the models described in Section 3.2 Strength Modeling for the
thermal degradation of sawn lumber and the one developed for FRTW using published
design values are evaluated as a function of time for residual tensile and compressive
strength when protected by ½” and double 5/8” gypsum board insulation.

49
1/2" Gypsum Board Protection
0
0.2
0.4
0.6
0.8
1
1.2
0 1 2 3 4 5 6Time (hours)
Perc
ent T
ensi
le C
apac
ity
SL, t=3.0"SL, t=1.5"FRTW, t=3.0"FRTW, t=1.5"
Figure 10: Residual tensile capacity of sawn lumber and FRTW when exposed to the ASTM E-119 fire curve and protected by 1/2" gypsum board
2x5/8" Gypsum Board Protection
0
0.2
0.4
0.6
0.8
1
1.2
0 1 2 3 4 5 6Time (hours)
Perc
ent T
ensi
le C
apac
ity
SL, t=3.0"SL, t=1.5"FRTW, t=3.0"FRTW, t=1.5"
Figure 11: Residual tensile capacity of sawn lumber and FRTW when exposed to the ASTM E-119
fire curve and protected by double 5/8"gypsum board
Figure 10 and Figure 11 show that the residual tensile capacity of sawn lumber as
compared to that of FRTW, when exposed to the ASTM E-119 fire curve and evaluated
using the strength degradation correlations described earlier, is much more resilient.

50
These figures also show that as insulation thickness increases, so does the ability to
maintain residual cross-sectional capacity for a longer period of time.
4.2 Failure Analysis The first mode of failure that was investigated was that of a simple mechanical
failure of the wood section without using degraded capacity. Table 16 below summarizes
the results of this analysis. Highlighted members are those that correlate best with
combined fire endurance ratings of structural components as listed in Table 15 below.
Table 15: Expected fire endurance times for specific construction components (ASCE SFPE 29 1999) Expected Fire Ratings of Construction Materials
Description of Building Element Time 1/2" gypsum board 15min 5/8" gypsum board 20min
Wood truss floor assemblies, 24"c/c 5min
Table 16: Summary of failure times for each truss type and span for sawn lumber, FRTW, and different member orientations. Note the initial load to capacity ratios and the corresponding times to
failure.

51
One important finding that can be seen from this table is that member orientation
had a large impact on time to failure. Horizontal orientation denoted that the beam was
analyzed as if its long dimension was in contact with the gypsum board, and vertical
orientation denoted that the short dimension was in contact with the insulation. Because
the FDM was set up as a one dimensional model that neglected radiation effects, char
could only form starting at the gypsum layer and proceeding towards the back face of the
member. Subsequently, if the long dimension chars only a slight amount, the resulting
area loss is much greater than if char forms on the short dimension, making the time to
reach the critical area far less when analyzing horizontal members than vertical members.
Another important finding can be noticed by inspection of the initial load to
capacity ratios (ILCR). This is a measure of how much of the beams cross-section is
undergoing loading in-service. If the ILCR is close to 1.0, almost all the area is needed to
carry the design load. This will happen if the member capacity was just large enough and
the next size up was not needed. If the ILCR is far less than one, much of the cross-
section is not needed. This often happens if one member capacity is slightly too low and
the next larger size must be chosen though only a small amount of the added capacity is
actually needed. Table 16 shows how when the ILCR is close to one, and only a small
amount of area needs to be lost in order to reach the critical level, the truss will fail rather
quickly. When the ILCR is between 0.5 and 0.8, the truss failure time is longer and, for
the horizontal orientation, is on the same order as that predicted by Table 15.
Only trusses that exhibited failure times most closely resembling what was
predicted by ASCE SFPE 29 99 (highlighted in Table 16) were used for further analysis.
The next step was to incorporate strength loss of the residual cross-section of each

52
member due to thermal exposure. Strength reduction factors were taken from the data
shown in either Figure 10 or Figure 11, corresponding to the insulation thickness being
evaluated. Reduction factors and the subsequent reduced failure times are shown in
Table 17 below.
Table 17: Summary of failure times for selected trusses when using strength reduction models for the residual cross-sections
Updated Failure Times of Best Fit Members Using Degraded Residual Cross-Section
Truss Type Span(ft) Material
Nominal Member
Size Member
Orientation
% Residual Capacity
(1/2"gypsum)
% Residual Capacity
(2x5/8"gypsum)
1/2" Gypsum Failure
Time(min/sec)
2x5/8"" Gypsum Failure
Time(min/sec) 16 Sawn Lumber 2 x 4 Horizontal 0.875 0.87 27 / 1600 62 / 3700
Sawn Lumber 2 x 6 Horizontal 0.878 0.873 27 / 1600 60 / 3600 20 FRTW 2 x 6 Horizontal 0.545 0.552 8 / 500 25 / 1500 Sawn Lumber 2 x 6 Horizontal 0.899 0.905 17 / 1000 40 / 2400
3 24 FRTW 2 x 6 Horizontal 0.652 0.688 15 / 900 37 / 2200 16 Sawn Lumber 2 x 4 Horizontal 0.912 0.921 10 / 600 33 / 2000
Sawn Lumber 2 x 6 Horizontal 0.891 0.892 22 / 1300 50 / 3000 20 FRTW 2 x 6 Horizontal 0.58 0.622 20 / 1200 50 / 3000 4 24 Sawn Lumber 2 x 6 Horizontal 0.965 0.965 7 / 400 12 / 700
An important finding from this analysis is seen when inspecting failure times for
FRTW. Because, according to the model that was developed, FRTW strength decreases
severely with temperature, time to failure for the FRTW trusses were also dramatically
reduced. This is evident by comparing the failure time for the highlighted truss in Table
17 and comparing it to its corresponding failure time in Table 16. For the ½” gypsum
board protection, the failure time was reduced by a factor of about 3.5 and a factor of
about 2 for the double 5/8” gypsum. Because this isn’t representative of the nature of
FRTW, which is expected to perform better in fire, the model for strength reduction must
come into question. This model was derived from published design values for FRTW
when tested in accordance to ASTM D 5664. This test uses the highest temperatures that
could be expected in-service, which are relatively low temperatures from the standpoint
of a fire scenario, and exposes the specimens for long periods. As was described in
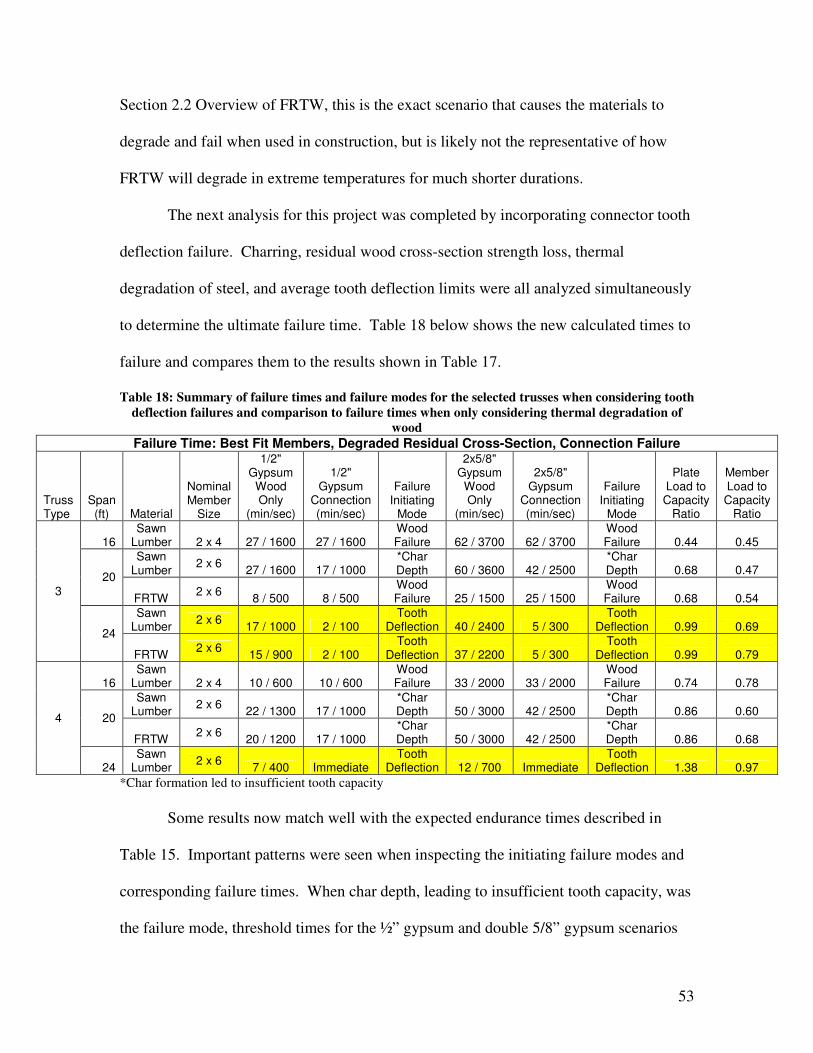
53
Section 2.2 Overview of FRTW, this is the exact scenario that causes the materials to
degrade and fail when used in construction, but is likely not the representative of how
FRTW will degrade in extreme temperatures for much shorter durations.
The next analysis for this project was completed by incorporating connector tooth
deflection failure. Charring, residual wood cross-section strength loss, thermal
degradation of steel, and average tooth deflection limits were all analyzed simultaneously
to determine the ultimate failure time. Table 18 below shows the new calculated times to
failure and compares them to the results shown in Table 17.
Table 18: Summary of failure times and failure modes for the selected trusses when considering tooth deflection failures and comparison to failure times when only considering thermal degradation of
wood Failure Time: Best Fit Members, Degraded Residual Cross-Section, Connection Failure
Truss Type
Span (ft) Material
Nominal Member
Size
1/2" Gypsum
Wood Only
(min/sec)
1/2" Gypsum
Connection (min/sec)
Failure Initiating
Mode
2x5/8" Gypsum Wood Only
(min/sec)
2x5/8" Gypsum
Connection (min/sec)
Failure Initiating
Mode
Plate Load to Capacity
Ratio
Member Load to Capacity
Ratio
16 Sawn
Lumber 2 x 4 27 / 1600 27 / 1600 Wood Failure 62 / 3700 62 / 3700
Wood Failure 0.44 0.45
Sawn Lumber 2 x 6 27 / 1600 17 / 1000
*Char Depth 60 / 3600 42 / 2500
*Char Depth 0.68 0.47 20
FRTW 2 x 6 8 / 500 8 / 500 Wood Failure 25 / 1500 25 / 1500
Wood Failure 0.68 0.54
Sawn Lumber 2 x 6 17 / 1000 2 / 100
Tooth Deflection 40 / 2400 5 / 300
Tooth Deflection 0.99 0.69
3
24 FRTW 2 x 6 15 / 900 2 / 100
Tooth Deflection 37 / 2200 5 / 300
Tooth Deflection 0.99 0.79
16 Sawn
Lumber 2 x 4 10 / 600 10 / 600 Wood Failure 33 / 2000 33 / 2000
Wood Failure 0.74 0.78
Sawn Lumber 2 x 6 22 / 1300 17 / 1000
*Char Depth 50 / 3000 42 / 2500
*Char Depth 0.86 0.60 20
FRTW 2 x 6 20 / 1200 17 / 1000 *Char Depth 50 / 3000 42 / 2500
*Char Depth 0.86 0.68
4
24 Sawn
Lumber 2 x 6 7 / 400 Immediate Tooth
Deflection 12 / 700 Immediate Tooth
Deflection 1.38 0.97 *Char formation led to insufficient tooth capacity Some results now match well with the expected endurance times described in
Table 15. Important patterns were seen when inspecting the initiating failure modes and
corresponding failure times. When char depth, leading to insufficient tooth capacity, was
the failure mode, threshold times for the ½” gypsum and double 5/8” gypsum scenarios

54
were established at around 17 minutes and 42 minutes respectively. This occurred
because when the char layer reached the first row of teeth, the remaining teeth involved
were insufficient in number and/or strength capacity to withstand their loading. This
failure was prevalent when the member ILCR was low enough so that the remaining
cross-section was sufficient up to the point where the charring passes the first row of
teeth, causing failure. Conversely, when failure times were found to be below the
threshold limit, member ILRC was closer to 1.0 and failure times did not change. This
occurred because the section loss from charring would cause member failure before the
char front could reach the first row of teeth.
Tooth deflection failures, highlighted in Table 18, occurred when the plate ILCR
was higher than around 0.9. The 30% deflection limit was reached very prematurely in
these cases because the plate used was either barely sufficient to carry the load or
insufficient from the start. This can be attributed to the fact that the plate sizes were
assumed from the start, and furthermore all assumed to be the same, without
consideration of loading. One interesting relationship that was noticed in this scenario
was that when the plate ILCR was about 15% greater than the member ILCR, but not
greater than 0.9, char depth would be the failure. As soon as the plate ILCR became less
than 15% greater than the member ILCR, the wood section would fail first.
Plate rupture failure mode was the final mode to be analyzed. Because there was
a lack of temperature versus time information for the plate portion of the connections, the
plate temperature was taken to be the average of the tooth temperatures. Table 19 below
shows the time to failure results when considering the possibility of every type of failure
investigated by this thesis.

55
Table 19: Summary of failure times when considering all modes of failure
Failure Time: Best Fit, Thermal Degrade, Connection, Plate Failure
Truss Type
Span (ft) Material
Nominal Member
Size
1/2" Gypsum
Connection (min/sec)
1/2" Gypsum
Plate (min/sec)
Failure Initiating
Mode
2x5/8" Gypsum
Connection (min/sec)
2x5/8" Gypsum
Plate (min/sec)
Failure Initiating
Mode
Plate Load to Capacity
Ratio
Member Load to Capacity
Ratio
16 Sawn
Lumber 2 x 4 27 / 1600 27 / 1600 Wood Failure 42 / 2500 42 / 2500
*Char Depth 0.44 0.45
Sawn Lumber 2 x 6 17 / 1000 17 / 1000
*Char Depth 42 / 2500 42 / 2500
*Char Depth 0.68 0.47 20
FRTW 2 x 6 8 / 500 8 / 500 Wood Failure 25 / 1500 25 / 1500
Wood Failure 0.68 0.54
Sawn Lumber 2 x 6 2 / 100 2 / 100
Tooth Deflection 5 / 300 5 / 300
Tooth Deflection 0.99 0.69
3
24 FRTW 2 x 6 2 / 100 2 / 100
Tooth Deflection 5 / 300 5 / 300
Tooth Deflection 0.99 0.79
16 Sawn
Lumber 2 x 4 10 / 600 10 / 600 Wood Failure 33 / 2000 33 / 2000
Wood Failure 0.74 0.78
Sawn Lumber 2 x 6 17 / 1000 17 / 1000
*Char Depth 42 / 2500 42 / 2500
*Char Depth 0.86 0.60 20
FRTW 2 x 6 17 / 1000 17 / 1000 *Char Depth 42 / 2500 42 / 2500
*Char Depth 0.86 0.68
4
24 Sawn
Lumber 2 x 6 7 / 400 Immediate Connection 12 / 700 Immediate Connection 1.38 0.97
It can be seen that when incorporating the plate failure as well, there is essentially no
impact on the failure times. This shows that when using the 30% deflection failure
criteria for the connector plate teeth, tooth deflection is a more critical limit than plate
tensile capacity. Because the truss plate was extremely under-designed for the 24 foot,
sawn lumber, Type 4 truss, the true mode of failure cannot be readily determined.
In this scenario, whether the tooth failed by deflection limit or via char depth, it
was ultimately the amount of teeth involved in carrying the load that was the limiting
factor. This, combined with the other data, suggests that when member ILCR is low
enough, and the number of rows of teeth involved is large enough, both the wood and
tooth capacities would be sufficiently large to withstand charring and thermal degradation
so that the plate itself will have ample time to heat, thermally degrade, and eventually fail
in tension.

56
Though these results can show a structural engineer many things about the nature
of light-weight truss failure modes, they are limited in their ability to capture how FRTW
would behave as a substitute for normal sawn lumber. To further the capabilities of this
type of analysis, future testing is needed.

57
5.0 Experimental Design It is evident that there is a great need for further research in the area of FRTW
before a more representative analysis can be completed. The purpose of this chapter is to
provide experimental procedures that will facilitate the gathering of necessary
information that is essential for advancing the work that has been described herein.
Experiments to test load capacity as a function of time and temperature target tension
members specifically because it is assumed that the bottom chord of a truss will be the
first member significantly affected by fire and will be the controlling factor at failure.
Due to the inherent variability that occurs when using a material such as wood, it
is suggested that each separate species be tested separately, as is done with other standard
test methods using wood. Furthermore, if testing is to be done to characterize particular
shipment or other quantity of wood, specimens should be chosen to be the most
representative of the lot, as is mandated by other standard tests using wood.
5.1 FRTW Thermophysical Properties Thermophysical properties are essential in any type of thermal analysis. The
development of accurate values for these properties, especially as a function of
temperature, would greatly advance the work completed in this thesis. Once these values
have been determined, the same FDM model that was developed could be used for
thermal analysis of FRTW, and a more genuine representation of its comparison to sawn
lumber can be made.
These proposed testing methods are for the determination of thermal conductivity,
specific heat capacity, and density, as a function of temperature, for FRTW. The ASTM
standard test procedures for determining conductivity and specific heat have several

58
bounding limits that are not wholly satisfied in this case. Because thermal analysis relies
heavily on these types of parameters, their accuracy is quite important; therefore due to
their possible inapplicability and overall complexity, these tests are only summarized
briefly. Possible alternative tests are also described. Some past work has been done to
determine the thermo-physical properties of untreated lumber as a function of
temperature (Knudson, Schniewind 1975), but the procedures used for their experiments
could not be located for comparison to the suggested methods.
Thermal Conductivity ASTM E 1225 is the standard test method for determining thermal conductivity of
solids by means of the guarded-comparative-longitudinal heat flow technique. This test
is intended to be used for materials with conductivities in the range of 0.2 to 200W/m-˚K
over a range of 90 to 1300˚K, but it is stated that it can be used for materials outside of
this range with decreased accuracy. Wood has thermal conductivity on the order of 0.1-
0.2W/m-˚K in this range. This test is intended to be used for homogeneous materials,
where wood is not, but is the most applicable standard at ASTM for testing this property.
To begin, a specimen of the material to be tested is placed under load, applied by
a clamp, between two equal-size reference specimens with known thermal properties.
Load is applied to the stack to ensure good contact between specimens. A thermal guard
cylinder, used to minimize heat losses, is placed around the test stack and contains at
least one heater to control its temperature profile. The guard must have approximately
the same temperature gradient as the test stack because if the gradient is largely different,
there will be heat transfer in one direction or the other, leading to skewed results. Figure
12 below shows schematics of an example testing arrangement.

59
Figure 12: Schematics of test configuration and instrumentation for ASTM E 1225 (ASTM Int. 2004) For equilibrium conditions at any temperature, thermal conductivity of the unknown is
derived from the measured temperature gradients in the respective specimens and the
thermal conductivity of the reference material using simple equations provided in the test
procedures. (ASTM International, Vol. 14.02 2004)
Specific Heat Capacity ASTM E 1269 is the standard test method for determining specific heat capacity
by differential scanning calorimetry. The normal temperature range of this test is 100˚C
to 600˚C, which is about half the temperatures usually associated with fire scenarios.
This range can be extended, however, depending upon the use of special instrumentation
and specimen holders.
This method, using a differential scanning calorimeter (DSC), will heat the test
material at a controlled rate in a constantly nitrogen purged atmosphere. The difference
in heat flow into the unknown specimen and a reference material, due to energy changes

60
in the materials, is continually recorded. Synthetic sapphire is always used as the
reference material in this test and specific heat values are listed in a table in the test
procedures for values up to 1000˚K and as low as 150˚K.
After the test chamber containing the unknown material is heated or cooled to the
desired initial temperature at a rate of 20˚C per minute, it is held at this temperature for
an indefinite amount of time (no less than 4 minutes) for equilibration. In the case of
wood products, the user should wait a considerable amount of time longer than the
minimum value since wood is known to have low thermal diffusivity. Variations with
this hold time can be implemented and differences in resulting values recorded to
determine the optimum equilibration period. The test specimen is then heated at 20˚C per
minute to the desired final temperature continuously recording the thermal curve. With
thermal curved for the synthetic sapphire, unknown material, and one from an empty
specimen holder, simple equations given in the test procedures can be used to determine
the specific heat capacity of the unknown material at the temperatures all along the
thermal curve. (ASTM International, Vol. 14.02 2004)
Density Density testing will begin by taking multiple formulations of FRTW and control
specimens of normal sawn lumber, using the same species, equal dimensions, and
approximately equal retention levels. Retention level of the pieces, using a particular
agent, would not be below midpoint of the retention range as specified for the species by
the certifying agency. Use sample dimensions of 10cm by 10cm by 2cm thick. Thinner
samples will ensure that when heated, less hold time will be needed to ensure equal
temperature levels throughout the specimen. FRTW is not allowed to be milled before

61
installation, so the specimens must be treated after being cut to size. Multiple species
will also be tested in order to obtain a wide range of results for comparison.
Make sample sets of 25 specimens, with five samples of four types of FRTW and five
samples of sawn lumber pieces. Create as many specimen sets for as many different
temperatures are to be tested for the corresponding density. Equilibrate the specimens to
65%RH and 19%MC. Weigh the blocks to a sensitivity of ±0.01grams. Load one
sample set into an oven with each piece oriented vertically to promote even, fast heating.
Before testing begins, an optimal equilibration period for achieving even specimen
temperature distribution should be established for each oven to ensure quality results.
Heat the oven at a rate of 10˚C per minute to the desired testing temperature and hold for
the established optimal temperature equilibration period.
When hold time is completed, weigh blocks again to the same sensitivity as quickly
as possible to maintain desired temperature. If oven safe weight measurement techniques
are available, it would be best to weigh the specimens in the heated environment. The
final weight divided by the initial volume is the density of the specimen. Density will be
recorded as a percentage of the initial sample density for easy comparison between the
control, different FRTW products, and eventually different species.
The maximum temperature used for testing intact wood specimens will be around
300˚C because after this point charring will occur. Only intact specimens are eligible for
measurement because char is essentially its own material to be tested for density
separately. This can be done because on the plot of wood density versus temperature, the
point where wood ends and char begins can be idealized as the same point. Where there
is a slight disconnect, both relationships can be connected by a straight line as seen in

62
Figure 6. If samples begin to char early, reduce the maximum temperature being used.
This test may have to be done using one treatment formulation at a time because each
brand may have its own unique char initiation temperature.
Because there was no standard test found for the determination of density for
comparison, this procedure may have certain limitations. One problem that was
anticipated is the fact that MC will decrease with oven exposure time, but because
density is desired at a range of temperatures, it is crucial to leave the specimens in the
oven until the moment before they are weighed. Because water weight will have a
significant on the overall weight, this presents a dilemma. Also, if the test is begun by
equilibrating the specimens at 0%MC and 0%RH, this will negate any water weight
effects, but the values of density will almost certainly not be representative of those seen
in-service.
Thermal Inertia Thermal inertia (the product of thermal conductivity, specific heat, and density) is
one of the many parameters that can be derived from the use of a cone calorimeter. In the
last few years, many countries have moved towards using a cone colorimeter for the
measurement of the thermal characteristics of many combustible materials.
A material is exposed to a known radiant heat flux and by using the principle of
oxygen consumption (13.1MJ of energy released per 1kg oxygen consumed for most
solid materials), the cone calorimeter can measure its heat release rate. Other important
values that can be measured are effective heat of combustion, total heat release, mass loss
rate, time to ignition, and yield of combustion products among many others. Using
equations shown in work by Grexa, et al. (Grexa, et al 1996) and following a procedure

63
originally developed by Janssens (Janssens 1991), the thermal inertia, along with other
important parameters such as total heat transfer coefficient, ignition temperature, and
critical heat flux for ignition. A common procedure used to operate the cone calorimeter
is described in the ISO 5660-1 standard test methods.
5.2 Thermal Degradation of FRTW in Fire Scenarios One of the main modes of strength loss in wood materials is that of thermal
degradation, as shown in this thesis. Though a model for this process has been developed
for sawn lumber (White, et al. 1993), a similar model for FRTW has not yet been
developed. As seen in this thesis, the thermal endurance model that was derived from
published design factors for FRTW is inadequate since it does not represent the fire-
robust behavior that FRTW has indeed been observed to exhibit. Through testing, a new
model can be developed and applied, using the procedures in this project, to analyze
FRTW as an alternative to the light-weight construction fire endurance issue that exists
today.
This testing procedure is modeled after the experiments done by White, et al.
(White, et al. 1993) in their paper entitled “Fire Endurance for a Metal-Plate-Connected
Wood Truss”.
An apparatus capable of furnace testing and simultaneously loading the members
in tension must be used for this procedure. Figure 13 shows the device that was used by
White, et al. when developing the thermal degradation model for sawn lumber, which
was used for analysis in this project. As seen in the photograph, the specially made
tension apparatus was large enough to house the furnace. The furnace has dimensions of
7ft by 4.5ft and is lined with mineral fiber blankets. Heating is achieved via eight
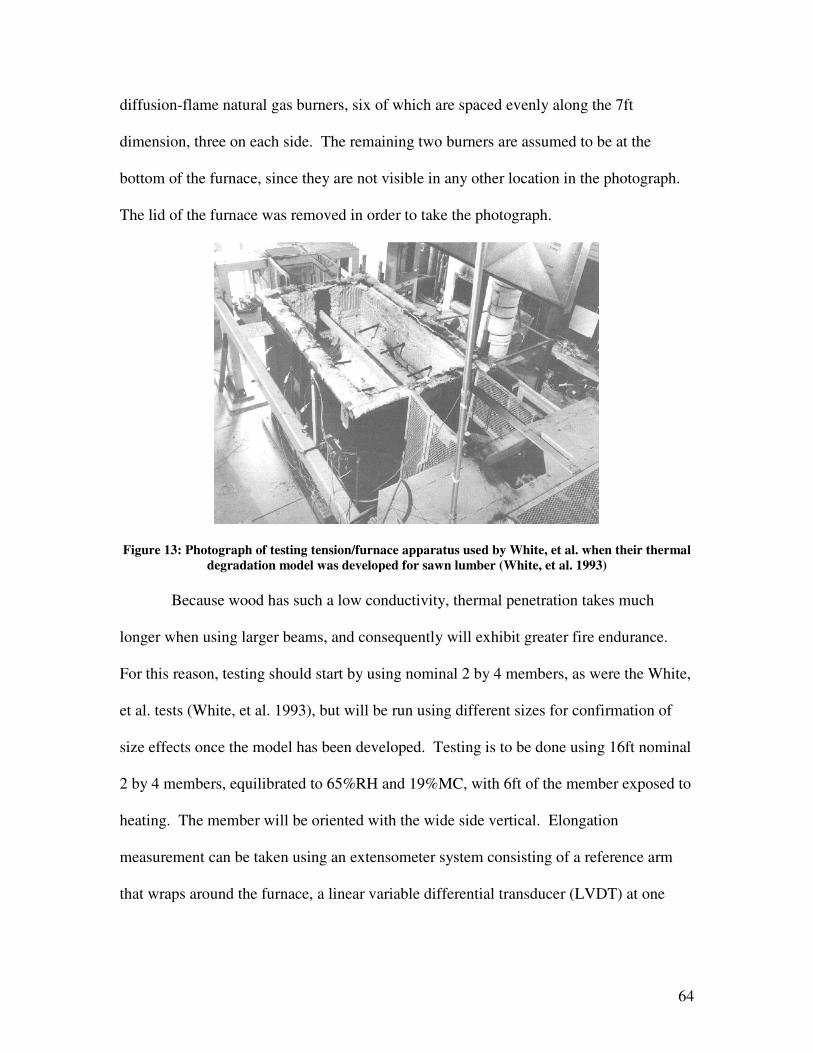
64
diffusion-flame natural gas burners, six of which are spaced evenly along the 7ft
dimension, three on each side. The remaining two burners are assumed to be at the
bottom of the furnace, since they are not visible in any other location in the photograph.
The lid of the furnace was removed in order to take the photograph.
Figure 13: Photograph of testing tension/furnace apparatus used by White, et al. when their thermal degradation model was developed for sawn lumber (White, et al. 1993)
Because wood has such a low conductivity, thermal penetration takes much
longer when using larger beams, and consequently will exhibit greater fire endurance.
For this reason, testing should start by using nominal 2 by 4 members, as were the White,
et al. tests (White, et al. 1993), but will be run using different sizes for confirmation of
size effects once the model has been developed. Testing is to be done using 16ft nominal
2 by 4 members, equilibrated to 65%RH and 19%MC, with 6ft of the member exposed to
heating. The member will be oriented with the wide side vertical. Elongation
measurement can be taken using an extensometer system consisting of a reference arm
that wraps around the furnace, a linear variable differential transducer (LVDT) at one

65
end, and clamps with magnetic attachment plates (White, et al. 1993). The strain gage
length in White’s experiments was around 11ft.
Two types of tests are to be conducted: constant temperature with increased load
until failure to develop the thermal degradation model, and then a constant load test with
increased temperature to verify the model. Unloaded tests that determine temperature
throughout the cross-section would allow development of the shape of the penetrated
thermal boundary layer inside the wood.
The constant temperature testing would consist of heating the specimens in the
furnace to temperatures of 100˚C, 200˚C, 250˚C, 275˚C, and 300˚C for durations of 30 or
60 minutes in order to ensure even temperature distribution throughout the wood
member. Two equilibration times are used simply for variation. Loading will be applied
at a constant rate until failure to determine the maximum load as well as the load-
elongation curve at a specified temperature.
Constant load tests will be loaded to the specimens 50% or 100% design load and
exposed to fire until failure. Temperature in the furnace is to be controlled to follow the
ASTM E-119 standard fire curve for verification of the model (704˚C, 795˚C, 843˚C,
892˚C, and 927˚C at 10, 20, 30, 40, 50, and 60 minutes respectively), but further testing
could be done using several types of fire curves such as high intensity, short duration or
low intensity, long duration. The wood member will be instrumented to determine its
temperature distribution for use in verifying the model. An idealized plenum time
temperature curve was also used in the aforementioned experiment, derived from results
for various actual ASTM tests, which was developed to represent the gas temperature at

66
the exposed surface of a member inside a protected assembly. This curve was 65˚C,
93˚C, 188˚C, 260˚C, and 327˚C at 10, 20, 30, 40, 50, and 60 minutes respectively.
Once the data has been collected, the unloaded tests to determine the temperature
profile in the wood can be used to develop a uniform temperature approximation while
taking into account the shape of this profile. Once the representative temperature can be
defined, the maximum capacity values from the constant temperature tests can be used to
develop the strength degradation model. Results from the constant load tests will be used
to verify and modify the model as needed.
This test is essential in the process to develop a realistic comparison between
FRTW and sawn lumber in light-weight construction. As seen before, using the
information that was available returned a model for strength degradation that wasn’t
representative of the nature of FRTW in fire conditions, showing the need for such an
experiment to develop this information.
5.3 Char Progression in FRTW Char is an essential part to the strength loss of timber members in a fire. FRTW
chemically inhibits this process and eventually charring will actually cease. It is not clear
what the critical char depth will be before combustion stops. One possible theory is that
depending on the applied heat flux, the charring will reach a different level before enough
insulation has built up to impede combustion. This theory indicates that greater heat
fluxes will require thicker char layers to form before this can happen. To benchmark the
char rate in relationship to exposure time, the proposed test method will use the ASTM E-
119 fire curve first, before testing at a constant specified heat flux is performed.

67
Sample member sizes to be used are nominal 2 by 4 and 4 by 4 sections that are
one to two feet long. Using the same sample sets described in Section 5.1 FRTW
Thermophysical Properties when describing the proposed density test, equilibrate the
specimens to 65%RH and 19%MC. Weigh all samples and then place in a furnace or
oven equipped with temperature controlling devices capable of creating an environment
that follows the ASTM E-119 test time/temperature profile. Take one specimen of each
type out of the furnace after 15, 30, 60, 90, and 180 minutes of exposure. These
increments are only speculative. The basis for choosing these times was to provide
evenly distributed data over the exposure period. The user should adjust the increment
times, or overall test duration, as they feel necessary. Weigh the specimens as they come
out of the heating apparatus and referencing the densities derived from earlier tests, the
volume of char can be identified. Char can be idealized as equal on all three, four, or six
sides, depending how the specimens were exposed, and char thickness can be calculated.
Also, the char layer is to be stripped from all faces of each specimen and final
measurements taken for each affected dimension to compare to original dimensions to
determine char thickness. Char thicknesses can be divided by the amount of time the
sample was exposed to determine char rate in units of length per minute. It may be found
that the exposure times noted here are not explicit enough to determine char rate since
early in the process, FRTW will increase its char formation to quickly insulate the
member, and then slow down considerably until it stops. If this is the case, use ten
specimens for each FRTW formulation and take one sample out after 10, 15, 20, 25, 30,
45, 60, 90, 120, and 180 minutes. Increase in number of increments will provide more
accurate results for the earlier char rate formation, which is the most critical in the

68
charring process for FRTW. Again, the increments chosen here are only speculative;
therefore the user should adjust the increment times, or overall test duration, as they feel
necessary.
5.4 Interaction of Wood Members and Truss Plates in Normal and Fire Scenarios This testing procedure will develop an understanding of the change in wood/plate
connection capacity in a fire scenario. This is integral in the development of a
satisfactory model to accurately predict time to failure of a sawn lumber or FRTW truss
assembly because this is one of the main failure mechanisms that has been observed.
The previously described tension/furnace should be used in these procedures as
well so that loading and heat exposure can occur simultaneously. Similar procedures to
the test for strength degradation will be used in this test as well, using the same member
sizes and equilibration standards, but using FRTW as well as sawn lumber. This
experiment however will need to capture three, possibly four different mechanisms: steel
plate strength degradation when in contact with wood, tooth strength degradation, wood
crushing, and possibly charring and its effects if 300˚C isn’t sufficient to determine the
other three mechanisms.
A model for steel plate strength will be created in the same manner as the wood
degradation model, using constant temperature and increased loading to determine
maximum strength capacity values of each temperature and to create the model, followed
by constant load tests with increasing temperature to verify and adjust the model. To
capture the plate failure mechanism and ensure that tooth peeling does not occur, plates
should be attached in normal fashion and then nailed to the specimens as well. Nails

69
should be placed at the extent of the plate and close to the member splice in a manner to
ensure rupture will occur in the center of the plate, which is where it occurs in natural
conditions (conditions without the added stiffness of the nails). This will allow the steel
the added benefit of the heat sink the wood, but ensures plate rupture will be the mode of
failure for each test.
Tooth stiffness and wood crushing under the teeth will have to be tested
simultaneously since they both are contributing factors to the peeling failure. The same
specimen size, equilibration standards, as well as the same two test types (constant
temperature, constant load) are to be used as in the other experiments used to develop
strength models. Plate tooth dimensions will be varied but must be designed so that the
tooth capacity will be the ultimate limiting factor. This measure is crucial because if the
tooth density is too high peeling will not occur and some other mode of failure, such as
wood splitting or plate rupture, will occur first.
After testing to failure, critical tooth temperature, tooth angle, and size of the
tooth penetration is to be measured. Tooth temperature can be referenced to the thermal
degradation models for steel, which have been established and are discussed in Section
3.2 Strength Modeling, to determine if this was the limiting effect. Tooth critical angle
should be measured and kept as reference to determine a critical deflection limit to be
referenced later when categorizing the point of failure in truss plate connections. Tooth
penetration holes will be measured and compared to tooth thickness (assumed as plate
gauge thickness) to determine the critical wood crushing limit.
This combined mechanism can be modeled by analyzing the wood under the tooth
as a compression member with a cross-section equal to the tooth face area, and with an

70
applied load equal to the individual tooth load. Because loading is applied normal to the
tooth in its original state, wood crushing and tooth deflection will contribute to changing
the direction of the reaction force to be still normal to the tooth face but now at an angle
with the plate. Eventually the moment couple that is created from these deformations
will overcome the bending capacity of the plate, and peeling will occur. Figure 14 shows
a diagram that illustrates this progressive failure.
Figure 14: Theoretical sequence of events describing proposed progressive tooth withdrawal model
If temperatures over 300˚C must be reached, char will inevitably form and need to
be incorporated into the model as well. This could be accounted for by reducing the area
for the compression member as char forms.

71
6.0 Conclusions The purpose of this project was first to determine the time to collapse of sawn
lumber and FRTW trusses, and second to extract relationships from the results to further
advance the knowledge of the mechanisms for the collapse of wood trusses. These goals
have been met but are limited by their inherent assumptions, which is a condition that is
present in any theoretical work. This chapter summarizes the important relationships
derived from this work, identifies considerations that have not been addressed and other
limitations of this project, and offers final recommendations to further research in this
subject.
The most valuable relationship taken from this analysis is the effect of the initial
load to capacity ratio (ILCR) because this value essentially determined the mode of
failure the truss would exhibit.
When the member ILCR was close to 1.0, much of the cross-section of the
member was needed to carry the load for which it was designed. When only a small
portion of this area was reduced via char and strength degradation, a member failure
would occur before the connection became factor. This effect was heightened or
diminished, depending on member orientation. If the member was modeled so that its
major bending axis was aligned perpendicular to the direction of heat transfer, it took
much longer for the critical area to be reached than if the member was modeled with the
minor axis perpendicular to the direction of heat transfer since given the same char depth,
much more area is lost for the later. This effect will become less prevalent on wood
members as the difference between the cross-sectional dimensions becomes small.

72
Similarly, if the plate ILCR was close to 1.0, much of the capacity of the steel was
utilized to transfer the axial loading from member to member. When only a small portion
of the capacity was reduced via thermal degradation, a tooth deflection failure would
occur before plate failure or member section loss could become a factor.
When the member and plate ILCR was both closer to 0.5, member and connection
capacity were each possible limiting factors. It was noticed that if the plate ILCR was
around 0.15 larger, or more, than the member ILCR, charring would lead to a tooth
capacity failure. Alternatively, if the plate ILCR was closer than 0.15 to the member
ILCR, the member would char and fail on its own before the connector teeth lost
capacity.
In the case of the tooth capacity failure, less of the overall area of the wood
member was needed to carry the loading, and charring was able to progress much further
than if the member ILCR was closer to 1.0, allowing the char front to pass the first row of
teeth, leaving an insufficient number of teeth to carry the loading. Though thermal
strength degradation of steel was also incorporated into the analysis, charring had a much
more significant effect on overall connection strength. Only horizontal members were
used when including the possibility of connection failure because when compared to the
endurance times listed for individual construction elements in the ASCE SFPE 29 99
specification, the times to failure for the vertical members were not compatible with the
expected results. The tooth spacing on the truss plates chosen in this thesis only allowed
three rows of teeth to be inserted in the 1.5 inch thickness of wood. This gave way to the
recognition of a threshold connection failure time that relied on the char depth. Because
only a few rows were carrying the loading, it became critical when one row’s load

73
sharing capabilities was eliminated from the system. In this case, the residual tooth
capacity was always insufficient, and failure was observed. Therefore, when member
ILCR was around 0.5 the members could withstand significant section loss, but as soon
as charring progressed past the first row of teeth, the residual tooth capacity wasn’t
sufficient to maintain integrity of the connection.
The final failure mode is that of plate rupture. Though it was not fully
investigated due to the absence of a model to characterize temperature versus time for
this element, its temperature was approximated as the average tooth temperature and
included in the evaluation. From this analysis, using the scenario and information
available, it is hypothesized that plate failure will be the last mode of failure exhibited, if
the plate elements are satisfactorily designed. However, it also is hypothesized that if
member ILCR is very small, and if thicker members are used to include multiple rows of
teeth to ensure sufficient tooth capacity during significant charring, plate failure will
govern.
When evaluating the time to failure including the possibility of connection failure,
it was noticed that charring had a much more significant impact than thermal degradation.
In this thesis the teeth were assumed to be at the same temperature as the wood it was in
contact with. Using this assumption, it was found that the temperature of the connecting
teeth were often well below any critical strength level. Though it can be assumed that the
plate itself is slightly hotter than the teeth, since they are immersed in the insulating
properties of wood, the tensile loading seen by the plate is transferred through
significantly more material than the tooth loading. Therefore, it is hypothesized that
when both member and plate ILCR are between 0.1 and 0.3, the wood has a significant
74
amount of section to withstand charring, and if thick members are used so that more rows
of teeth are inserted in the section so that charring will not reduce the amount of effective
teeth to a critical level, the connection plate will have sufficient time to heat up and fail
via thermal degradation.
Another trend exhibited by this work is that insulation thickness will benefit
overall fire endurance. This trend was expected since as thickness increases, so does
thermal resistance, and by inspecting the finite difference model used in this thesis, it can
be seen that the change in wood temperature will decrease as thermal resistance
increases, delaying the process of thermal penetration.
Finally, the analysis in this thesis has shown that FRTW light-weight trusses will
fail before sawn lumber trusses. This conclusion is not considered to be accurate because
it is due in large part to the assumptions made when characterizing thermal degradation
for FRTW products. Since the proposed thermal degradation model for FRTW was
developed using published design adjustment factors, and because these factors are
intended to be used for relatively low temperature, long duration environments when
compared to a fire scenario, this model isn’t representative of the type of situation
evaluated herein and the results should not be interpreted directly. This model was a
product of the fact that there is very limited information concerning the behavior of
FRTW in actual fire scenarios. The work done in this thesis is just the first step in
developing a comparative model between FRTW and sawn lumber trusses. More data
needs to be collected so that it can be implemented into model such as the one used here
and eventually verified with scale testing. This and several other important limitations
are discussed further in the following section.

75
6.1 Limitations of the Work Many assumptions had to be made to simplify this complex scenario. These
assumptions have led to several limitations of this thesis that must be discussed.
Thermal analyses in this project involved developing and applying a one-
dimensional finite difference model using the ASTM E-119 fire curve as the exposure
conditions. These analyses are limited because they do not incorporate radiation heating
from the interior surface of the gypsum in the plenum space to the vertical dimension of
the exposed truss member. Inclusion of this mode of heat transfer would require a two
dimensional model to be created.
Trusses in this work were designed by idealizing each member with pin-ended
connections, allowing only axial loading to occur. In reality, some bending stresses will
form in the members as well, creating the need for a combined stress index (CSI) for
failure analysis. An example of the CSI used in the work by White, et al (1993) is
described in Appendix A.8 Combined Stress Index.
Thermal expansion of the different materials in a truss will occur at different rates
and because of this, residual stresses will accumulate. This effect has also been neglected
during analysis.
When evaluating failure using thermal degradation of the wood member cross-
section, the reduction value was chosen by the temperature in the foremost increment and
used for the entire area. Because the remaining increments are at lower temperatures,
each could be evaluated as having individual strength reduction values and a composite
value could be created for a more accurate strength reduction evaluation. This type of
analysis could easily add minutes onto the overall endurance rating by increasing the

76
capacity significantly in early stages, and then diminishing its impact as temperature
profiles become closer together.
Finally, because the plate dimensions were assumed and not selected by a
qualified manufacturer, and because a valid thermal analysis of the plate was not devised,
plate temperature as a function of time was not well represented. The plate temperature
was assumed to be the average of the tooth temperatures in order to develop a
relationship with the other failure modes and with the initial design. This thesis also
assumed that the maximum deflection limit for the connection teeth was 30% of the
overall tooth length. Because this value was derived from simply inspecting photographs
of peeling failures from previous tests, this value may be significantly skewed. However
using these assumptions, a strong hypothesis that tooth deflection is the limiting mode of
connection failure, has evolved from the test results, along with a the hypothesis char
formation has greater impact on connection capacity than thermal degradation of steel.
6.2 In-Service Considerations This section has been added to discuss possible installation practices and existing
conditions that can affect how a truss assembly would behave under fire loading. End
fixity, the use of furring channels, added connection measures due to the mistrust of truss
plates, and ceiling protrusions are the issues that have been contemplated.
End conditions have been known to create many problems when attempting to
model or test a structural system. The ASTM E-119 test attempts to incorporate some of
this into their methods by using “restrained” or “unrestrained” end conditions depending
on the connection type to be used when installed in the actual structure. This is
significant because when structures are restrained during a fire, there is an added thrust

77
force due to thermal expansion acting on the structure to counteract the loading allowing
the structure to have greater endurance. The trusses in this project were designed as if
they were simply supported, pin-ended connections. When trusses are installed, they are
placed on a bearing wall or foundation and bolted, nailed, or screwed into place, which in
reality, none act as perfect pin ends or hinges. It is possible that all four extreme corners
are connected to the structure, creating more of a fixed end than a pinned end, giving the
structure more inherent load carrying capabilities, since three plastic hinges would need
to form, instead of only one, to induce collapse.
Furring channels are used in many one-hour-rated construction assemblies using
trusses. These steel channels are screwed to the underside of the trusses and the gypsum
board is then attached to the channels rather than directly to the trusses themselves. This
adds a few inches of insulating air separation between the inside surface of the ceiling
gypsum and the truss members. However, because the use of furring channels is
typically limited to structures that require rated structural assemblies, it is not generally
found in residential construction, especially because of the added material costs that are
not mandated by code.
Because light-weight truss construction has been known to fail suddenly in fire
scenarios, some contractors have developed mistrust for the load carrying capabilities of
this type of system, but still use it for its cost efficiency. Though they continue to utilize
trusses, some have opted to insert extra nails into the connection plates to ensure that
plates remain intact. This practice would certainly affect the behavior of the connections
by effectively eliminating the possibility of tooth withdrawal. Also, by increasing the

78
overall connection stiffness, one of the most prevalent failure modes is eliminated, and
surely time to failure will increase.
The final consideration was that of ceiling penetrations. This analysis was
completed under the assumption that the gypsum board layer remains intact through the
duration of the exposure. However, many common practices and phenomena can create
pathways for the hot gasses from the room involved in fire to be transported into the truss
plenum, dramatically increasing the temperatures seen by the exposed members. For
older homes, foundation settling can cause cracking in the corners of a room; this
cracking can propagate and, in the event of a fire, become a pathway for hot gasses.
Previous water or fire damage in a home as well as normal wear and tear can break down
the gypsum board and allow the fire to consume this layer faster and eventually expose
the trusses. Lighting installations are simple mechanisms, present in every home that can
act as ceiling protrusions in a fire. Not every type of lighting fixture is capable of being
used in fire-rated construction, and almost certainly they are not used in most residential
homes. Audio/visual equipment for home entertainment is another commonly installed
component that may involve penetration of the ceiling. Another mechanical system that
can transport hot gasses, not only into the plenum, but to other rooms, is the heating,
ventilating and air conditioning system. Via either gaps around vent covers or the vent
ducts themselves, hot gasses can travel through, and have a more profound effect on
plenum temperatures if these systems are installed in the ceiling cavity. Finally, the
quality of workmanship alone can determine whether the significance of ceiling
penetrations have on the fire endurance of the floor/ceiling assemblies. If protrusions are
sealed up tight with plaster, they may not have any affects, but if they are done poorly

79
and simply covered up with molding or other means, these penetrations may seriously
decrease the ability of the ceiling to function as a barrier to a fire.
6.3 Recommendations for Future Research The first recommendation to further this work would be to investigate the validity
of the thermal analyses. FEM is a good type of model if concerned with one dimensional
heat transfer and it could be used for comparison, but due to the complexity of the
problem, a more in-depth FDM, that has the capability to integrate multiple dimensions
and multiple modes of heat transfer relatively easily, would probably be the most
beneficial. Addition of a radiation term that affects the vertical faces of the member
would require at least a two-dimensional thermal model. A two-dimensional model
would make it possible to categorize charring in both the vertical and lateral directions
and also define a realistic time/temperature history for the face of the connector plate.
This addition will also decrease the effect of member orientation on time to failure, since
the two-dimensional heating would balance out the rate of section loss in each scenario.
Several types of natural fire exposures should also be considered for evaluation.
Effects of long duration, low temperature, and short duration, high temperature fires, with
a decay period, would add to the validity of the conclusions and to the determination if
FRTW is a viable candidate to use in place of sawn lumber in light-weight truss
construction.
Also, as described earlier in this chapter, bending and residual stresses are also
present in trusses. Though they aren’t completely understood under normal
circumstances, they will inevitably have an impact on the time to failure of a truss and
should be incorporated into the evaluation using a CSI.
80
Residual member capacity can also be evaluated as a composite cross-sectional
area with strength reduction values unique to each increment at its own respective
temperature. This will increase the durability of the members when compared to the data
developed in this project because here, the strength of the entire cross-section was
represented by the thermal degradation correction value associated with the highest
temperature in the cross-section at any given time.
Designing the most economical plates for each scenario would also add validity to
this work. This would allow evaluation using tooth densities, plate dimensions, and plate
thicknesses, that are exactly what would be encountered had the system been designed for
construction. Because the truss manufacturers are wholly responsible for the design of
truss plates, research on how they are engineered will have to be completed as well.
Currently the Truss Plate Institute publishes a publicly available design commentary that
outlines, but does not go into detail on how to design each dimension of the truss plate.
A separate FDM or FEM may also need to be developed to evaluate plate temperature in
order to determine more accurately the point of plate shear rupture.
Finally, a probabilistic risk analysis could be done for determining if the special
in-service considerations should be incorporated into this analysis to evaluate the impact
of in-service conditions on structural fire performance of truss construction.

81
Bibliography ASTM International. (2004). Annual Book of Standards, Section Four: Construction,
Vol. 4.10. ASTM International. West Conshohocken, PA. ASTM International. (2004) Annual Book of Standards, Section Fourteen: General
Methods and Instrumentation, Vol. 14.02. ASTM International. West Conshohocken, PA.
American Society of Civil Engineers, Society of Fire Protection Engineers. (1998).
Standard Calculation Methods for Structural Fire Protection. Structural Engineering Institute of the American Society of Civil Engineers. Ralston, VA.
American Wood Council. (2001).National Design Specification for Wood Construction.
American Forest & Paper Association Inc. AK Steel Corporation. (2000). Product Data Bulletin: Hot Dipped Galvanized Steels.
Middletown, Ohio; Retrieved, 2006 < http://www.aksteel.com/markets_products/carbon.asp >
Brannigan, Francis L. (1992). Building Construction for the Fire Service. Quincy, Massachusetts: (3rd Ed.), National Fire Protection Association
Brassel, Lori D. and David D. Evans, (2002). Trends in Firefighter Fatalities Due to Structural Collapse, 1979-2002. Federal Emergency Management Agency:, National Institute of Standards and Technology. < http://usfa.fema.gov/inside-usfa/nfdc/pubs/ff_fat.shtm > Buchanan, Andrew A. (2001). Structural Design for Fire Safety. John Wiley & Sons,
LTD. Chichester, England. Bukowski, Richard W. (January 2002). Protection of Firefighters Under the Building
Codes. Fire Engineering, Vol. 155, No. 1, 88-92;. Retrieved 2005 < www.FireEngineering.com >
Dunn, Vincent. (1988). Collapse of Burning Buildings. Saddle Brook, New Jersey:,
Penn Well Publishing Company FirePRO™ Fire Retardant Treated Wood. (2001). Osmose, Inc. Madison, WI.
< http://www.osmose.com/wood/usa/retardant/overview/ > Gammon, Barry Wayne. (1987). Reliability Analysis of Wood-Frame Wall Assemblies
Exposed to Fire. Ph.D. Dissertation, University of California, Berkeley.

82
Grexa, Ondrej, Marc Janssens, Robert White, and Mark Dietenberger. (1996). Fundamental Thermophysical Properties of Materials Derived From the Cone Calorimeter Measurements. Proceedings. 3rd International Scientific Conference: Wood & Fire Safety. May
International Code Council. (2003). International Building Code. International Code
Council, Inc. Country Club Hills, IL. Janssens, M., (1991). Fundamental Thermophysical Characteristics of Wood and Their
Role in Enclosure Fire Growth. Ph.D. Dissertation, National Forest Products Association. Washington, D.C.
Jones, Walter W., Richard D. Peacock, Glenn P. Forney, and Paul A. Reneke. (2004).
CFAST-Consolidated Model of Fire Growth and Smoke Transport, Technical Reference Guide. NIST Special Publication 1030, Version 5. U.S. Government Printing Office. Washington, D.C. October,
Knudson, R. M., and A. P. Schniewind. (1975). Performance of Structural Wood
Members Exposed to Fire. Forest Products Journal, Vol. 25, No. 2. Lebow, Stan T., and Jerrold E. Winandy. (1999). Effect of Fire-Retardant Treatment on
Plywood pH and the Relationship of pH to Strength Properties. Wood Science and Technology, Vol. 33. Springer-Verlag.
Lebow, Stan T., and Jerrold E. Winandy. (1998). Role of Grade and Thickness in the
Degradation of Fire-Retardant-Treated Plywood, The. Forest Products Journal, Vol. 48, No. 6. Forest Products Society. June,
LeVan, Susan L., and Jerrold E. Winandy. (January, 1990). Effects of Fire Retardant
Treatments on Wood Strength: A Review. Wood and Fiber Science, Vol. 22, No. 1.
LeVan, Susan L., Jong Man Kim, Robert J. Nagel, and James W. Evans. (1996).
Mechanical Properties of Fire-Retardant-Treated Plywood After Cyclic Temperature Exposure. Forest Products Journal, Vol. 46, No. 5. Forest Products Society.
LeVan, Susan L., and Mary Collet. (1989). Choosing and Applying Fire-Retardant-
Treated Plywood and Lumber for Roof Designs. USDA Forest Service, Forest Products Laboratory. Madison, WI.
Lie, T. T. (1992). Structural Fire Protection. American Society of Civil Engineers. New
York, NY.

83
National Fire Protection Association. (2005). NFPA 703: Standard for Fire Retardant-Treated Wood and Fire-Retardant Coatings for Building Materials. National Fire Protection Association.
National Fire Protection Association. (2005). NFPA 5000: Building Construction and
Safety Code. National Fire Protection Association. Percival, Donald H., and Stanley K. Suddarth. (1971). Technical Note No. 6:
Investigation of the Mechanical Characteristics of Truss Plates on Fire-Retardant-Treated Wood. Forest Products Research Society.
Reading a Building: Construction Size-up, (September 2004). Fire Engineering: < http://www.fe.pennet.com/Articles_Display.cfm?Section=OnArt&Subsection > Routly, Gordon J. (1992). Wood Truss Roof Collapse Claims Two Firefighters Memphis, Tennessee, United States Fire Administration Technical Report Series:, Federal Emergency Management Agency < http://usfa.fema.gov/fire-service/arson/arson-pubs4.shtm > Society of Fire Protection Engineers. (2002). SFPE Handbook of Fire Protection
Engineering, Third Edition. National Fire Protection Association. Quincy, MA. Southern Pine Products: Fire Endurance, Sound Transmission. (2001-2006). AEC Info..
< www.aecinfo.com > Sweet, Mitchell, and Jerrold E. Winandy. (1999). Influence of Degree of Polymerization
of Cellulose and Hemicellulose on Strength Loss in Fire-Retardant-Treated Southern Pine. USDA Forest Service, Forest Products Laboratory. Walter de Gruyter. Berlin, NY.
U.S. Fire Administration, National Fire Data Center. (April, 2005). Residential Fires and
Child Casualties. FEMA, Topical Fire Research Series, Vol. 5, Issue 2. U.S. Fire Administration, National Fire Data Center. (June, 2005). Residential Fires and
Older Adult Casualties. FEMA, Topical Fire Research Series, Vol. 5, Issue 3. White, Robert H., Steven M. Cramer, and Deepak K. Shrestha. (July, 1993). Fire
Endurance Model for a Metal-Plate-Connected Wood Truss. USDA Forest Service, Forest Products Laboratory.
Winandy, Jerrold E., Robert J. Ross, and Susan L. LeVan. (1991). Fire-Retardant-
Treated Wood: Research at the Forest Products Laboratory. Proceedings. International Timber Engineering Conference, Vol. 4. London, England.

84
Appendix A.1 Product Specifications for Various Commercial FRTW Products
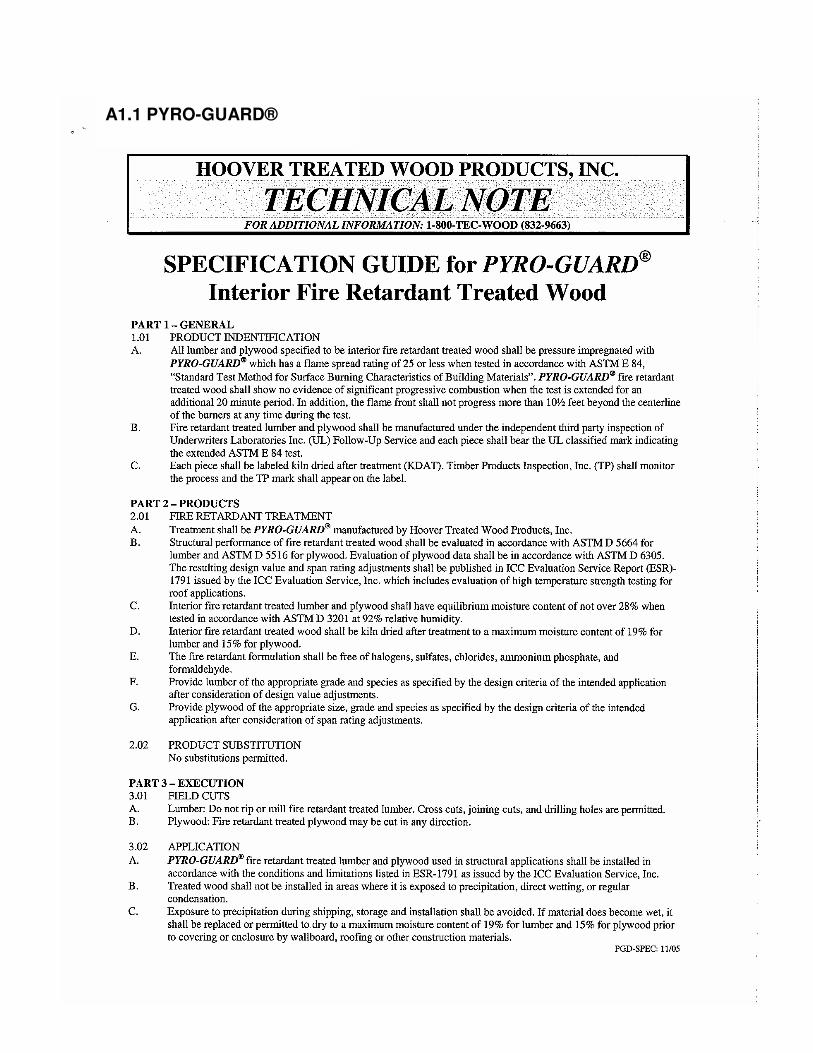
85
A1.1 PYRO-GUARD®
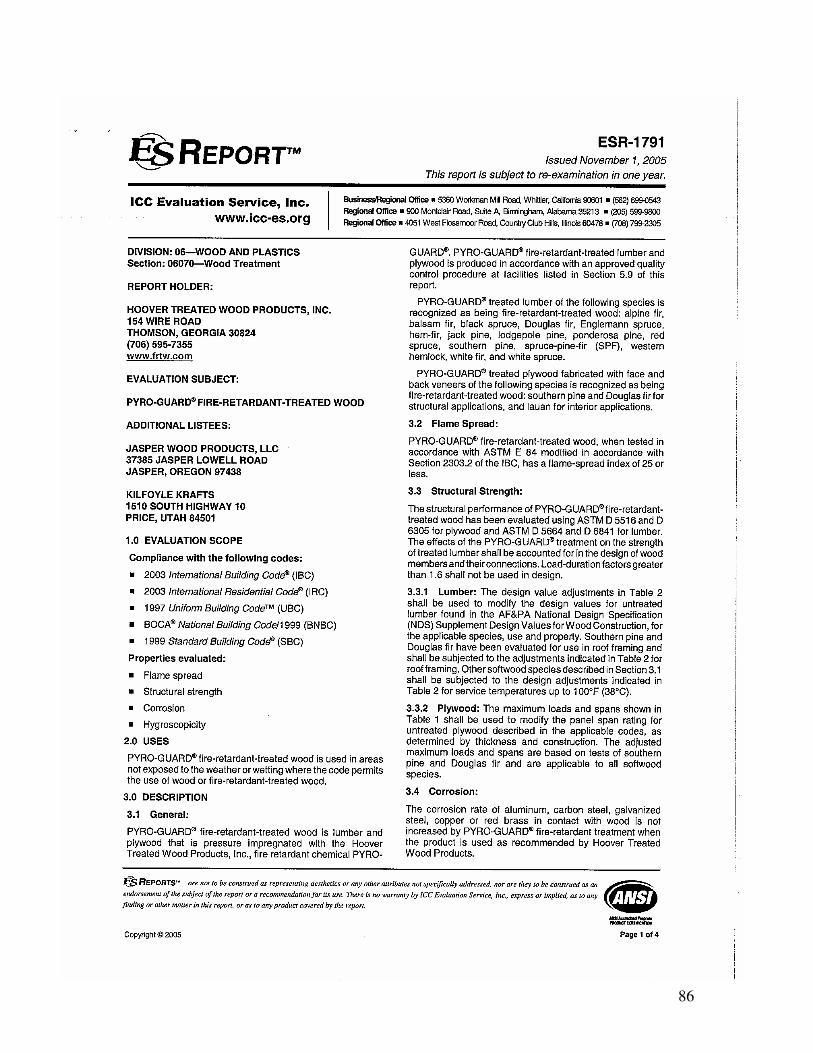
86
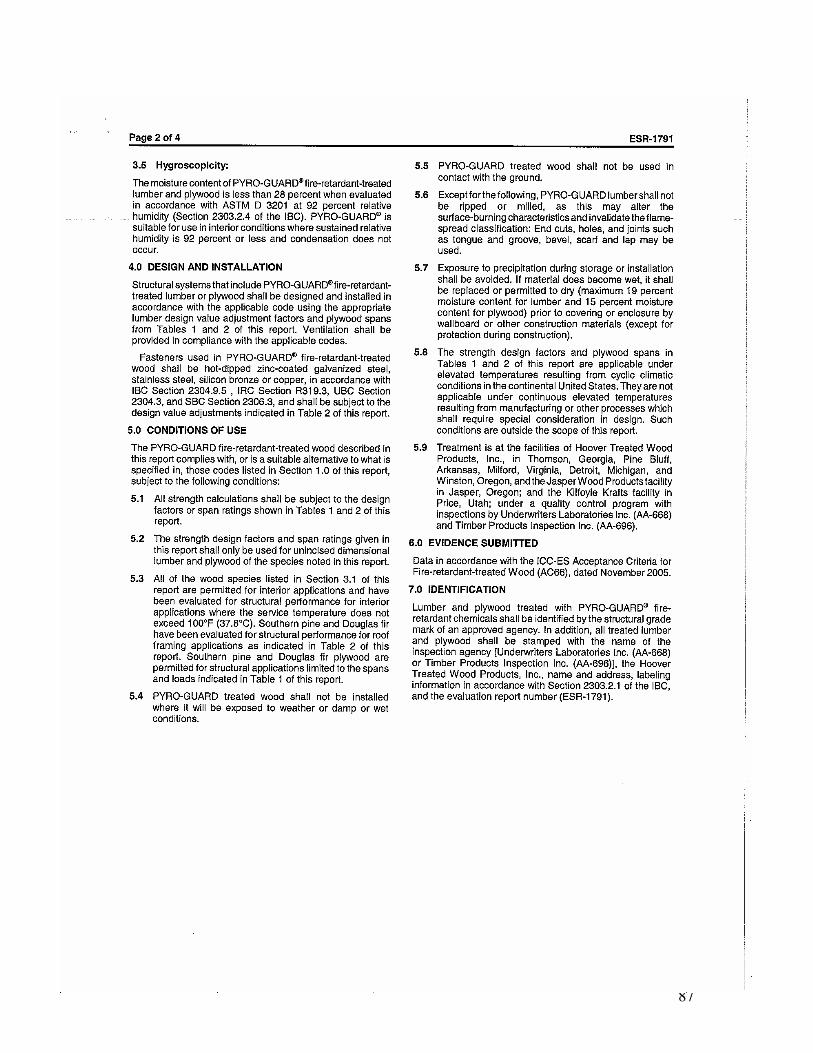
87
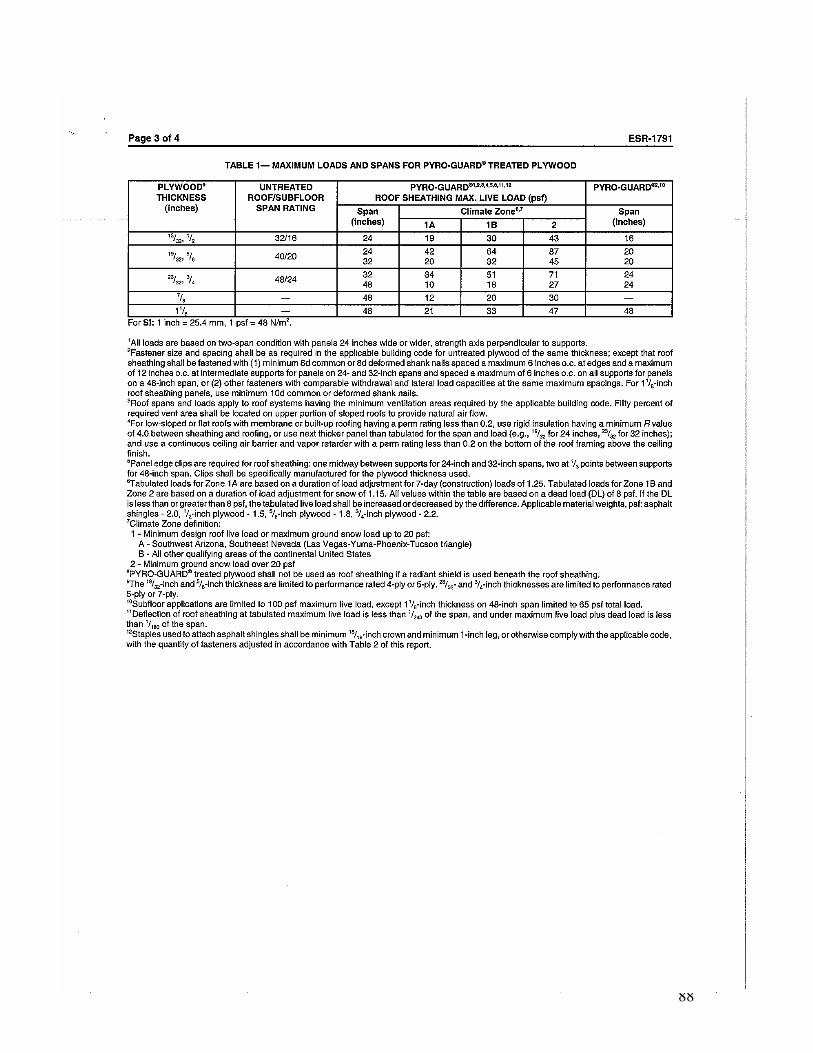
88

89

90
A1.2 EXTERIOR FIRE-X®

91

92
A1.3 DRICON®
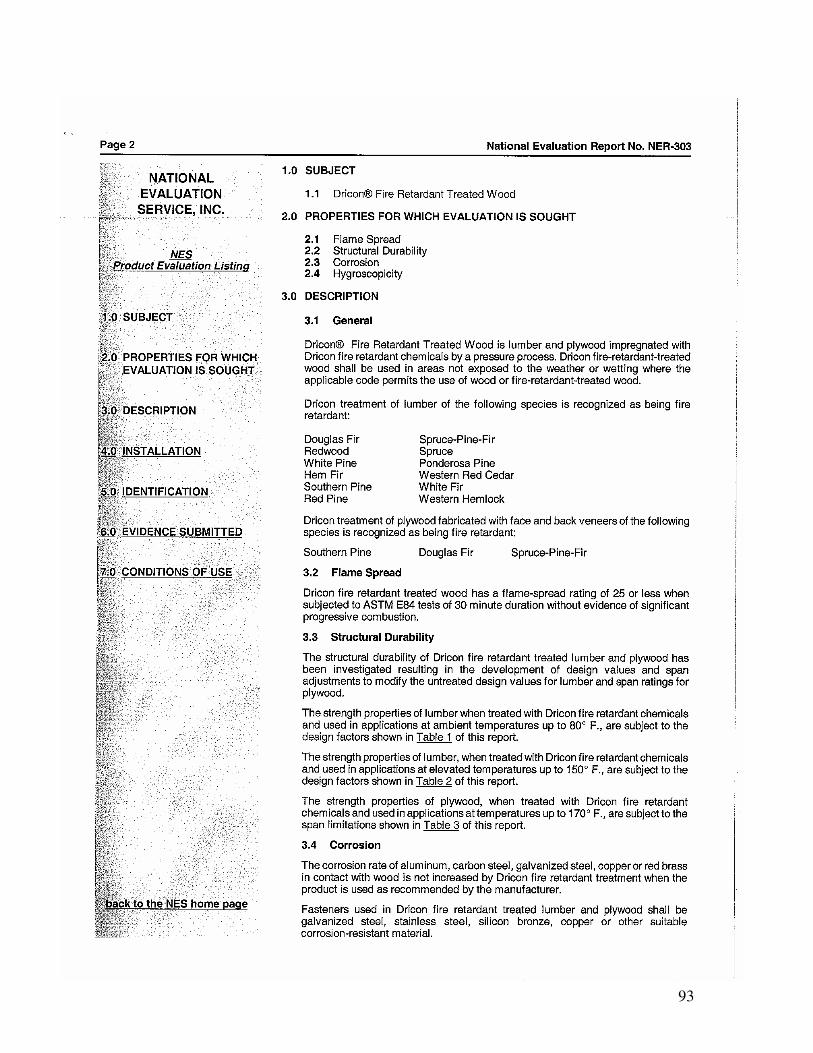
93

94

95

96

97

98

99
A1.4 D-Blaze®

100

101
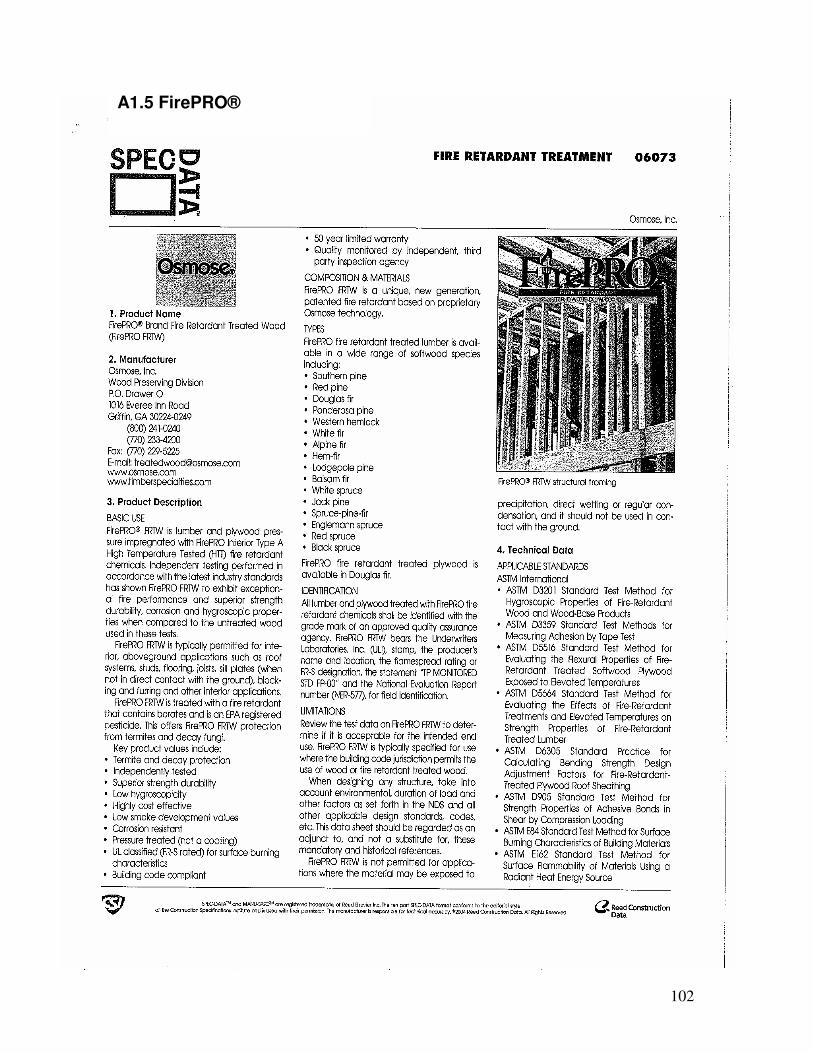
102
A1.5 FirePRO®

103

104

105
A.2 Typical Residential Floor Truss Loading

106
A.3 Truss-4 Sample Input and Output Files Input File
Thesis Truss Analysis-Residential Parallel Chord Floor Truss, Type II 11 19 1 2 5 Joint Coordinates 1 0.0 0.0 2 0.0 12.0 3 24.0 0.0 4 48.0 12.0 5 72.0 0.0 6 96.0 12.0 7 120.0 0.0 8 144.0 12.0 9 168.0 0.0 10 192.0 12.0 11 192.0 0.0 Material Data 1 1700.0 Member Data 1 1 2 5.25 2 2 4 8.25 3 2 3 5.25 4 1 3 8.25 5 3 4 5.25 6 4 6 8.25 7 4 5 5.25 8 3 5 8.25 9 5 6 5.25 10 6 8 8.25 11 6 7 5.25 12 5 7 8.25 13 7 8 5.25 14 8 10 8.25 15 8 9 5.25 16 7 9 8.25 17 9 10 5.25 18 9 11 8.25 19 10 11 5.25 Support Data 1 1 1 11 1 1 Joint Loads 2 0.0 -1.7 4 0.0 -3.4
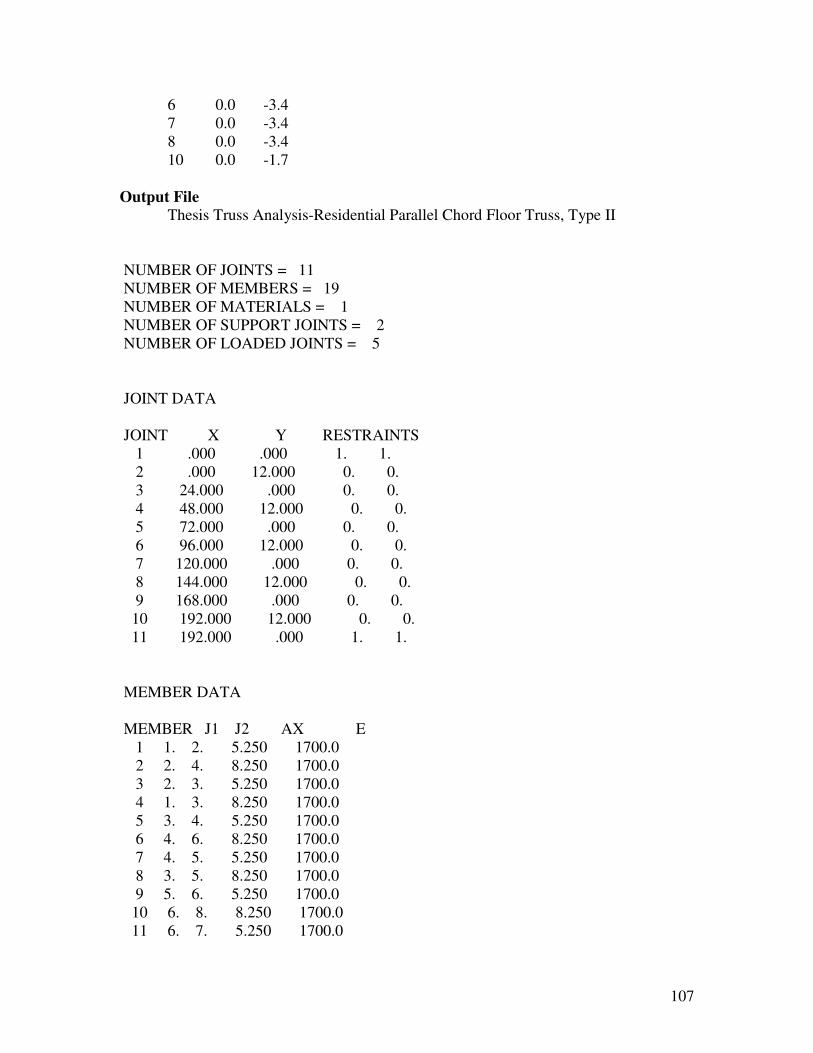
107
6 0.0 -3.4 7 0.0 -3.4 8 0.0 -3.4 10 0.0 -1.7 Output File Thesis Truss Analysis-Residential Parallel Chord Floor Truss, Type II NUMBER OF JOINTS = 11 NUMBER OF MEMBERS = 19 NUMBER OF MATERIALS = 1 NUMBER OF SUPPORT JOINTS = 2 NUMBER OF LOADED JOINTS = 5 JOINT DATA JOINT X Y RESTRAINTS 1 .000 .000 1. 1. 2 .000 12.000 0. 0. 3 24.000 .000 0. 0. 4 48.000 12.000 0. 0. 5 72.000 .000 0. 0. 6 96.000 12.000 0. 0. 7 120.000 .000 0. 0. 8 144.000 12.000 0. 0. 9 168.000 .000 0. 0. 10 192.000 12.000 0. 0. 11 192.000 .000 1. 1. MEMBER DATA MEMBER J1 J2 AX E 1 1. 2. 5.250 1700.0 2 2. 4. 8.250 1700.0 3 2. 3. 5.250 1700.0 4 1. 3. 8.250 1700.0 5 3. 4. 5.250 1700.0 6 4. 6. 8.250 1700.0 7 4. 5. 5.250 1700.0 8 3. 5. 8.250 1700.0 9 5. 6. 5.250 1700.0 10 6. 8. 8.250 1700.0 11 6. 7. 5.250 1700.0

108
12 5. 7. 8.250 1700.0 13 7. 8. 5.250 1700.0 14 8. 10. 8.250 1700.0 15 8. 9. 5.250 1700.0 16 7. 9. 8.250 1700.0 17 9. 10. 5.250 1700.0 18 9. 11. 8.250 1700.0 19 10. 11. 5.250 1700.0 JOINT LOADS JOINT WX WY 2 .000 -1.700 4 .000 -3.400 6 .000 -3.400 7 .000 -3.400 8 .000 -3.400 JOINT DISPLACEMENTS JOINT X-DISP Y-DISP 1 .00000 .00000 2 .15556 -.01086 3 -.03927 -.49636 4 .11193 -.89460 5 -.03055 -1.22427 6 .00429 -1.33866 7 .01891 -1.30304 8 -.12080 -.96613 9 .03927 -.53738 10 -.17025 -.00971 11 .00000 .00000 MEMBER FORCES (TENSION POSITIVE) MEMBER FORCE 1 -8.075 2 -12.750 3 14.255 4 -22.950 5 -14.255 6 -31.450 7 6.652

109
8 2.550 9 -6.652 10 -36.550 11 -.950 12 14.450 13 8.553 14 -14.450 15 -16.156 16 5.950 17 16.156 18 -22.950 19 -7.225 REACTIONS JOINT RX RY 1 22.950 8.075 11 -22.950 7.225

110
A.4 Strength Properties of FRTW vs. Temperature Percent Compression Capacity Vs. Temperature
y = -0.0026x + 1.1606R2 = 0.6541
0.65
0.7
0.75
0.8
0.85
0.9
0.95
1
70 80 90 100 110 120 130 140 150 160
Temperature (F)
Desi
gn F
acto
rs
Percent MOE Vs. Temperature
y = -0.0005x + 0.9776R2 = 0.1766
0.86
0.88
0.9
0.92
0.94
0.96
0.98
1
70 80 90 100 110 120 130 140 150 160
Temperature (F)
Desi
gn F
acto
rs

111
Percent Bending Capacity Vs. Temperature
y = 0.9962e-0.0015x
R2 = 0.681
0.78
0.8
0.82
0.84
0.86
0.88
0.9
0.92
70 80 90 100 110 120 130 140 150 160
Temperature (F)
Desi
ng F
acot
rs

112
A.5 Residential Fire Ignition Sources The following statistics describe the most common ignition sources in residential
fires that killed older adults, age 65 and up, which accounted for 27% of all fire deaths in
this occupancy in 2002. The information is shown below in Figure 15.
Figure 15: Causes of residential fires with older adult casualties (U.S. Fire Administration June, 2005)
The most common materials ignited first in fire scenarios where adults, ages 65
and older, were killed were upholstered furniture, worn clothing, and bedding with a
combined 40% of all materials. Smoking was the primary heat source for the ignition of
both furniture and bedding.
Furthermore, in the 65 and older category, arson was the most deadly ignition
source causing 22% of the total number casualties while smoking was a close number
two with 21% followed by open flames at 15%. (U.S Fire Administration June, 2005)
Child fire deaths, children aged 14 and under, account for 15% to 20% of the
nations total. Data that shows common ignition sources in scenarios that resulted in a
child death is reported in Figure 16.

113
Figure 16: Causes of residential fires with child fatalities (U.S. Fire Administration April, 2005) Again, as with the 65 and older age group, bedding and upholstered furniture were most
commonly the first items ignited (38%) with lighters and candles being their primary
ignition sources. Arson, as with the 65 and older group, the number one ignition source
causing death in 2002 (30%) with open flames number two (28%). (U.S. Fire
Administration April, 2005)
Older adults and young children are among the most vulnerable people in
American society. When someone from these categories dies, especially a child, it is a
severely devastating event. It is believed that by reducing the number of deaths in these
two categories, since they are the most vulnerable, deaths from other demographics will
also be reduced, creating a nation safer from fire.

114
A.6 Alternative Fire Scenario Using CFAST
Consolidated Model of Fire Growth and Smoke Transport (CFAST) is a two-zone
fire model developed by NIST that is publicly available on their website:
http://fast.nist.gov/. Though this program has multiple capabilities, for the purpose of
this thesis, it was used to develop time/temperature and heat flux histories at the ceiling in
a scenario developed to be representative of a typical residential living room.
CFAST uses a system of ordinary differential equations derived from the
fundamental principles of conservation of mass, energy, and the ideal gas law. These
equations predict values as a function of time such as flame height, ceiling layer
thickness, pressures, temperatures, and mass of entrained species.
A fundamental limitation of CFAST, which is common to zone models, is that it
approximates the ceiling layer, plume, and lower gas layer as straight-edged, uniform
temperature volumes, which is not the case in a real fire scenario, giving rise to a 10%
spatial error on calculation of the layer thickness (Jones 2004). Also, it is best used under
circumstances where the length and width of the room are similar and the ceiling is kept
within the limits described in Table 20. If one dimension becomes much larger than the
other, the space will essentially be a corridor, and because corridors have much different
flow patterns that that of a normal room, CFAST has a corridor flow option that should
be used accordingly. If the ceiling is too tall compared to the floor dimensions, at some
point the width of the plume at a given height may become equal to the width of the room
and the governing limiting assumptions will fail. It was found experimentally that in
elevator shafts, when the plume width reaches the walls, combustion products and air mix

115
completely, creating a one-zone model necessary (Jones 2004). Dimensional limitations
that must be considered are summarized below in Table 20. (Jones 2004)
Table 20: Recommended CFAST compartment dimension limits Ratio Acceptable Special Consideration Needed Corridor Flow
(Length/Width)max L/W < 3 3 < L/W < 5 5 < L/W (Length/Height)max L/H < 3 3 < L/H < 6 6 < L/H (Width/Height)min W/H > 0.4 0.4 > W/H > 0.2 0.2 > W/H
A summary of the necessary input variables for the CFAST simulation is shown
below in Table 21.
Table 21: Summary of CFAST inputs for the delayed ignition scenario CFAST Analysis
Description Value Description Location (XxYxZ)
Ignition Time
Simulation Time 3600sec. Bunsen 8.5'x8'x0' 0sec Output Interval 30sec. Sofa 8'x8'x0' 5sec Initial Temperature 68˚F Curtains 15.25'x8'x4.5' 60sec
Initial Pressure 1atm Upholstered Chair 4'x8'x0' 180sec
Relative Humidity 50% Curtains 8'x15.25'x4.5' 180sec Power Law 0.16(default) TV set 8'x2'x0' 300sec Compartment Dimensions
16'x16'x9' (XxYxZ)
Design Fires
Upholstered Chair 12.8'x12.8'x0' 300sec
Wall & Ceiling Materials
All 1/2" gypsum board
Environmental and Geometrical Input Parameters
Horizontal Flow Vent
6'x3' doorway (always open)
Remaining consistent with the floor system design, a 16 foot by 16 foot room was used
along with an assumed ceiling height of 9 feet. These dimensions fit well inside the
limitations described in Table 20, therefore no special considerations were needed,
ordinary room flow patterns could be assumed, and a two-zone model was legitimate.
Wall and ceiling materials were chosen to be gypsum board because this is the most
common finish covering used in light-weight residential construction. The doorway was
centered on the westerly wall of the simulated compartment. Figure 17 below shows a
sketch of the model used in this simulation. In this case, the yellow markers on the

116
ceiling represent data collecting targets, whose locations were defined by the user; while
all others yellow markers are design fires.
Figure 17: Room layout of the CFAST model used, provided by a visual package called Smokeview™
Design fires were chosen in to reflect the types of combustibles most commonly
involved in residential fires. Appendix A.5 Residential Fire Ignition Sources describes
statistics on this topic. As discussed in Appendix A.5, upholstered furniture is one of the
most common materials involved in residential fires that cause injury. The bunsen was
used to simulate an ignition source. CFAST has a limited number of combustible items
to choose from that have predefined heat release rate (HRR) curves. Because the bunsen
was the item with smallest intensity HRR curve that exhibited a growth and decay period,
it was the best fit for its purpose in this simulation. Other items were chosen to try to
simulate what may be in a typical living room. Ignition times were chosen to try and
simulate the progression of a fire from ignition source, to the item it impinges upon, then
to surrounding combustible materials. Item locations were, for the most part, arbitrary.
In order to obtain the worst case time/temperature and time/heat flux scenarios to
be used in the thermal analysis, an array of information collecting targets were created in

117
the model. Target information is summarized in Table 22 below. Locations were chosen
to be above and surrounding the upholstered couch in the center of the room. Because it
is the first item ignited, and has the most intense heat release rate curve, as defined by the
CFAST program, it was assumed that these locations would yield the worst-case
time/temperature curve. Placing targets close to the walls of the room was avoided
because many zone models contain algorithms for reflected heat flux from the hot surface
of the walls back to the room. If the target was to close, this may change the results
considerably, and because this complication is beyond the scope of this project, targets
were kept towards the center of the room.
Table 22: Description of additional targets created in CFAST analysis. Locations are typical for all scenarios.
Target Descriptions Target Location (XxYxZ) Material Analysis Type
1 8'x8'x9' 1/2"gypsum board Thermally Thin 2 4'x12'x9' 1/2"gypsum board Thermally Thin 3 12'x4'x9' 1/2"gypsum board Thermally Thin 4 12'x12'x9' 1/2"gypsum board Thermally Thin 5 4'x4'x9' 1/2"gypsum board Thermally Thin
Multiple scenarios were run to generate the most intensive situation. Model
variations included making all items burn at the same time, changing wall and ceiling
materials, changing the fire to be ventilation limited, and using a thermally thick analysis.
After evaluating all data, the most severe time/temperature exposure was compared to the
ASTM E-119 curve. The scenario using delayed ignition, gypsum ceiling, ventilation
unlimited, and thermally thin analysis was chosen and is summarized below in Figure 18.
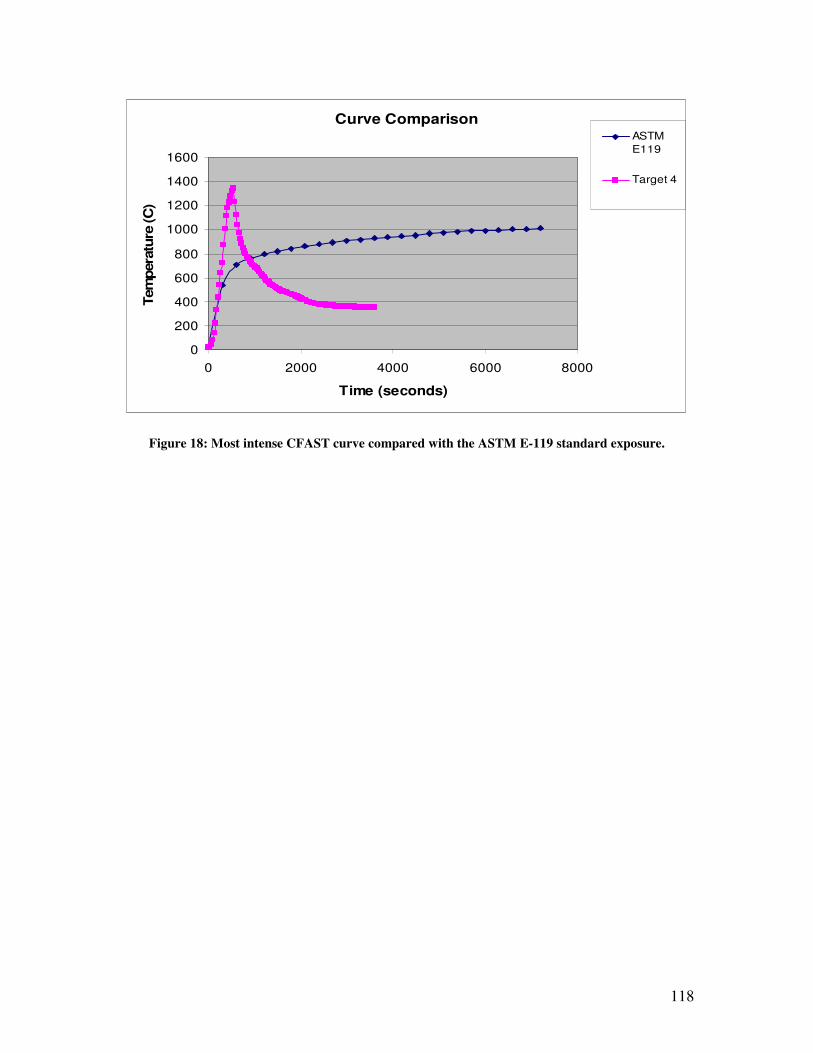
118
Curve Comparison
0
200
400
600
800
1000
1200
1400
1600
0 2000 4000 6000 8000
Time (seconds)
Tem
pera
ture
(C)
ASTME119
Target 4
Figure 18: Most intense CFAST curve compared with the ASTM E-119 standard exposure.

119
A.7 Alternative Model for Char Formation
Strength reduction occurs in two fashions for the wood members, charring and
thermal degradation before charring. The effect of charring is the most well known and
documented of these behaviors. Empirical formulas have been established for charring,
and they are shown below.
32
/;2804.0 mkgn =���
����
�+= ρρ
β (19) (Buchanan 2001)
187.0
58.2t
nββ = (20) (Buchanan 2001)
tc ⋅= β (21) (Buchanan 2001) Where �n is the nominal char rate in millimeters per minute, � is the effective char rate, t
is the exposure time in minutes, and c is the char depth in millimeters. Because exposure
time is based upon the ASTM E-119 standard curve, this information can be coupled the
respective time/temperature data to determine the loss of section in the lumber during the
exposure.

120
A.8 Combined Stress Index A combined stress index (CSI) could be used as the failure criteria of the wood
sections and plate element. This particular CSI was taken from a paper by White,
Cramer, and Shrestha called “Fire Endurance Model for a Metal-Plate-Connected Wood
Truss”.
This failure model includes a CSI for compression, tension, and a Plate Failure
Index (PFI) that could be used to represent the integrity of the interaction between the
wood and the plate. If the CSI or PFI is greater than or equal to 1.0, the section will fail.
The equations below describe the indexes.
Compression:
3
1
1c
cc
bc
b
c
c
Ff
Ff
FfCSI
−=
���
����
�
⋅+��
�
����
�=
θ
θ
��
���
�−��
���
� +−
+=
8.0*
6.16.1323232
1cccccc
cFFFFFFF
( )23 /822.0
dLEFc =
Where fc is the member compressive stress, fb is the member bending stress, Fb is the
member bending strength (assuming complete lateral support), Fc2 is member crushing
strength, Fc3 is the member buckling stress, E is the elastic modulus, L is the member
length, d is the member depth, and �c is a parameter that captures the severity of the
buckling stress in relation to the member compressive stress used to reduce Fb since the
members are not actually continuously supported.
(22)
(23)

121
Tension:
���
����
�+��
�
����
�=
b
b
t
t
Ff
FfCSI
Where ft is the member tensile stress and Ft is the member tensile strength. Plate Failure:
0
11KKPFI −=
Where K1 is the final tangent stiffness value of the plate-wood connection, and Ko is the
original tangent stiffness value of the plate-wood connection.
(24)
(25)