Embed Size (px)
Citation preview
The XTREM Power and Performance Simulator for
the Intel XScale R© Core: Design and Experiences
GILBERTO CONTRERAS and MARGARET MARTONOSI
Department of Electrical Engineering, Princeton University
JINZHANG PENG and GUEI-YUAN LUEH
Microprocessor Technology Lab, Intel Corp.
ROY JU*
Managing power concerns in microprocessors has become a pressing research problem across thedomains of computer architecture, CAD, and compilers. As a result, several parameterized cycle-level power simulators have been introduced. While these simulators can be quite useful formicroarchitectural studies, their generality limits how accurate they can be for any one chip fam-
ily. Furthermore, their hardware focus means that they do not explicitly enable studying theinteraction of different software layers, such as Java applications and their underlying runtimesystem software. This paper describes and evaluates XTREM, a power simulation tool tailoredfor the Intel XScale microarchitecture. In building XTREM, our goals were to develop a microar-chitecture simulator that, while still offering size parameterizations for cache and other structures,more accurately reflected a realistic processor pipeline. We present a detailed set of validationsbased on multimeter power measurements and hardware performance counter sampling. XTREMexhibits an average performance error of only 6.5% and an even smaller average power error: 4%.The paper goes on to present an application study enabled by the simulator. Namely, we useXTREM to produce an energy consumption breakdown for Java CDC and CLDC applications.Our simulator measurements indicate that a large percentage of the total energy consumption (upto 35%) is devoted to the virtual machine’s support functions.
Categories and Subject Descriptors: D.3.4 [Programming Languages]: Processors—Runtimeenvironments; C.3 [Special-Purpose and Application-Based Systems]: Real-time and em-bedded systems
General Terms: Measurements, Performance, Experimentation, Languages
Additional Key Words and Phrases: Power Modeling, Java, Power Measurements, Intel XScaleTechnology
This work was supported in part by an NSF Information Technology Research Grant CCR-0086031
and by SRC contract number 2003-HJ-1121. Authors’ Address: Department of Electrical Engi-neering, Princeton University, Princeton, NJ 08540. Email: {gcontrer,mrm}@princeton.edu. *Theauthor contributed to this work while working at Intel Corporation. We gratefully acknowledgefunding and equipment donations from Intel Corp.Permission to make digital/hard copy of all or part of this material without fee for personalor classroom use provided that the copies are not made or distributed for profit or commercialadvantage, the ACM copyright/server notice, the title of the publication, and its date appear, andnotice is given that copying is by permission of the ACM, Inc. To copy otherwise, to republish,to post on servers, or to redistribute to lists requires prior specific permission and/or a fee.c© 2006 ACM 1529-3785/2006/0700-0001 $5.00
ACM Transactions on Embedded Computing Systems, Vol. V, No. N, Month 2006, Pages 1–0??.

2 · G. Contreras et al.
1. INTRODUCTION
Recent years have seen a proliferation of embedded devices in many aspects oflife, from cell phones to automated controllers. Each new generation of embed-ded devices includes new features and capabilities, which are made possible bythe greater data processing speeds of embedded microprocessors and larger datastorage capacities of RAM and FLASH chips. For device designers and softwareengineers however, these attractive features can mean more challenging power andthermal design issues, resulting in added complexity and design/test time of targetapplications.
Under such constraints, understanding the power consumption of running soft-ware during the first design stages is of extreme importance. This is because know-ing power consumption can help realize early power/performance optimizations.This scenario, in reality, is difficult to achieve since software performance and powerconsumption are very dependent on implementation details of the processing device,which at early stages might not be fully defined. Furthermore, with complex soft-ware platforms like Java runtime systems running on embedded devices, the taskof understanding power and performance becomes even more challenging. This iswhere high-level design tools come into play. Research in low-power architecturesand energy-efficient programming techniques has led to an extensive suite of high-level tools with the purpose of estimating power and performance characteristics ofexisting and theoretical microprocessor designs [Brooks et al. 2000][Krishnaswamyand Gupta 2002][The SimpleScalar-ARM Power Modeling Project 2004][Ye et al.2000]. Some of these tools have been used to estimate power consumption of high-end superscalar processors while others have been used to investigate the effects ofsoftware transformations on power consumption. Existing power estimation toolsgenerally offer great flexibility in their usage and configuration since they do notmodel a particular pipeline implementation. Furthermore, they are mostly aimedat studying C and assembly-based benchmarks; we are more interested in Javaapplications and Java runtime systems.
This paper introduces XTREM, a microarchitectural functional power simulatorfor the Intel XScale core. XTREM is a comprehensive infrastructure capable ofproviding power and performance estimates of software applications designed torun on Intel XScale technology-based platforms. XTREM models the effectiveswitching node capacitance of various functional units inside the core, following asimilar modeling methodology to the one found in [Brooks et al. 2000].
The entire XTREM infrastructure has been tailored for the Intel XScale coreand validated against real hardware for improved accuracy, yet it has been keptflexible enough to be used during the first design and exploration stages of softwareand hardware design ideas. We were able to obtain a 4% average error on powerestimates and an error of less than 7% on average performance (IPC) across a diverseset of nine different benchmarks composed of C-based embedded benchmarks andJava CLDC applications.
Cycle-level simulation of Java applications by our base simulator is made possiblethrough added system calls and soft-float support. This adds an extra dimensionof analysis to XTREM since it is possible to separately analyze power and perfor-mance characteristics of the JVM and Java application code (JITted code). In fact,
ACM Transactions on Embedded Computing Systems, Vol. V, No. N, Month 2006.

The XTREM Power and Performance Simulator for the Intel XScale Core · 3
detailed knowledge of the JVM memory map allows performance/power analysis ofindividual JVM phase components such as the class loader, the execution engine,the JIT compiler and/or the garbage collector. This is done for our case studyin Section 8. For tested CLDC Java benchmarks, we observed that power usagebetween JITted code and JVM code is quite varied, as our simulation results showthe JVM can consume as little as 14% or as much as 70% of the total averagepower.
This paper makes the following contributions to the area of embedded powerestimation and performance analysis tools:
—We have developed power models for the various functional units of the IntelXScale core.
—Our tools enable one to run a JVM on top of a functional simulator, whichallows a much broader application analysis of many important Java embeddedapplications.
—Our simulation framework is the first to support deeper application-aware analysis—such as distinguishing execution of Java JITted application code and Java run-time system procedures.
—Having developed a data acquisition methodology consisting of physical multi-meter measurements, Hardware Performance Counter (HPC) statistics and sim-ulation results, we present a broad comprehensive analysis of Java and Non-Javasystems through the use of a validated cycle-accurate power and performancesimulator.
This paper is organized as follows: Section 2 begins with a brief descriptionof the Intel XScale microarchitecture, detailing some architectural features thatmake the Intel XScale core unique. Section 3 describes the microarchitecturalfunctional simulator that models the pipeline structure of the Intel XScale core,which is the heart of XTREM. Section 4 describes various measuring techniquesused in the acquisition of necessary run-time information for the study of the IntelXScale core and validation of XTREM’s power models. Sections 5 and 6 describein detail performance and power modeling validation results for various Java andNon-Java applications by comparing simulation versus hardware measurements.Section 7 discusses the influence of data activity factors on the power consumptionof the Intel XScale-based PXA255 microcontroller. Section 8 presents our casestudy where XTREM is used to study the energy consumption of a Java runtimesystem by dissecting the virtual machine into various software components. Section9 describes related work and highlights existing differences between XTREM andother power estimation tools. Future work is described in Section 10. The summaryfor our work can be found in Section 11.
2. THE INTEL XSCALE CORE
The Intel XScale core is a high-performance, low-power microarchitecture specifi-cally targeted for embedded applications [Intel Corporation 2003b]. It is compatiblewith the ARMv5TE instruction set and includes support for eight new DSP instruc-tions that take advantage of a fast DSP coprocessor. We chose to study the Intel
ACM Transactions on Embedded Computing Systems, Vol. V, No. N, Month 2006.

4 · G. Contreras et al.
Fig. 1. Block diagram of the Intel XScale microarchitecture pipeline.
XScale core largely because of its wide use in embedded high-performance applica-tions. Furthermore, its support for dynamic voltage and frequency scaling (DVFS)makes it a good candidate for power/performance research studies.
The Intel XScale core is a seven to eight stage (depending on the type of execut-ing instruction) single issue superpipelined microprocessor with many architecturalfeatures that make it suitable for general purpose embedded applications. Figure 1shows the Intel XScale microarchitecture pipeline organization.
Among the most characteristic features of the Intel XScale core we find a 32KB32-way set associative instruction cache and a 32KB 32-way set associative datacache. Access to data and instruction caches is distributed between two pipelinestages. The first access stage is dedicated for address TAG comparison and veri-fying memory access permissions, which are stored in a 32-entry fully-associativeTranslation Lookaside Buffer (TLB). The second stage is spent retrieving data fromthe cache. This two-cycle cache access distribution allows the Intel XScale core tobe clocked at faster rates than previous ARM cores.
As illustrated in Figure 1, instruction decoding and register file data access areperformed in separate stages, as opposed to a unified decode-read stage commonlyfound in other ARM devices [M. Levy 2002]. The decoding engine of the IntelXScale core supports 32-bit ARMv5 and 16-bit ARMv5T Thumb instructions byincluding a special decoding unit that expands 16-bit instructions into 32-bit in-structions. This assists devices with a very limited amount of memory since 16-bit
ACM Transactions on Embedded Computing Systems, Vol. V, No. N, Month 2006.

The XTREM Power and Performance Simulator for the Intel XScale Core · 5
instructions can yield more compact program code. A 128-entry direct mappedBranch Target Buffer (BTB) with a 2-bit branch predictor is included in the IntelXScale microarchitecture to improve performance.
The high clock rates of the Intel XScale core exacerbate the latency differencebetween core and main memory. To alleviate this problem, the core includes twospecialized data buffers called the fill buffer and the write buffer that sit betweenthe processor’s core and main memory [Intel Corporation 2000]. The 32-byte,four-entry fill buffer is responsible for sending and receiving all external memoryrequests, allowing up to four outstanding memory request before the core needsto stall. The coalescing 16-byte, eight-entry write buffer captures all data writeoperations from the core to external memory, storing data temporarily until thememory bus becomes available.
The Intel XScale core supports demanding DSP applications by including a 40-bit Multiply-Accumulate (MAC) unit. The MAC is a variable-latency, high-speed,low-power multiply unit. It takes two to five clock cycles to complete an operationdepending on instruction type and data width. Intel XScale technology engineershave also extended memory page attributes of the microprocessor memory manage-ment unit to enhance memory-caching dynamics. Memory pages can be configuredto be non-cacheable, cacheable by the data cache or cacheable by a 2KB 32-wayset associative mini-data cache.
We have integrated many of the above architectural features into XTREM’s mod-els: Data and instruction cache accesses have been split into two stages, buffersassimilating fill and write buffers have been modeled into our simulator and ourbranch predictor has been modified to match the hardware’s 2-bit prediction algo-rithm. Thumb instructions and special memory page attributes are not supportedby our simulator since none of our tested benchmarks make use of these features.The addition of supported microarchitectural features into XTREM provides uswith an accurate simulator that reports an average performance error of less than1% for micro-kernels and an average error of less than 7% for our tested set ofbenchmarks as described in Section 5.
2.1 Performance Counters
The Intel XScale core includes two specialized 32-bit registers, CNT0 and CNT1,that can be configured to monitor and count any of the 14 possible performanceevents available to the Intel XScale core [Intel Corporation 2003b]. These perfor-mance counters are accessible in privileged OS mode and only two events may bemonitored at a time. A third specialized 32-bit register, CLKCNT, is triggered onevery clock cycle and its value can be used in conjunction with CNT0 and CNT1 tocompute interesting performance metrics that can reveal major performance lossesof running applications. Since performance monitoring of software happens duringruntime, performance counters are a reliable source of performance data. We usethese counters to validate our performance and power models.
3. XTREM POWER AND PERFORMANCE SIMULATOR
The methodology for defining the granularity of power distribution (i.e. the numberof functional units to model) is not straightforward since the Intel XScale core isembedded inside a complex microcontroller surrounded by various peripherals that
ACM Transactions on Embedded Computing Systems, Vol. V, No. N, Month 2006.
6 · G. Contreras et al.
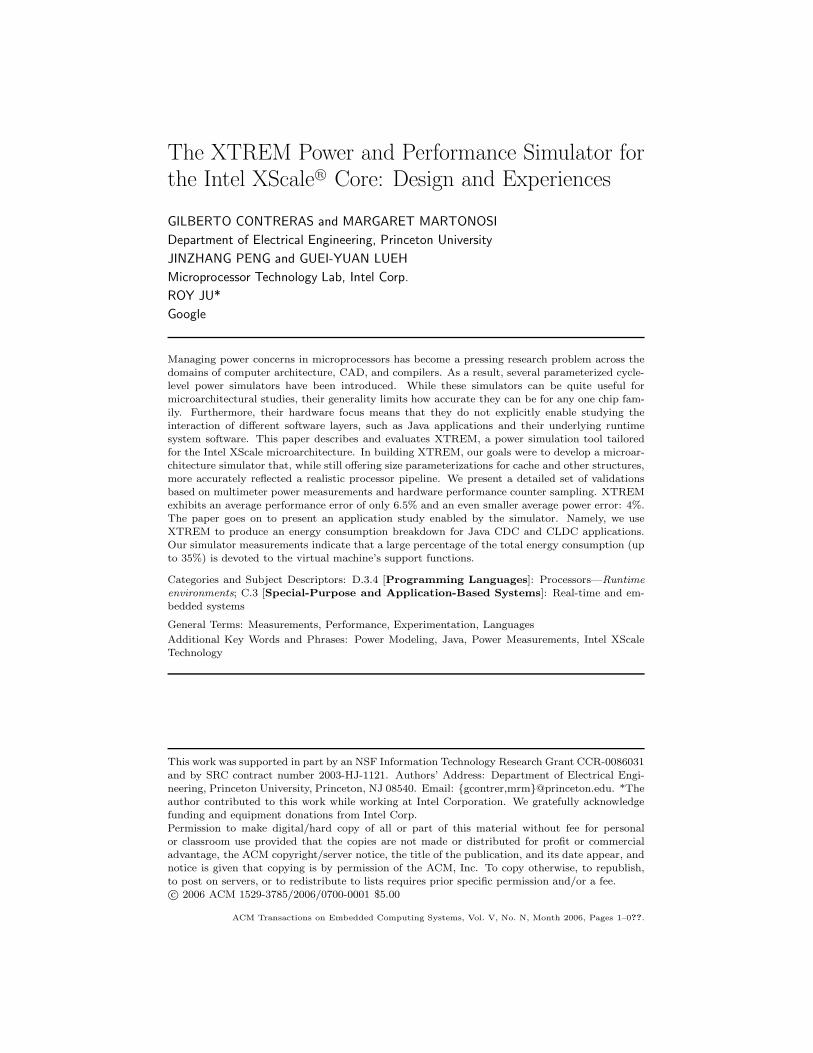
Fig. 2. Processor block diagram. The Intel XScale core is surrounded by support functional unitsthat contribute to the processor’s overall power consumption. Not all peripheral units are shownin this figure.
interface to external components. For example, Figure 2 shows a block diagram ofthe Intel XScale-based PXA255 microcontroller showing the spatial placement ofthe main core within the processor. This work focuses on the power behavior of themain processing core and less so on the energy usage of the external componentssuch as the UARTs, LCD drivers and PCMCIA on-chip modules. It is, of course,to some extent impossible to ignore the effects of these units when power samplingis done on the microcontroller in real time. We minimize these effects by turningoff as many unused peripherals as possible.
The starting point in the construction of power models is a detailed descriptionof the Intel XScale technology and microarchitecture as described by Clark et al.[2001]. This paper describes the logic-level implementation of caches and clockdistribution logic, among other important functional blocks. From this lower-leveldescription and available Intel XScale technology documentation, an initial set ofpower models using Wattch [Brooks et al. 2000] power models as templates werecreated. Some of Wattch’s power models have been adapted into XTREM withminor changes, while other power models were adjusted and revised to reflect moreaccurately the Intel XScale microarchitecture and new technology implementations(as in the case of memory arrays and caches).
Our power models are mathematical equations that provide node switching ca-pacitance estimates. We constructed power equations based on transistor-levelschematics of functional units and a high-level view of transistor gate and draincapacitances. A single equation does not describe an entire functional unit, butrather basic sub-blocks that can be reused. For example, the register file unit issub-divided into a row decoder, an SRAM array and pre-charge logic.
Our power models are based on the following CMOS energy equation:
E = CLV 2 (1)
Estimating the node capacitance is the first step to estimating energy (and con-sequently power) requirements of various processor structures. For example, theSRAM array shown in Figure 3 is used for fast data structures within the CPU such
ACM Transactions on Embedded Computing Systems, Vol. V, No. N, Month 2006.

The XTREM Power and Performance Simulator for the Intel XScale Core · 7
as the register file and cache arrays. Therefore, given the mathematical equationsthat describe the power requirements of an SRAM array suffices to describe thepower usage of variety of data structures within the core.
For the SRAM array shown, M data elements are arranged vertically and theirconstituent N bits are spread horizontally. On every clock cycle, all the bitlines(columns) of the structures are pre-charged. When a particular data element isaccessed, the decoder selects a data element (a word in the structure) by enablingthe wordline driver attached to the desired data element. Selecting a data elementrequires raising the wordline from 0 to 1, which according to Equation (1), willconsume energy proportional to the capacitance seen by the power supply. Lookingat Figure 3, we see that this capacitance consists of the diffusion capacitance of thewordline driver, two gate capacitances for every bit attached to the wordline, andfinally the wire capacitance of the wordline. The addition of these capacitances isexpressed in Equation (2).
Power dissipation by the pre-charge logic happens as follows: On every cycle,the pre-charge logic pre-charges all bitlines to a predetermined value, VDD. If aparticular bitline is already charged, no energy is invested for that bitline. If abitline was discharged by a previous element access, however, one of the bitlineswill be discharged and the pre-charge logic will invest energy proportional to thecapacitance of the bitline, which is equal to the diffusion capacitance of the pre-charge transistor, the diffusion capacitance of the bit cell access transistor, and thecapacitance of the bitline wire. The addition of these capacitances is expressed inEquation (3). Equations (2) and (3) are given as an example of the analysis andmodeling detail used in the construction of power models for various functionalunits.
Cwordline = Cdiff (WordLineDriver) + (2)
2 ∗ Cgate(CellAccess) ∗ N + Cmetal ∗ WordLineLength
Cbitline = Cdiff (PreCharge) + (3)
Cdiff (CellAccess) ∗ M + Cmetal ∗ BitLineLength
Not all necessary power models for the Intel XScale core are found in Wattch.For example, the unique T-shaped clock structure common in the Intel XScalecore had to be created based on work by Clark et al. [2001] since Wattch powermodels assume an H-tree clock distribution network. Functional units for which nocomplete circuit-level diagram is available are assumed to consume constant poweron every access. The power consumption value of these units is either approximatedusing functional-unit isolation techniques or a power consumption estimate foundin existing literature. The MAC unit is an example for which no complete circuit-level diagrams are published. Liao and Roberts [2002] describe the architecture ofthe MAC unit used by the Intel XScale core. The level of detail presented by Liaoand Roberts [2002], however, is not enough to construct a comprehensive circuit-level description of the MAC unit. The paper, however, provides the nominalpower consumption of the unit, which is used by XTREM as the per-access powerconsumption cost.
ACM Transactions on Embedded Computing Systems, Vol. V, No. N, Month 2006.

8 · G. Contreras et al.
Fig. 3. RAM array schematic. Transistor-level schematics like the one shown here are used tocreate mathematical equations that estimate internal node switching capacitance.
The power consumption of other functional units for which no circuit-level de-scription is available, such as the ALU and the memory manager unit (MMU), isderived empirically using functional-unit isolation techniques.
Functional unit isolation works by executing a carefully-crafted micro-stressmarkon our development board. Since the Intel XScale core is a single-issue, in-orderprocessor, the behavior of the execution pipeline as well as data interdependencebetween instructions can be accurately predicted based on the input instructionstream. An approximation of the power usage of a particular functional unit canthus be obtained by measuring the delta change in power consumption betweena micro-stressmark that uses a partular functional unit, say, every cycle, and thepower consumed by a second micro-stressmark that does not use the functional unitin question. Given this delta power difference and the access rate of the functionunit, an average per-access power consumption can be estimated.
While functional unit power isolation is useful, it is not our primary approachto power modeling. As stated before, we only use power isolation techniques onselected functional units for which no other techniques were available. We do,however, use power isolation techniques more extensively for validation purposes,as covered in Section 6.
3.1 The XTREM Functional Simulator
XTREM is in part derived from the ARM-SimpleScalar simulator [The SimpleScalarToolset 2001], a highly flexible microarchitectural-level simulator with a five-stagesuperscalar-like pipeline organization. The ARM-SimpleScalar simulator providesreasonably good accuracy for many applications, but for some stressmarks withheavy emphasis on the memory subsystem, significant differences can be observedbetween the IPC (instructions per cycle) it predicts and that measured by the hard-ware performance counters of the Intel XScale core. This large performance erroris primarily caused by the pipeline and memory sub-system differences between thegeneral ARM-SimpleScalar microarchitecture and that of the Intel XScale microar-chitecture.
XTREM includes architectural features not available in ARM-SimpleScalar such
ACM Transactions on Embedded Computing Systems, Vol. V, No. N, Month 2006.

The XTREM Power and Performance Simulator for the Intel XScale Core · 9
as fill and write buffers, a 4-entry pend buffer, a revised version of the well-known2-bit branch predictor algorithm and a read/write cache-line allocation policy. Sup-porting architectural features such as these makes XTREM more closely-matchedto the microprocessors we target.
In the same way we implemented new units into XTREM we also removedmicroarchitectural units inherited from ARM-SimpleScalar that have no parallelwithin a true Intel XScale microarchitecture. For example, the Register UpdateUnit common to many SimpleScalar simulations is not present in our framework.
XTREM allows monitoring of 14 different functional units of the Intel XScalecore: Instruction Decoder, BTB, Fill Buffer, Write Buffer, Pend Buffer, RegisterFile, Instruction Cache, Data Cache, Arithmetic-Logic Unit, Shift Unit, MultiplierAccumulator, Internal Memory Bus, Memory Control and Clock.
3.2 XTREM JVM Simulation Support
To support research on power and performance of Java runtime system for embed-ded devices, XTREM gives researchers the ability to run complex Java runtimesystems such as Sun’s KVM reference CLDC design [Sun Microsystems 2000] orIntel’s XORP1 JVM. It is required, however, that the JVM binary be compiledusing the -static linking flag, meaning no dynamic libraries can be used. We haveused a statically linked XORP JVM for all the experiments presented in this paper.
A dynamically linked XORP JVM (designed to run on top of an OS) employs aone-to-one Java thread to native thread policy, which means that each Java threadis mapped to a native thread. In order for us to be able to run a statically linkedXORP JVM directly on top of our functional simulator without emulating an OS,we have to remove multi-thread support and thread synchronization from the JVM.The direct implication of this modification is that multi-threaded Java applicationscannot run using our statically linked (modified) JVM. We hope to add multi-thread support to our infrastructure in the near future by either emulating an OSbetween our simulator and the JVM or by mapping M Java threads into a singlenative thread.
Our “static” XORP should not affect the performance of the running Java appli-cation significantly. This was verified by comparing hardware performance counterstatistics from various Java applications using a modified “static” link and an un-modified “dynamic” link of the XORP. For four CLDC Java benchmarks, our exper-iments showed an average difference of less than 2% between hardware performancecounter values. Physical power measurements between the two XORP configura-tions are also very similar, with an average difference of less than 0.5% across thesame set of four CLDC Java benchmarks.
4. MEASURING TECHNIQUES FOR XTREM VALIDATION
4.1 The DBPXA255 Development Board
Our testing equipment consists of the DBPXA255 development board [Intel Cor-poration 2003a] powered by the Intel PXA255 microcontroller running the Linux
1The XORP JVM is a clean-room runtime system designed specifically for high performance andsmall memory footprint. At current development stage, XORP has full-fledged support for J2MECLDC/CDC on XScale platforms.
ACM Transactions on Embedded Computing Systems, Vol. V, No. N, Month 2006.

10 · G. Contreras et al.
2.4.19-rmk7-pxa1 patched kernel. The DBPXA255 is a multi-purpose developmentboard that includes many of the device features commonly found in embedded de-vices such as SRAM and FLASH memory banks, a LCD touch screen, ethernetadapter and keyboard.
The DBPXA255 development board does not include a tertiary storage devicesuch as a hard disk or a CD-ROM. Since it is infeasible to store all benchmarks andtheir associated data sets on the board’s limited flash memory, a network connectionwas set up between the development board and a host PC.
The DBPXA255 board has two sets of jumpers that facilitate voltage and currentmeasurements of hardware. The first set allows the user to tap into the mainpower supply of the processor. The second set exposes the CPU’s memory busvoltage pins. We use the Agilent 34401A digital multimeter to sample currentconsumption of the Intel PXA255 microcontroller while running our selected set ofbenchmarks. Voltage can be measured in a similar way, but in all measurements thevoltage remained nearly constant throughout our experiments, so we perform ourcalculations using a constant voltage of 1.5V. Since voltage is assumed to remainconstant, we only sample current, which is then multiplied by voltage to get a powerfigure as defined by the basic equation P = V · I.
We set the PXA255 microcontroller to use a core frequency of 200Mhz, a busclock frequency of 100MHz and memory frequency of 100Mhz. The microprocessorcore’s voltage was adjusted to 1.5V and all I/O pins are driven by a 3.3V powersupply. Under this setup we measured a CPU idle power of 80mW and an averageCPU power consumption close to 270mW. Although main memory power consump-tion is not part of our study, we measured an idle SDRAM power consumption of40mW and an active average power consumption close to 90mW (for one SDRAMHYB39S25610DT module).
4.2 Runtime Power Sampling
We perform power sampling at runtime of various test benchmarks using the Agilent34401A digital multimeter. The digital multimeter interfaces to a PC through aGPIB cable. A GPIB interface allows us to obtain sampling rates of up to 1000samples per second. Figure 4 shows the the physical measurements setup. Inorder to better focus on the microarchitectural core, we turned off various unusedperipherals such as the LCD clock driver, UART clock drivers, and the AC97 clockdriver. Turning these components off reduces idle power consumption by as muchas 7 to 8mW (out of a total of roughly 270mW non-idle power consumption) forthe 200Mhz and 1.5V processor setup.
4.3 Runtime Performance Sampling
In addition to power sampling via multimeter, we also use hardware performancecounters for simulator validation. We interfaced to the hardware performance coun-ters using a Loadable Kernel Module (LKM) that adds system calls to the LinuxOS kernel. These additional system calls are used to configure and read hardwareperformance counters. Each call is no more than three assembly instructions long,keeping performance overhead low. Overflow of performance counters is detectedby a special bit location on the performance’s counters configuration register. OurLKM is based on a similar performance counter reader previously designed for
ACM Transactions on Embedded Computing Systems, Vol. V, No. N, Month 2006.

The XTREM Power and Performance Simulator for the Intel XScale Core · 11
Intel
XScale
Microcontroller
HHHHHj
Digital
Multimeter�
Fig. 4. Physical measurements setup. The Agilent 34401A Digital Multimeter (DMM) is usedto sample current consumption of the Intel PXA255 CPU. High sampling speeds are achievedthrough a GPIB connection between the DMM and a host PC.
Pentium 4 systems [Isci and Martonosi 2003]. Performance sampling is done byavgsample, a C program that creates two working threads. The first thread runsthe target program that we wish to measure. The second thread is the main sam-pling thread. The sampling thread is in charge of clearing and activating hardwareperformance counters before the target program thread runs. Once the target ap-plication thread is running, the sampling thread waits until the application threadexits and immediately reports results to the user. Counter overflow is automati-cally detected by an interrupt service routine, which adjusts counter values beyond32-bit accuracy when needed.
5. XTREM PERFORMANCE VALIDATION
Performance counters are very helpful in analyzing runtime performance of applica-tions as well as for exposing different memory system and pipeline latencies of theIntel XScale core. Their versatility and accuracy have proven invaluable in validat-ing XTREM. To this end we compare performance counter results and equivalentperformance metrics reported by XTREM for several stressmark programs. Stress-marks are highly predictable programs written to validate the pipeline structure ofour simulator. We wrote nine stressmarks as described below.Dcache is a small kernel that works with a data set that fits entirely in the data
cache, thus minimizing data cache misses. Dcache write stresses data throughputto main memory. The main loop writes consecutive integers into memory. Thepurpose of this kernel is to stress the memory coalescing feature of the Intel XScalecore. Dcache trash works with a data set that extends beyond the capacity of thedata cache. This stressmark has been designed to have a very large number datacache misses, ideally a cache miss for every loop iteration. Dcache writeline isvery similar to dcache write, except that dcache writeline writes one integer inevery memory address location corresponding to the beginning of one cache line sothat memory address coalescing is not possible. Add stresses the arithmetic unitof the Intel XScale core. The add benchmark has a very high IPC (instructionsper cycle) since no data dependencies exist. The BTB stressmark has been designed
ACM Transactions on Embedded Computing Systems, Vol. V, No. N, Month 2006.

12 · G. Contreras et al.
to stress the Branch Target Buffer by implementing two mutually exclusive innerbranches that miss on every loop iteration. Mult dep and mult nodep are two ker-nels that exercise and measure the latency of the multiplier when data dependenciesexist and when they are absent, respectively. icache stress is a micro-benchmarkwith a high number of instruction cache misses. Matrix is a small benchmark thatmultiplies an n by n array. It has been constructed to measure the overall qualityof our simulator.
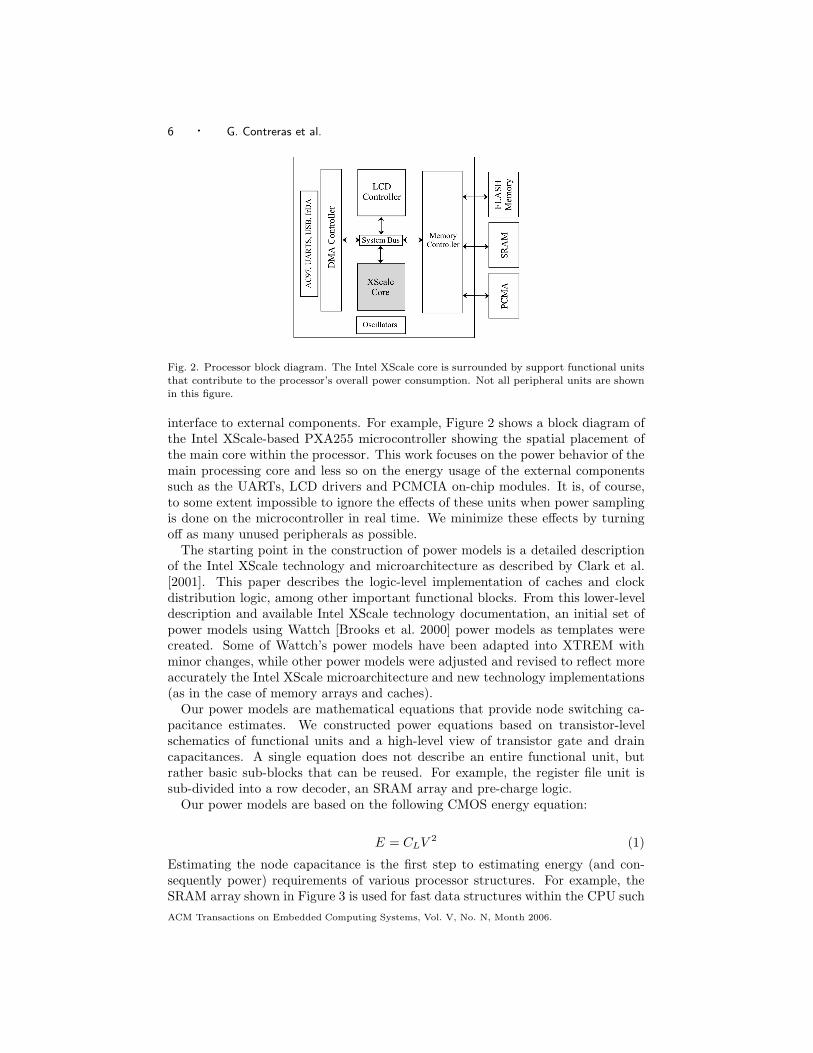
Figure 5 shows our stressmark validation results by comparing the IPC derivedfrom hardware performance counter readings, IPC reported by XTREM and IPCfrom an unmodified ARM-SimpleScalar simulator. For our work, the average IPCdifference for the nine stressmarks is less than 3%, while the average error betweenhardware performance counters and ARM-SimpleScalar is more than 17%, beingthe memory sub-system the main source of performance error.
A 3% average performance error in stressmark testing between XTREM andperformance counters is good, but in order to further quantify the accuracy ofXTREM we need to employ more realistic, complex benchmarks. For this end wehave selected five benchmarks from MiBench by Guthaus et al. [2001], an embed-ded benchmark suite. The benchmarks are: cjpeg (jpeg compression application),bitcount (bit counting algorithm), CRC (a 32-bit cyclic redundancy check), SHA(secure hash algorithm), and Dijkstra (a shortest path algorithm). These bench-marks were chosen based on their large percentage of CPU time and work done inuser space. We also want to test how well our simulator is able to track hardwareperformance for Java applications. Jzlib [Jean-loup Gailly and Mark Adler 2004],Crypto [Legion of the Bouncy Castle 2004], GIF [FM Software 2004] and REX [Za-liva 2004] are the four open Java CLDC benchmarks selected for this task. Thesefour Java benchmarks are similar to the set of Java CLDC benchmarks createdby EEMBC [Embedded Microprocessor Benchmark Consortium 2003]. Jzlib is aZLIB implementation in pure Java, Crypto is a Java implementation of crypto-graphic algorithms, GIF is a GIF-format picture decoder and REX is a Java imple-mentation for regular expressions.
Figure 6 shows performance results for MiBench and Java CLDC benchmarks inthe form of an IPC comparison graph. The graph compares the IPC derived fromhardware performance counters (HPC), the IPC reported by XTREM, and theIPC obtained from ARM-SimpleScalar (SSS). As seen from the figure, XTREMprovides reasonable performance accuracy for complex benchmarks, reporting amaximum IPC difference for CRC of 14.2% with respect to hardware-measured IPC.This relatively large error is caused by differences between our simulator and realhardware when it comes to decomposing complex instructions (such as the LDMIAand STMIA instructions) into uops. CJPEG has the lowest IPC error with less than1% difference. Average IPC difference for all nine tested benchmarks is 6.5%. ForARM-SimpleScalar, the largest error corresponds to SHA with more than 29% IPCdifference, the lowest error is 1% for CJPEG.
6. XTREM POWER VALIDATION
Validation of XTREM power models is a necessary step in the development of atrustworthy power estimation tool. Good performance accuracy is of little impor-
ACM Transactions on Embedded Computing Systems, Vol. V, No. N, Month 2006.
The XTREM Power and Performance Simulator for the Intel XScale Core · 13
0.0
0.2
0.4
0.6
0.8
1.0
dcac
he
dcac
he_w
rite
dcac
he_t
rash
dcac
he_w
riteli
ne add
btb
mult
_nod
ep
mult
_dep
icach
e_str
ess
mat
rix
Micro-Kernel
IPC
HPCXTREMSSS
Fig. 5. IPC comparison for stressmarks as reported by XTREM, ARM-SimpleScalar (SSS) andHardware Performance Counters (HPC). XTREM simulates adequately many aspects of the IntelXScale microarchitecture.
0.0
0.2
0.4
0.6
0.8
1.0
cjpeg bitcount crc sha dijkstra rex gif jzlib crypto
Benchmark
IPC
HPCXTREMSSS
Fig. 6. Comparison between simulated and hardware-measured IPC performance for a set ofMiBench and open CLDC benchmarks.
tance if we cannot guarantee a tool that also provides power estimates within atolerable error.
The first step toward validation of our power models is to isolate power consump-tion of individual functional units. Decomposing power usage into various utilizedfunctional units provides the most comprehensive way of validating XTREM powermodels since model accuracy can be traced to a single functional unit, thus giv-ing us the opportunity to pinpoint individual power models that do not follow theexpected power behavior. This, of course, may be difficult or even impossible toaccomplish for every functional unit since some units are always used independentlyof the instruction being executed; functional units such as the instruction decoder,the TLBs and the instruction cache are difficult to isolate under normal executionconditions. On the other hand, some functional units can be orchestrated in very
ACM Transactions on Embedded Computing Systems, Vol. V, No. N, Month 2006.

14 · G. Contreras et al.
0
50
100
150
200
250
300
350
0 880 1760 2640 3520 4400 5280 6160
Time (sec)
Po
wer
(m
W)
1 sec. idle power�
crcbitcnt
jpegc
?sha
dijkstra
?
0 4 8 12 16 20 24 28
(a)
0
50
100
150
200
250
300
350
0 880 1760 2640 3520 4400 5280 6160
Time (sec)
Po
wer
(m
W)
crcbitcnt
jpegc
?sha
dijkstra
?
0 4 8 12 16 20 24 28
(b)
Fig. 7. Measured (left) and simulated (right) power consumption for five MiBench benchmarks.For this set of benchmark the maximum error is 11% (JPEG) and the minimum is 3.66% (Bitcount).Benchmarks are separated by a 1 second delay seen as 80mW idle power.
predictable ways. These include the register file, ALU, MAC, Data Cache, Fill andWrite buffers.
As described in Section 5, our stressmarks have been designed to make specificuse of various functional units within the core. Serving once again as validatingagents, small stressmarks are used to dissect the processor’s power utilization intofunctional unit power consumption. This methodology assumes that no power isconsumed by units that have been turned off or are not being used. This assumptionseems plausible since the Intel XScale core is a highly power-efficient core that makesuse of multiple levels of clock gating, allowing entire units to be disabled when notin use as described by Clark et al. [2001].
Our power-isolation methodology does not guarantee the exact per-functionalunit power consumption of the entire core, but rather helps understand how poweris distributed across various functional units and how software affects overall powerconsumption. The second step in power model validation included a second revisionof power models to reduce estimation errors discovered during the first validationstep.
A third and last step in power model validation involves simulating MiBench andJava CLDC benchmarks. Instead of simply comparing “average estimated power”and “average measure power” as a validation approach, we believe power behaviorin the time domain better describes how accurately XTREM tracks real-hardwarepower behavior.
We start by describing Figure 7, which shows a power versus time plot forfive MiBench benchmarks. Figure 7a shows real power measurements, 7b showssimulated power consumption. The benchmark ordering from left to right is:JPEG Compress, Bitcount, CRC, SHA and Dijkstra. Benchmarks are separatedfrom each other by a one-second delay, visible on the graph in the form of 80mW idlepower consumption. The similarities between real and simulated power consump-tion are encouraging: XTREM is able to capture not only power behavior withina benchmark, but also the power relationship among the set of tested benchmarks.
Simulating CLDC Java benchmarks not only helps validate XTREM’s CLDCpower estimation capability, but also helps reveals many interesting characteristics
ACM Transactions on Embedded Computing Systems, Vol. V, No. N, Month 2006.
The XTREM Power and Performance Simulator for the Intel XScale Core · 15
0
50
100
150
200
250
300
0 230 460 690 920 1150 1380
Time (sec)
Po
wer
(m
W)
0 1 2 3
6
GC Call
4 5 6
6
GC Call
(a)
0
50
100
150
200
250
300
0 1000 2000 3000 4000 5000 6000
Time (sec)
Po
wer
mW
)
0 1 2 3
6
GC Call
4 5 6
���GC Call
(b)
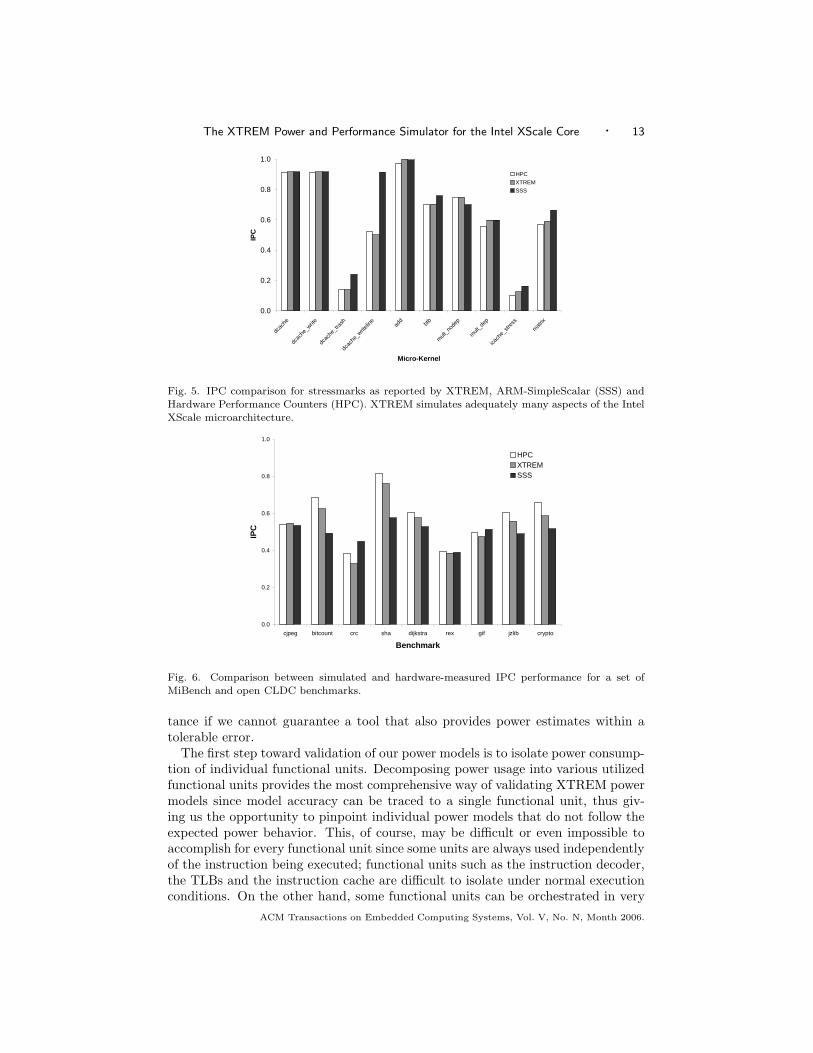
Fig. 8. Measured (left) and simulated (right) power consumption for REX. The start of CLDCbenchmarks is characterized by very varied power behavior which corresponds to JVM initializa-tion.
0
50
100
150
200
250
300
350
0 115 230 345 460 575 690 805
Time (ms)
Po
wer
(m
W)
0 500 1000 1500 2000 2500
6
GC Call
3000 3500
(a)
0
50
100
150
200
250
300
350
0 500 1000 1500 2000 2500 3000 3500
Time (ms)
Po
wer
(m
W)
(b)
6
0 500 1000 1500 2000 2500 3000 3500
GC Call
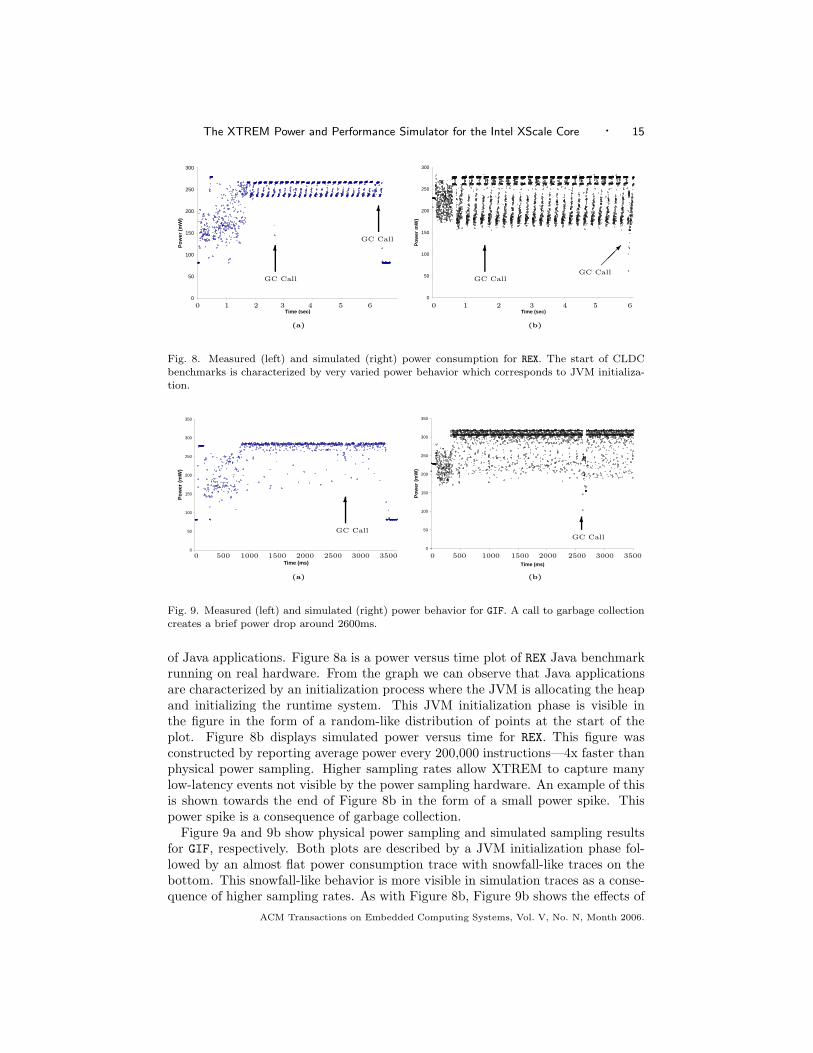
Fig. 9. Measured (left) and simulated (right) power behavior for GIF. A call to garbage collectioncreates a brief power drop around 2600ms.
of Java applications. Figure 8a is a power versus time plot of REX Java benchmarkrunning on real hardware. From the graph we can observe that Java applicationsare characterized by an initialization process where the JVM is allocating the heapand initializing the runtime system. This JVM initialization phase is visible inthe figure in the form of a random-like distribution of points at the start of theplot. Figure 8b displays simulated power versus time for REX. This figure wasconstructed by reporting average power every 200,000 instructions—4x faster thanphysical power sampling. Higher sampling rates allow XTREM to capture manylow-latency events not visible by the power sampling hardware. An example of thisis shown towards the end of Figure 8b in the form of a small power spike. Thispower spike is a consequence of garbage collection.
Figure 9a and 9b show physical power sampling and simulated sampling resultsfor GIF, respectively. Both plots are described by a JVM initialization phase fol-lowed by an almost flat power consumption trace with snowfall-like traces on thebottom. This snowfall-like behavior is more visible in simulation traces as a conse-quence of higher sampling rates. As with Figure 8b, Figure 9b shows the effects of
ACM Transactions on Embedded Computing Systems, Vol. V, No. N, Month 2006.

16 · G. Contreras et al.
0
50
100
150
200
250
300
350
cjpeg bitcount crc sha dijkstra rex gif jzlib crypto average
Benchmark
Avg
. Po
wer
(m
W)
Measured Avg. PowerSimulated Avg. Power
Fig. 10. Average power consumption for MiBench and open CLDC Java benchmarks. 12 percenterror bars are shown.
Measured Simulated
Benchmark Avg. mW Std. Dev. Avg. mW Std. Dev.
Jpegc 261.01 28.43 290.37 26.78Bitcount 265.02 15.25 255.02 16.13
CRC 277.44 5.88 290.37 1.20SHA 273.26 24.59 295.03 5.16
Dijkstra 269.06 11.85 251.06 17.80Rex 236.41 39.90 234.33 32.41GIF 259.49 42.30 292.33 38.13Jzlib 261.34 19.79 257.05 16.40
Crypto 268.54 22.44 297.03 27.78
Table I. Average power and standard deviation comparison between hardware-measured powertraces and simulated power consumption traces.
calling the garbage collector, which creates a characteristic power spike two-thirdsinto the benchmark. As a summary to our Java CLDC and C benchmark valida-tion experiments, Figure 10 gives a graphical comparison between simulated averagepower and hardware-measured average power consumption for five MiBench andfour Java CLDC benchmarks. Table I shows our results in tabular form.
7. ACTIVITY FACTORS AND POWER CONSUMPTION
Power consumption of functional units can be very dependent on input/outputdata. This power consumption dependency on activity factors is expected sincedynamic power, a consequence of charging and discharging of capacitive nodes,encompasses a large percentage of overall power consumption. Knowledge of powerdependency on activity factors is of great importance for small portable embeddedprocessors where there is a limited amount of energy available. System designerscan, for example, strategically place high access memory regions in such a way thatthe activity factors for memory address pins, and consequently internal address bus,is reduced, thus saving power and extending battery life. We once again made use
ACM Transactions on Embedded Computing Systems, Vol. V, No. N, Month 2006.

The XTREM Power and Performance Simulator for the Intel XScale Core · 17
0
50
100
150
200
250
300
0 460 920 1380 1840 2300
Time (sec)
Po
wer
(m
W)
0 2 4 6 8 10
Fig. 11. Power dependence on input activity factors for the ADD operation.
of specific stressmarks to study power consumption’s dependence on input data.Activity factor stressmarks expose activity factor dependency of various functionalunits by performing the same operation on a predetermined input data set. Usingknown input values allows the functional unit to work with a known data inputactivity factor, which is defined as the variability of ones and zeros in the binaryrepresentation of an input data vector when it transitions from data A to data B.Among the various functional units for which this experiment was realized (MAC,Data Cache, Shift Unit, and ALU), the ALU datapath unit showed the largestactivity factor influence on power consumption.
To the right of Figure 11 is a power versus time plot of the ALU-datapath activityfactor stressmark running on the Intel PXA255 microcontroller. The experiment, asseen from the plot, is divided in two parts. During the first part of the experiment,the A input varies in the vertical direction by increasing the number of ’1’ bits in thedatum while B changes in the horizontal direction in a similar way. For the secondpart of the experiment the roles of A and B are interchanged. The lower-left cornerof the first half of the experiment corresponds to adding 0 + 0. The upper-rightcorner corresponds to adding two registers with all ones (binary negative one). Inbetween each addition operation of the stressmark, input values are reset to nullvalues in order to increase one-to-zero transitions. It is interesting to observe howinterchanging the roles of the A and B inputs changes the power behavior of theexperiment.
Figure 11 demonstrates it is possible to create power swings as large as 50mWon the Intel XScale core through a stressmark that exercises specific data activityfactors on the ALU datapath. Power swings of double this magnitude are possiblein a 400Mhz Intel XScale core.
8. CASE STUDY: JAVA CDC AND CLDC
In addition to power estimation, XTREM provides researchers with the ability todissect Java application power consumption into JVM and non-JVM power, a skillnot yet available to conventional power measuring techniques. With the capabilityof discriminating between JVM and non-JVM power consumption at hand, soft-ware designers and architects can better understand how to increase power andperformance efficiency of Java Runtime systems during early development stages.
ACM Transactions on Embedded Computing Systems, Vol. V, No. N, Month 2006.

18 · G. Contreras et al.
0%
10%
20%
30%
40%
50%
60%
70%
80%
90%
100%
Compr
ess_
32M
Compr
ess_
16M
Jess
_32M
Jess
_16M
DB_32M
DB_16M
Java
c_32
M
Java
c_16
M
Jack
_32M
Jack
_16M
Avg32
M
Avg16
M
CDC Benchmark
Per
cen
t E
ner
gy
OtherGCJITLoaderJitted
0%
10%
20%
30%
40%
50%
60%
70%
80%
90%
100%
rex_
8M
rex_
4M
gif_8
M
gif_4
M
jzlib_
8M
jzlib_
4M
cryp
to_8
M
cryp
to_4
M
CLDC Benchmark
Per
cen
t E
ner
gy
OtherGCJITLoaderJitted
Fig. 12. Energy distribution among five JVM components for CDC (left) and CLDC (right) Javaapplications. The suffix attached to the benchmark name specifies the maximum heap size usedby the JVM.
We utilize XTREM to understand how energy is distributed among the variousfunctional parts of the JVM environment. For this purpose we divide the virtualmachine into five main components: JITted code, Class Loader (Loader), JIT com-piler (JIT), Garbage collector (GC), and other. This is similar to the approachfollowed by Vijaykrishnan et al. [2001]. The energy usage of each component isdetermined by the memory region from which the machine is fetching instructions.In other words, if instruction i has been fetched from the memory region occu-pied by garbage collector support functions, the power consumed by instructioni is assigned to garbage collection. The precise placement of all JVM functionsand code in memory is known since our JVM has been statically compiled. Wealso want to understand how energy distribution varies when the maximum per-mitted heap size is varied. We expect changes in energy distribution since tightermemory constraints require the garbage collector to be invoked more frequently.Previous work in this field has been done by Vijaykrishnan et al. [2001], where theenergy consumption of different JVM components is examined from the memoryperspective—caches and main memory. Our case study focuses on providing energyconsumption from the perspective of an embedded processor, not only taking cachepower into effect, but also CPU functional unit energy consumption.
We employ our energy analysis technique on the previously described CLDC Javaapplications plus five SPECJVM98 Java CDC benchmarks [Standard PerformanceEvaluation Corporation 1998]. The CDC Java benchmarks are run until completionusing the −s100 flag (full data set).
Figure 12 shows our case study results. The left side of the figure shows energydistribution for five CDC Java benchmarks and the right side shows results forCLDC benchmarks. The suffix attached to the name of the benchmark indicatesthe maximum heap size allowed. One of the most immediate observations fromthis figure is the fact that the JITted component is one of the highest energyconsumers across all benchmarks. This is good news since the JITted componentrepresents the actual user Java program being executed by the JVM. For CDCapplications, the average energy consumption for the JITted component is 65%and 58% with 32M and 16M maximum heap size, respectively. Next to the JITted
ACM Transactions on Embedded Computing Systems, Vol. V, No. N, Month 2006.

The XTREM Power and Performance Simulator for the Intel XScale Core · 19
0%
10%
20%
30%
40%
50%
60%
70%
80%
90%
100%
JITted Cloader JITted GC other
wbuffregfilebpredaludcacheicachembusdecoderclockmm
Fig. 13. Functional-unit energy breakdown of JVM components for javac with 16M maximumheap size.
component, other is the second largest energy consumer for CDC benchmarks withan average energy consumption of 16% for 32M heap size. The other componentcovers JVM functions that are needed for the correct functionality of the JVM,composed mainly of C library calls. The garbage collector is the third largestenergy consumer utilizing more than 11% of the total energy with a heap size of32M, only overtaking other when the maximum heap size is reduced to 16M. javacshows the largest variation in GC energy consumption. This is caused by the largeincrease of GC calls: 9 calls for 32M heap to 58 calls with 16M heap.
CLDC applications are less memory-hungry and are less affected when halvingthe maximum heap size (0.6% energy decrease for the JITted component). Over-all, CLDC applications invest relatively more energy in the execution component(JITted) than CDC applications. A visible exception is Jzlib. The high percent-age of power dedicated to JIT in Jzlib is caused by support functions. Supportfunctions, such as integer remainder and integer divide functions, are called withinJITted code to perform a specific task, but the actual function execution occurswithin the JVM, thus increasing its average energy requirement. Figure 13 showshow the energy consumption of the JVM components is distributed among vari-ous processor functional units when running the javac CDC benchmark with 16Mheap size. The memory manager (mm) is one of the most power-hungry components,utilizing an average of 32% of the total energy across the five JVM components. InXTREM, the mm unit is activated when the core is stalled due to a main memorydata or instruction fetch. Next to the mm unit we find the clock structure as thesecond highest energy contributor with an average of 17%. The instruction decoderand the memory bus follow with an average energy consumption of 15% and 10%respectively. Overall, the results presented here show that a significant percent-age of time and energy (an average of 35% of the total consumed energy acrosssimulated Java CDC benchmarks) is devoted to the virtual machine.
We can group everything not covered by the JITted component as energy con-sumed by the JVM. This grouping would tell us how much energy goes into theactual execution of the Java application and how much energy is consumed bythe virtual machine and associated support functions. This is done in Figure 14.Figure 14 shows JVM power consumption and JITted power behavior for the REX
ACM Transactions on Embedded Computing Systems, Vol. V, No. N, Month 2006.
20 · G. Contreras et al.
0
50
100
150
200
250
300
0 1000 2000 3000 4000 5000 6000
Time (sec)
Po
wer
(m
W)
0 1 2 3 4 5 6
(a)
@R
GC Call
�
GC Call
0
50
100
150
200
250
300
0 1000 2000 3000 4000 5000 6000
Time (sec)
Po
wer
(m
W)
0 1 2 3 4 5 6
(b)
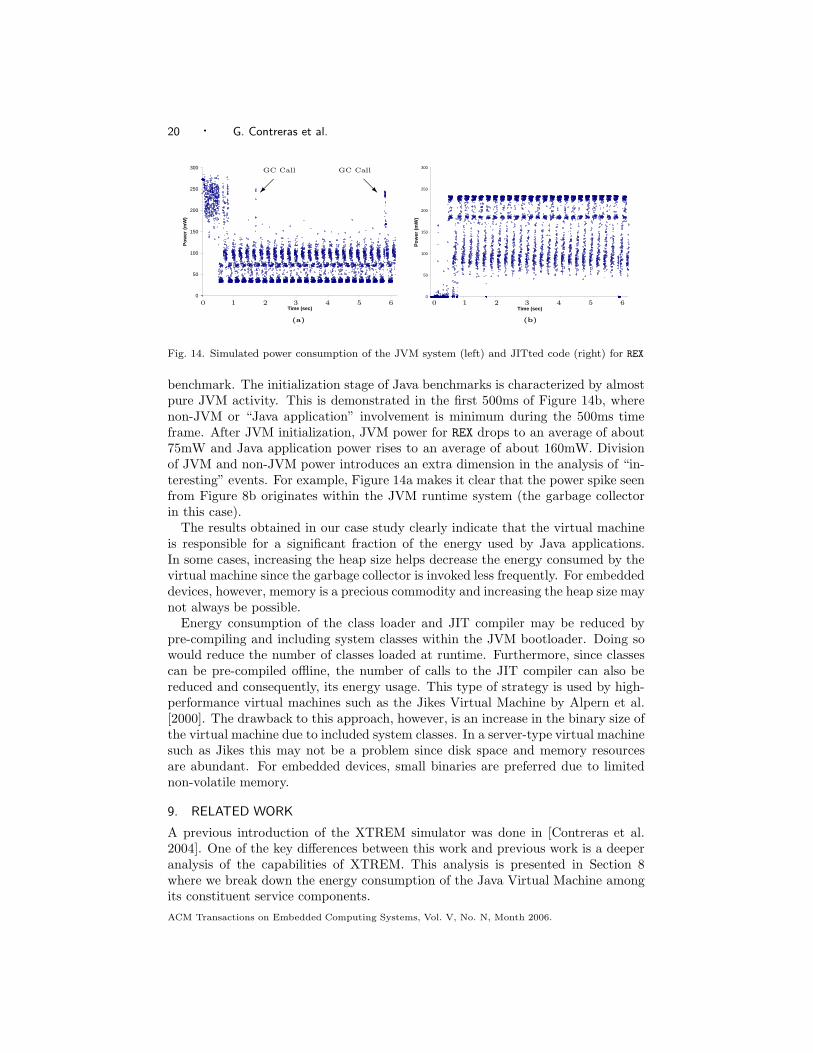
Fig. 14. Simulated power consumption of the JVM system (left) and JITted code (right) for REX
benchmark. The initialization stage of Java benchmarks is characterized by almostpure JVM activity. This is demonstrated in the first 500ms of Figure 14b, wherenon-JVM or “Java application” involvement is minimum during the 500ms timeframe. After JVM initialization, JVM power for REX drops to an average of about75mW and Java application power rises to an average of about 160mW. Divisionof JVM and non-JVM power introduces an extra dimension in the analysis of “in-teresting” events. For example, Figure 14a makes it clear that the power spike seenfrom Figure 8b originates within the JVM runtime system (the garbage collectorin this case).
The results obtained in our case study clearly indicate that the virtual machineis responsible for a significant fraction of the energy used by Java applications.In some cases, increasing the heap size helps decrease the energy consumed by thevirtual machine since the garbage collector is invoked less frequently. For embeddeddevices, however, memory is a precious commodity and increasing the heap size maynot always be possible.
Energy consumption of the class loader and JIT compiler may be reduced bypre-compiling and including system classes within the JVM bootloader. Doing sowould reduce the number of classes loaded at runtime. Furthermore, since classescan be pre-compiled offline, the number of calls to the JIT compiler can also bereduced and consequently, its energy usage. This type of strategy is used by high-performance virtual machines such as the Jikes Virtual Machine by Alpern et al.[2000]. The drawback to this approach, however, is an increase in the binary size ofthe virtual machine due to included system classes. In a server-type virtual machinesuch as Jikes this may not be a problem since disk space and memory resourcesare abundant. For embedded devices, small binaries are preferred due to limitednon-volatile memory.
9. RELATED WORK
A previous introduction of the XTREM simulator was done in [Contreras et al.2004]. One of the key differences between this work and previous work is a deeperanalysis of the capabilities of XTREM. This analysis is presented in Section 8where we break down the energy consumption of the Java Virtual Machine amongits constituent service components.
ACM Transactions on Embedded Computing Systems, Vol. V, No. N, Month 2006.
The XTREM Power and Performance Simulator for the Intel XScale Core · 21
Previous research in the area of power consumption for Java systems has beendone by Farkas et al. [2000]. For this work the authors use a hardware-basedapproach in the study of power behavior for Java applications. They analyze thepower consumption of Itsy, a pocket computer developed by Compaq based on theStrongARM SA-1100 processor. The study performs live measurements of powerconsumption for various applications running on the Itsy pocket computer. Theyalso present initial data on Java features such as preloading Java classes, JIT vsnon-JIT compilation and multi-JVM support.
Many studies have focused on simulation techniques for power estimation. Wattchby Brooks et al. [2000] and SimplePower by Vijaykrishnan [2000] are two infrastruc-tures used to study energy and performance efficiency of microprocessors. Wattchuses mathematical equations to model the effective capacitance of functional units.This flexible tool has been used to estimate power consumption of high-performancemicroprocessors such as the Pentium Pro, the MIPS R10K and the Alpha 21264.SimplePower is another high-level tool used in the study of system-energy esti-mation and compiler optimizations effects on the processor’s power consumption.Power models for this work are based on analytical power models and energy tablesthat capture data switching activity.
Research studies using hardware-based measuring techniques have also proven tobe very efficient in modeling complex architectures. Isci and Martonosi [2003] usereal-hardware power measurements along with functional unit utilization heuristicsderived from hardware performance counters to construct analytical power modelsfor a Pentium 4 processor. Contreras and Martonosi [2005] describe a linear powermodel based on hardware performance counters to estimate the power consumptionof the PXA255 processor and associated external memory. While this approach canyield fast power consumption estimates, its accuracy is bounded by the amount ofraw performance that hardware performance counters are able to expose: Appli-cations with a large number of multiply instructions and/or diverse activity fac-tors, for example, experience high estimation errors since performance counters arenot able to track these events. In contrast, XTREM is able to model the entirepipeline of the core down to the functional unit level while taking activity factorsinto account. Chang et al. [2000] perform cycle-accurate energy characterizationusing the ARM7TDMI microprocessor. For this work, fast energy characterizationof hardware is possible using hardware measurement techniques involving charge-transfer measurements. A multidimensional energy characterization is done on theARM7TDMI processor based on seven energy-sensitive microprocessor factors.
Accurate power modeling for the Intel XScale core requires a more specific hard-ware description than the approach employed by previous simulation-based tools.XTREM differs from previous work in various ways. First, XTREM is intended tomodel a specific microarchitecture family. While many of the core’s configurationparameters are still user-specified (cache sizes, BTB entries, TLB size), the pipelinestructure modeled by XTREM has been designed to closely match the microarchi-tecture of the Intel XScale core, exposing very detail levels of functional unit usage.This provides added performance accuracy over currently existing tools. Second,XTREM has been validated against real hardware using physical power measure-ments, hardware performance counters and stress kernels, which makes XTREM
ACM Transactions on Embedded Computing Systems, Vol. V, No. N, Month 2006.
22 · G. Contreras et al.
a reliable performance/power estimation tool for XScale-based systems. Last, in-creasing popularity for Java-supported devices motivated us to design XTREM tosupport both C and Java applications. Other tools just focus on C benchmarksand do not support a unified power and performance Java runtime system researchenvironment.
10. FUTURE WORK
Future work for this study includes extending XTREM to support different voltageand frequency settings to more accurately describe the capabilities of Intel XScaletechnology cores. With this we hope to investigate ways of reducing energy con-sumption of JVM components such as the class loader, the garbage collector andthe JIT compiler.
Furthermore we would like to include a run-time, phase-detection mechanism toour simulator infrastructure. This mechanism would be based on simulated hard-ware performance counters (HPCs) and would provide a way for detecting andpredicting characteristic program execution phases. Such phase-detection mecha-nism, along with run-time power estimation, can potentially lead to sophisticatedand accurate dynamic voltage and frequency algorithms (DVFS) for processors withsupport for DVFS and HPCs.
11. SUMMARY
This paper has introduced XTREM, a high-level functional power simulator tailoredfor the Intel XScale core. XTREM has been validated using hardware performancecounters and real-hardware power measurements. We have presented simulatedpower results for five MiBench benchmarks and four CLDC Java benchmarks, re-porting an average performance error of 6.5% and an average power estimationerror of 4%. XTREM is capable of quantifying power requirements for the JVMand non-JVM sections of Java applications, giving software engineers and extradimension in power analysis. This paper has described how XTREM can helpidentify “power-hungry” functional units by providing a breakdown of power con-sumption and how bit-switching activity within the Intel XScale core can producepower swings as large as 50mW for a 200Mhz processor.
The research presented here has provided the tools to obtain a broad and com-prehensive view of how modern embedded systems work. Our approach employsa data acquisition methodology consisting of physical power measurements, hard-ware performance counter statistics and simulation results. This study has focusedon Java, C-based embedded and stressmark applications targeted for Intel XScaleTechnology-based systems. Our case study has focused on analyzing the power con-sumption of the various software components in a Java runtime system, showingthat the virtual machine itself can consume up to 35% of the total utilized energy ofJava CDC applications. We feel XTREM offers a useful step forward for compilerand embedded software designers as it promises to help explore a broader designspace targeted for low energy consumption and high performance.
REFERENCES
Alpern, B., Attanasio, C. R., et al. 2000. The Jalapeno Virual Machine. IBM System Jour-nal 39, 1.
ACM Transactions on Embedded Computing Systems, Vol. V, No. N, Month 2006.

The XTREM Power and Performance Simulator for the Intel XScale Core · 23
Brooks, D., Tiwari, V., and Martonosi, M. 2000. Wattch: A Framework for Architectural-
Level Power Analysis and Optimizations. In Proceedings of the 27th International Symposiumon Computer Architecture.
Chang, N., Kim, K., and Lee, H. G. 2000. Cycle-Accurate Energy Measurement and Charac-terization With a Case Study of the ARM7TDMI. In IEEE Transactions on Very Large ScaleIntegration (VLSI) Systems.
Clark, L., Hoffman, E., Miller, J., Biyani, M., Liao, L., Strazdus, S., Morrow, M., Ve-
larde, K., and Yarch, M. 2001. An Embedded 32-b Microprocessor Core for Low-Power andHigh-Performance Applications. Solid-State Circuits, IEEE Journal of 36, 11 (November),
1599–1608.
Contreras, G. and Martonosi, M. 2005. Power Prediction for Intel XScale Processors UsingPerformance Monitoring Unit Events. In Proceedings from the International Symposium onLow-Power Electronics and Design.
Contreras, G., Martonosi, M., Peng, J., Ju, R., and Lueh, G.-Y. 2004. XTREM: A PowerSimulator for the Intel XScale Core. In Proceedings from the 2004 Conference on Languages,Compilers, and Tools for Embedded Systems (LCTES’02).
Embedded Microprocessor Benchmark Consortium. 2003. EEMBC Benchmarks for the Java2 Micro Edition (J2ME) Platform. http://www.eembc.org.
Farkas, K. I., Flinn, J., Back, G., Grunwald, D., and Anderson, J.-A. M. 2000. Quantifyingthe Energy Consumption of a Pocket Computer and a Java Virtual Machine. In Measurementand Modeling of Computer Systems. 252–263.
FM Software. 2004. GIF Picture Decoder. http://www.fmsware.com/stuff/gif.html.
Guthaus, M. R. et al. 2001. MiBench: A free, Commercially Representative Embedded Bench-mark Suite. IEEE 4th Annual Workshop on Workload Characterization,.
Intel Corporation 2000. Intel XScale Core: Developer’s Manual. Intel Corporation. Order No.273473-001.
Intel Corporation 2003a. Intel DBPXA255 Development Platform for the Intel Personal InternetClient Architecture. Intel Corporation. Order No. 278701-001.
Intel Corporation 2003b. Intel XScale Microarchitecture for the PXA255 Processor: User’s Man-ual. Intel Corporation. Order No. 278796.
Isci, C. and Martonosi, M. 2003. Runtime Power Monitoring using High-End Processors:Methodology and Empirical Data. In Proceedings from the 36th Annual IEEE/ACM Interna-tional Symposium on Microarchitecture (MICRO-36). 93–104.
Jean-loup Gailly and Mark Adler. 2004. Zlib Java Implementation.http://www.jcraft.com/jzlib.
Krishnaswamy, A. and Gupta, R. 2002. Profile Guided Selection of ARM and Thumb In-structions. In ACM SIGPLAN Conference on Languages, Compilers, and Tools for EmbeddedSystems (LCTES’02).
Legion of the Bouncy Castle. 2004. Bouncy Castle Crypto 1.18.http://www.bouncycastle.org/.
Liao, Y. and Roberts, D. 2002. A High-Performance and Low-Power 32-bit Multiply-AccumulateUnit with Single-Instruction-Multiple-Data (SIMD) Feature. Solid-State Circuits, IEEE Jour-nal of 37, 7 (July), 926–931.
M. Levy. 2002. Exploring the ARM1026EJ-S Pipeline: Extensive Architectural Modeling High-lights Frequency and IPC Tradeoffs. http://www.arm.com/miscPDFs/1752.pdf.
Standard Performance Evaluation Corporation. 1998. Spec JVM Client98.http://www.specbench.org/jvm98/jvm98/doc/benchmarks/index.html.
Sun Microsystems 2000. J2ME Building Block For Mobile Devices: White Paper onKVM and the Connected Limited Device Configuration (CLDC). Sun Microsystems.http://java.sun.com/j2me/docs/index.html.
The SimpleScalar-ARM Power Modeling Project. 2004. PowerAnalyzer.http://www.eecs.umich.edu/~panalyzer.
The SimpleScalar Toolset. 2001. SimpleScalar LLC. http://www.simplescalar.com.
ACM Transactions on Embedded Computing Systems, Vol. V, No. N, Month 2006.

24 · G. Contreras et al.
Vijaykrishnan, N. 2000. Energy-Driven Integrated Hardware-Software Optimizations Using Sim-
plePower. In Proceedings of the 27th International Symposium on Computer Architecture.
Vijaykrishnan, N., M. Kandemir, S. K., Tomar, S., Sivasubramaniam, A., and Irwin, M. J.
2001. Energy Behavior of Java Applications from the Memory Perspective. The 1st USENIXJava Virtual Machine Research and Technology Symposium (JVM’01).
Ye, W., Vijaykrishnan, N., Kandemir, M. T., and Irwin, M. J. 2000. The Design and Use ofSimplePower: A Cycle-Accurate Energy Estimation Tool. In Design Automation Conference.340–345.
Zaliva, V. 2004. Java regular expressions. http://www.crocodile.org.
ACM Transactions on Embedded Computing Systems, Vol. V, No. N, Month 2006.