Embed Size (px)
Citation preview

December 19, 2012 8:55 9.75in x 6.5in The World Scientific Handbook of Energy b1394-ch03
Chapter 3
Coal
Thomas Sarkus
National Energy Technology LaboratoryUS Department of Energy, USA
Adrian Radziwon and William Ellis
KeyLogic Systems Inc., USA
This chapter introduces and describes coal as a widely available and versatile energysource that is available in substantial quantities throughout the world. The origins ofcoal deposits are quickly visited, and the ranking of different types of coal by energyand carbon content is presented. The production and chemical analysis of coal frommajor US coalbeds (including representative values for some lignite and anthracite beds)are detailed. World coal resources, reserves, and production levels are discussed for coaltypes. Coal utilization is developed with a detailed focus on the major coal-based elec-trical power production technologies, which includes pulverized coal, fluidized bed, and
gasification technologies. These technologies are presented in detail, including relevantemission control technologies. Carbon dioxide capture is also addressed. Liquefaction ofcoal and other uses of coal are briefly described. The safety and environmental challengesassociated with coal production and its uses are also discussed. Current and projectedusages of coal as well as other energy sources by world region and selected countriesfor electrical power production are presented. Selected internet-based coal informationresources from the US Department of Energy, including the National Energy TechnologyLaboratory (NETL), are referenced for the reader’s use.
1 Introduction
Coal is a rock of sedimentary origin, formed from decomposed and lithified biomassand is utilized widely as an energy resource. Coal is commonly termed a mineralresource, but according to a strict scientific definition, the term “mineral” denotes afixed chemical composition, whereas the composition of coal varies widely. Indeed,coal composition varies so much that samples taken from adjacent parts of thesame coal seam can and do vary significantly in their exact chemical composition.To be more precise, the complex composition of coal may vary both vertically andhorizontally in a given coalbed or coal seam.
11
The
Wor
ld S
cien
tific
Han
dboo
k of
Ene
rgy
Dow
nloa
ded
from
ww
w.w
orld
scie
ntif
ic.c
omby
MC
GIL
L U
NIV
ER
SIT
Y o
n 04
/21/
13. F
or p
erso
nal u
se o
nly.

December 19, 2012 8:55 9.75in x 6.5in The World Scientific Handbook of Energy b1394-ch03
12 T. Sarkus, A. Radziwon and W. Ellis
Biomass → Peat → Lignite → Sub-bituminous Coal → Bituminous Coal → Anthracite (aka Brown
Coal)(aka Hard
Coal)
Fig. 1. Coal ranks (from least mature to most mature).
2 Coal Rank
Coal is most commonly classified by rank. Coal rank increases as heat and pressureare applied over time through geologic processes. Accordingly, the heating value(usually measured in Btu/lb or MJ/kg) tends to increase and volatile compoundstend to decrease with higher rank; however, these are only trends and do not nec-essarily apply in every instance. The ranks of coal are shown in Fig. 1 in order ofascending maturity.
Some experts do not consider peat, let alone biomass, to be a bona fide rank ofcoal but, at a minimum, they represent early precursors of the coalification process.Less mature ranks, such as lignite and sub-bituminous coal, often occur in very thickseams which can be surface mined. To be sure, underground sub-bituminous coalmines are not unknown, but surface mining of sub-bituminous coal is overwhelm-ingly predominant. More mature ranks such as bituminous coal and anthracite usu-ally occur in comparatively thinner seams and, while surface mining is performedin some circumstances, underground mining is commonly utilized to obtain thesehigher heating value coals. Peat, lignite, sub-bituminous coal, and bituminous coalgenerally occur in layers, beds, or seams that are more or less horizontal. However,anthracite undergoes a higher degree of alteration or metamorphism, so anthraciteseams can be inclined sharply, or folded, through geologic processes. The coal rankscan be divided into groups or sub-ranks, listed in Table 1, in descending order ofmaturity.
Table 1: Coal Ranks and Sub-ranks, with Some Defining Parameters.
Coal group Fixed carbon Volatile matterCalorific value
(Btu/lb)
Meta-Anthracite 98%≤ fc vm≤ 2% —Anthracite 92%≤ fc < 98% 2%< vm≤ 8% —Semi-anthracite 86%≤ fc < 92% 8% <vm≤ 14% —Low-volatile bituminous 78%≤ fc < 86% 14% < vm≤ 22% —Medium-volatile bituminous 69%≤ fc < 78% 22% < vm≤ 31% —High-volatile A bituminous fc < 69% 31% < vm 14,000≤ cvHigh-volatile B bituminous — — 13,000≤ cv < 14,000High-volatile C bituminous — — 11,500≤ cv < 13,000Sub-bituminous A — — 10,500≤ cv < 11,500Sub-bituminous B — — 9500≤ cv < 10,500Sub-bituminous C — — 8300≤ cv < 9,500Lignite A — — 6300≤ cv < 8,300Lignite B — — cv < 6,300
Source: Modified from Geological Survey Circular 891, Coal Resource Classification Systemof the US Geological Survey (2003).
The
Wor
ld S
cien
tific
Han
dboo
k of
Ene
rgy
Dow
nloa
ded
from
ww
w.w
orld
scie
ntif
ic.c
omby
MC
GIL
L U
NIV
ER
SIT
Y o
n 04
/21/
13. F
or p
erso
nal u
se o
nly.
December 19, 2012 8:55 9.75in x 6.5in The World Scientific Handbook of Energy b1394-ch03
Coal 13
3 Coal Resources and Geographic Distribution
Coal is distributed broadly across much of the US and similarly around the world.However, many coal deposits are not economical for mining. For example, they maybe too small, too thin, or too deep to mine economically. As technology improves,it may become possible to mine or otherwise utilize (e.g. through well-controlledunderground combustion or gasification) some of these coal deposits. In other cases,coal seams may underlie cities, towns, or sensitive environmental areas.
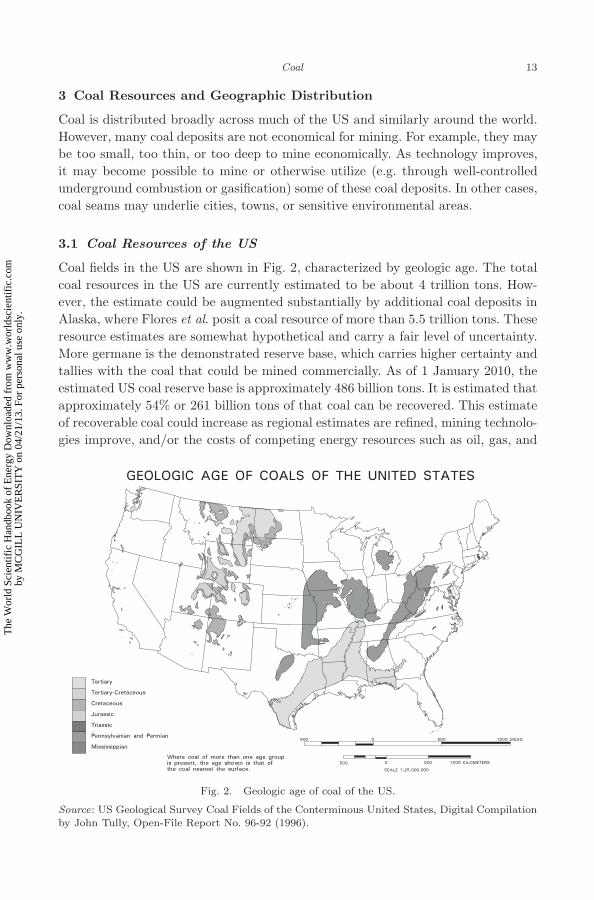
3.1 Coal Resources of the US
Coal fields in the US are shown in Fig. 2, characterized by geologic age. The totalcoal resources in the US are currently estimated to be about 4 trillion tons. How-ever, the estimate could be augmented substantially by additional coal deposits inAlaska, where Flores et al. posit a coal resource of more than 5.5 trillion tons. Theseresource estimates are somewhat hypothetical and carry a fair level of uncertainty.More germane is the demonstrated reserve base, which carries higher certainty andtallies with the coal that could be mined commercially. As of 1 January 2010, theestimated US coal reserve base is approximately 486 billion tons. It is estimated thatapproximately 54% or 261 billion tons of that coal can be recovered. This estimateof recoverable coal could increase as regional estimates are refined, mining technolo-gies improve, and/or the costs of competing energy resources such as oil, gas, and
Fig. 2. Geologic age of coal of the US.
Source: US Geological Survey Coal Fields of the Conterminous United States, Digital Compilationby John Tully, Open-File Report No. 96-92 (1996).
The
Wor
ld S
cien
tific
Han
dboo
k of
Ene
rgy
Dow
nloa
ded
from
ww
w.w
orld
scie
ntif
ic.c
omby
MC
GIL
L U
NIV
ER
SIT
Y o
n 04
/21/
13. F
or p
erso
nal u
se o
nly.

December 19, 2012 8:55 9.75in x 6.5in The World Scientific Handbook of Energy b1394-ch03
14 T. Sarkus, A. Radziwon and W. Ellis
nuclear power increase. Alternatively, it could decrease as coal is mined and utilizedover time, or if environmental restrictions impede the mining and utilization of coal.
3.2 Coal Analyses
Owing partly to its usage in a wide variety of applications over the past two cen-turies, there are numerous formats and techniques for analyzing coal. Two of themost prevalent types of coal analyses are proximate analysis and ultimate analy-sis. Proximate analysis includes fixed carbon, volatile matter, ash, and moisturecontents — all on an as-received basis. Ultimate analysis includes calorific or heat-ing value (on both as received and dry bases), as well as the amounts of carbon,hydrogen, nitrogen, oxygen, and sulfur. Other forms of coal analyses may includeagglomerating or caking tendency, agglutinating or binding tendency, ash fusiontemperature, ash softening temperature, free swelling index, hardgrove grindability,petrography (e.g. maceral contents; macerals are coal portions that can be identifiedwith a petrographic microscope), trace element levels (often expressed as portionsof either the parent coal or the ash fraction of the parent coal), and washability (orsink/float testing).
3.3 US Coal Production and Representative Coal Analyses
Table 2 lists the 10 top-producing bituminous and sub-bituminous coalbeds in theUS, as well as a lignite coalbed in North Dakota, and averages for multiple lignitecoalbeds in Texas and multiple anthracite beds in Pennsylvania.
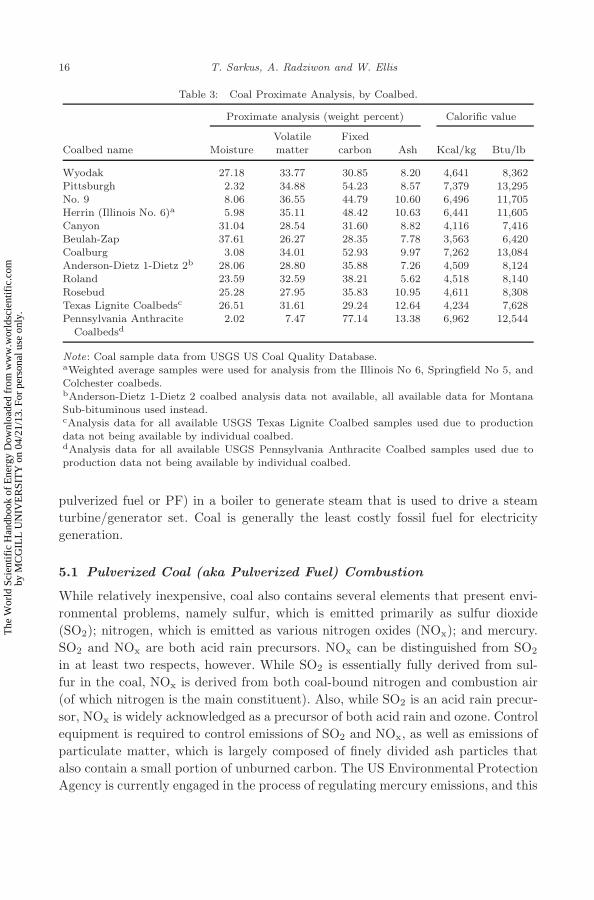
Table 3 illustrates some typical proximate analysis and heating values for thesesame coalbeds (within the US states previously listed in Table 2). These data aremerely for illustrative purposes; readers are reminded that coal quality can varywidely within any given coal seam or coal mine. Table 4 shows ultimate and traceelement analysis by coalbed.
4 Worldwide Coal Resources, Reserves, and Production Levels
Coal resources are significant both domestically and internationally. Exploration andestimation of coal resources do not carry the same level of risk and uncertainty as oiland natural gas exploration. One must, however, exercise caution when discussingresources and reserves (e.g. comparing recoverable coal reserves to recoverable oiland/or natural gas reserves), as the terminology can have rather precise meaning(s).Worldwide recoverable coal reserves, as of 2008, are shown for world regions inTable 5, and for the top 20 countries in Table 6.
The US Energy Information Administration (EIA) defines recoverable coal as“Proved Recoverable Reserves, Coal: Defined by the World Energy Council as thetonnage within the Proved Amount in Place that can be recovered (extractedfrom the earth in raw form) under present and expected local economic condi-tions with existing available technology. It approximates the US term proved (mea-sured) reserves, coal.” These recoverable reserve statistics were drawn from the EIA
The
Wor
ld S
cien
tific
Han
dboo
k of
Ene
rgy
Dow
nloa
ded
from
ww
w.w
orld
scie
ntif
ic.c
omby
MC
GIL
L U
NIV
ER
SIT
Y o
n 04
/21/
13. F
or p
erso
nal u
se o
nly.

December 19, 2012 8:55 9.75in x 6.5in The World Scientific Handbook of Energy b1394-ch03
Coal 15
Table 2: US Coal Production by Selected Coalbeds and Mine Type, 2010.1
Under-ground Surface Total
CoalbedName Coal ranka (Thousand short tons)
Wyodak Sub-bituminous — 382,805 382,805Pittsburgh Bituminous 78,969 5,148 84,116No. 9 Bituminous 40,746 6,212 46,958Herrin (Illinois No. 6) Bituminous 29,018 2,612 31,630Canyon Sub-bituminous — 29,405 29,405Beulah-Zap Lignite — 27,493 27,493Coalburg Bituminous 4,841 16,979 21,819Anderson-Dietz
1-Dietz 2Sub-bituminous — 21,254 21,254
Roland Sub-bituminous — 16,226 16,226Rosebud Sub-bituminous — 15,403 15,403Multiple Texas
Coalbedsb,cLignite — 40,982 40,982
Multiple PennsylvaniaCoalbedsd,e
Anthracite na na 1,705f
Identified CoalbedTotal
153,574 564,519 718,093
U.S. Total 337,155 745,357 1,084,368
Source: Unless otherwise identified, data from Report No: DOE/EIA-0584 (2010), Table 5, Revised:July 3, 2012aData from Report No: DOE/EIA-0584 (2010), Table 6, Revised: July 3, 2012.bProduction data not available by individual coalbed.cData from Report No: DOE/EIA-0584 (2010), Table 6, Revised: July 3, 2012.dProduction data not available by individual coalbed.eData from Report No: DOE/EIA-0584 (2010), Table 6, Revised: July 3, 2012.fProduction of Anthracite not available by mine type.
International Energy Statistics Database. In similar fashion, Tables 7 through 11illustrate coal production by world regions and top 20 countries over the period2006–2010. These production statistics were also drawn from the EIA Interna-tional Energy Statistics Database. The US has the largest coal reserves in theworld. Other nations that have large coal reserves include Russia, China, Australia,and India.
5 Coal Utilization
Historically, coal has served a variety of uses, some of which (e.g. coal-fueled loco-motives, ships, and residential furnaces) have become outmoded given the abun-dance, convenience, and affordability of oil, natural gas and, in the case of at leastsome ships, nuclear energy. Today, the largest use of coal, by far, is to generateelectricity in large central power stations. Approximately one half of all the elec-tricity generated in the US is derived from coal. The most common method of usingcoal to generate electricity is to burn pulverized coal (PC; in Europe it is termed
The
Wor
ld S
cien
tific
Han
dboo
k of
Ene
rgy
Dow
nloa
ded
from
ww
w.w
orld
scie
ntif
ic.c
omby
MC
GIL
L U
NIV
ER
SIT
Y o
n 04
/21/
13. F
or p
erso
nal u
se o
nly.
December 19, 2012 8:55 9.75in x 6.5in The World Scientific Handbook of Energy b1394-ch03
16 T. Sarkus, A. Radziwon and W. Ellis
Table 3: Coal Proximate Analysis, by Coalbed.
Proximate analysis (weight percent) Calorific value
Coalbed name MoistureVolatilematter
Fixedcarbon Ash Kcal/kg Btu/lb
Wyodak 27.18 33.77 30.85 8.20 4,641 8,362Pittsburgh 2.32 34.88 54.23 8.57 7,379 13,295No. 9 8.06 36.55 44.79 10.60 6,496 11,705Herrin (Illinois No. 6)a 5.98 35.11 48.42 10.63 6,441 11,605Canyon 31.04 28.54 31.60 8.82 4,116 7,416Beulah-Zap 37.61 26.27 28.35 7.78 3,563 6,420Coalburg 3.08 34.01 52.93 9.97 7,262 13,084Anderson-Dietz 1-Dietz 2b 28.06 28.80 35.88 7.26 4,509 8,124Roland 23.59 32.59 38.21 5.62 4,518 8,140
Rosebud 25.28 27.95 35.83 10.95 4,611 8,308Texas Lignite Coalbedsc 26.51 31.61 29.24 12.64 4,234 7,628Pennsylvania Anthracite 2.02 7.47 77.14 13.38 6,962 12,544
Coalbedsd
Note: Coal sample data from USGS US Coal Quality Database.aWeighted average samples were used for analysis from the Illinois No 6, Springfield No 5, andColchester coalbeds.bAnderson-Dietz 1-Dietz 2 coalbed analysis data not available, all available data for MontanaSub-bituminous used instead.cAnalysis data for all available USGS Texas Lignite Coalbed samples used due to productiondata not being available by individual coalbed.dAnalysis data for all available USGS Pennsylvania Anthracite Coalbed samples used due toproduction data not being available by individual coalbed.
pulverized fuel or PF) in a boiler to generate steam that is used to drive a steamturbine/generator set. Coal is generally the least costly fossil fuel for electricitygeneration.
5.1 Pulverized Coal (aka Pulverized Fuel) Combustion
While relatively inexpensive, coal also contains several elements that present envi-ronmental problems, namely sulfur, which is emitted primarily as sulfur dioxide(SO2); nitrogen, which is emitted as various nitrogen oxides (NOx); and mercury.SO2 and NOx are both acid rain precursors. NOx can be distinguished from SO2
in at least two respects, however. While SO2 is essentially fully derived from sul-fur in the coal, NOx is derived from both coal-bound nitrogen and combustion air(of which nitrogen is the main constituent). Also, while SO2 is an acid rain precur-sor, NOx is widely acknowledged as a precursor of both acid rain and ozone. Controlequipment is required to control emissions of SO2 and NOx, as well as emissions ofparticulate matter, which is largely composed of finely divided ash particles thatalso contain a small portion of unburned carbon. The US Environmental ProtectionAgency is currently engaged in the process of regulating mercury emissions, and this
The
Wor
ld S
cien
tific
Han
dboo
k of
Ene
rgy
Dow
nloa
ded
from
ww
w.w
orld
scie
ntif
ic.c
omby
MC
GIL
L U
NIV
ER
SIT
Y o
n 04
/21/
13. F
or p
erso
nal u
se o
nly.

December 19, 2012 8:55 9.75in x 6.5in The World Scientific Handbook of Energy b1394-ch03
Coal 17
Table 4: Coal Ultimate and Trace Element Analyses by Coalbed.
Ultimate analysis (percent)
Traceelements(ppm)
Coalbed Name Hydrogen Carbon Nitrogen Oxygen Sulfur Hg
Wyodak 6.51 48.01 0.92 35.74 0.64 0.15Pittsburgh 5.27 74.09 1.52 8.50 2.02 0.21No. 9 5.37 64.46 1.33 14.29 3.94 0.07Herrin (Illinois No. 6)a 5.12 65.14 1.17 14.60 3.48 0.09Canyon 6.00 43.95 0.74 39.88 0.62 0.10Beulah-Zap 6.78 38.76 0.56 45.28 0.85 0.14Coalburg 5.12 73.34 1.37 9.41 0.79 0.06Anderson-Dietz 6.31 47.65 0.86 37.01 0.72 0.08
1-Dietz 2b
Roland 5.00 47.20 1.40 40.50 0.78 0.08Rosebud 6.13 48.00 0.73 32.35 1.85 0.10Texas Lignite Coalbedsc 6.14 44.27 0.80 35.15 1.15 0.19Pennsylvania Anthracite 2.55 78.21 0.85 4.12 0.89 0.18
Coalbedsd
Note: Coal sample data from USGS US Coal Quality Database.aWeighted average samples were used for analysis from the Illinois No 6, Springfield No 5, andColchester coalbeds.bAnderson-Dietz 1-Dietz 2 coalbed analysis data not available, all available data for MontanaSub-bituminous used instead.cAnalysis data for all available USGS Texas Lignite Coalbed samples used due to productiondata not being available by individual coalbed.dAnalysis data for all available USGS Pennsylvania Anthracite Coalbed samples used due to
production data not being available by individual coalbed.
Table 5: Recoverable Total Coal Reserves, by Regiona (Million Short Tons), 2008.
Anthracite andbituminousb Lignite Total
Reserves (region) Coal reserves (Million short tons)
Asia & Oceania 175,627 117,415 293,042North America 123,912 145,431 269,343Eurasia 95,598 155,767 251,364Europe 6,906 77,296 84,202Africa 34,743 192 34,934Central & South America 7,595 6,193 13,788Middle East 1,326 0 1,326
Total 445,706 502,293 948,000
Source: EIA International Energy Statistics Database.aTotals may not be exact due to independent rounding.bIncludes sub-bituminous.
The
Wor
ld S
cien
tific
Han
dboo
k of
Ene
rgy
Dow
nloa
ded
from
ww
w.w
orld
scie
ntif
ic.c
omby
MC
GIL
L U
NIV
ER
SIT
Y o
n 04
/21/
13. F
or p
erso
nal u
se o
nly.
December 19, 2012 8:55 9.75in x 6.5in The World Scientific Handbook of Energy b1394-ch03
18 T. Sarkus, A. Radziwon and W. Ellis
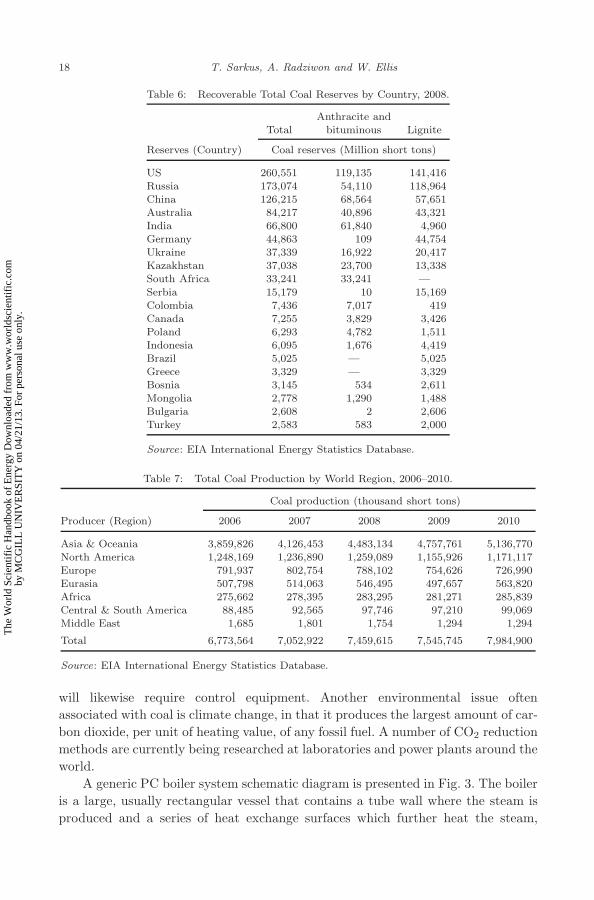
Table 6: Recoverable Total Coal Reserves by Country, 2008.
TotalAnthracite and
bituminous Lignite
Reserves (Country) Coal reserves (Million short tons)
US 260,551 119,135 141,416Russia 173,074 54,110 118,964China 126,215 68,564 57,651Australia 84,217 40,896 43,321India 66,800 61,840 4,960Germany 44,863 109 44,754Ukraine 37,339 16,922 20,417Kazakhstan 37,038 23,700 13,338South Africa 33,241 33,241 —
Serbia 15,179 10 15,169Colombia 7,436 7,017 419Canada 7,255 3,829 3,426Poland 6,293 4,782 1,511Indonesia 6,095 1,676 4,419Brazil 5,025 — 5,025Greece 3,329 — 3,329Bosnia 3,145 534 2,611Mongolia 2,778 1,290 1,488Bulgaria 2,608 2 2,606Turkey 2,583 583 2,000
Source: EIA International Energy Statistics Database.
Table 7: Total Coal Production by World Region, 2006–2010.
Coal production (thousand short tons)
Producer (Region) 2006 2007 2008 2009 2010
Asia & Oceania 3,859,826 4,126,453 4,483,134 4,757,761 5,136,770North America 1,248,169 1,236,890 1,259,089 1,155,926 1,171,117Europe 791,937 802,754 788,102 754,626 726,990Eurasia 507,798 514,063 546,495 497,657 563,820Africa 275,662 278,395 283,295 281,271 285,839Central & South America 88,485 92,565 97,746 97,210 99,069Middle East 1,685 1,801 1,754 1,294 1,294
Total 6,773,564 7,052,922 7,459,615 7,545,745 7,984,900
Source: EIA International Energy Statistics Database.
will likewise require control equipment. Another environmental issue oftenassociated with coal is climate change, in that it produces the largest amount of car-bon dioxide, per unit of heating value, of any fossil fuel. A number of CO2 reductionmethods are currently being researched at laboratories and power plants around theworld.
A generic PC boiler system schematic diagram is presented in Fig. 3. The boileris a large, usually rectangular vessel that contains a tube wall where the steam isproduced and a series of heat exchange surfaces which further heat the steam,
The
Wor
ld S
cien
tific
Han
dboo
k of
Ene
rgy
Dow
nloa
ded
from
ww
w.w
orld
scie
ntif
ic.c
omby
MC
GIL
L U
NIV
ER
SIT
Y o
n 04
/21/
13. F
or p
erso
nal u
se o
nly.

December 19, 2012 8:55 9.75in x 6.5in The World Scientific Handbook of Energy b1394-ch03
Coal 19
Table 8: Total Coal Production by Country, 2005–2009.
Coal production (thousand short tons)
Producer (Country) 2006 2007 2008 2009 2010
China 2,573,897 2,746,303 3,048,536 3,226,094 3,522,973US 1,162,750 1,146,635 1,171,809 1,074,923 1,085,281India 500,193 531,521 568,448 613,402 622,818Australia 405,047 430,104 431,453 444,101 463,256Indonesia 249,700 287,227 301,587 332,372 370,379Russia 313,680 318,591 336,163 304,228 357,043South Africa 269,817 273,005 278,017 276,219 280,788Germany 220,554 225,526 214,268 202,410 200,955Poland 171,135 159,773 157,993 148,356 146,237Kazakhstan 106,555 107,837 122,437 111,173 122,135Colombia 72,307 77,054 81,022 80,256 81,957Turkey 70,829 83,075 87,526 87,633 79,090Canada 72,757 76,461 74,680 69,375 74,840Greece 71,415 73,092 72,444 71,532 62,303Czech Republic 69,339 69,033 66,359 62,189 60,941Ukraine 67,981 64,954 65,729 60,645 60,117Vietnam 42,891 46,899 44,785 48,443 49,233Serbia 40,543 40,949 42,669 42,438 41,169Korea, North 38,698 33,442 35,641 34,785 34,785Romania 38,496 39,441 39,530 37,436 33,985
Note: EIA International Energy Statistics Database.
Table 9: Bituminous Coal Production by Country, 2006–2010.
Bituminous coal production (thousand short tons)
Producer (Country) 2006 2007 2008 2009 2010
China 1,985,981 2,147,264 2,383,624 2,519,422 2,751,709US 1,076,964 1,066,482 1,094,413 1,000,524 1,010,165India 465,707 494,065 532,710 575,845 586,348Australia 329,095 356,895 358,446 368,710 388,356Indonesia 246,458 282,511 293,425 324,108 360,845South Africa 268,071 270,416 275,584 273,402 277,925Russia 222,808 230,621 238,153 221,545 265,381Kazakhstan 101,424 103,020 117,171 105,568 115,980Poland 104,066 96,349 92,220 85,405 83,945
Colombia 72,307 77,054 81,022 80,256 81,957Canada 61,249 64,841 63,746 57,746 63,526Ukraine 49,806 51,836 52,309 48,824 48,288Vietnam 39,608 44,187 42,798 46,455 47,201Korea, North 27,205 22,179 24,771 23,810 23,810United Kingdom 18,309 16,896 17,986 17,756 18,372Mongolia 2,708 3,602 4,594 7,820 18,253Czech Republic 14,754 14,213 13,959 12,127 12,605Germany 24,008 24,470 18,920 13,090 12,050Mexico 12,662 13,794 12,599 11,627 10,996Venezuela 8,676 8,429 8,429 9,692 9,692
Note: EIA International Energy Statistics Database.
The
Wor
ld S
cien
tific
Han
dboo
k of
Ene
rgy
Dow
nloa
ded
from
ww
w.w
orld
scie
ntif
ic.c
omby
MC
GIL
L U
NIV
ER
SIT
Y o
n 04
/21/
13. F
or p
erso
nal u
se o
nly.

December 19, 2012 8:55 9.75in x 6.5in The World Scientific Handbook of Energy b1394-ch03
20 T. Sarkus, A. Radziwon and W. Ellis
Table 10: Anthracite Production by Country, 2006–2010.
Anthracite coal production (thousand short tons)
Producer (Country) 2006 2007 2008 2009 2010
China 487,255 491,657 546,352 577,526 630,754Ukraine 17,919 12,912 13,240 11,778 11,664Russia 9,138 9,548 7,036 6,612 7,920Spain 4,168 3,842 3,474 4,476 3,538Korea, North 2,734 4,123 2,895 3,309 3,309South Africa 1,746 2,589 2,433 2,818 2,864Korea, South 3,113 3,181 3,057 2,777 2,297Germany 2,185 2,189 2,099 2,084 2,169Vietnam 3,283 2,712 1,986 1,989 2,032United States 1,538 1,568 1,712 1,921 1,940
United Kingdom 1,619 1,336 1,419 1,396 1,268Australia 1,284 883 218 157 797Swaziland 20 20 20 20 20
Note: EIA International Energy Statistics Database.
Table 11: Lignite Production by Country, 2006–2010.
Lignite coal production (thousand short tons)
Producer (Country) 2006 2007 2008 2009 2010
Germany 194,361 198,867 193,250 187,235 186,735China 100,661 107,382 118,560 129,146 140,511Russia 81,734 78,422 90,974 76,072 83,741Turkey 67,775 79,500 83,964 83,309 74,978Australia 74,667 72,326 72,789 75,235 74,103United States 84,248 78,585 75,684 72,479 73,177Greece 71,415 73,092 72,444 71,532 62,303Poland 67,069 63,425 65,773 62,951 62,292Czech Republic 54,584 54,820 52,401 50,063 48,336Serbia 40,507 40,940 42,662 42,429 41,160India 34,486 37,457 35,738 37,557 36,470Romania 38,496 39,441 39,530 37,436 33,985Bulgaria 28,275 31,325 31,689 29,926 32,303
Thailand 21,022 20,105 20,157 19,606 20,346Estonia 15,537 18,237 17,766 16,467 19,769Canada 11,508 11,619 10,935 11,629 11,314Hungary 10,970 10,822 10,366 9,905 10,006Mongolia 6,192 6,581 6,507 8,101 9,578Indonesia 3,242 4,716 8,162 8,264 9,534Korea, North 8,759 7,141 7,975 7,665 7,665
Note: EIA International Energy Statistics Database.
first by radiant heat transfer then by convective heat transfer. As the combustionproducts approach the exit of the boiler they pass through the economizer whichpreheats the boiler feed-water and finally the air heater which preheats the com-bustion air.
The
Wor
ld S
cien
tific
Han
dboo
k of
Ene
rgy
Dow
nloa
ded
from
ww
w.w
orld
scie
ntif
ic.c
omby
MC
GIL
L U
NIV
ER
SIT
Y o
n 04
/21/
13. F
or p
erso
nal u
se o
nly.

December 19, 2012 8:55 9.75in x 6.5in The World Scientific Handbook of Energy b1394-ch03
Coal 21
Coal
Air
Flue-GasDesulfurization
Coal-firedBoiler
Particulate
Gypsum
Stack
MercurySorbentInjection
BottomAsh
Flyash
Electric PowerSteam TurbineGenerator Set
Steam
Flue Gas
Removal
Fig. 3. Pulverized coal fired boiler system.
As-received coal is first crushed to effect some level of size reduction and fed tomills which pulverize the coal to the proper size for use in the boiler — typically70% passing through a 200-mesh screen (i.e. less than 0.074mm). Air is fed to themills to carry the coal into the boiler through an array of burners.
Additional air is fed to the burners to complete the combustion process. Theburners are commonly mounted either on the walls of the boiler (wall-fired) oron the corners (tangentially fired). The latter are aimed slightly off the center ofthe boiler to impart a swirling motion to the flame, thus increasing the mixing ofthe air and coal. There is a variety of combustion practices designed to minimizeNOx formation in the boiler. High flame temperatures enhance NOx formation (i.e.thermal NOx). Most modern burners are low-NOx burners that prolong the mixingof the air and fuel to minimize NOx formation by lowering flame temperature.Some low-NOx firing systems add insufficient (sub-stoichiometric) air at the burnerto complete combustion while the required air (over-fire air) is added above theburners after the flame has cooled somewhat. Another technique to reduce NOx
is to add ammonia or urea to the boiler where the flue gas is at the appropriatetemperature (1600◦F to 2100◦F) for the NOx to react with the reagent to formmolecular nitrogen and water vapor. This technique is known as Selective Non-Catalytic Reduction (SNCR). The flue gas can also be routed to a catalyst bedbetween the economizer and air heater, where the NOx is catalytically reacted withammonia to produce nitrogen and water vapor. This technique is referred to asSelective Catalytic Reduction (SCR). In order to achieve the desired level of NOx
reduction, two or three of these NOx control methods are often used together.Low-NOx burners typically reduce NOX by 40% to 60%, somewhat higher if
used with overfire air. SNCR is generally able to effect a NOX reduction of 30%to 75%, while SCR can achieve reductions ranging from about 70% to over 90%.
The
Wor
ld S
cien
tific
Han
dboo
k of
Ene
rgy
Dow
nloa
ded
from
ww
w.w
orld
scie
ntif
ic.c
omby
MC
GIL
L U
NIV
ER
SIT
Y o
n 04
/21/
13. F
or p
erso
nal u
se o
nly.
December 19, 2012 8:55 9.75in x 6.5in The World Scientific Handbook of Energy b1394-ch03
22 T. Sarkus, A. Radziwon and W. Ellis
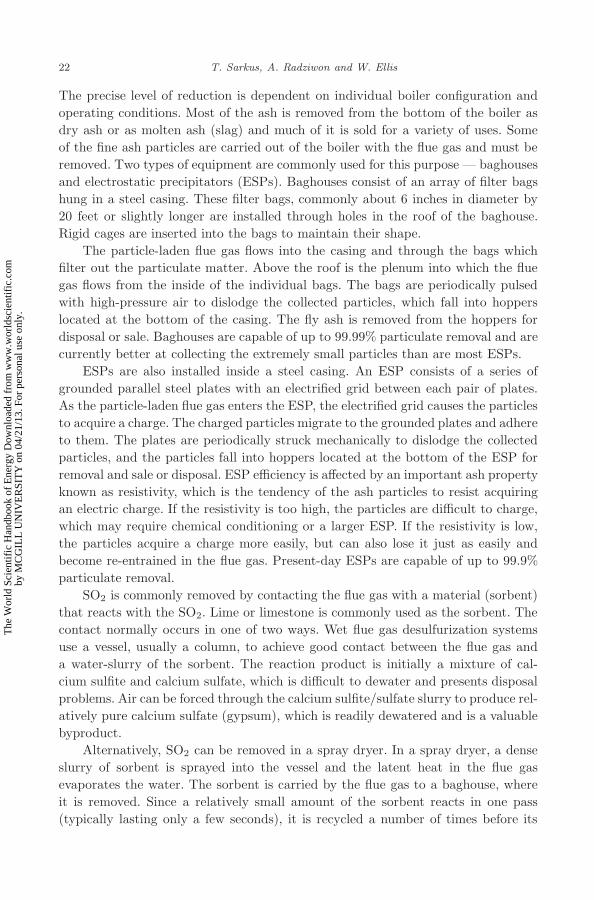
The precise level of reduction is dependent on individual boiler configuration andoperating conditions. Most of the ash is removed from the bottom of the boiler asdry ash or as molten ash (slag) and much of it is sold for a variety of uses. Someof the fine ash particles are carried out of the boiler with the flue gas and must beremoved. Two types of equipment are commonly used for this purpose — baghousesand electrostatic precipitators (ESPs). Baghouses consist of an array of filter bagshung in a steel casing. These filter bags, commonly about 6 inches in diameter by20 feet or slightly longer are installed through holes in the roof of the baghouse.Rigid cages are inserted into the bags to maintain their shape.
The particle-laden flue gas flows into the casing and through the bags whichfilter out the particulate matter. Above the roof is the plenum into which the fluegas flows from the inside of the individual bags. The bags are periodically pulsedwith high-pressure air to dislodge the collected particles, which fall into hopperslocated at the bottom of the casing. The fly ash is removed from the hoppers fordisposal or sale. Baghouses are capable of up to 99.99% particulate removal and arecurrently better at collecting the extremely small particles than are most ESPs.
ESPs are also installed inside a steel casing. An ESP consists of a series ofgrounded parallel steel plates with an electrified grid between each pair of plates.As the particle-laden flue gas enters the ESP, the electrified grid causes the particlesto acquire a charge. The charged particles migrate to the grounded plates and adhereto them. The plates are periodically struck mechanically to dislodge the collectedparticles, and the particles fall into hoppers located at the bottom of the ESP forremoval and sale or disposal. ESP efficiency is affected by an important ash propertyknown as resistivity, which is the tendency of the ash particles to resist acquiringan electric charge. If the resistivity is too high, the particles are difficult to charge,which may require chemical conditioning or a larger ESP. If the resistivity is low,the particles acquire a charge more easily, but can also lose it just as easily andbecome re-entrained in the flue gas. Present-day ESPs are capable of up to 99.9%particulate removal.
SO2 is commonly removed by contacting the flue gas with a material (sorbent)that reacts with the SO2. Lime or limestone is commonly used as the sorbent. Thecontact normally occurs in one of two ways. Wet flue gas desulfurization systemsuse a vessel, usually a column, to achieve good contact between the flue gas anda water-slurry of the sorbent. The reaction product is initially a mixture of cal-cium sulfite and calcium sulfate, which is difficult to dewater and presents disposalproblems. Air can be forced through the calcium sulfite/sulfate slurry to produce rel-atively pure calcium sulfate (gypsum), which is readily dewatered and is a valuablebyproduct.
Alternatively, SO2 can be removed in a spray dryer. In a spray dryer, a denseslurry of sorbent is sprayed into the vessel and the latent heat in the flue gasevaporates the water. The sorbent is carried by the flue gas to a baghouse, whereit is removed. Since a relatively small amount of the sorbent reacts in one pass(typically lasting only a few seconds), it is recycled a number of times before its
The
Wor
ld S
cien
tific
Han
dboo
k of
Ene
rgy
Dow
nloa
ded
from
ww
w.w
orld
scie
ntif
ic.c
omby
MC
GIL
L U
NIV
ER
SIT
Y o
n 04
/21/
13. F
or p
erso
nal u
se o
nly.
December 19, 2012 8:55 9.75in x 6.5in The World Scientific Handbook of Energy b1394-ch03
Coal 23
disposal. In retrofit applications, an existing ESP can be retained for the fly ashcollection. If mercury removal is required, powdered activated carbon can be injectedupstream of a baghouse or Flue Gas Desulphurization (FGD) system. If injectedupstream of an ESP, the carbon is less readily captured due to its low resistivity.FGD systems capture some portion of the incoming mercury, and separate mercuryremoval equipment may not always be needed. In general, spray dryers are moreeffective for mercury capture than wet FGD systems. The vast majority of ESPs oncoal-based systems are dry ESPs. While wet ESPs are more efficient at capturingvery small particles such as fume, they are seldom used in utilities due to corrosionproblems when used with flue gas.
CO2 can be removed from the flue gas by contact with a material that absorbsCO2, such as an amine. The CO2 can then be separated from the amine, dried,compressed, and sent to an end use such as enhanced oil recovery or to a seques-tration site. Due to the large volume of flue gas to be handled, primarily due tothe nitrogen in the combustion air, such a process is expensive and requires sub-stantial energy. A process that eliminates the need for handling these large volumesis oxy-combustion. An air separation unit (ASU) provides nearly pure oxygen forcombustion, resulting in a flue gas that is predominantly CO2. A portion of the fluegas is cooled and mixed with the oxygen to avoid excessive boiler temperatures.The rest can be used or sequestered geologically.
Power plants are classified as subcritical, supercritical, or ultra-supercriticalbased on the temperature and pressure of the steam. The critical point of water is705.4◦F and 3206.2 pounds per square inch absolute (psia). At and above these con-ditions, the vapor and liquid states of water are indistinguishable. From a practicalstandpoint, the pressure determines whether the boiler is sub-critical or supercriti-cal since it is desirable to operate at the highest temperature/pressure practical forbetter efficiency. Construction materials generally limit operating temperatures toaround 1100◦F. While there are no set operating conditions, sub-critical boilers oftenoperate at 2,500 psia, supercritical boilers around 3,500 psia, and ultra-supercriticalboilers at significantly higher pressures. While efficiency improves with higher tem-peratures and pressures, cost/efficiency tradeoffs are required. The plant is alsomore prone to equipment/material and operational issues as operating conditionsbecome more extreme.
5.2 Fluidized Bed Combustion
A second type of coal-fired boiler that is finding increased application is the fluidizedbed combustion (FBC) boiler. It offers several potential advantages over the PCboiler. For example, much of the SO2 is removed within the boiler itself by injectinglimestone into the boiler, thus eliminating or greatly reducing the need for a separateFGD system. It operates at substantially lower temperatures (e.g. 1500–1700◦Fversus 2200◦F–2300◦F for PC combustion), thus nearly eliminating thermal NOX
formation. If the amount of NOX remaining still presents a problem, only a polishingNOX destruction system is needed. Another advantage is that the FBC boiler can
The
Wor
ld S
cien
tific
Han
dboo
k of
Ene
rgy
Dow
nloa
ded
from
ww
w.w
orld
scie
ntif
ic.c
omby
MC
GIL
L U
NIV
ER
SIT
Y o
n 04
/21/
13. F
or p
erso
nal u
se o
nly.

December 19, 2012 8:55 9.75in x 6.5in The World Scientific Handbook of Energy b1394-ch03
24 T. Sarkus, A. Radziwon and W. Ellis
burn a wide variety of properly sized solid fuels, allowing the operator to takeadvantage of lower priced/waste fuels such as waste coal or petroleum coke whereavailable. In several regions that have long been major coal producers, there arenumerous waste piles that still contain significant amounts of coal. These piles oftenpose environmental problems due to acid drainage. Waste coal from these piles canbe burned in an FBC; however, it may or may not require some “fresh” coal asa supplemental fuel. Since the ash/limestone waste from the FBC contains someunreacted limestone, FBC waste can be used to mitigate acid mine drainage at thefuel supply source. Figure 4 shows a typical FBC arrangement.
FBC boilers can operate at atmospheric or elevated pressure, with the atmo-spheric systems heavily dominating the existing fleet. There are basically two typesof atmospheric pressure fluidized bed boilers — bubbling bed and circulating bed.In both, air is injected into the bottom of a bed consisting of coal, lime, and ash.The bubbling version has a lower air flow so that the air essentially bubbles upthrough the bed, keeping it stirred while oxidizing the coal. In the circulating flu-idized bed (CFB), the air flow is somewhat higher so that the bed is expanded andthe particles separated, but still slow enough that the entire bed is not lifted out ofthe combustor. The circulating fluid bed is most commonly used. Again, fuel flex-ibility is a strength of FBC systems. They can be designed around a wide varietyof solid fuels with heating values to 3,500Btu/lb or lower (versus, say, 5,500Btu/lbfor PC boilers). This enables usage of a greater fraction of the coal resource, withless resultant waste.
Coal and limestone are fed into the boiler near the bottom of the bed. Fluidiz-ing or primary air enters the bed from the bottom through a distribution system
Fig. 4. Typical fluid bed combustor.
The
Wor
ld S
cien
tific
Han
dboo
k of
Ene
rgy
Dow
nloa
ded
from
ww
w.w
orld
scie
ntif
ic.c
omby
MC
GIL
L U
NIV
ER
SIT
Y o
n 04
/21/
13. F
or p
erso
nal u
se o
nly.
December 19, 2012 8:55 9.75in x 6.5in The World Scientific Handbook of Energy b1394-ch03
Coal 25
that might consist of a perforated plate or an array of tubes configured to providethe fluidization. Secondary air is injected into the upper portion or above the bedto provide the balance of the combustion air. Bed temperatures are sufficiently highto convert the limestone (CaCO3) to lime (CaO), which reacts with the SO2 to pro-duce calcium sulfate (CaSO4) and/or calcium sulfite (CaSO3). As the coal particlesare combusted, they become smaller and rise through the bed and, along with theother bed material, are carried out of the bed with the flue gas. This material pri-marily consists of ash, reacted lime, and unreacted lime, along with some unburnedcarbon. It is removed from the flue gas in a cyclone and returned to the bed, possi-bly after it is cooled to recover energy as steam. This recycled material constitutesthe bulk of the bed material, typically 80% to 90%. Maintaining this high level ofbasically inert material is necessary to maintain a stable bed temperature in thedesired range, typically 1500◦F to 1700◦F. Steam is generated in tube walls withinthe boiler. Some of the ash/spent lime is removed from the bottom of the combustorfor beneficial use or disposal.
Gas exiting the cyclone then passes through a series of heat transfer bun-dles located in a vessel downstream of the cyclone, where the steam generatedin the boiler is superheated before it is used to generate electricity in a steam tur-bine/generator set. As with a PC boiler, additional energy is recovered from theflue gas in an economizer, then an air preheater. As a minimum, the flue gas willbe treated in either a baghouse or ESP for removal of fly ash. If a polishing step foradditional NOX destruction is needed, SCR or SNCR can be used at the appropriatepoint. Ammonia or urea can be injected (SNCR) as the flue gas exits the cycloneor a small catalyst bed also requiring ammonia (SCR) can be installed between theeconomizer and air preheater. SO2 removal within the FBC is typically over 90%.However, if that is insufficient, a polishing FGD system may also be required andwould use the same technologies as would be used with a PC boiler. If mercuryremoval is required, activated carbon can be injected upstream of a baghouse.
There has been some commercial development of pressurized FBC systems.Typically, the combustor and FBC are installed in a larger pressurized vessel toavoid high pressure differential on the walls of the FBC. The major difference is thathot flue gas is passed through a combustion turbine after the bulk of the particulatematter has been removed, which increases the overall efficiency. The downstreamequipment and processes are similar to an atmospheric FBC system. Their use isnot currently common since some operational issues still need to be resolved.
5.3 Gasification
One use of coal that has received increased attention in recent years is gasification.The coal is fed to a gasifier to produce syngas (synthesis gas) — primarily carbonmonoxide (CO) and hydrogen (H2). After the impurities are removed, the syngascan be burned in a gas turbine/generator set to produce electric power or be furtherprocessed to produce a variety of chemicals or other fuels such as synthetic pipeline
The
Wor
ld S
cien
tific
Han
dboo
k of
Ene
rgy
Dow
nloa
ded
from
ww
w.w
orld
scie
ntif
ic.c
omby
MC
GIL
L U
NIV
ER
SIT
Y o
n 04
/21/
13. F
or p
erso
nal u
se o
nly.

December 19, 2012 8:55 9.75in x 6.5in The World Scientific Handbook of Energy b1394-ch03
26 T. Sarkus, A. Radziwon and W. Ellis
gas (methane; note that synthetic gas is to be distinguished clearly from synthesisgas) or, via Fischer–Tropsch synthesis, liquid transportation fuels. To recap, gasifi-cation can yield syngas to produce (1) electricity, (2) chemicals, and/or (3) fuels.
A worldwide gasification database is available online at: http://www.netl.doe.gov/technologies/coalpower/gasification/worlddatabase/index.html. According tothis source, at the time of writing, there are 191 active gasification projects world-wide, consisting of over 500 gasifiers. Of the 191 projects, 137 are in operation and54 are in some stage of development, ranging from preliminary engineering to con-struction. Of this total, 92 are (or will be) fed with coal. Fourteen are used toproduce electricity and the balance produce syngas, which will be converted intoa variety of products. Regardless of the end use, similar syngas cleanup steps arerequired. Figure 5 is a generic gasification system configured to produce electricpower in an integrated gasification combined-cycle (IGCC) power plant and chem-ical byproducts.
Combined cycle refers to a system in which a gaseous fuel (e.g. methane, syn-gas) is used in a combustion turbine/generator set to produce electricity; heat isrecovered from the turbine exhaust to generate steam, which is then used in a steamturbine/generator set to produce additional electricity. Although gasification tech-nology dates back over 100 years, IGCC is a comparatively new application thatcouples a gasifier with a combustion turbine, in combined-cycle mode.
Although gasifiers can operate at atmospheric pressure, elevated pressureoperation is currently most common. Gasifiers can be entrained flow, fluidized beds,
Fig. 5. Simplified flow diagram of coal gasification.
The
Wor
ld S
cien
tific
Han
dboo
k of
Ene
rgy
Dow
nloa
ded
from
ww
w.w
orld
scie
ntif
ic.c
omby
MC
GIL
L U
NIV
ER
SIT
Y o
n 04
/21/
13. F
or p
erso
nal u
se o
nly.
December 19, 2012 8:55 9.75in x 6.5in The World Scientific Handbook of Energy b1394-ch03
Coal 27
or fixed beds, with most newer installations being entrained flow or fluidized beddesigns. Gasification is the reaction of a hydrocarbon fuel with oxygen to form amixture consisting primarily of carbon monoxide and hydrogen. In the simplestsense, it is a partial combustion reaction in which a portion of the coal is oxidizedunder extremely oxygen-deficient conditions to provide the energy for the gasifica-tion reactions. These reactions can be generalized as:
CxHy (coal) + O2 + H2O => CO + CO2 + H2.
The primary feeds to the gasifier are coal and air or oxygen, with oxygen being morecommon in recent installations where the oxygen is supplied as a liquid by an AirSeparation Unit (ASU). It is vaporized, compressed, and piped to the gasifier. Thecoal can be fed to a pressurized gasifier in one of two ways. It can be pressurizedthrough a series of lockhoppers and discharged to the gasifier. Alternatively, it canbe mixed with water and pumped into the gasifier as a dense-phase slurry. Somegasifiers inject the coal at two points. If a slurry feed system is used, the water takespart in the gasification process by reacting with the carbon in the coal. Steam mayalso be added to serve as a reactant, especially in dry feed systems.
The bulk of the mineral matter in the coal is removed from the gasifier baseas either dry ash or as molten slag. If removed as slag, it flows from the bottom ofthe gasifier into a water bath and is removed through a series of pressure let-downlockhoppers for dewatering and subsequent sale. Dry ash is also removed through aseries of lockhoppers.
Many gasifiers are equipped with an integrated cyclone to capture coarse, par-tially reacted solids and return them to the gasifier in order to completely consumethe carbon. The raw syngas leaving the gasifier cyclone is cooled, generating steamin the process. In gasification systems that are used in an IGCC mode, this steamis used as part of the feed to the steam turbine and for other heat requirements inthe plant. After some level of cooling, the syngas is treated to remove particulatematter. This can be accomplished by ceramic filters and/or cyclones. If extremelyhigh efficiency removal is required, a wet particulate scrubber can be used.
The next step in the syngas treating process is water gas shift/carbonyl sulfide(COS) hydrolysis. In gasification, the bulk of the sulfur in the coal is transformedinto hydrogen sulfide (H2S), but some COS is also formed. While H2S is readilyremoved in a number of processes, COS is not. It must therefore be hydrolyzed toH2S for effective removal. The water gas shift reaction is a catalytic reaction inwhich CO and water vapor react to form hydrogen and CO2. The water gas shiftis carried out to provide the correct CO:H2 ratio when the syngas will be used tocreate various chemical or fuel products, or to convert as much of the CO to CO2
as possible, thereby allowing for efficient CO2 separation prior to combustion of H2
in an IGCC plant. (Although no coal-based IGCC power plants currently practicewater gas shift and subsequent CO2 capture at full scale, intensive studies are underway, and this approach constitutes an important potential pathway to control CO2
emissions from future coal-fueled IGCC power plants.)
The
Wor
ld S
cien
tific
Han
dboo
k of
Ene
rgy
Dow
nloa
ded
from
ww
w.w
orld
scie
ntif
ic.c
omby
MC
GIL
L U
NIV
ER
SIT
Y o
n 04
/21/
13. F
or p
erso
nal u
se o
nly.
December 19, 2012 8:55 9.75in x 6.5in The World Scientific Handbook of Energy b1394-ch03
28 T. Sarkus, A. Radziwon and W. Ellis
Returning to the gasification process description, the next step involves removalof pollutants (primarily H2S) from the syngas. Sulfur and CO2 are removed prior tocombustion since the volume of the syngas is much smaller than the volume of thesyngas combustion products; the smaller pre-combustion gas volume simply makestheir removal easier. Since the syngas is relatively cool, activated carbon can beused to remove mercury, if needed. While it is possible to remove H2S at highertemperature with a dry sorbent, most systems use a liquid that absorbs the H2S,which is then stripped from the sorbent and recovered either as elemental sulfuror sulfuric acid. The liquids that are currently specified for this purpose includeamines, glycols, and chilled methanol. These systems have the advantage that theycan be designed as two-stage systems that offer the ability to separately remove andrecover the CO2 for beneficial use or sequestration, thus avoiding or reducing theemission of that greenhouse gas.
At this point, the syngas is ready for further processing into a chemical feed-stock, or to fuel a combined cycle unit. In the latter case, it is diluted with byprod-uct nitrogen from the ASU or steam and fed to a combustion turbine/generatorset where it is burned with air to generate electricity. The diluents add mass andmaintain the correct temperature for the combustion turbine. The hot combustionproducts are passed through a heat recovery steam generator (HRSG) that uses theheat to generate steam. This steam is used to drive a steam turbine to generateadditional electricity. Finally, the pollutant-free turbine exhaust is then dischargedto the atmosphere through the plant stack.
Pulverized coal boilers first came on line in the 1920s and have long been theworkhorse of the electric utility industry, with nearly a thousand boilers in the USalone, the largest rated at 1,300 megawatts electric (MWe). Significant work oncoal-fired FBCs basically started in the 1960s resulting in over 100, mostly small,units in the US. The largest single unit is around 500 MWe. Coal gasification forsyngas applications began in a small way over 50 years ago, but serious work inpower generation did not start until the 1980s. A single gasifier train is limitedto about 300 MWe. As stated earlier, there are 92 coal-fired gasification projectsworldwide that are either operating or in different stages of development.
5.4 Liquefaction
Another form of coal conversion is coal liquefaction. Although the term “liquifica-tion” can be found in historical literature, it fell into disuse over a generation agoand has been supplanted totally by “liquefaction.” Most recent projects for coalliquefaction use indirect liquefaction. The coal is gasified to produce syngas, thesyngas is shifted to adjust the hydrogen/carbon ratio, and the syngas is catalyti-cally reacted to yield a product slate that can range from light hydrocarbon gasesto heavy waxes, which might be subjected to additional refinement. With propercatalyst selection and operating conditions, a crude diesel fuel can be produced bythe catalytic reaction. The diesel fuel can then be subjected to further refining, toproduce most liquid transportation fuels.
The
Wor
ld S
cien
tific
Han
dboo
k of
Ene
rgy
Dow
nloa
ded
from
ww
w.w
orld
scie
ntif
ic.c
omby
MC
GIL
L U
NIV
ER
SIT
Y o
n 04
/21/
13. F
or p
erso
nal u
se o
nly.

December 19, 2012 8:55 9.75in x 6.5in The World Scientific Handbook of Energy b1394-ch03
Coal 29
The hydrogen-to-carbon ratio of liquid fuels is higher than that of coal. In directliquefaction, the coal is directly converted to a synthetic crude oil by the additionof hydrogen. It is then further processed to produce the desired end products. In atypical system, a recycle stream of raw synthetic oil is mixed with crushed coal andcatalyst to form a slurry. The slurry is then fed to a fluidized bed reactor, whichoperates at elevated temperature and pressure. Hydrogen is separately fed to thereactor to react with the coal and produce a raw synthetic crude oil. The reactoreffluent is then separated from the catalyst and the unreacted coal residue. Afterthe solids are separated, a portion of the oil and all of the catalyst are recycled tothe slurry preparation area. The balance of the raw oil is then subjected to typicalrefinery operations such as hydrotreating, cracking, and distillation. End productsinclude both diesel fuel and gasoline. The unreacted coal that was separated fromthe reactor product can be gasified and processed, as described earlier, to supplythe hydrogen for the liquefaction reactor and subsequent processing of the raw oil.
6 Other Coal Uses
Minor amounts of coal are used as a heat source in a variety of industrial applicationssuch as the manufacture of steel, cement, glass, ceramics, and paper. The use ofcoal is declining in cement making, where it is being displaced by waste materialssuch as scrap tires and biomass. The conditions in a cement kiln are ideal for thecombustion of scrap tires. If biomass is used in a cement kiln, co-firing some coalis still necessary to attain the required temperatures. Fly ash resulting from coalcombustion can also be used in cement making.
Some of the coal used for steelmaking is used to produce metallurgical coke.Coke, limestone, and iron ore are charged into a blast furnace to produce crudemolten iron (hot metal), which is further processed into various grades of steel.The coke serves as the reducing agent and heat source to reduce the iron oxides toelemental iron. Coke is produced by charging it into slot ovens, a connected seriesof which make up a battery. The coal is heated through the oven walls. The coal isheated to high temperatures in the absence of air to drive off the volatile materialswhich are recovered as valuable byproducts. Coal used for this purpose tends tobe more expensive since certain properties are required. The coal must be stronglycaking, since metallurgical coke must have sufficient mechanical strength to supportthe charge (burden) in the blast furnace. It must swell slightly during the cokingprocess to maintain good contact with the walls to prevent them from overheating.If the tendency to swell is too great, the walls of the oven can be damaged and thecoke will be difficult to push from the oven. The amount of coal used for this purposein the US has declined to about 15 million tons in recent years. A major reasonis that other fuels such as granulated or pulverized coal can now be substitutedfor a portion of the coke. However, a significant amount of coke is still needed tosupport the burden and to provide the necessary porosity for the hot air blast topass through the burden.
The
Wor
ld S
cien
tific
Han
dboo
k of
Ene
rgy
Dow
nloa
ded
from
ww
w.w
orld
scie
ntif
ic.c
omby
MC
GIL
L U
NIV
ER
SIT
Y o
n 04
/21/
13. F
or p
erso
nal u
se o
nly.

December 19, 2012 8:55 9.75in x 6.5in The World Scientific Handbook of Energy b1394-ch03
30 T. Sarkus, A. Radziwon and W. Ellis
7 Challenges in Coal Production
Any industrial activity that involves the use of heavy machinery has the potentialto result in injury or death. The production of fossil fuels, including coal, is noexception. The production and use of fossil fuels also has the potential to adverselyaffect the environment. The preceding paragraphs discuss how the impacts of coalconsumption are virtually eliminated through technology and operating techniques.The hazards and adverse environmental impacts peculiar to coal mining can likewisebe largely mitigated through good operating practices and the application of theappropriate technology.
Coal is mined either by removing the rocks and dirt above the coal and dig-ging the coal out (surface mining) or by removing the coal from the seam byconstructing a shaft to the seam and removing the coal from underground (deepmining). The adverse environmental impact most associated with both types ofmining is acid drainage, which results from water leaching due to sulfur com-pounds, primarily iron sulfides (pyrites), present in coal and thereby becomingacidified. This problem is solved by collecting the water and neutralizing it beforedischarge.
Since surface mining removes all dirt and rock above the coal seam(s) to bemined, the surface is essentially destroyed and this is unavoidable. However, thetopsoil can be kept separate from the underlying rocks and dirt, and barriers made toavoid erosion during the mining process. At the conclusion of mining, the underlyingrock and dirt are used to establish pre-mining surface contours then the topsoil isspread over the area. The area can then be planted with native plants and treesto restore the areas as close as possible to the pre-mining conditions. If desired,the area could actually be reclaimed to improve the area for wildlife habitat orother uses. While these techniques will eventually return the mine site to a goodcondition, it can take some number of years.
The risk of injury in surface mines is primarily due to human interaction withmachinery. Training and the establishment/enforcement of safe work practices arethe main methods used to prevent accidents.
Deep mining has several major challenges for environmental impact specific todeep mining in addition to the construction and operating activities at the minemouth. One is the risk of subsidence, which can result in damage to structures,groundwater, and the surface environment. This can be mitigated to a degree by themining technique. In some cases, even when subsidence occurs, the impact is minor.Beneficiation (washing) is often used to separate the mineral matter (ash) from coal.The result is a higher quality coal product and a waste portion that still containssome coal. Disposal of the solid waste from mining and beneficiation presents asecond major environmental problem. It is often disposed of by simply piling itnear the mine. The runoff from these waste piles is acidic and must be treatedto avoid environmental consequences. Both old mines and waste piles occasionallycatch fire. These fires can smolder for decades, emit noxious fumes, and are difficultor impossible to extinguish. Depending on the coal content of the waste piles, some
The
Wor
ld S
cien
tific
Han
dboo
k of
Ene
rgy
Dow
nloa
ded
from
ww
w.w
orld
scie
ntif
ic.c
omby
MC
GIL
L U
NIV
ER
SIT
Y o
n 04
/21/
13. F
or p
erso
nal u
se o
nly.

December 19, 2012 8:55 9.75in x 6.5in The World Scientific Handbook of Energy b1394-ch03
Coal 31
of them can be burned in FBCs. The excess ash is then returned to the site of thewaste pile and the unreacted lime in the ash serves to effectively neutralize anyacidity in the runoff.
Safety challenges peculiar to deep mining include rock (roof) falls, methane andcoal dust explosions/fires, breathing coal dust for prolonged periods, and pocketsof CO2 (sometimes referred to as “black damp”). The risk of rock falls is mitigatedby properly supporting the roof in active mining areas by installing posts or boltingthe roof to stable rock above the roof. A spray of limestone slurry is used to coatthe mine walls to greatly reduce the problems associated with the coal dust. Furtherprotection from the effects of breathing the dust is provided by requiring minersto wear respirators. Both methane and CO2 tend to evolve from coal seams. Bothgases can asphyxiate miners, and methane can cause gas explosions. Both hazardscan be effectively mitigated by rigorous monitoring of the atmosphere and adequateventilation.
Although safety and environmental challenges still exist in coal mining, mostcan be readily mitigated. Where these mitigation techniques are rigorously prac-ticed, environmental and human costs have been greatly reduced since the earlydays of coal mining.
8 Challenges in Coal Usage
The abundance and low cost of coal have made it the fuel of choice for nationsendowed with this natural resource and for those nations that choose to importit. Early use of coal in these countries has demonstrated the need, however, toinvestigate technologies that not only reduce the emissions associated with this fuelbut also allow it to combust more efficiently, thereby conserving this energy sourcefor future generations. Examples of innovative research, development, and deploy-ment for clean and efficient coal utilization can be found at the US Department ofEnergy’s National Energy Technology Laboratory Major Demonstration Projectswebsite http://www.netl.doe.gov/technologies/coalpower/cctc/.
8.1 Worldwide Coal Usage
The largest use of coal worldwide, by far, is to provide steam to generate elec-tric power. While coal is used in a variety of industries, to provide heat to var-ious processes, the quantities involved are much less than the quantity used inpower generation. There are nearly 6,400 operating units worldwide rated at over25 MWe, including over 322 FBCs. Not surprisingly, countries or regions thatrely on coal for a significant portion of their electrical generation are usuallythose that have significant coal reserves. For example, China has nearly 2,300operating coal-fired generating units. The US is second in coal-based generation,with approximately 1,100 units. On a regional basis, the European Union hasover 860 operating units, while the Commonwealth of Independent States (for-mer Soviet republics) accounts for over 600 units. Of these over 400 are located inRussia.
The
Wor
ld S
cien
tific
Han
dboo
k of
Ene
rgy
Dow
nloa
ded
from
ww
w.w
orld
scie
ntif
ic.c
omby
MC
GIL
L U
NIV
ER
SIT
Y o
n 04
/21/
13. F
or p
erso
nal u
se o
nly.
December 19, 2012 8:55 9.75in x 6.5in The World Scientific Handbook of Energy b1394-ch03
32 T. Sarkus, A. Radziwon and W. Ellis
8.2 Coal Usage Projections for OECD Nationsa
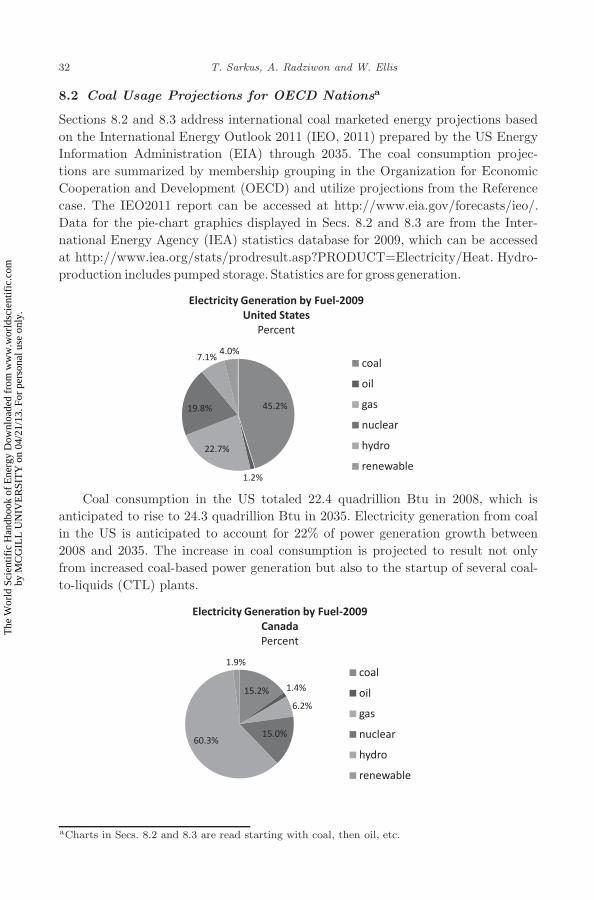
Sections 8.2 and 8.3 address international coal marketed energy projections basedon the International Energy Outlook 2011 (IEO, 2011) prepared by the US EnergyInformation Administration (EIA) through 2035. The coal consumption projec-tions are summarized by membership grouping in the Organization for EconomicCooperation and Development (OECD) and utilize projections from the Referencecase. The IEO2011 report can be accessed at http://www.eia.gov/forecasts/ieo/.Data for the pie-chart graphics displayed in Secs. 8.2 and 8.3 are from the Inter-national Energy Agency (IEA) statistics database for 2009, which can be accessedat http://www.iea.org/stats/prodresult.asp?PRODUCT=Electricity/Heat. Hydro-production includes pumped storage. Statistics are for gross generation.
45.2%
1.2%
22.7%
19.8%
7.1%4.0%
Electricity Generation by Fuel-2009United States
Percent
coal
oil
gas
nuclear
hydro
renewable
Coal consumption in the US totaled 22.4 quadrillion Btu in 2008, which isanticipated to rise to 24.3 quadrillion Btu in 2035. Electricity generation from coalin the US is anticipated to account for 22% of power generation growth between2008 and 2035. The increase in coal consumption is projected to result not onlyfrom increased coal-based power generation but also to the startup of several coal-to-liquids (CTL) plants.
15.2% 1.4%
6.2%
15.0%60.3%
1.9%
Electricity Generation by Fuel-2009CanadaPercent
coal
oil
gas
nuclear
hydro
renewable
aCharts in Secs. 8.2 and 8.3 are read starting with coal, then oil, etc.
The
Wor
ld S
cien
tific
Han
dboo
k of
Ene
rgy
Dow
nloa
ded
from
ww
w.w
orld
scie
ntif
ic.c
omby
MC
GIL
L U
NIV
ER
SIT
Y o
n 04
/21/
13. F
or p
erso
nal u
se o
nly.

December 19, 2012 8:55 9.75in x 6.5in The World Scientific Handbook of Energy b1394-ch03
Coal 33
11.3%
17.5%
53.1%
4.0%
10.2%3.9%
Electricity Generation by Fuel-2009MexicoPercent
coal
oil
gas
nuclear
hydro
renewable
Canada is expected to experience a decrease of 0.2 quadrillion Btu in coalconsumption from 2008 to 2035 due to the phasing out of Ontario’s 6.1 GW ofcoal-fired generating capacity by 2014 (IEA Online Statistics c©OECD/IEA 2012).Mexico added 0.7 GW of coal-fired generating capacity in 2010.
28.2%
1.2%
44.1%
18.4%
2.4% 5.8%
Electricity Generation by Fuel-2009United Kingdom
Percent
coal
oil
gas
nuclear
hydro
renewable
The coal consumption of European OECD member countries is projected todecline from 12.5 quadrillion Btu in 2008 to 10.4 quadrillion Btu in 2035. Con-sumption in this region is attributed almost in its entirety to the electricity andindustrial sectors.
46.0%
4.4%
15.5%
32.5%
1.2% 0.5%
Electricity Generation by Fuel-2009 Republic of Korea
Percent
coal
oil
gas
nuclear
hydro
renewable
The
Wor
ld S
cien
tific
Han
dboo
k of
Ene
rgy
Dow
nloa
ded
from
ww
w.w
orld
scie
ntif
ic.c
omby
MC
GIL
L U
NIV
ER
SIT
Y o
n 04
/21/
13. F
or p
erso
nal u
se o
nly.

December 19, 2012 8:55 9.75in x 6.5in The World Scientific Handbook of Energy b1394-ch03
34 T. Sarkus, A. Radziwon and W. Ellis
26.7%
8.7%
27.2%
26.7%
7.8%
2.9%
Electricity Generation by Fuel-2009Japan
Percent
coal
oil
gas
nuclear
hydro
renewable
77.9%
1.0%
13.7%
0.0% 4.7% 2.6%
Electricity Generation by Fuel-2009AustraliaPercent
coal
oil
gas
nuclear
hydro
renewable
The OECD Asia region is anticipated to show no increase in coal consumption.Japan is anticipated to decrease coal use by 0.9 quadrillion Btu due to a shiftto alternative sources of electricity generation, and South Korea is anticipated toincrease coal use by 0.8 quadrillion Btu from 2008 to 2035. Australia and NewZealand are anticipated to maintain their current coal consumption through 2035.South Korea increases coal consumption from 2.6 quadrillion Btu in 2008 to 3.4quadrillion Btu in 2035, primarily due to increased power production.
43.4%
1.6%
13.3%
22.8%
4.2%14.7%
Electricity Generation by Fuel-2009GermanyPercent
coal
oil
gas
nuclear
hydro
renewable
The
Wor
ld S
cien
tific
Han
dboo
k of
Ene
rgy
Dow
nloa
ded
from
ww
w.w
orld
scie
ntif
ic.c
omby
MC
GIL
L U
NIV
ER
SIT
Y o
n 04
/21/
13. F
or p
erso
nal u
se o
nly.
December 19, 2012 8:55 9.75in x 6.5in The World Scientific Handbook of Energy b1394-ch03
Coal 35
8.3 Coal Usage Projections for Non-OECD Nations
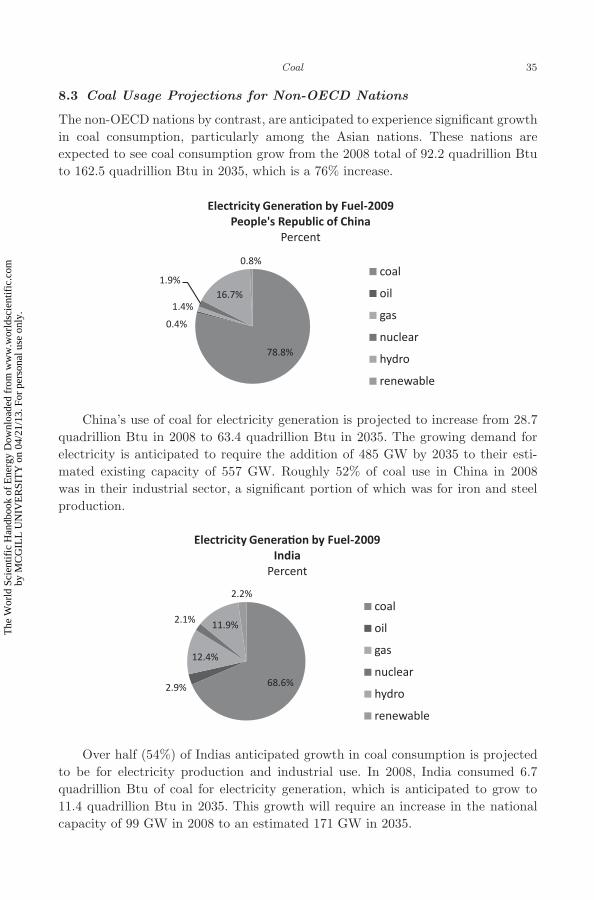
The non-OECD nations by contrast, are anticipated to experience significant growthin coal consumption, particularly among the Asian nations. These nations areexpected to see coal consumption grow from the 2008 total of 92.2 quadrillion Btuto 162.5 quadrillion Btu in 2035, which is a 76% increase.
78.8%
0.4%
1.4%
1.9%16.7%
0.8%
Electricity Generation by Fuel-2009 People's Republic of China
Percent
coal
oil
gas
nuclear
hydro
renewable
China’s use of coal for electricity generation is projected to increase from 28.7quadrillion Btu in 2008 to 63.4 quadrillion Btu in 2035. The growing demand forelectricity is anticipated to require the addition of 485 GW by 2035 to their esti-mated existing capacity of 557 GW. Roughly 52% of coal use in China in 2008was in their industrial sector, a significant portion of which was for iron and steelproduction.
68.6%2.9%
12.4%
2.1% 11.9%
2.2%
Electricity Generation by Fuel-2009 India
Percent
coal
oil
gas
nuclear
hydro
renewable
Over half (54%) of Indias anticipated growth in coal consumption is projectedto be for electricity production and industrial use. In 2008, India consumed 6.7quadrillion Btu of coal for electricity generation, which is anticipated to grow to11.4 quadrillion Btu in 2035. This growth will require an increase in the nationalcapacity of 99 GW in 2008 to an estimated 171 GW in 2035.
The
Wor
ld S
cien
tific
Han
dboo
k of
Ene
rgy
Dow
nloa
ded
from
ww
w.w
orld
scie
ntif
ic.c
omby
MC
GIL
L U
NIV
ER
SIT
Y o
n 04
/21/
13. F
or p
erso
nal u
se o
nly.
December 19, 2012 8:55 9.75in x 6.5in The World Scientific Handbook of Energy b1394-ch03
36 T. Sarkus, A. Radziwon and W. Ellis
16.5% 1.6%
47.3%
16.5%
17.8%
0.3%
Electricity Generation by Fuel-2009 Russian Federation
Percent
coal
oil
gas
nuclear
hydro
renewable
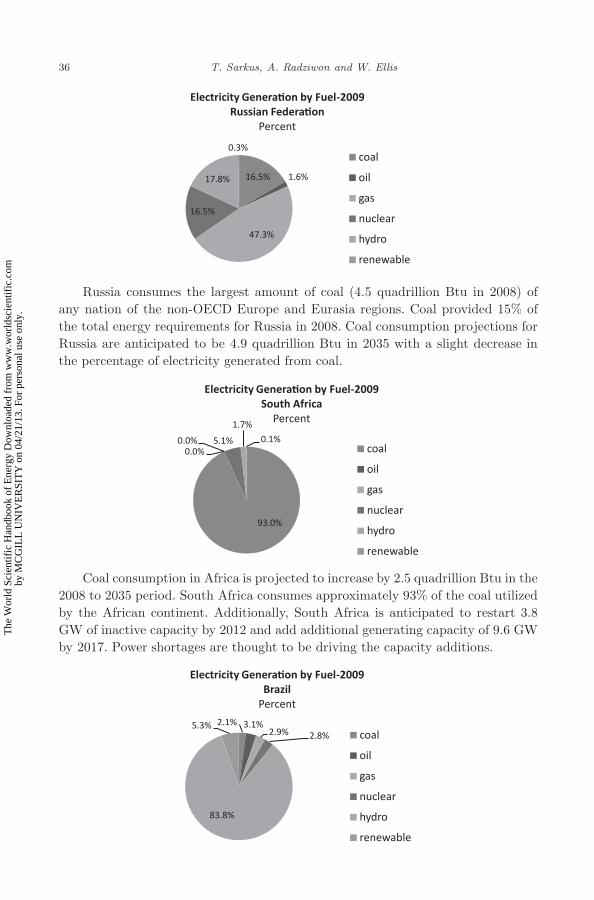
Russia consumes the largest amount of coal (4.5 quadrillion Btu in 2008) ofany nation of the non-OECD Europe and Eurasia regions. Coal provided 15% ofthe total energy requirements for Russia in 2008. Coal consumption projections forRussia are anticipated to be 4.9 quadrillion Btu in 2035 with a slight decrease inthe percentage of electricity generated from coal.
93.0%
0.0%0.0% 5.1%
1.7%
0.1%
Electricity Generation by Fuel-2009South Africa
Percent
coal
oil
gas
nuclear
hydro
renewable
Coal consumption in Africa is projected to increase by 2.5 quadrillion Btu in the2008 to 2035 period. South Africa consumes approximately 93% of the coal utilizedby the African continent. Additionally, South Africa is anticipated to restart 3.8GW of inactive capacity by 2012 and add additional generating capacity of 9.6 GWby 2017. Power shortages are thought to be driving the capacity additions.
2.1% 3.1%2.9% 2.8%
83.8%
5.3%
Electricity Generation by Fuel-2009 Brazil
Percent
coal
oil
gas
nuclear
hydro
renewable
The
Wor
ld S
cien
tific
Han
dboo
k of
Ene
rgy
Dow
nloa
ded
from
ww
w.w
orld
scie
ntif
ic.c
omby
MC
GIL
L U
NIV
ER
SIT
Y o
n 04
/21/
13. F
or p
erso
nal u
se o
nly.
December 19, 2012 8:55 9.75in x 6.5in The World Scientific Handbook of Energy b1394-ch03
Coal 37
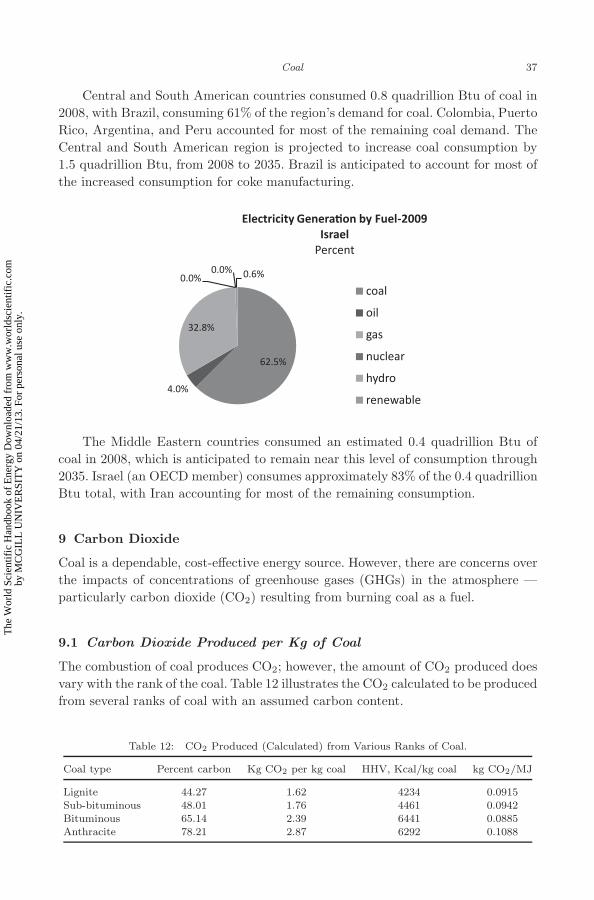
Central and South American countries consumed 0.8 quadrillion Btu of coal in2008, with Brazil, consuming 61% of the region’s demand for coal. Colombia, PuertoRico, Argentina, and Peru accounted for most of the remaining coal demand. TheCentral and South American region is projected to increase coal consumption by1.5 quadrillion Btu, from 2008 to 2035. Brazil is anticipated to account for most ofthe increased consumption for coke manufacturing.
62.5%
4.0%
32.8%
0.0%0.0% 0.6%
Electricity Generation by Fuel-2009Israel
Percent
coal
oil
gas
nuclear
hydro
renewable
The Middle Eastern countries consumed an estimated 0.4 quadrillion Btu ofcoal in 2008, which is anticipated to remain near this level of consumption through2035. Israel (an OECD member) consumes approximately 83% of the 0.4 quadrillionBtu total, with Iran accounting for most of the remaining consumption.
9 Carbon Dioxide
Coal is a dependable, cost-effective energy source. However, there are concerns overthe impacts of concentrations of greenhouse gases (GHGs) in the atmosphere —particularly carbon dioxide (CO2) resulting from burning coal as a fuel.
9.1 Carbon Dioxide Produced per Kg of Coal
The combustion of coal produces CO2; however, the amount of CO2 produced doesvary with the rank of the coal. Table 12 illustrates the CO2 calculated to be producedfrom several ranks of coal with an assumed carbon content.
Table 12: CO2 Produced (Calculated) from Various Ranks of Coal.
Coal type Percent carbon Kg CO2 per kg coal HHV, Kcal/kg coal kg CO2/MJ
Lignite 44.27 1.62 4234 0.0915Sub-bituminous 48.01 1.76 4461 0.0942Bituminous 65.14 2.39 6441 0.0885Anthracite 78.21 2.87 6292 0.1088
The
Wor
ld S
cien
tific
Han
dboo
k of
Ene
rgy
Dow
nloa
ded
from
ww
w.w
orld
scie
ntif
ic.c
omby
MC
GIL
L U
NIV
ER
SIT
Y o
n 04
/21/
13. F
or p
erso
nal u
se o
nly.

December 19, 2012 8:55 9.75in x 6.5in The World Scientific Handbook of Energy b1394-ch03
38 T. Sarkus, A. Radziwon and W. Ellis
9.2 Geologic Storage of Carbon Dioxide
Geologic storage of CO2 is a focus area of the NETL Carbon Storage R&D Pro-gram (http://www.netl.doe.gov/technologies/carbon seq/corerd/storage.html) andinvolves the injection of CO2 into deep geologic formations (injection zones) over-lain by competent sealing formations and geologic traps that will contain CO2. Cur-rent research and field studies are focused on developing better understanding of 11major types of geologic storage reservoir classes, each having their own unique char-acteristics and challenges. The different storage formation classes include deltaic,coal/shale, fluvial, alluvial, strandplain, turbidite, eolian, lacustrine, clastic shelf,carbonate shallow shelf, and reef. Basaltic interflow zones are also being consideredas potential reservoirs. These storage reservoirs contain fluids that may include natu-ral gas, oil, and/or saline water; any of which may affect CO2 storage differently. Fol-lowing are brief descriptions taken from the NETL Carbon Sequestration ProgramR&D website of CO2 storage capability for fluids that may be present in more con-ventional clastic and carbonate reservoirs (saline water, and oil and gas), as well asunconventional reservoirs (unmineable coal seams, organic-rich shales, and basalts):
9.2.1 Saline-bearing formations
Potential storage reservoirs may contain layers of porous rock saturated with brine(fluid containing >10,000 ppm total dissolved solids). This is the most widespreadreservoir type and thus has the highest potential storage capacity of all geologicmedia. Saline water can contain minerals that could potentially react with theinjected CO2 to form solid carbonates. The reactions can increase permanence butcould decrease the porosity in the immediate vicinity of an injection well. R&Defforts to investigate saline formations as potential storage media are ongoing tobetter understand their behavior under CO2 storage conditions.
9.2.2 Natural gas and oil-bearing formations
Oil and natural gas can be present in permeable rock formations with an overlyinglow-permeability rock layer that forms a stratigraphic trap that holds the oil andgas in place. As a value-added benefit, when CO2 is injected into an oil-bearingformation, it can produce additional oil (e.g. 10%–15%). This process is known asenhanced oil recovery (EOR). The ability of EOR to increase oil projection andprovide storage for CO2 is currently under investigation.
9.2.3 Unmineable coal seams
Unmineable coal seams include those that are too deep or too thin to be economi-cally mined. All coals have varying amounts of methane (CH4) adsorbed onto poresurfaces, and wells can be drilled into unmineable coal seams to recover coal bedmethane (CBM). Initial CBM recovery methods leave a considerable amount of CH4
in the formation, but this can be increased by injecting CO2, which is adsorbed ontothe surface of the coal, and results in the desorption of methane (enhanced coal bed
The
Wor
ld S
cien
tific
Han
dboo
k of
Ene
rgy
Dow
nloa
ded
from
ww
w.w
orld
scie
ntif
ic.c
omby
MC
GIL
L U
NIV
ER
SIT
Y o
n 04
/21/
13. F
or p
erso
nal u
se o
nly.

December 19, 2012 8:55 9.75in x 6.5in The World Scientific Handbook of Energy b1394-ch03
Coal 39
methane [ECBM] recovery). Once the methane has been depleted from the forma-tion, additional CO2 may be injected for permanent storage.
9.2.4 Organic-rich shale basins
Shale, the most common sedimentary rock, is characterized by thin horizontal layersof rock with low permeability in the vertical direction. Many shales contain 1%–2%organic material in the form of hydrocarbons, which provide an adsorption substratefor CO2 storage similar to CO2 storage in coal seams. Modern drilling methods mayallow the permeability of shales to be increased to provide economical CO2 storage.
9.2.5 Basalt
Basalt formations are geologic formations of solidified lava. Basalt formations havea unique chemical makeup that could potentially convert much of the injected CO2
to a solid mineral form, thereby isolating it from the atmosphere permanently.
9.3 Carbon Dioxide Utilization
CO2 utilization is another focus area of the NETL Carbon Storage R&D Program(http://www.netl .doe.gov/technologies/carbon seq/corerd/co2utilization.html),which investigates pathways and novel approaches for reducing CO2 emissions bydeveloping beneficial uses for the CO2 that will mitigate CO2 emissions in areaswhere geologic storage may not be an optimal solution. CO2 can be used in appli-cations that could generate significant benefits. It is possible to develop alternativesthat can use captured CO2 or convert it to useful products such as chemicals,cements, or plastics. Revenue generated from the utilized CO2 could also offset aportion of the CO2 capture cost.
The development of CO2 utilization is ongoing. Specific applications of CO2
utilization are further addressed at the readers’ convenience in the following pub-lication: “The US Department of Energy’s R&D program to reduce greenhousegas emissions through beneficial uses of carbon dioxide” (http://www.netl.doe.gov/technologies/carbon seq/refshelf/project%20portfolio/2011/SelectedPubs/GHG35final.pdf).
9.4 Cost of Carbon Storage
A cost and performance baseline study “Cost and Performance Baseline for FossilEnergy Plants Volume 1: Bituminous Coal and Natural Gas to Electricity, Revi-sion 2, November 2010” (http://www.netl.doe.gov/energy-analyses/pubs/BitBaseFinRep Rev2.pdf) commissioned by US DOE, NETL, provides a general cost andperformance assessment for Pulverized Coal (PC) Combustion, Integrated Gasifica-tion Combined Cycles (IGCC), and Natural Gas Combined Cycles (NGCC) powerplants. The cost estimates are presented for the plants both with and without CO2
capture and storage. The study assumes that the plants use technology available
The
Wor
ld S
cien
tific
Han
dboo
k of
Ene
rgy
Dow
nloa
ded
from
ww
w.w
orld
scie
ntif
ic.c
omby
MC
GIL
L U
NIV
ER
SIT
Y o
n 04
/21/
13. F
or p
erso
nal u
se o
nly.

December 19, 2012 8:55 9.75in x 6.5in The World Scientific Handbook of Energy b1394-ch03
40 T. Sarkus, A. Radziwon and W. Ellis
today. The study shows the Levelized Cost of Electricity (mills/kWh, 2007 US$)for the Pulverized Coal (PC) Sub-critical Plant without Carbon Capture and Stor-age (CCS) to be 75.3 mills/kWh, PC Sub-critical Plant with CCS to be 139.0mills/kWh, PC Supercritical Plant without CCS to be 74.7 mills/kWh, and PCSupercritical Plant with CCS to be 135.2 mills/kWh. Cost information for otherpower generation technologies such as IGCC and NGCC can also be found withinthe reference document if the reader desires additional information.
References
1. Modified from Geological Survey Circular 891, Coal Resource Classification System ofthe U.S. Geological Survey (2003).
2. J. Tully, U.S. geological survey coal fields of the conterminous United States, DigitalCompilation, Open-File Report No. 96–92 (1996).
3. R. Flores, G. Stricker and S. Kinney, Alaska coal geology, resources, and coalbedmethane potential, U.S. Geological Survey, Report DDS-77 (2004).
4. National Energy Technology Laboratory. Geologic storage focus area. U.S. Departmentof Energy, Available at: http://www.netl.doe.gov/technologies/carbon seq/corerd/storage.html. Accessed 5 March 2012.
5. CO2 Utilization Focus Area. U.S. Department of Energy, National Energy TechnologyLaboratory. Available at: http://www.netl.doe.gov/technologies/carbon seq/corerd/co2utilization.html. Accessed 5 March 2012.
6. D. Damiani, J. Litynski, H. McIlvried, D.Vikara and R. Srivastava, The U.S.Department of Energy’s R&D program to reduce greenhouse gas emissions throughbeneficial uses of carbon dioxide. Published online at Wiley Online Library (wileyon-linelibrary.com). DOI: 10.1002/ghg.35.
7. J. Black, Cost and performance baseline for fossil energy plants Volume 1: Bituminouscoal and natural gas to electricity, Revision 2, November 2010. National Energy Tech-nology Laboratory. Available at: http://www.netl.doe.gov/energy-analyses/pubs/BitBase FinRep Rev2.pdf. Accessed December 2011.
The
Wor
ld S
cien
tific
Han
dboo
k of
Ene
rgy
Dow
nloa
ded
from
ww
w.w
orld
scie
ntif
ic.c
omby
MC
GIL
L U
NIV
ER
SIT
Y o
n 04
/21/
13. F
or p
erso
nal u
se o
nly.