Embed Size (px)
Citation preview

Overview of World Markets for HV Insulators & Bushings: 2015 to 2025
STEVE AUBERTIN
The World Market
for HV Insulators & Bushings
2015 ~ 2025
Presented by:-
Steve Aubertin
Goulden Reports
At INMR World Congress
Munich October 2015

THE WORLD MARKET FOR
INSULATORS
The following presentation is based on abstracts from Goulden Reports latest published report on world markets for insulators and bushings.

Long Term Global Insulator Market
0.0
1,000.0
2,000.0
3,000.0
4,000.0
5,000.0
6,000.0
7,000.0
2005 2010 2015 2020 2025
Valu
es i
n U
S$
Millio
n
Total World Insulator Market Over Time2005 to 2025
Total Market

Market Growth by Region 2015 - 2025
Region 2015 2020 2025Cagr %
Growth 2015 to 2020
Cagr % Growth 2020
to 2025
Asia 1,443.3 1,810.6 2,143.4 4.60% 3.40%
W Europe 1,333.9 1,432.4 1,520.2 1.40% 1.20%
N America 687.9 752.5 807.8 1.80% 1.40%
E Europe & FSU 613.0 687.3 753.0 2.30% 1.80%
Indian Sub-Con’t 332.3 454.1 570.2 6.40% 4.70%
S & C America 222.5 256.9 289.5 2.90% 2.40%
Middle East 171.5 187.7 203.9 1.80% 1.70%
Africa 148.6 183.4 214.1 4.30% 3.10%
Total 4,953.1 5,765.0 6,502.1 3.10% 2.40%

Market Evolution by Type
2005 to 2025
0
1,000
2,000
3,000
4,000
5,000
6,000
7,000
2005 2010 2015 2020 2025
Valu
es i
n U
S$
Millio
nThe World Insulator Market Evolution by
Type 2005 to 2025
Glass Ceramic Composite

World Market for HV Insulators
by Region 2010 ~ 2025
0
1,000
2,000
3,000
4,000
5,000
6,000
7,000
2010 2015 2020 2025
Market For HV Insulators by Region by YearValues in US$ Million
N America
S & C America
Asia
Indian Sub Continent
Middle East
Africa
E Europe & FSU
W Europe

Insulator Trade Trends
0
100,000
200,000
300,000
400,000
500,000
600,000
700,000
800,00019
78
19
79
19
80
19
81
19
82
19
83
19
84
19
85
19
86
19
87
19
88
19
89
19
90
19
91
19
92
19
93
19
94
19
95
19
96
19
97
19
98
19
99
20
00
20
01
20
02
20
03
20
04
20
05
20
06
20
07
20
08
20
09
20
10
20
11
20
12
20
13
Valu
es i
n U
S$ T
ho
usan
ds
World Insulator Exports 1978 to 2013Values in US$ Thousands
Glass Ceramic Composite
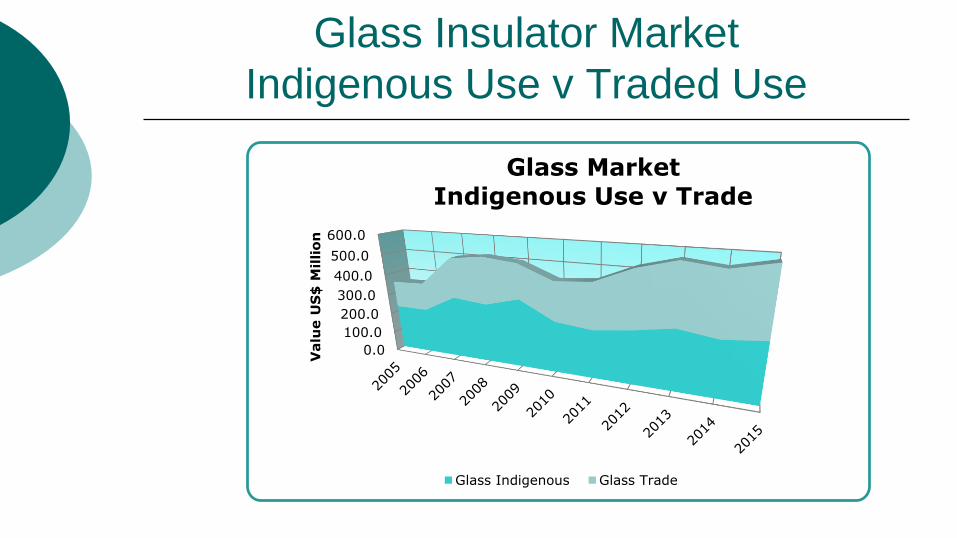
Glass Insulator Market
Indigenous Use v Traded Use
0.0
100.0
200.0
300.0
400.0
500.0
600.0
Valu
e U
S$
Millio
n
Glass Market Indigenous Use v Trade
Glass Indigenous Glass Trade
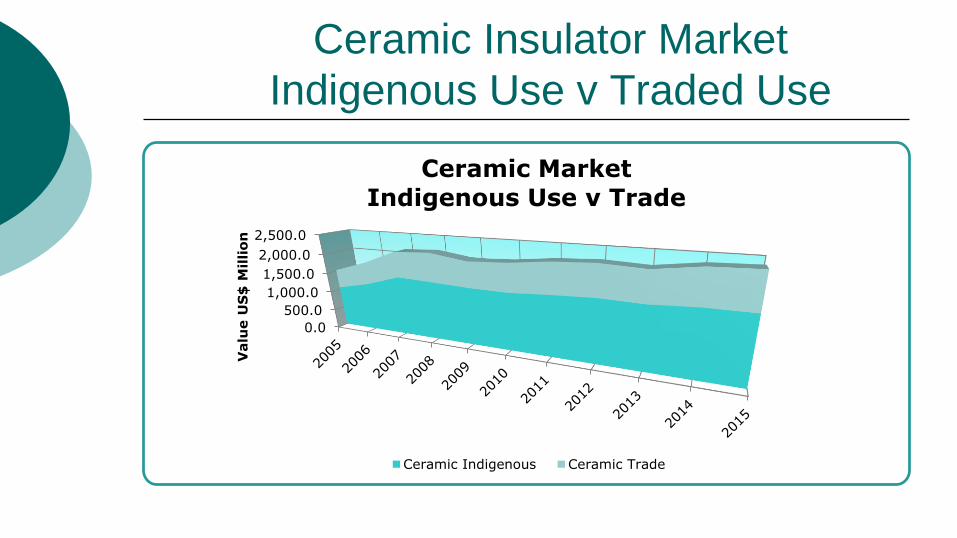
Ceramic Insulator Market
Indigenous Use v Traded Use
0.0
500.0
1,000.0
1,500.0
2,000.0
2,500.0V
alu
e U
S$
Millio
n
Ceramic MarketIndigenous Use v Trade
Ceramic Indigenous Ceramic Trade

Composite Insulator Market
Indigenous Use v Traded Use
0.0
500.0
1,000.0
1,500.0
2,000.0V
alu
e U
S$
Millio
n
Composite MarketIndigenous v Trade
Composite Indigenous Composite Trade

Glass Insulator Trade and Cost Trends
$0.00
$0.50
$1.00
$1.50
$2.00
$2.50
$3.00
$3.50
$4.00
$4.50
$0
$50,000
$100,000
$150,000
$200,000
$250,000
$300,000
19
90
19
91
19
92
19
93
19
94
19
95
19
96
19
97
19
98
19
99
20
00
20
01
20
02
20
03
20
04
20
05
20
06
20
07
20
08
20
09
20
10
20
11
20
12
20
13
Glass Insulators Export Values - $'000s and Costs $/kg
Trade Value
cost

Ceramic Insulator Trade and Cost Trends
$0.00
$0.50
$1.00
$1.50
$2.00
$2.50
$3.00
$3.50
$4.00
$4.50
$5.00
$0
$100,000
$200,000
$300,000
$400,000
$500,000
$600,000
$700,000
$800,000
19
90
19
91
19
92
19
93
19
94
19
95
19
96
19
97
19
98
19
99
20
00
20
01
20
02
20
03
20
04
20
05
20
06
20
07
20
08
20
09
20
10
20
11
20
12
20
13
Ceramic Insulators Export Values - $'000s and Cost $/kg
Trade Value
cost

Composite Insulator Trade and Cost Trends
$0.00
$5.00
$10.00
$15.00
$20.00
$25.00
$30.00
$0
$100,000
$200,000
$300,000
$400,000
$500,000
$600,000
$700,000
$800,000
19
90
19
91
19
92
19
93
19
94
19
95
19
96
19
97
19
98
19
99
20
00
20
01
20
02
20
03
20
04
20
05
20
06
20
07
20
08
20
09
20
10
20
11
20
12
20
13
Composite Insulators Export Values - $'000s and Cost $/kg
Trade Value
cost

THE WORLD MARKET FOR
BUSHINGS
We estimate that currently some 8% of insulator production is in-fed into the Bushings Market – principally ceramic and composite insulators

The Global Market for HV Bushings
2010 to 2015
0.0
500.0
1,000.0
1,500.0
2,000.0
2,500.0
2010 2011 2012 2013 2014 2015
Valu
e U
S$
Millio
nThe World Market for High Voltage Bushings
The World Market for High Voltage Bushings
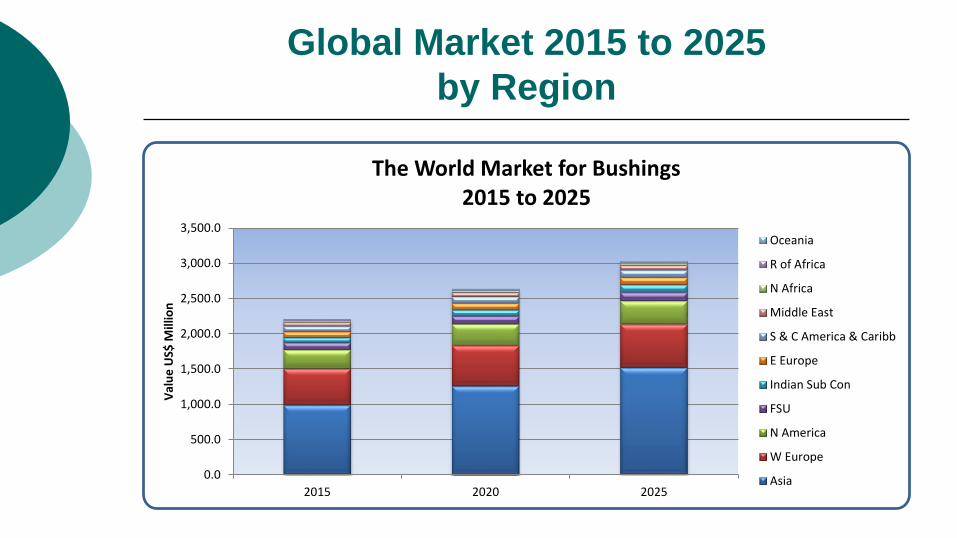
Global Market 2015 to 2025
by Region
0.0
500.0
1,000.0
1,500.0
2,000.0
2,500.0
3,000.0
3,500.0
2015 2020 2025
Val
ue
US$
Mill
ion
The World Market for Bushings2015 to 2025
Oceania
R of Africa
N Africa
Middle East
S & C America & Caribb
E Europe
Indian Sub Con
FSU
N America
W Europe
Asia

World Market for Bushings 2015By Region - Values in US$ Millions
RegionTransformer
BushingsSwitchgear Bushings
Other Bushings Total
Asia 392.6 496.5 98.7 987.9
W Europe 115.3 350.4 49.5 515.1
N America 94.3 146.0 26.4 266.7
FSU 30.7 62.3 10.1 103.1
E Europe 24.7 50.6 8.1 83.4
S & C America & Caribb 30.1 41.5 7.9 79.5
Indian Sub Con 29.1 31.8 6.8 67.7
Middle East 24.1 25.0 5.5 54.6
N Africa 5.1 14.1 2.0 21.2
R of Africa 10.7 4.0 1.7 16.5
Oceania 3.8 6.7 1.1 11.7
Total 760.4 1,229.1 218.0 2,207.5

THE END
THANK YOU FOR LISTENING
© Goulden Reports 2015
WWW.GOULDENREPORTS.ORG