Embed Size (px)
Citation preview

The Washington Region’s Demographics and Economy: Current Trends and Outlook
Jeannette Chapman Deputy Director and Senior Research Associate
Stephen S. Fuller Institute Schar School of Policy and Government
George Mason University
February 1, 2018
IREM 2018 Industry Forecast & Trade Show

Population Trends in the Washington
Region
1. The Washington Region is Aging.

-
100,000
200,000
300,000
400,000
500,000
< 5 5 - 9 10 -14
15 -19
20 -24
25 -29
30 -34
35 -39
40 -44
45 -49
50 -54
55 -59
60 -64
65 -69
70 -74
75+
Baby Boomers: 1.29M
Population by Age Group Washington Region, 1980
Sources: U.S. Census Bureau (1980 Census); The Stephen S. Fuller Institute at the Schar School, GMU

-
100,000
200,000
300,000
400,000
500,000
< 5 5 - 9 10 -14
15 -19
20 -24
25 -29
30 -34
35 -39
40 -44
45 -49
50 -54
55 -59
60 -64
65 -69
70 -74
75 -79
80 -84
85+
Baby Boomers: 1.57M Millennials:
581K
Population by Age Group Washington Region, 1990
Sources: U.S. Census Bureau (1990 Census); The Stephen S. Fuller Institute at the Schar School, GMU

-
100,000
200,000
300,000
400,000
500,000
< 5 5 - 9 10 -14
15 -19
20 -24
25 -29
30 -34
35 -39
40 -44
45 -49
50 -54
55 -59
60 -64
65 -69
70 -74
75 -79
80 -84
85+
Population by Age Group Washington Region, 2010
Sources: U.S. Census Bureau (2010 Census); The Stephen S. Fuller Institute at the Schar School, GMU
Baby Boomers: 1.50M
Millennials: 1.56M

0
100,000
200,000
300,000
400,000
500,000
< 5 5 - 9 10 -14
15 -19
20 -24
25 -29
30 -34
35 -39
40 -44
45 -49
50 -54
55 -59
60 -64
65 -69
70 -74
75 -79
80 -84
85+
Population by Age Group Washington Region, 2015
Sources: U.S. Census Bureau (v2016 Population Estimates); The Stephen S. Fuller Institute at the Schar School, GMU
Baby Boomers: 1.43M
Millennials: 1.70M

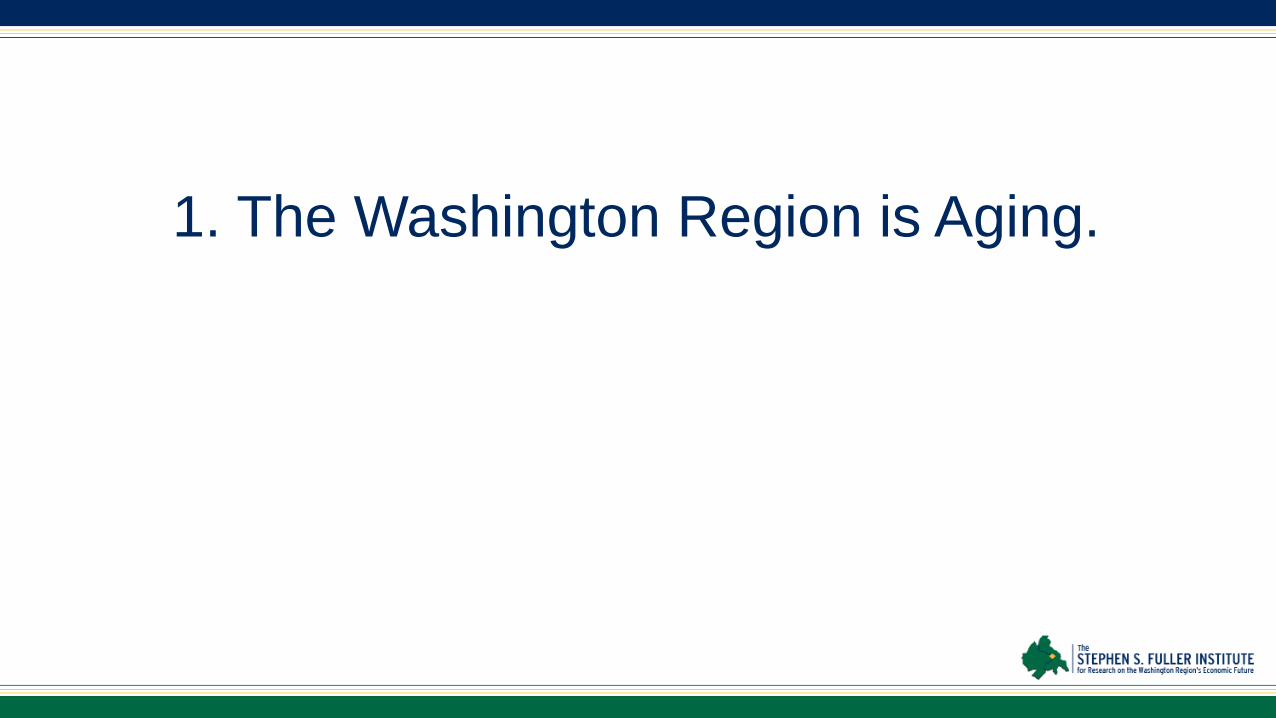
2. The Region Attracted Millennials But May Not Be Able to Keep Them.

6.9%
5.6% 4.9% 4.7% 4.4% 4.3% 3.9% 3.8%
3.1% 2.6%
2.3% 1.7% 0.6%
-0.7% -0.7% -2.0%-1.0%0.0%1.0%2.0%3.0%4.0%5.0%6.0%7.0%8.0%
U.S. Increase = 2.8%
Percent Change in Population Aged 25-34 15 Largest Metros, 2014 - 2016
Sources: U.S. Census Bureau (v2016 Population Estimates); The Stephen S. Fuller Institute at the Schar School, GMU
- 5,000
10,000 15,000 20,000 25,000 30,000 35,000 40,000
<5 5-9 10-14 15 -19
20 -24
25 -29
30 -34
35 -39
40 -44
45 -49
50 -54
55 -59
60 -64
65 -69
70 -74
75 -79
80 -84
85+
In-Migrant Out-Migrant
Domestic Migration by Age Group Washington Region, 2013-2015 Average
Sources: 2013, 2014, 2015 ACS Microdata (Average); The Stephen S. Fuller Institute at the Schar School, GMU

3. Population Growth is Slowing.

(60.0)
(40.0)
(20.0)
-
20.0
40.0
60.0
80.0
100.0
120.0
2001 2002 2003 2004 2005 2006 2007 2008 2009 2010 2011 2012 2013 2014 2015 2016
Net DomesticMigration
Net InternationalMigration
Natural Increase
Total
Population Growth By Component Change Washington Region (in 000s)
Sources: U.S. Census Bureau (Intercensal, v2009 and v2016 Population Estimates); The Stephen S. Fuller Institute at the Schar School, GMU

0.0%
0.5%
1.0%
1.5%
2.0%
2.5%
2001 2002 2003 2004 2005 2006 2007 2008 2009 2010 2011 2012 2013 2014 2015 2016 2017 2018 2019 2020 2021
Population Growth Washington Region, 2001-2021
Sources: IHS Economics; The Stephen S. Fuller Institute at the Schar School, GMU
Forecast

200,100
92,700
27,900 27,200
0
50,000
100,000
150,000
200,000
Head of OwnHousehold
Livingw/Spouse/Partner
Living w/ Relative(s) Living w/Roommate(s)
25-34 Year Olds Earning $60,000+ Greater Washington Region, 2015
Sources: U.S. Census Bureau (2015 ACS Microdata); The Stephen S. Fuller Institute at the Schar School, GMU
15.8% of 25-34 Year Olds Earning $60,000 are not in
their own household

Economic Trends in the Washington Region

1. Strong Job Growth Characterized by Weak Office-Using, High-Value Job Growth

117.2
41.3
8.9
55.1 70.5 64.5
52.0
24.7 13.4
-50.4
11.4
43.4 39.9 28.1 18.6
57.7 55.6 56.6
(60.0) (40.0) (20.0)
- 20.0 40.0 60.0 80.0
100.0 120.0 140.0
2000-2017 Avg: +39,360
Job Change in the Washington Region 2000 – 2017 (in thousands)
Sources: U.S. Bureau of Labor Statistics (Not Seasonally Adjusted), The Stephen S. Fuller Institute at the Schar School, GMU

55,100 56,530
32,450
15,620
-
10,000
20,000
30,000
40,000
50,000
60,000
2003 2017*
All Jobs Office-Using Jobs
Private Sector, Traditional Office-Using Job Change Washington Region, 2003 and 2017
Sources: U.S. Bureau of Labor Statistics (Not Seasonally Adjusted), The Stephen S. Fuller Institute at the Schar School, GMU
~ 6.5M SF
~ 3.2M SF

-0.1 -0.2
2.1 -2.6
2.5 0.7
2.3 4.1
13.1 5.7
-0.4 13.0
16.3
-30 -20 -10 0 10 20 30
ManufacturingWholesale Trade
Transportation & UtilitiesInformation
ConstructionFinancial Activities
Other ServicesRetail Trade
Leisure & HospitalityState & Local Govt
Federal GovtEdu.& Health Services
Prof. & Business Services
Washington MSA Job Change by Sector 2016 – 2017
Ranked by Size in 2016 (000s) Total = 56,500
Sources: U.S. Bureau of Labor Statistics (Seasonally Adjusted), The Stephen S. Fuller Institute at the Schar School, GMU

2. The Washington Region Remains Overly Dependent on the Federal Government.

2017 Structure of the Washington Region Economy
Local Serving Activities
38.0%
Non-Local Serving
Business 15.2%
Other Federal
8.9% Fed Wages &
Salaries 7.5%
Procurement 13.5%
Total Federal 29.9%
Source: The Stephen S. Fuller Institute at the Schar School, GMU

-3-2-10123456
Washington
U.S.
U.S. GDP and Washington MSA GRP 2007 – 2016 (Annual % Change)
(%)
Sources: U.S. Bureau of Economic Analysis, IHS Markit, The Stephen S. Fuller Institute at the Schar School, GMU Forecast as of January 2018
U.S. Recession Sequestration
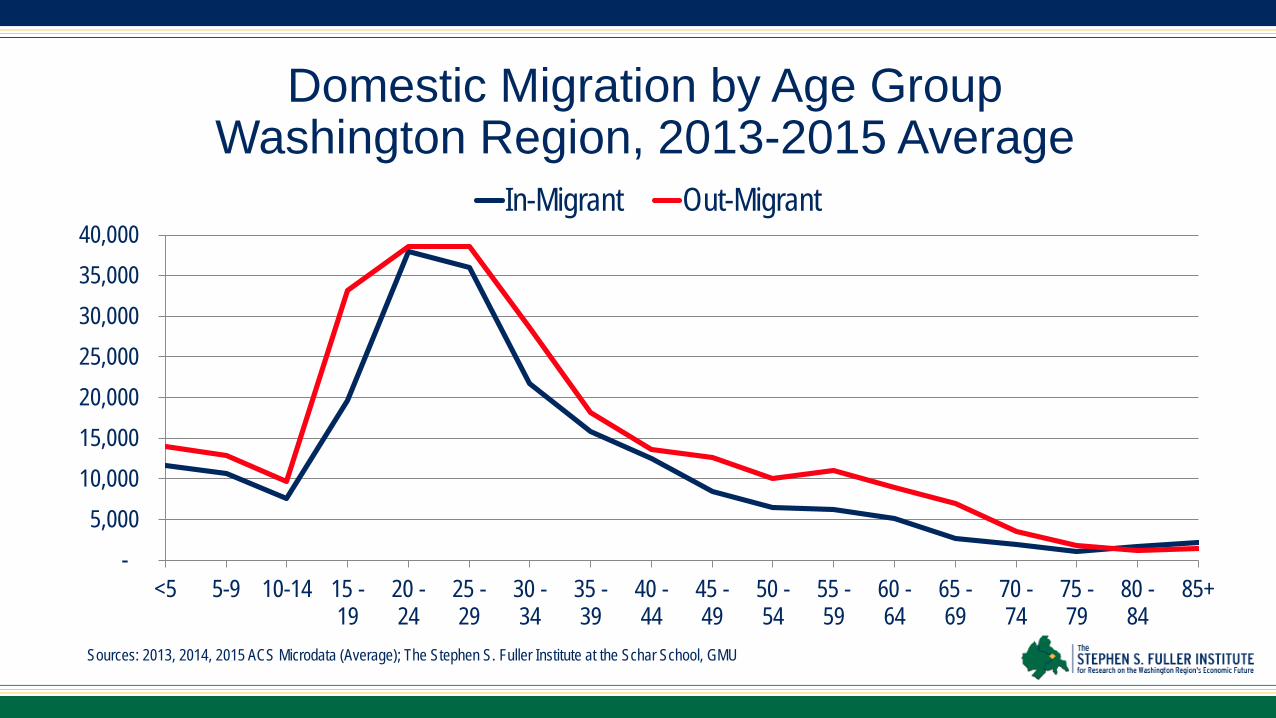
1.4%
-0.8%
2.3%
-1.2%
1.4%
3.3%
8.0%
1.5%
3.4%
0.9%
3.7%
-0.8%
0.9%
2.6%
6.4%
2.5%
-2%
0%
2%
4%
6%
8%
10%
Info. Comm.Tech.
Science &Security Tech.
BusinessServices
Media & Info. Advocacy Business &Leisure Travel
Bio. & HealthTech.
All Clusters
Washington U.S.
Underperforming the Nation Outperforming the Nation
Growth Rates of the Washington Region’s Advanced Industrial Clusters
June 2014 to June 2017, Annualized Growth
Sources: U.S. Bureau of Labor Statistics (QCEW), The Stephen S. Fuller Institute at the Schar School, GMU

3. The Washington region’s high cost of living and quality of life issues have made it less
competitive with its peers.

-19.3% -18.9% -18.4% -16.0% -15.3% -14.0%
-12.2% -10.7% -10.3%
-8.1% -7.4%
-1.3%
2.4% 2.4%
-16.0%
-25.0%
-20.0%
-15.0%
-10.0%
-5.0%
0.0%
5.0%
Percent Difference in Price Level Compared to the Washington Region, 2015
Sources: U.S. Bureau of Economic Analysis; The Stephen S. Fuller Institute at the Schar School, GMU

50.2% 48.5% 46.9% 42.0% 40.5% 39.0% 37.7% 37.2% 36.7% 33.9% 33.5% 32.0% 30.8% 30.5% 30.4%
0.0%
10.0%
20.0%
30.0%
40.0%
50.0%
60.0%
Percent of Residents with a Bachelor’s Degree or Higher, 2016
Sources: U.S. Census (2016 1-Year ACS); The Stephen S. Fuller Institute at the Schar School, GMU

The Economic Outlook

24.7 13.4
-50.4
11.4
43.4 39.9 28.1
18.6
57.7 55.6 56.5 47.4
38.2 31.8 27.4
(60.0)
(40.0)
(20.0)
-
20.0
40.0
60.0
Job Change in the Washington Region 2007 – 2017 – 2022 (in thousands)
Sources: U.S. Bureau of Labor Statistics (Not Seasonally Adjusted), IHS Markit, The Stephen S. Fuller Institute at the Schar School, GMU *Preliminary
Forecast>>>

10.9 4.0
-19.3
1.5
15.7 15.3
3.8 1.4
19.5 21.9 15.6
25.3 27.1 23.0
19.0
(30.0)
(20.0)
(10.0)
-
10.0
20.0
30.0
40.0
Private Sector, Traditional Office-Using Job Change Washington Region 2007 – 2017 – 2022 (in thousands)
Sources: U.S. Bureau of Labor Statistics (Not Seasonally Adjusted), IHS Markit, The Stephen S. Fuller Institute at the Schar School, GMU *Preliminary
Forecast>>>

1. FY 2018 Federal Budget
2. Federal Shutdowns
3. The Next Nestle, Discovery, Amazon, Apple
4. The National/International Business Cycle
5. Unknown Unknowns?
Wildcards in 2018

Thank You
For monthly reports on the Washington region’s economic performance go to
sfullerinstitute.gmu.edu
@FullerInstitute