Embed Size (px)
Citation preview

The use of geospatial technologies to monitor surface water
Department of Zoology, UNH Cooperative ExtensionCenter for Freshwater Biology, University of New Hampshire
NEAEB Annual Meeting, March 29-31, 2006
Shane Bradt

• What are geospatial technologies?
• “Hypothetical” situations for using GST to monitor surface waters
• Where did these ideas come from?
• Any other ideas . . .

Geographic Positioning System (GPS)
Geographic Information System (GIS)
Remote Sensing (RS)

How does GPS work?How does GPS work?
Earth
Space
1. The receiver picks up the signals from the satellites
GPS

How does GPS work?How does GPS work?
Earth
Space
2. Travel time of signal from satellite used to calculate distance
0.075 sec = 14,000 mi
0.059 sec = 11,000 mi
0.07
0 se
c =
13,0
00 m
i
0.065 sec = 12,000 mi
3. Receiver triangulates to determine position of the receiver
GPS

How does GPS work?How does GPS work?
3. Receiver triangulates to determine position of the receiver
GPS

How does GPS work?How does GPS work?
3. Receiver triangulates to determine position of the receiver
GPS

How does GPS work?How does GPS work?
3. Receiver triangulates to determine position of the receiver
GPS

How does GPS work?How does GPS work?
3. Receiver triangulates to determine position of the receiver
You are
here!
GPS

Geographic Positioning System (GPS)Points, Lines, Areas

Chemical, Physical and
Biological Activities
RS

Visual representation Thematic representation
RS

Geographic Positioning System (GPS)
Remote Sensing (RS)
Points, Lines, Areas
Imagery, Topography

Remote SensingGPS
GIS Data Sources
Paper Maps
GIS

What makes GIS work?
• GIS SOFTWARE - Stack different data layers• GIS SOFTWARE - Knows how features are
related to each other spatially
GIS
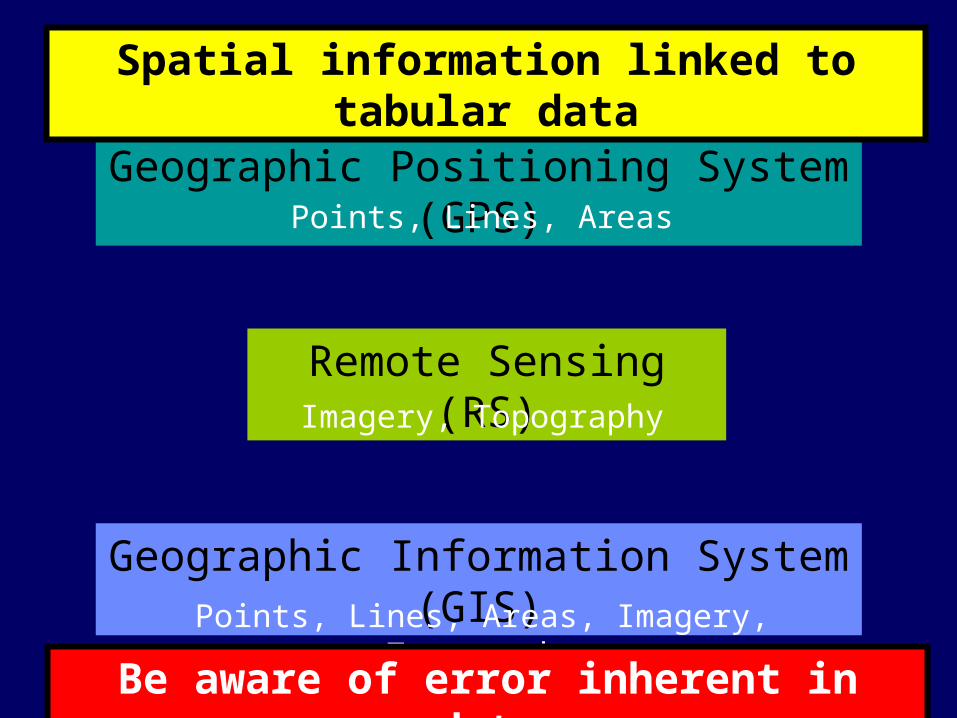
Geographic Positioning System (GPS)
Geographic Information System (GIS)
Remote Sensing (RS)
Points, Lines, Areas
Imagery, Topography
Points, Lines, Areas, Imagery, Topography
Spatial information linked to tabular data
Be aware of error inherent in data

Questions you need to ask yourself
• What is your goal? – Monitor many lakes over long time scales
• What features would you like to monitor?– Water clarity
• How frequently do you need measurements?– Several times a year
• What is the spatial scale you need?– 30 meters

• What is your goal? – Monitor many lakes over long time scales
• What features would you like to monitor?– Water clarity
• How frequently do you need measurements?– Several times a year
• What is the spatial scale you need?– 30 meters
“Hypothetical” situation #1

Long term change – Secchi disk depth
Landsat TM
GISGPSRS

Long term change – Secchi disk depth
Landsat TM
GISGPSRS

Long term change – Secchi disk depth
Landsat TM
GISGPSRS

• What is your goal? – Detail water quality a single large lake
• What features would you like to monitor?– Chlorophyll
• How frequently do you need measurements?– Once
• What is the spatial scale you need?– 1 km
“Hypothetical” situation #2

(g l-1)
GISGPSShort term: chlorophyll

Chl 2 Chl 3
Short term: chlorophyll
Chl 1
MODIS
GISGPSRS

Long term: chlorophyll GISGPSRS

2 Jun 05
Chlorophyll data from lake collections
Method for determiningchlorophyll from satellite
18 May 05 7 Jun 05 9 Jun 05 14 Jun 05 17 Jun 0526 May 0513 May 058 May 05
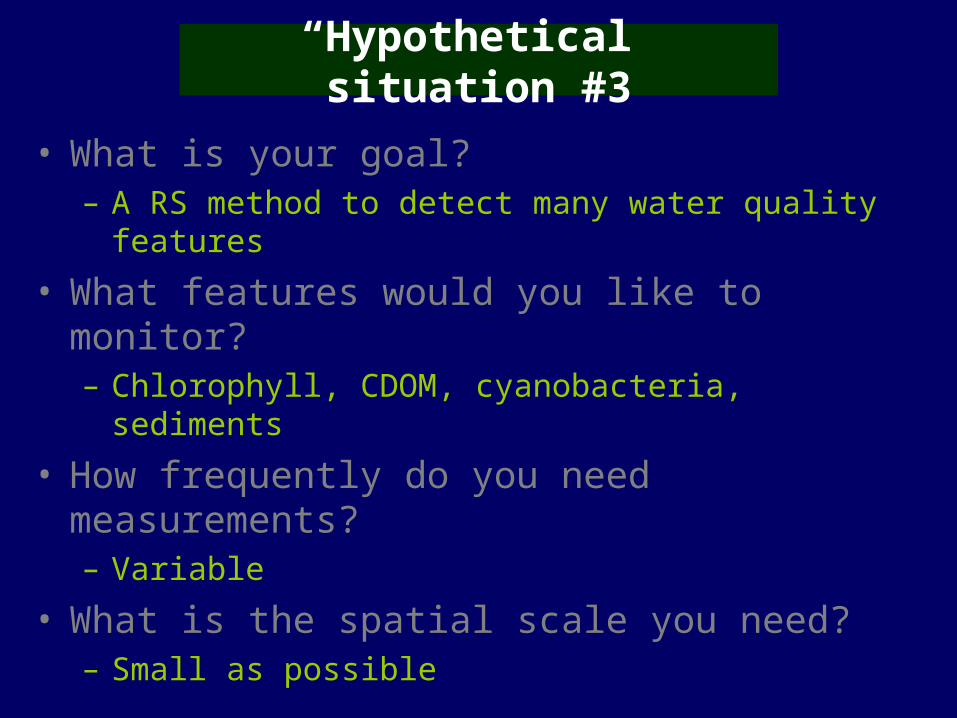
• What is your goal? – A RS method to detect many water quality features
• What features would you like to monitor?– Chlorophyll, CDOM, cyanobacteria, sediments
• How frequently do you need measurements?– Variable
• What is the spatial scale you need?– Small as possible
“Hypothetical” situation #3

Wavelength (nm)
400 450 500 550 600 650 700 750
Ref
lect
ance
0
2
4
6
8
10
12FB-12 FB-1 S-1 S-14
DRS on-lake
GPSRSShort term: chl, phyco, CDOM, sediments

0.000
0.005
0.010
0.015
0.020
0.025
0.030
0.035
400 425 450 475 500 525 550 575 600 625 650 675 700 725
Wavelength (nm)
Rrs
PhycocyaninFluorescence
ScatteringCDOM
Chlorophyll a PhycocyaninFluorescence
ScatteringCDOM
Chlorophyll a
Chl a = 61.9 g l-1
SDD = 0.6 mCDOM = 28.4 CPU
Chl a = 1.4 g l-1
SDD = 6.4 mCDOM = 7.4 CPU
Short term: chl, phyco, CDOM, sediments GPSRS

Wavelength (nm)
400 450 500 550 600 650 700 750
Ref
lect
ance
0
1
2
3
4
5
6
7
8
Wavelength (nm)
400 450 500 550 600 650 700 750
Re
fle
cta
nc
e
0
2
4
6
8
10
12
Wavelength (nm)
400 450 500 550 600 650 700 750
Re
fle
cta
nc
e
0
2
4
6
8
10
Wavelength (nm)
400 450 500 550 600 650 700 750R
efl
ec
tan
ce
0
2
4
6
8
10
12
Short term: chl, phyco, CDOM, sediments GISGPSRS

• What is your goal? – Describe watershed characteristics for a water body
• What features would you like to monitor?– Watershed extent, landcover, soils, topography
• How frequently do you need measurements?– Every few years
• What is the spatial scale you need?– Depends on feature
“Hypothetical” situation #4

Topography: DEM GISRS

Hillshade: DEM GISRS

Topography: DEM GISRS

Watershed: DEM GISRS

Slope: DEM GISRS

Severe slope: DEM GISRS

Landcover: Landsat GISRS GPS

Impervious surfaces: Landsat GISRS

Impervious surfaces: Landsat GISRS

Soils: Soil Surveys GIS

Where did I get these ideas?• Introduction:
– UNH Cooperative Extension – Myself, Jeff Schloss
• Hypothetical #1: Monitor water clarity in many lakes – Upper Midwest Regional Earth Science Applications Center
(Minnesota, Michigan and Wisconsin)
• Hypothetical #2: Monitor chlorophyll in a large lake– My PhD research, USGS Salt Lake City, Utah State University
• Hypothetical #3: RS method of describing lakes– My PhD research, University of Nebraska Lincoln, EPA Region 1
• Hypothetical #4: Describing watershed features– UNH Cooperative Extension GIS course – Watershed Analysis using Spatial Analyst in ArcGIS 9.1

Your turn . . .


![resultadogeneral unh 2012[1]](https://img.dokumen.tips/doc/110x75/543a9b2fafaf9fc66f8b4701/resultadogeneral-unh-20121.jpg)