Embed Size (px)
Citation preview

The Use of External Performance Expectations in the Target Setting of
Executive Annual Bonus Contracts
Sewon Kwon
Lecturer
Seoul National University
E-mail: [email protected]
Sunhwa Choi
Assistant Professor
Lancaster University and Sungkyunkwan University
E-mail: [email protected]
Sunyoung Kim
Assistant Professor
Monash University
E-mail: [email protected]
Jae Yong Shin
Professor
Seoul National University
E-mail: [email protected]
January 11, 2018
We are grateful for helpful comments from Tae-Sik Ahn, In Gyun Baek, Clara Xiaoling Chen, Francesca Cornelli,
Jae Eun Choi, Zhaoyang Gu, Christian Hofmann, Iny Hwang, Kyung Won Kim, Woo-Jong Lee, Michal Matějka,
Tae-Young Paik, Emma Peng, Jason Schloetzer, Philip Shane, Jee Eun Shin, Seung-Weon Yoo, Dae-Hee Yoon, and
participants at the 2016 Korean Accounting Association Seminar on Accounting Research, the 2016 Korean
Accounting Association Annual Meeting, the 2016 Asia-Pacific Management Accounting Research Symposium
(AMARS), the 2016 American Accounting Association Annual Meeting, the 2017 Management Accounting Section
Midyear Meeting, and the Monash University 2017 Brown Bag Seminar. This paper is based on Sewon Kwon’s
doctoral dissertation completed at Seoul National University.

The Use of External Performance Expectations in the Target Setting of
Executive Annual Bonus Contracts
ABSTRACT
Although anecdotal evidence suggests that externally informed approaches are increasingly used in target-
setting practices, only limited evidence in the literature addresses what types of external information
sources are used in target setting. We examine how externally informed performance expectations, such
as analysts’ annual earnings forecasts, influence target setting for executive bonus contracts. Using
performance target data from S&P 1500 firms, we find that analyst earnings forecasts are positively
associated with firms’ bonus target revisions and that target accuracy improves with the incorporation of
analyst forecasts into target setting. Furthermore, we find that the use of analyst forecasts in target setting
is more pronounced when the forecasts are more informative about future firm performance and when
they are less likely to be influenced by managers. Our results are robust to a battery of sensitivity tests.
Keywords: Executive compensation; external performance expectations; annual bonuses; analyst
forecasts; performance targets
Data Availability: Data are available from public sources indicated in the text.

1
1. Introduction
Performance targets are a key component of firms’ management control and compensation systems,
because how firms set targets and revise them over time affects executives’ incentives (Indjejikian and
Nanda 2002). To optimally motivate a firm’s executives, their performance targets should reflect the best
estimate of expected performance that can be achieved with adequate levels of effort (Van der Stede 2000).
Firms rely on various sources of information when setting and revising targets because information
asymmetry between firms and managers makes it difficult for firms to set accurate targets (Indjejikian and
Nanda 2002, Indjejikian et al. 2014b, Bouwens and Kroos 2017).
Research on target setting shows that past performance is an important source of information used
to set targets. Firms typically revise targets upward following favorable performance and downward
following unfavorable performance; this practice is called “target ratcheting” (Weitzman 1980). The
literature notes that the use of past performance in target setting introduces a dynamic incentive problem
known as the “ratchet effect,” because target ratcheting motivates managers to withhold effort in the current
period to avoid higher targets in the future (Leone and Rock 2002, Bouwens and Kroos 2011).
Because the use of past performance in target setting introduces complex incentive effects and its
ability to predict future performance is limited, past performance is usually complemented by other sources
of information (Indjejikian et al. 2014b). However, the academic literature on target setting provides only
limited evidence on the use of these other sources of information. Using data from a retail travel company,
Aranda et al. (2014) provide evidence that firms use peer performance information in target setting.
Bouwens and Kroos (2017) show that firms incorporate non-financial information, such as customer service,
in target setting. Based on survey data, Dekker et al. (2012) report that internal planning information is
widely used in target setting and that the use of internal benchmarking (i.e., the comparison of units within
the firm) and external benchmarking (i.e., comparison between firms) is relatively limited.
Although these findings provide insight into how firms use information sources other than past
performance in target setting for the business units of an organization (Aranda et al. 2014, Bouwens and

2
Kroos 2017) or for middle-level managers (Dekker et al. 2012), the literature has not yet fully explored the
use of alternative information sources in target setting for executive compensation contracts at the largest
firms, due to a lack of publicly available data on performance targets.
Theories and anecdotal evidence suggest that externally informed approaches can be useful in target
setting. Using targets based on external standards that are not affected by managers can mitigate the ratchet
effect because managers would not be able to affect next-period targets by manipulating current
performance (Murphy 2000). In addition, external sources can provide incremental information that is not
available from internal sources (Indjejikian et al. 2014b) and thus improve target accuracy. Recent studies
provide empirical evidence that peer performance, one type of external standards, is used for target setting
for divisions within a firm (Aranda et al. 2014, Bol and Lill 2015). Anecdotal evidence also supports the
use of externally informed approaches in target setting. For example, the 2007 survey by Mercer (2009)
indicates that 55% of participating firms use “externally informed absolute” numbers to set short-term
incentive targets.
In this study, we focus on the use of externally informed performance expectations to set targets for
executive annual bonus contracts. Performance expectations by external parties provide independent and
direct estimates of firm-specific performance, and reflect an additional information set of external parties
that provide the estimates. External performance expectations are readily available for public firms in the
form of analyst earnings forecasts. Thus, in the target setting of senior executives of public firms, external
performance expectations provide useful information that is independent, informative, and less costly to
obtain (Holmstrom 1979, Murphy 2000).
We examine whether firms use external performance expectations to revise targets in executive
bonus contracts by analyzing the performance target data from S&P 1500 firms, collected from the
compensation discussion and analysis (CD&A) section of their proxy statements. We focus on earnings per
share (EPS) targets in executive annual bonus contracts because EPS is the most widely used performance
measure (Graham et al. 2005). As an empirical proxy for external performance expectations, we use the

3
consensus of analysts’ annual earnings forecasts that are available before the approval date of the annual
bonus plan.
Using a sample of 1,179 firm-year observations for fiscal years 2006 through 2014, we find a
significant association between analyst forecasts and firms’ bonus target revisions, after controlling for past
performance, peer performance, expected growth, the presence of management forecasts, and other control
variables (Aranda et al. 2014, Indjejikian et al. 2014b, Kim and Shin 2017). This finding suggests that firms
use analyst forecasts as an important external information source in revising bonus targets. Furthermore,
using a test suggested by Bouwens and Kroos (2017), we provide evidence that incorporating analyst
forecasts into target setting improves target accuracy.
Next, we conduct two cross-sectional tests to examine under what circumstances the use of external
performance expectations in target setting is more pronounced. Based on the theory that the relative weight
on each information source in target setting depends on its informativeness about the agent’s actions and
the extent to which the information is influenced by managers (Holmstrom 1979, Murphy 2000), we predict
that firms place more emphasis on external performance expectations in target setting when they are more
informative about future firm performance (Murphy 2000, Ittner et al. 2003, Bouwens and Kroos 2017) and
when they are less likely to be influenced by managers (Murphy 2000). By using analysts’ forecast errors,
forecast dispersion, the number of analysts following a firm, and the correlation between a firm’s
performance and the gross domestic product (GDP) (Hutton et al. 2012) as proxies for the informativeness
of analyst forecasts, we find that the use of analyst forecasts in target setting increases when analyst forecast
errors are low, when forecasts are less dispersed, when the number of analysts following the firm is high,
and when firm performance is strongly correlated with GDP. These findings support the value of external
performance expectations that are informative about future firm performance.
In addition, using the subsample of firms for which EPS forecasts of both affiliated analysts (i.e.,
those with an investment banking relationship with the firm) and unaffiliated analysts exist, we find that
firms put more weight on the forecasts of unaffiliated analysts in target setting than on the forecasts of

4
affiliated analysts. We also provide evidence that the weight on analyst forecasts issued before management
forecasts is greater than the weight on analyst forecasts issued after management forecasts. These findings
are consistent with the notion that firms’ use of external performance expectations is more pronounced
when they are less likely to be influenced by managers. Overall, our main findings suggest that firms’ use
of external performance expectations in target setting varies in a manner consistent with the economic
theory on target setting (Murphy 2000).
A potential alternative explanation for our main findings is that they merely reflect the effect of
internal planning information that has been communicated to both analysts and compensation committees.
To check this possibility, we conduct several tests using management forecasts as a proxy for internal
planning information. The results of these tests show that our main findings hold even after controlling for
the information in management forecasts, suggesting that they are not driven by the effect of management
forecasts on analyst forecasts. Another potential concern is that our results may reflect that analysts revise
their forecasts based on information about internal bonus targets (i.e., reverse causality).1 However, we find
no evidence that analysts revise their forecasts around the approval date of the bonus plan, mitigating the
concern about reverse causality. We also examine whether the use of analyst forecasts varies depending on
managers’ incentives to meet or beat analysts’ expectations (i.e., equity incentives) and find no evidence
supporting this argument. Our results are robust to a battery of robustness checks.
We make several contributions to the literature on target setting. First, by providing large sample
empirical evidence on the use of externally informed performance expectations in target setting, we respond
to a call for research by Indjejikian et al. (2014b) to examine the use of externally informed performance
targets in recent target-setting practices. We predict and find that external performance expectations, such
as analyst forecasts, can convey information not captured by past performance and peer performance and
1 Our use of analyst forecasts issued before the approval date of the annual bonus plan in the empirical tests mitigates
this concern. Furthermore, bonus plan details are not typically publicly available until proxy statements are disclosed.
Nevertheless, managers may communicate this information to analysts before the approval date of the bonus plan (e.g.,
through management forecasts) to manage market expectations and to make it easier to beat the forecasts. We explore
these possibilities in Sections 6.1 and 6.2.

5
that they are incorporated in firms’ target setting process. Furthermore, we provide empirical evidence that
firms’ use of external performance expectations systematically varies as predicted by the economic theory
on target setting (Murphy 2000). Like Bouwens and Kroos (2017), who document the use of non-financial
information in setting financial targets, we extend previous research that has exclusively focused on past
performance and peer information as the sources of information in target setting.
Second, we use data on the performance targets of large U.S. public firms to shed light on how
external information is incorporated into their target-setting processes for CEOs’ annual bonus plans. While
a growing body of research provides evidence that various information sources, such as peer performance,
are used to set targets for business units (Aranda et al. 2014, Bol and Lill 2015, Bouwens and Kroos 2017),
it is still unclear whether these earlier findings hold true for the target setting of top executives of public
firms. For example, whereas the benefit of internal benchmarking is clear for business units conducting
homogeneous business, the value of external benchmarking is questionable due to limited data on industry
peer performance and the subjective nature of peer group selection (Hansen et al. 2003, Dekker et al. 2012).
Furthermore, the information set available for public firms is different from that for business units,
suggesting that different approaches are warranted for public firms. For example, analyst forecast
information is available only at the firm level, not at the business unit level. Based on a large cross section
of firms, we provide new evidence on the use of external performance expectations to set targets for
executive bonus contracts in public firms.
Finally, we enhance the understanding of the relation between internal and external performance
targets. Previous research has generally assumed that firms consider internal targets (for bonus
determination) and external targets (for meeting market expectations) separately, with little interaction
between the two.2 For example, Matsunaga and Park (2001, p. 314) argue, “The effect of missing a quarterly
earnings benchmark on a CEO’s bonus is likely to result from the compensation committees’ exercise of
2 The CFOs surveyed in Graham et al. (2005) indicate that firms set higher internal targets than external targets to
ensure that the latter are not difficult to attain. However, Armstrong et al. (2017) report that external targets exceed
internal EPS targets in 60% of their sample.

6
their discretion in the allocation of the bonus pool, as opposed to the benchmark’s being an explicit
component of the plan.” However, our evidence that firms update their internal bonus targets based on
external targets suggests that firms ex ante incorporate the information about external benchmarks into an
internal target-setting process, rather than making discretionary adjustments ex post. In a contemporaneous
study, Armstrong et al. (2017) also examine the interaction between internal and external EPS goals as a
source of CEO incentives. They find that external EPS goals provide CEOs with stronger incentives than
internal EPS goals because of CEOs’ significant equity-based incentives to meet analysts’ expectations. Our
study is different from that by Armstrong et al. (2017) in that our focus is on the target setting process,
whereas Armstrong et al. (2017) focus on the relative incentive effects of external and internal targets on
CEO behaviors. We consider external targets (i.e., external performance expectations) as an alternative
source of information that can be used in setting internal targets to improve the efficiency of target setting.
In contrast, Armstrong et al. (2017) emphasize the role of external targets in the context of meeting or
beating analyst forecasts in the capital market. We thus believe that our study complements their findings
in improving the understanding of the interaction between internal and external targets.
The remainder of this paper proceeds as follows. Section 2 reviews the literature and develops the
hypotheses. Section 3 describes the research design and sample. Section 4 presents the descriptive statistics.
Section 5 reports the empirical results. Section 6 contains additional analyses. Section 7 concludes.
2. Related Literature and Hypothesis Development
Performance targets serve as an important basis for business decision making, such as choosing
investments and evaluating performance (Ittner and Larcker 2001). The goal of performance targets in
incentive contracts is to provide managers with incentives to increase firm value while simultaneously
compensating them competitively (Murphy 2000). Therefore, setting appropriate performance targets is
important to optimally motivate managers. Given the information asymmetry between firms and managers,
firms can improve their contracts by fully exploiting various sources of information to set adequate
performance targets (Indjejikian and Nanda 2002, Indjejikian et al. 2014b, Bouwens and Kroos 2017). For

7
example, firms strive to improve the accuracy of targets, because more accurate performance standards (i.e.,
those with less deviation from actual performance) reduce managers’ compensation risk and increase their
motivation, thereby improving the efficiency of incentive contracts (Murphy 2000). Prior research shows
that firms can improve target accuracy by incorporating all available information when setting performance
standards (Indjejikian and Nanda 2002, Bouwens and Kroos 2017).
Murphy (2000) suggests that firms determine the relative weight on each source of information in
target setting based on the three criteria: the information collection cost, the ability to predict future
performance (i.e., accuracy or informativeness), and the extent to which managers can influence the
information. We begin by discussing each possible source of information, such as past performance, based
on the prior target setting literature and then develop our hypotheses on the use of external performance
expectations in target setting based on Murphy’s (2000) theoretical framework.
The literature identifies past performance, internal planning, and benchmarking information as
important information sources in target setting (Dekker et al. 2012). Past performance information is widely
used for target setting because it is readily available and informative about future performance. Target
ratcheting occurs when firms revise targets upward following favorable performance and downward
following unfavorable performance (Weitzman 1980). The magnitude of the target adjustment made after
a favorable performance variance is usually greater than the target adjustment made after the same
magnitude of an unfavorable performance variance, suggesting an asymmetry in ratcheting (Leone and
Rock 2002, Kim and Shin 2017). Target ratcheting has negative incentive effects because managers are
motivated to withhold their effort in the current period to avoid difficult targets in the future (i.e., the ratchet
effect). Consistent with this argument, Bouwens and Kroos (2011) show that retail store managers with
favorable performance in the first three quarters reduce their sales activity in the fourth quarter, suggesting
that managers manipulate real economic activities in the current period to influence future targets.3
3 Firms can mitigate the ratchet effect by making a contractual commitment to disregard information about past
performance when setting future targets (Laffont and Tirole 1993). Consistent with this argument, empirical studies

8
Past performance is typically complemented by internal planning information (e.g., firms’ business
plans and budgets). Internal planning information is potentially more informative about future performance
than past performance because it incorporates managers’ forward-looking information. Consistent with this
conjecture, Dekker et al. (2012) report that internal planning information is widely used in target setting to
complement past performance information. However, internal planning information is subject to
manipulation and game playing because managers themselves determine it. For example, Anderson et al.
(2010) document that when a performance-based bonus plan with participative goal setting was introduced
in the stores of a U.S. retail firm, managers set lower goals and tended to just meet the targets. In addition,
as internal planning information is typically used for multiple purposes, such as coordinating, planning, and
evaluating performance, it is not clear whether this information reflects the best (unbiased) estimate of
future performance, which is required for optimal target setting for incentive contracts.
External information sources that are not affected by managers can be useful in target setting
because using external information in target setting mitigates the negative incentive effect of target
ratcheting. Managers would have no incentive to manage current performance to achieve easy future targets
when the next-period target is determined by external standards. Consistent with this argument, Murphy
(2000) reports that firms with externally determined performance standards (e.g., standards based on the
performance of external peer groups, timeless standards, and standards based on the cost of capital) are less
likely to smooth earnings than firms with internally determined standards (e.g., standards based on budgets
or past performance).
One type of external sources in target setting is peer performance. Information about peer
performance can be used to assess the common components of performance across the peer group because
provide evidence that firms do not fully consider managers’ past performance when setting future targets (Indjejikian
and Nanda 2002, Aranda et al. 2014, Indjejikian et al. 2014a, Bol and Lill 2015). For example, Indjejikian et al. (2014a)
find that target revisions for well-performing managers are sensitive to past unfavorable performance variances and
less sensitive to past favorable performance variances, suggesting that firms reward well-performing managers with
rents. While these findings are consistent with the benefit of a long-term contractual commitment in addressing the
ratchet effect, the commitment to disregarding information about past performance increases the demand for other
sources of information.

9
the groups is subject to common shocks. Using data from a retail travel company, Aranda et al. (2014) find
that supervisors use information about the relative performance of comparable branches in target setting.
Bol and Lill (2015) show that the performance of business units relative to their peers affects the degree of
target ratcheting. Although these studies provide empirical evidence that internal benchmarking within a
firm is used in target setting, there is limited evidence on the use of external benchmarking in target setting,
because data about industry peer performance are often costly to obtain and available only with a time lag
(Hansen et al. 2003). Consistent with these limitations of external benchmarking, Dekker et al. (2012) report
that external benchmarking is used much less than past performance or internal planning data to set targets
for middle-level managers.
Another potential external source of information in target setting, which has not received much
attention in the literature, is externally informed performance expectations. There are several reasons why
external performance expectations can be useful in setting targets for incentive contracts, particularly for
the senior executives of public firms. First, external performance expectations provide an independent and
direct estimate of firm-specific performance. Second, they reflect an additional information set of external
parties that provide the estimates. Finally, they are readily available for public firms, for example, in the
form of analyst forecasts. Thus, in terms of the extent to which managers can influence the information, the
informativeness, and the cost of information collection (Murphy 2000), external performance expectations
should be useful for target setting.4, 5
Anecdotal evidence is also consistent with the use of external performance expectations in the
4 Theory provides another reason why external performance expectations can be useful in improving the efficiency of
incentive contracts. Mittendorf and Zhang (2005) provide a principal-agent model in which the principal (owner)
benefits from relying on the performance forecasts of independent external agents (i.e., analysts), even when the agent
(manager) provides earnings guidance based on her private earnings observation. In this model, analysts act as
information intermediaries to discipline the agent because they, faced with the possibility that the manager’s guidance
is biased, conduct their own research, rather than repeating the manager’s guidance. In other words, firms can improve
their incentive contracts by using the interaction/tension between managers and external agents who provide
independent estimates of firm performance. 5 In addition, the emphasis on meeting or beating earnings benchmarks (Graham et al. 2005) and the need to justify
the performance targets in incentive contracts under extensive compensation disclosure requirements (Indjejikian et
al. 2014b) also contribute to the increasing use of external performance expectations in target setting.

10
practice of target setting. For example, the 2014 proxy statement of Biogen Inc. states that the firm considers
analysts’ projections for firm performance in setting annual goals in addition to internal forecasts and peer
performance (see Appendix A for details). Mercer (2009), a compensation-consulting firm, also
recommends the use of analysts’ expectations as an important source of external information.
Based on the preceding discussion, we state our first hypothesis as follows:
H1: External performance expectations are positively associated with adjustments to performance
targets in executive bonus contracts.
Next, we discuss our cross-sectional predictions about the use of external performance expectations
in target setting, based on Murphy’s (2000) three criteria for evaluating the information sources in target
setting: information collection cost, informativeness, and the extent to which the information is influenced
by managers. To the extent that the cost of collecting information about external performance expectations
is low, firms are expected to determine the weight on external performance expectations based on their
informativeness and the extent to which they are influenced by managers (i.e., independence). Following
the arguments of Ittner et al. (2003), we assume that a measure’s predictive ability for future financial
performance provides a reasonable proxy for its informativeness in contracting. Therefore, we expect firms
to allocate more weight in target setting to external performance expectations when they are more
informative about future firm performance. Moreover, to the extent that managers can affect external
performance expectations, we predict that firms allocate more weight to external performance expectations
when they are less likely to be influenced by managers. Based on these discussions, we present our second
and third hypotheses as follows:
H2: The use of external performance expectations in the revision of target setting is more
pronounced when they are more informative about future firm performance.
H3: The use of external performance expectations in the revision of target setting is more
pronounced when they are less likely to be influenced by managers.

11
3. Research Design and Sample
3.1. Research Design
As an empirical proxy for external performance expectations, we use the consensus of analysts’
annual earnings forecasts that are available before the annual bonus plan is determined. Sell-side analysts,
who are employed by brokerage firms or independent research firms, provide their forecasts about firms’
earnings in their research reports, along with their estimates of target prices and stock recommendations.
The consensus earnings forecasts, which aggregate all available individual forecasts, are readily available
from commercial websites or data vendors (e.g., I/B/E/S and Zacks).
To examine the association between target revisions and analyst forecasts, we build on target setting
research (Leone and Rock 2002, Bouwens and Kroos 2011, Aranda et al. 2014, Indjejikian et al. 2014a,
Kim and Shin 2017). Specifically, we estimate the following ordinary least squares (OLS) regression to test
H1 (i.e., whether external performance expectations are positively associated with target revisions in
executive bonus contracts):
Target revisioni,t+1 = 𝜆0 + 𝜆1 Target deviationi,t + 𝜆2 Target deviationi,t × D_NEGi,t
+ 𝜆3 Analyst forecast devi,t+1 + 𝜆4 Relative-to-peersi,t + 𝜆5 Growthi,t+1
+ 𝜆6 D_NEGi,t + 𝜆7 Reti,t + 𝜆8 Guidei,t+1 + Year and industry fixed effects + εi,t (1)
The dependent variable is Target revisioni,t+1, which is defined as (Target EPSi,t+1 − Target EPSi,t)
divided by Target EPSi,t. Target deviationi,t is a proxy for past actual performance relative to the
performance target, defined as (Actual EPSi,t − Target EPSi,t) divided by Target EPSi,t. To capture any
asymmetry in target ratcheting, we include an indicator variable for unfavorable performance variances,
D_NEGi,t, and its interaction with Target deviationi,t (Leone and Rock 2002, Kim and Shin 2017). D_NEGi,t
equals 1 if Target deviationi,t is negative and 0 otherwise.
Our main variable of interest is Analyst forecast devi,t+1, analysts’ estimates of future EPS over the
realized EPS. Specifically, Analyst forecast devi,t+1 is defined as (Analyst forecasti,t+1 − Actual EPSi,t)
divided by Target EPSi,t, where Analyst forecasti,t+1 is the average of the most recent forecasts of year t+1
earnings issued over the period from the announcement of year t earnings to the approval date of the annual

12
bonus plan for year t+1.6 If the approval date is missing, we use the end date of the 3 months after the fiscal
year-end as the approval date. This way of measuring analyst forecasts ensures that they are not affected
by stale forecasts and that analysts incorporate information about year t earnings. Figure 1 illustrates the
timeline of analyst forecasts used in our analyses. A positive coefficient on Analyst forecast devi,t+1 indicates
that targets are revised upward when analysts expect earnings for year t+1 to be greater than the realized
earnings for year t. If analyst forecasts do not convey any incremental information over other variables in
the model (e.g., past performance and peer performance), λ3 would not be different from 0.
[Insert Figure 1 here]
Recent studies on target setting argue that managers’ past performance relative to peers affects
future targets and the extent of target ratcheting, which underscores the importance of controlling for peer
performance (Aranda et al. 2014, Indjejikian et al. 2014 a and b, Bol and Lill 2015). Therefore, we include
a measure for a firm’s performance compared to its peers (Relative-to-peersi,t), which we define as the
firm’s basic EPS for year t minus industry peers’ average basic EPS for year t. We follow Albuquerque
(2009) to construct industry-size-matched peer portfolios.7 We also include firms’ stock returns (Reti,t) to
control for events that affect both future target revisions and analyst forecasts.8 To the extent that stock
returns reflect all publicly available information, controlling for stock returns can mitigate the possibility
that our model merely captures an association due to the common information available to both analysts
and compensation committees. Reti,t is the firm’s stock returns over the 12-month period that ends 3 months
after fiscal year-end t. To control for the presence of management forecasts, we include Guidei,t+1, an
6 The approval date of the annual bonus plan for year t+1 is on average 53 days after the end of fiscal year t. 7 To calculate peer performance, we construct peer portfolios matched on industry and firm size. First, we form annual
portfolios based on two-digit standard industry classification (SIC) codes. We use all of the firms on Compustat to
construct the portfolios. Second, we sort firms by beginning-of-year market value into size quartiles. Third, we match
each firm with an industry-size peer group. Peer performance is the equal-weighted portfolio EPS for an industry-size
peer group. When calculating portfolio EPS, we exclude the EPS of the observed firm. 8 For example, when oil prices increase, both firms and analysts may revise their expectations of future performance
downward, resulting in a positive correlation between the target revisions and analyst forecasts. By controlling for
stock returns, which contain information about public news, we expect Analyst forecast devi,t+1 to reflect analysts’
unique information set beyond public information.

13
indicator variable that equals 1 if a firm issues management forecasts over the period from the
announcement of year t earnings to the approval date of the annual bonus plan for year t+1.
Indjejikian et al. (2014b) suggest that the relation between target revisions and past performance
may be attributable to firm-specific growth. To control for the effect of firm-specific growth in target setting
(Aranda et al. 2014, Indjejikian et al. 2014 a and b, Kim and Shin 2017), we include anticipated growth in
EPS (Growthi,t+1) in our model. Specifically, we measure Growthi,t+1 as the predicted value from the
following model:
EPS growthi,t+1 = 𝛼0+ 𝛼1 Past EPS growthi,t + 𝛼2 Sizei,t + 𝛼3 EPi,t + 𝛼4 Leverage i,t
+ 𝛼5 MKTi,t + 𝛼6 RDi,t + 𝛼7 CAPi,t + 𝛼8 BTMi,t + 𝛼9 Div yieldi,t
+ 𝛼10 Past RETi,t + εi,t (2)
The dependent variable in Equation (2) is EPS growthi,t+1, which is defined as the EPS growth
between year t and t+1. Following research on the factors that affect the growth of accounting earnings and
sales (Chan et al. 2003, Ciftci and Cready 2011, Gong and Li 2013), we control for past growth in EPS over
the previous 3 years (Past EPS growth), the natural logarithm of the market value of equity (Size), the
earnings-to-price ratio (EP), leverage (Leverage), advertising expenses divided by sales (MKT), the average
of R&D expenses divided by sales over the previous 3 years (RD), the average of capital expenditures
divided by total assets over the previous 3 years (CAP), the book-to-market ratio (BTM), the dividend yield
ratio (Div yield), and stock returns over the previous 12 months (Past RET). We estimate Equation (2)
separately for each fiscal year and two-digit SIC code group.9
3.2. Sample
Our initial sample consists of S&P 1500 firms for the fiscal years of 2006 to 2014. We focus on
firms that use EPS as a performance measure in their CEOs’ annual bonus contracts because EPS is the
most widely used performance measure in annual bonus contracts and analysts’ EPS forecasts are widely
available. We hand-collect EPS targets, thresholds, and maximums and actual EPS for CEOs from the
9 Section 6.4.1 discusses alternative ways to measure expected growth.

14
CD&A sections of proxy statements. Detailed information on each plan is disclosed in the “Short-term
Incentives” section.10 Appendix B provides an example of the CD&A section of a proxy statement for El
Paso Electric Company. This company provides information on performance measures (EPS with 50%
weight), performance targets ($2.30), and actual performance ($2.27) in its 2014 executive annual bonuses.
We obtain stock return data from CRSP and financial statement data from Compustat. We collect
analyst forecast data from I/B/E/S. Table 1 summarizes our sample selection procedure. Of the initial
sample of 13,140 firm-years, 3,303 firm-years use EPS as a performance measure for CEO annual bonus
contracts. We exclude firm-years that lack EPS target information and those with missing analyst forecast
information and control variables.11 As our main regression model requires EPS target and performance
data for at least two consecutive years, we further exclude firm-years that lack such data. Our final sample
consists of 1,179 firm-year observations over the 2006 to 2014 period.
[Insert Table 1 here]
4. Descriptive Statistics
Table 2 provides the descriptive statistics for our key variables, including Target revisioni,t+1,
Target deviationi,t, Analyst forecast devi,t+1, and several firm characteristics. For ease of interpretation, we
also present the descriptive statistics of the unscaled variables: (Target EPSi,t+1 – Target EPSi,t), (Actual
EPSi,t – Target EPSi,t), and (Analyst forecasti,t+1 − Actual EPSi,t). The mean (median) values of (Target
EPSi,t+1 – Target EPSi,t) and Target revisioni,t+1 are $0.202 ($0.215) and 11.6% (9.8%), respectively,
suggesting that EPS targets are typically revised upward by 20.2 cents (11.6% of prior target EPS). The
mean of (Actual EPSi,t – Target EPSi,t) is $0.039, whereas the actual EPS is 1.7% higher than the target (i.e.,
Target deviationi,t) on average, indicating that actual performance is, on average, slightly higher than the
target. The mean values of (Analyst forecasti,t+1 − Actual EPSi,t) and Analyst forecast devi,t+1 are $0.164 and
10 Our main analyses use the target value and thus do not incorporate information about the threshold or maximum
(target) value. In an untabulated analysis, we find that thresholds and maximums are commonly set to 80% and 120%
of the target value. For example, the mean (median) values of the thresholds and maximums in our sample are 82.5%
(86.7%) and 119.5% (114.8%), respectively. The practice of setting thresholds and maximums to 80% and 120% of
the target value is observed across most of the industries in our sample. 11 If a stock split occurs during the year, we exclude that firm-year observation from our sample.

15
11.0%, respectively, indicating that analyst EPS forecasts are 16.4 cents (11%) higher than prior actual EPS
on average. The means of the market value of equity and book value of total assets are $12,530 million and
$16,629 million, respectively. Lastly, the mean (median) value of Relative-to-peersi,t is 0.774 (0.602).
[Insert Table 2 here]
Table 3 provides the correlation matrix of our key variables. (Target EPSi,t+1 − Target EPSi,t) is
positively associated with (Actual EPSi,t − Target EPSi,t), suggesting that targets tend to be revised in the
same direction as past performance variances. (Target EPSi,t+1 − Target EPSi,t) is also positively correlated
with (Analyst forecasti,t+1 − Actual EPSi,t), providing univariate evidence to support our first hypothesis that
external performance expectations are positively associated with the revision of targets. The positive
correlation between (Target EPSi,t+1 − Target EPSi,t) and Growthi,t+1 highlights the importance of controlling
for firm-specific growth in the empirical models that attempt to explain firms’ target revisions (Indjejikian
et al. 2014b).
[Insert Table 3 here]
5. Empirical Results
5.1. Association Between External Performance Expectations and the Revision of Targets (H1)
Table 4 reports the results of estimating Equation (1). Column (1) shows the baseline results
without Analyst forecast devi,t+1. Consistent with previous studies, the coefficient on Target deviationi,t is
significantly positive, suggesting that firms consider past performance variances in revising targets (i.e.,
target ratcheting). The coefficient on Target deviationi,t × D_NEGi,t is significantly negative, consistent with
previous findings that targets tend to ratchet asymmetrically (Leone and Rock 2002, Bouwens and Kroos
2011, Aranda et al. 2014, Kim and Shin 2017). A significantly negative coefficient on Relative-to-peersi,t
suggests that firms outperforming their peers (i.e., those with higher values of Relative-to-peersi,t)
experience downward target revisions in the subsequent period (Aranda et al. 2014, Indjejikian et al. 2014a,
Kim and Shin 2017).
[Insert Table 4 here]

16
Column (2) of Table 4 provides the estimation results to test H1 that external performance
expectations are positively associated with the target revisions in bonus contracts. The coefficient on
Analyst forecast devi,t+1 is positive and significant, suggesting that analysts’ performance expectations
above (below) the realized past performance are associated with upward (downward) revisions in targets.
This finding is consistent with the argument that firms use analyst forecasts as an external information
source in revising future bonus targets, going above and beyond information about past and relative
performance. In terms of economic significance, the magnitude of the coefficient (0.376) indicates that an
interquartile change in Analyst forecast devi,t+1 from the first quartile (Q1) to the third quartile (Q3) is
associated with an 8.08% increase in future targets. Furthermore, including the analyst forecast variable
increases the adjusted R2 from 58.03% in Column (1) to 69.68% in Column (2), highlighting the importance
of analyst forecasts as an additional information source in target setting.
We also note that the coefficient on peer performance, which is significant in Column (1), becomes
marginally insignificant once analyst forecast information is included in Column (2). This finding indicates
that analyst forecasts subsume peer information as an information source in target setting, consistent with
a limited use of external benchmarking in the target-setting practice.12 Overall, the results in Table 4 support
our first hypothesis that external performance expectations (i.e., analyst forecasts) are positively associated
with target revisions.
As a supplementary analysis, we test whether incorporating analyst forecasts in target setting
improves target accuracy. Based on Indjejikian and Nanda’s (2002) argument, Bouwens and Kroos (2017)
design a test examining whether firms set more accurate targets when non-financial information is
incorporated in target setting in addition to financial information. They find that sales target deviations are
less serially correlated when both financial and non-financial information are incorporated in target setting,
suggesting that target accuracy improves with the inclusion of non-financial measures into target setting.
12 In Section 6.4.1, we examine whether the insignificant results for peer performance are due to measurement errors
in our approach to identifying peer groups based on firm size and industry membership. We find that using an
alternative way to identify peer groups does not change the results.

17
Similarly, we examine whether the inclusion of analyst forecasts enhances target accuracy by comparing
the extent to which current target deviations explain next-period target deviations when firms incorporate
analyst forecasts into target setting, compared to when firms do not incorporate analyst forecasts.
Specifically, we estimate the following equation:
|Target deviationi,t+1|= λ0 + λ1 |Target deviationi,t | + (3)
|Target deviationi,t| is the absolute value of (Actual EPSi,t − Target EPSi,t) divided by Target EPSi,t.
Following Bouwens and Kroos (2017), we define |Target deviationi,t+1| in two different ways. The first is
the absolute value of the actual target deviation in period t+1, measured as the absolute value of (Actual
EPSi,t+1 − Target EPSi,t+1) divided by Target EPSi,t. The second is the counterfactual target deviation in
period t+1 assuming that analyst forecast information is not used in target setting, measured as the absolute
value of (Actual EPSi,t+1 − Predicted Target EPSi,t+1) divided by Target EPSi,t. Predicted Target EPSi,t+1 is
estimated as the sum of Target EPSi,t and the predicted target revision for year t+1 from Equation (1) that
excludes Analyst forecast devi, t+1. Because a significant serial correlation in target deviations indicates that
all available information is not fully incorporated into targets (i.e., less accurate), to the extent that
incorporating analyst forecasts into targets improves target accuracy, we predict that the ability of current
target deviations to explain next-period target deviations (i.e., R2 from Equation (3)) is lower when analyst
forecasts are incorporated into target setting than when they are not incorporated.
Table 5 presents the results. In Column (1), in which the dependent variable is the absolute value
of the actual target deviation in period t+1 (i.e., next-year targets incorporate analyst forecasts), the
coefficient on |Target deviationi,t| is 0.559 and the R2 is 15.15%. In Column (2), in which the dependent
variable is the counterfactual target deviation in period t+1 (i.e., next-year targets do not incorporate analyst
forecasts), the coefficient is 0.652 and the R2 is 16.62%. The Vuong (1989) test statistic shows that the
difference in the R2 between the two models is statistically significant. The higher R2 of the second model
suggests that current target deviations explain next-period target deviations more when the targets do not
incorporate analyst forecasts, supporting the idea that incorporating analyst forecasts improves target
ti,

18
accuracy.
[Insert Table 5 here]
5.2. Effects of the Informativeness of External Performance Expectations on Their Use in Target
Setting (H2)
Next, we test whether the use of external performance expectations in target setting is more
pronounced when they are more informative about future firm performance (H2). We use two approaches
to test this prediction. First, we use analysts’ forecast accuracy, their dispersion, and the number of analysts
following the firm to proxy for the accuracy/noisiness of analyst forecasts and predict that the use of analyst
forecasts increases when analyst forecast errors are low, when forecasts are less dispersed, and when more
analysts provide estimates.13 While intuitive, this approach has the limitation that these proxies may simply
reflect the overall information uncertainty of the firm (e.g., due to volatile business) instead of the
informativeness of analyst forecasts. Therefore, we use the second approach of measuring the relative
information advantage of analysts versus managers because it enables us to pinpoint the source of the
relative advantage of analyst forecasts compared to other sources (e.g., managers’ own information). Hutton
et al. (2012) document that analyst forecasts are more accurate than management forecasts approximately
50% of the time and then examine the circumstances in which analysts’ forecasts are more accurate than
managers’ forecasts. They find that analysts’ information advantage comes from their superior ability to
assess macroeconomic factors. Specifically, analyst forecasts are more accurate than management forecasts
13 Although our approach using analyst forecast dispersion as a proxy for forecasting uncertainty is common in the
literature, forecast dispersion can alternatively proxy for the extent to which analyst forecasts are influenced by
managers (i.e., H3), as it is more difficult for managers to guide analysts when forecasts are more dispersed (Cotter et
al. 2006). Therefore, one can argue that more dispersed forecasts represent more independent information and thus are
given more weight in target setting, leading to an opposite prediction to ours in H2. However, the relation between
managers’ guidance and forecast dispersion is not clear. For example, Houston et al. (2010) report that managers are
more likely to stop providing guidance when analyst forecast dispersion is high because it is difficult for managers to
predict future earnings with precisions when forecast uncertainty is high (as reflected in high analyst forecast
dispersion), suggesting that managers’ ability to guide analysts can be negatively associated with forecast dispersion.
Thus, we make no specific prediction about the relation between dispersion and analyst independence (i.e., H3). In
addition, although a higher number of analysts following the firm can also indicate managers’ difficulty in influencing
the consensus, this leads to the same prediction as ours that the weight on analyst forecasts increases with the number
of analysts following the firm.

19
for firms whose earnings are highly exposed to macroeconomic factors, such as GDP.14 Based on their
finding, we predict that firms put more weight on analyst forecasts in target setting when their performance
is strongly correlated with macroeconomic factors, a situation in which analysts have an information
advantage over managers. We estimate the following OLS regression to test these predictions:
Target revisioni,t+1 = λ 0 + λ1 Target deviationi,t + λ2 Target deviationi,t × D_NEGi,t
+ λ3 Analyst forecast devi,t+1
+ λ4 Analyst forecast devi,t+1 × Forecast error quartilei,t
+ λ5 Analyst forecast devi,t+1 × Forecast dispersion quartilei,t+1
+ λ6 Analyst forecast devi,t+1 × Analyst followingi,t+1
+ λ7 Analyst forecast devi,t+1 × Cyclicalityi,t + λ8 Forecast error quartilei,t
+ λ9 Forecast dispersion quartilei,t+1 + λ10 Analyst followingi,t
+ λ11 Cyclicalityi,t + λ12 Relative-to-peersi,t + λ13 Growthi,t+1 + λ14 D_NEGi,t
+ λ15 Reti,t + λ16 Guidei,t+1 + Year and industry fixed effects + (4)
We include four variables in the model to reflect the informativeness of analyst forecasts: 1) analyst
forecast errors, 2) analyst forecast dispersion, 3) the number of analysts following the firm, and 4) the
degree to which GDP explains firm performance. Forecast error quartilei,t is defined as the quartile rank of
analyst forecast errors for year t. Analyst forecast errors for year t are calculated as the absolute value of
actual EPS minus the average of the most recent analyst forecasts of year t earnings issued from the
announcement of year t-1 earnings to the announcement of year t earnings, scaled by Target EPSi,t t (Mikhail
et al. 1997). Forecast dispersion quartilei,t+1 is the quartile rank of analyst forecast dispersion, where
forecast dispersion is measured as the standard deviation of analyst forecasts of year t+1 earnings, scaled
by Target EPSi,t (Cheong and Thomas 2011), where we use the forecasts of year t+1 earnings issued over
the period from the announcement of year t earnings to the approval date of the annual bonus plan for year
t+1. Analyst followingi,t+1 is the natural logarithm of the number of analysts following the firm.
To capture the information advantage of analysts over managers, we follow Hutton et al. (2012)
and construct Cyclicalityi,t to capture analysts’ expertise in assessing the effects of macroeconomic factors
14 Managers’ relative information advantage over analysts comes from their ability to make decisions to respond to
unusual operation situations, because analysts find it difficult to anticipate these actions by managers. Hutton et al.
(2012) find no difference between analysts and managers in terms of their ability to understand industry-level shocks.
ti,

20
on firm performance. Cyclicalityi,t is defined as the R2 from the following firm-specific regression over at
least 4 of the prior 5 years:
IBi,t = β0 + β1GDPt + εi,t (5)
where IBi,t is income before extraordinary items and GDPt is nominal annual GDP. A higher value of
Cyclicality indicates that a firm’s earnings are highly correlated with the overall economy.15
Table 6 shows our results from estimating Equation (4).16 The coefficients on Analyst forecast
devi,t+1 × Forecast error quartilei,t (-0.071; t-value = -1.66) and Analyst forecast devi,t+1 × Forecast
dispersion quartilei,t+1 (-0.215; t-value = -6.71) are significantly negative. This suggests that firms are less
likely to rely on analyst forecasts in revising targets when forecast errors or dispersion is high. The
coefficient on Analyst forecast devi,t+1 × Analyst followingi,t+1 is positive and significant (0.101; t-value =
1.71), indicating that the use of analyst forecast information increases when more analysts provide earnings
forecasts for the firm.
Regarding the effect of analysts’ informational advantage on firms’ use of analyst forecasts in target
setting, we find that the coefficient on Analyst forecast devi,t+1 × Cyclicalityi,t is significantly positive (0.221;
t-value = 1.75). The results indicate that when a firm’s earnings are highly correlated with GDP, firms
exploit analysts’ information advantage by relying more on analyst forecasts in setting their annual bonus
targets.
Overall, the results in Table 6 support our cross-sectional predictions that the use of analyst
forecasts in target setting is more pronounced when analyst forecasts are more informative, consistent with
the economic theory on target setting (Murphy 2000).
[Insert Table 6 here]
15 The value of Cyclicality is high when the relation between firm performance and GDP is significantly positive (i.e.,
cyclical) or significantly negative (i.e., countercyclical). 16 The sample size is reduced from 1,179 in Table 4 to 1,158 in Table 6, as we require non-missing values for additional
variables, such as forecast dispersion and cyclicality.

21
5.3. Effects of the Extent to Which External Performance Expectations are Affected by Managers
on Their Use in Target Setting (H3)
While external performance expectations are assumed to be independent of managers’ influence,
managers may affect external performance expectations to some extent. If there is variation in the extent to
which external performance expectations are affected by managers, we predict that compensation
committees incorporate the variation into their weighting decision in target setting. Our use of analyst
forecasts as an empirical proxy for external performance expectations enables us to test this prediction.
Whereas analysts are outsiders who provide independent estimates of future earnings based on their own
research, managers can affect analyst forecasts either by privately communicating with analysts or by
publicly providing earnings guidance. In addition, analysts have their own incentives to issue biased (e.g.,
optimistic) forecasts because of their investment banking relationships with the firms they follow (Dugar
and Nathan 1995) or to obtain favorable access to private information from managers (Chen and Matsumoto
2006). If managers have the incentive and ability to influence analyst forecasts downward to obtain easier
targets in their bonus contracts, such as by issuing pessimistic management forecasts to lower the consensus,
the benefit of relying on analyst forecasts as an external source of information would be reduced.
However, we believe that these issues do not significantly impair the overall independence of
analysts for the following reasons. First, several regulations have been introduced since 2000 to enhance
the independence of analysts’ research. Specifically, Regulation Fair Disclosure enacted in 2000 prohibits
selective disclosures of material information to certain groups (e.g., individual analysts), and NASD Rule
2711 and NYSE Rule 472 introduced in 2002 prohibit linking analyst compensation to investment banking
business. Furthermore, the 2003 Global Analysts Research Settlement requires the separation of the
research department from the investment banking department. Empirical findings suggest that analysts’
independence is indeed enhanced as a result of these regulatory changes (Barniv et al. 2009, Chen and Chen
2009), mitigating the concern about analysts’ independence in the recent period. Second, from the stylized
fact that analyst forecasts are initially optimistic and are gradually revised downward so that firms can beat
the targets when earnings are announced, we infer that managers have incentives to guide analysts’ annual

22
earnings forecasts downward toward beatable forecasts later in the year as they learn the actual outcome
with certainty, but not early in the year (i.e., in the beginning of the year when compensation is
determined).17
Although we expect analyst forecasts to be generally less likely to be affected by managers’
opportunistic behaviors for obtaining easy targets, there may be cross-sectional variation in the degree to
which managers affect analyst forecasts. Thus, we examine whether the use of analyst forecasts varies
depending on the perceived independence of analyst forecasts. We use affiliated versus unaffiliated analysts
as a proxy for the extent to which analyst forecasts are influenced by managers. Affiliated analysts are those
whose brokerage firms acted as the lead underwriter or co-underwriter of the covered firm’s initial public
offering (IPO) or seasoned equity offering (SEO) and they are often regarded as less independent than
unaffiliated analysts (Malmendier and Shanthikumar 2014). Therefore, to the extent that compensation
committees view the forecasts of unaffiliated analysts as more independent, firms are predicted to put more
weight in target setting on the forecasts of unaffiliated analysts than on the forecasts of affiliated analysts.
To test this prediction, we identify firms for which the EPS forecasts of both affiliated and unaffiliated
analysts are available and measure two different Analyst forecast devi, t+1 using the forecasts of affiliated
and unaffiliated analysts, respectively.18
Column (1) of Table 7 reports the estimation results when Analyst forecast devi, t+1 is measured
based on the forecasts of affiliated analysts, whereas Column (2) reports the results based on the forecasts
of unaffiliated analysts. While the coefficients on Analyst forecast devi, t+1 are positive and significant in
both columns, the magnitude of the coefficient (0.580) in Column (1) (i.e., affiliated analysts) is smaller
than that (0.620) in Column (2) (i.e., unaffiliated analysts). This difference is statistically significant (p-
17 As a result, analysts’ annual forecasts with long forecast horizons are usually optimistic, whereas quarterly forecasts
with short forecast horizons tend to be pessimistic. Consistent with the argument that managers’ decision to issue
management forecasts depends on the forecast horizon, Bergman and Roychowdhury (2008) find that managers tend
to walk-down analysts’ optimistic short-horizon (i.e., quarterly) forecasts, but they are disinclined to walk-down
optimistic long-horizon (i.e., annual) forecasts. 18 Due to our requirement for the presence of both affiliated and unaffiliated analysts for a firm, the sample size is
reduced to 119 for the analysis in Table 7.

23
value = 0.029). This finding suggests that the weight placed on the forecasts of unaffiliated analysts is
greater than those of affiliated analysts, consistent with our third hypothesis (H3) that the use of external
performance expectations is more pronounced when they are less likely to be affected by managers.
[Insert Table 7 here]
As an alternative way to test H3, we divide analyst forecasts into those issued before management
forecasts and those issued after management forecasts, for a subsample with available management
forecasts issued over the period from the announcement of year t earnings to the approval date of the annual
bonus plan for year t+1. To the extent that management forecasts can influence analyst forecasts, we view
that analyst forecasts issued before management forecasts provide more independent and objective
performance expectations than those issued after management forecasts. Thus, we measure two different
Analyst forecast devi, t+1 using analyst forecasts issued before management forecasts and those issued after
management forecasts, respectively, and estimate Equation (1) separately. In untabulated analyses, we find
that the coefficient on Analyst forecast devi, t+1 based on analyst forecasts issued before management
forecasts (0.724) is significantly greater than the coefficient on Analyst forecast devi, t+1 based on analyst
forecasts issued after management forecasts (0.439) (p-value for the difference = 0.00).19 This finding
corroborates the previous result based on the affiliated versus unaffiliated analyst classification.20
6. Additional Analyses
6.1. Relative Importance of Analyst Forecasts Versus Management Forecasts in Target Setting
19 As we require (i) a firm to have management forecasts issued from the announcement of year t earnings to the
approval date of the annual bonus plan for year t+1 (i.e., measurement period) and (ii) both analyst forecasts issued
before management forecasts and those issued after management forecasts to be available over this measurement
period, the sample size is reduced to 78 for this analysis. Alternatively, when we extend the measurement period to
the period from the fiscal year-end for year t to the approval date of the annual bonus plan for year t+1, we find similar
results for the sample of 513 observations (untabulated). 20 In these analyses, we compare the weight on affiliated analysts’ forecasts to that on unaffiliated analysts’ forecasts
(or the weight on analyst forecasts before management forecasts to that after management forecasts) using two separate
regressions. A possible alternative approach is to estimate one model that includes both affiliated and unaffiliated
analysts’ forecasts (or that includes both analyst forecasts before and after management forecasts). The results from
this alternative approach are qualitatively similar to those from the main approach. However, we do not tabulate them,
because the variance inflation factors for Analyst forecast devi,t+1 are greater than 10, indicating a multicollinearity
problem with the alternative approach.

24
One can argue that internal future planning information (e.g., internal budgeting) is more important
than analyst forecasts in target setting because the former reflects managers’ private information. However,
internal planning information is subject to managers’ opportunistic behaviors. For example, previous
studies find that using budgets in performance evaluation can cause managers to understate their expected
productivity (Young 1985, Chow et al. 1988). Anderson et al. (2010) find that managers tend to set easy
targets after the introduction of a performance-based bonus plan. Furthermore, Cassar and Gibson (2008)
report that budget preparation does not improve managers’ forecast accuracy because budgets are used not
only for forecasting performance but also for other purposes, such as communicating objectives and
motivating employees. Considering these issues, independent compensation committees should be
unwilling to use the information provided by managers themselves in setting targets. Overall, whether
internal future planning information is more important than analyst forecasts in target setting remains an
empirical question.
To examine the relative importance of analyst forecasts versus internal planning information in
target setting, we use managers’ earnings forecasts as a proxy for internal planning information and include
them in our regressions.21 Specifically, for the subsample with available management forecasts, we control
for the information in management earnings forecasts and estimate the following regression:
Target revisioni,t+1 = λ0 + λ1 Target deviationi,t + λ2 Target deviationi,t × D_NEGi,t
+ λ3 Analyst forecast devi,t+1 + λ4 Management forecast devi,t+1
+ λ5 Relative-to-peersi,t + λ6 Growthi,t+1 + λ7 D_NEGi,t + λ8 Reti,t
+ Year and industry fixed effects + εi,t (6)
Management forecast devi,t+1 is the difference between Management forecasti,t+1 and Actual EPSi,t,
divided by Target EPSi,t, where Management forecasti,t+1 is the most recent management forecasts of year
t+1 earnings issued over the period from the announcement of year t earnings to the approval date of the
annual bonus plan for year t+1. If firms rely on information in analyst earnings forecasts to set targets above
21 Previous studies have established a theoretical link between external management earnings forecasts and internal
management planning information (Hemmer and Labro 2008). Such studies have used management earnings forecasts
as a proxy for internal planning and budget information (Goodman et al. 2014).

25
and beyond the information in management earnings forecasts, the coefficient on Analyst forecast devi,t+1
(λ3) would be positive and significant even after controlling for Management forecasts devi,t+1. As presented
in Table 2, the mean (median) values of (Management forecasti,t+1 – Actual EPSi,t) and Management
forecast devi,t+1 are $0.052 ($0.110) and 2.6% (5.0%), respectively. Table 3 shows a positive correlation
between (Target EPSi,t+1 − Target EPSi,t) and (Management forecast i,t+1 − Actual EPSi,t).
Panel A of Table 8 presents the results of estimating Equation (6) for a reduced sample with
available management forecast data. As a starting point, Column (1) shows the results of estimating the
model without Analyst forecast devi,t+1. The coefficient on Management forecast devi,t+1 is significantly
positive, suggesting that management forecasts are an important source of information in setting annual
bonus targets. However, in Column (2), where both analyst and management forecast variables are included
in the model, the coefficient on Analyst forecast devi,t+1 is significantly positive, whereas the coefficient on
Management forecast devi,t+1 loses its significance.22 Overall, these results suggest that firms rely more on
the information in analyst earnings forecasts than on the information in management earnings forecasts.
A potential issue related to estimating Equation (6) is that analyst forecasts can be affected by
management forecasts (Hassell et al. 1988), as we discuss in Section 5.3.23 In this scenario, the information
in management forecasts may be an underlying factor in the association between analyst forecasts and target
revisions. To check this possibility, we use several approaches as follows.
First, we estimate Equation (1) using a subsample of firms that do not issue management earnings
forecasts, in which analyst forecasts are free from the influence of management forecasts. In Column (3),
the coefficient on Analyst forecast devi,t+1 remains positive and significant for the subsample without
22 The variance inflation factors for Analyst forecast devi,t+1 and Management forecast devi,t+1 are relatively low at 2.42
and 2.50, respectively. Therefore, any multicollinearity in the model is not severe. 23 For example, Hassell et al. (1988) document that the sign and magnitude of the news from management forecasts
are positively associated with those of analyst forecast revisions.

26
management forecasts, suggesting that analyst forecast information itself is important in target setting, even
when it is not influenced by management forecasts.24
Second, we measure analyst forecasts over the period before management forecasts are issued.
When we include Analyst forecasti,t+1, alternatively defined as the most recent forecasts of year t+1 earnings
issued over the period from the announcement of year t earnings to the date of the management forecast
issuance, the results do not change, as reported in Column (4).
Third, we also measure analyst forecasts over the period after management forecasts are issued to
check whether potentially “walked-down” analyst forecasts provide any incremental information in target
setting above management forecasts. If analyst earnings forecasts, which may be affected by management
forecasts, provide no further incremental information, the coefficient on Analyst forecast devi,t+1 should be
insignificant when the model controls for management forecasts. However, the results using this measure
of analyst forecasts reported in Column (5) are similar to those in Column (4), suggesting that the
association between analyst forecasts and target revisions that we document is independent of the influence
of management forecasts.
Overall, the findings in Panel A of Table 8 lend support to the notion that analyst forecasts provide
incremental information above and beyond management forecasts in explaining target revisions.
[Insert Table 8 here]
6.2. Potential Reverse Causality: Analyst Forecast Revisions Around the Approval Date of the
Annual Bonus Plan
One may argue that the positive association between analyst forecasts and firms’ bonus target
revisions is derived from analysts’ practice of updating their forecasts based on firms’ internal targets (i.e.,
reverse causality). We believe that this concern is largely mitigated in our analyses because we use analyst
forecasts issued before the approval date of the plan and bonus plan details are not typically publicly
24 Grabner et al. (2016) find that the quality of the target-setting process is positively associated with the probability
of issuing management guidance. However, they also suggest that a high-quality target-setting process does not
guarantee the accuracy of management forecasts because managers use their informational advantage strategically to
increase the likelihood of meeting or beating market expectations. If compensation committees recognize this
phenomenon, they would prefer analyst forecasts to management forecasts when setting bonus targets.

27
available until proxy statements are disclosed. Nevertheless, we explore this possibility by examining
individual analyst forecast revisions around the bonus plan approval dates. Specifically, we examine
whether individual analysts revise their forecasts upward (downward) after the approval date if bonus
targets are set higher (lower) than their own previous forecasts.
Low bonus targeti,j,t+1 (High bonus targeti,j,t+1) equals 1 if the bonus target for year t+1 is lower
(higher) than Analyst forecasti,j,t+1 and 0 otherwise, where Analyst forecasti,j,t+1 represents the most recent
forecasts of an individual analyst for year t+1 earnings issued before the bonus plan approval date. Walked-
down analyst forecasti,j,t+1 (Walked-up analyst forecasti,j,t+1) equals 1 if the analyst’s earliest forecast for
year t+1 earnings issued within 7 days of the bonus plan approval date for year t+1 is lower (higher) than
her own previous forecast issued before the approval date (i.e., Analyst forecasti,j,t+1) and 0 otherwise. If
individual analysts revise their forecasts around the bonus plan approval date (as the reverse causality
argument implies), we should observe a positive correlation between Low bonus targeti,j,t+1 and Walked-
down analyst forecasti,j,t+1 (High bonus targeti,j,t+1 and Walked-up analyst forecasti,j,t+1). The results in Panel
B of Table 8 based on the sample of 665 observations with available data at the firm-year-analyst level
show that the correlations are negative and insignificant. This suggests that reverse causality is unlikely to
be a plausible alternative explanation for our main findings.25
6.3. Effect of Incentives to Meet or Beat Earnings Benchmarks on the Use of Analyst Forecasts in
Target Setting
Our cross-sectional tests relating to H2 and H3 focus on the characteristics of analyst forecasts as
an external source of information in target setting. However, firms’ use of analyst forecasts in target setting
may be driven by the incentive of managers to meet or beat market expectations because missing the
consensus adversely affects firm value and executives’ compensation, particularly equity-related incentives.
25 Our findings on the relative information advantage of analysts provide additional (indirect) evidence that rejects the
reverse causality argument. When firm performance is strongly correlated with macroeconomic factors (i.e., when
cyclicality is high), analysts have a relative informational advantage over managers and are therefore less likely to
revise their forecasts based on information about internal targets. Thus, the reverse causality argument predicts the
association between analyst forecasts and target revisions to be weaker when cyclicality is high. However, the results
in Table 6 show that the association is in fact stronger when cyclicality is high, negating the reverse causality
explanation.

28
In this scenario, the use of analyst forecasts is expected to increase when managers have stronger incentives
to meet or beat the consensus (e.g., Armstrong et al. 2017). To examine this possibility, we examine whether
the use of analyst forecasts varies according to CEOs’ equity incentives (e.g., the CEO’s equity portfolio
delta and the ratio of equity-related compensation to annual bonus). In untabulated results, we find that the
interactions between these proxies for equity incentives and Analyst forecast devi,t+1 are all insignificant.
The findings support the notion that firms’ use of analyst forecasts is driven by their need for more
informative and independent information sources to improve the contract efficiency, rather than by their
need to provide incentives to meet or beat the consensus EPS forecasts.
6.4. Other Robustness Tests
6.4.1. Alternative proxies for Growth and Relative-to-peer
To ensure that our findings are robust to alternative measures of expected growth, we replace
growth in EPS (i.e., the dependent variable) in Equation (2) with growth in sales, income before
extraordinary items, and operating income before depreciation. As Panel A of Table 9 presents, the results
of estimating Equation (1) using these alternative Growth proxies are qualitatively similar to those
previously reported.
[Insert Table 9 here]
We also test the robustness of our findings by using an alternative method of identifying peers to
measure Relative-to-peer. Specifically, we follow Jayaraman et al. (2015) and Hoberg and Phillips (2016)
and define peer groups and Relative-to-peers based on the textual similarity of a firm’s product description
section in its 10-K filing with that of other firms. The results using this alternative method to measure peer
performance presented in Panel B of Table 9 are similar to those previously reported.
6.4.2. Sample selection issue
Our sample selection process requires firms to have EPS-based annual bonus plans, a requirement
that may introduce a sample selection issue. To mitigate this concern, we use the Heckman (1979) two-
stage least squares method. Specifically, in the first stage, we estimate a probit model in which a firm’s

29
decision to use EPS in bonus plans is regressed on a set of determinant variables identified in the literature
(Huang et al. 2014, Cheng et al. 2015), including firm size, book-to-market ratio, a set of corporate
governance measures (i.e., institutional holdings, transient institutional holdings, percentage of female
directors, and percentage of outside directors), R&D expenditures, effective tax rates, other forms of
executive compensation (i.e., restricted stock awards and option awards), the number of business segments,
and the number of analysts following. In addition to these variables, we further include in the first-stage
regression the lagged value of the industry average percentage of firms that use EPS in bonus plans to
satisfy an “exclusion restriction.”26 The second-stage regression results with the inverse Mills’ ratio as an
additional control variable (untabulated) are similar to our main findings, suggesting that the sample
selection issue does not affect the main inferences.
6.4.3. Differences in contract- and executive-specific features
We acknowledge that a significant level of cross-sectional differences may exist in our sample in
terms of the type of compensation plans (e.g., bonus and equity-based compensation), performance
measures (e.g., EPS and non-EPS earnings), and executive-specific features (e.g., CEO tenure). Specifically,
in untabulated analyses, we find that approximately 14.5% of our sample firms also use EPS as a
performance measure for their executives’ equity-based compensation plans (e.g., stock and option grants).
30.4% of our sample firms also use other non-EPS earnings in their bonus plans, such as net income,
operating income, and earnings before interest and taxes. For firms that disclose the weight on EPS in bonus
plans (N = 831), we also find that the average weight on EPS in the bonus plan is 54.3%. When other non-
EPS earnings are also used in bonus plans, the average weights on EPS and non-EPS earnings are 35.6%
and 33.2%, respectively.
26 While the percentage of firms that use EPS in bonus plans in an industry may be correlated with individual firms’
decision to use EPS as a performance measure, there is no convincing argument for why it would directly affect
individual firms’ target setting practices, thereby satisfying the condition for an exclusion restriction (Lennox et al.
2012).

30
To examine whether such differences in contract- and executive-specific features affect our main
findings, we take the following approaches. First, we identify firms that use EPS for both equity-based
compensation and bonus plans. We define an indicator variable that equals 1 if EPS is used for both annual
bonus plans and equity-based compensation, and 0 if EPS is used only for annual bonus plans (Equity_EPS).
We then include Equity_EPS and its interaction with Analyst forecast devi,t+1 in the model and find that the
interaction is insignificant. Importantly, the coefficient on Analyst forecast devi,t+1 remains positive and
significant. In addition, including Equity_EPS in the model (without its interaction) does not change the
results.
Second, we identify firms that use both non-EPS earnings and EPS for annual bonus plans. We
define an indicator variable that equals 1 if the annual bonus contract is linked to other non-EPS earnings
and to EPS, and 0 otherwise (Bonus_Earnings). As in the previous approach, we include Bonus_Earnings
and its interaction with Analyst forecast devi,t+1 in the model or include Bonus_Earnings as an additional
control variable without the interaction.27 We find that the coefficient on Analyst forecast devi,t+1 remains
significantly positive while the interaction term is not significant.28 Third, we measure the weight on EPS
in bonus plans and include changes in the weight on EPS between year t and t+1 as an additional control
variable along with its interaction with Analyst forecast dev. We find that the interaction is not significant
and the main finding for Analyst forecast devi,t+1 does not change.
Finally, to examine whether CEO tenure affects our main findings, we divide our sample into
subsamples based on the median CEO tenure and estimate Equation (1) separately for these subsamples.
We find that the coefficients on Analyst forecast devi,t+1 are significantly positive for both subsamples and
the coefficients are not significantly different between the two groups, indicating that firms’ use of external
27 Alternatively, we estimate the model separately for two subsamples partitioned by Equity_EPS or Bonus_Earnings.
We find that the coefficients on Analyst forecast devi,t+1 are significantly positive for both groups and that they are not
different between the groups. 28 We acknowledge that we do not examine the use of external performance expectations for firms that do not use EPS
in their annual bonus plans (e.g., firms that use non-EPS earnings but not EPS) because we limit our hand collection
of data to firms that use EPS in their bonus plans.

31
performance expectations in setting future targets does not differ between CEOs with long tenure and those
with short tenure.29 In summary, the various analyses discussed above suggest that our main inferences are
not affected by various contract-specific or executive-specific differences in executive compensation.
6.4.4. Time-series analysis
To provide additional evidence to corroborate our main findings from the pooled data, we estimate
a firm-specific time-series regression, because Leone and Rock (2002, p. 66) suggest that “the setting of
budgets is an inherently inter-temporal process” and thus ratcheting can be studied from the time-series
model. Specifically, we restrict our sample to observations with no missing values of Target revisioni,t+1,
Target deviationi,t, and Analyst forecast devi,t+1 for at least 7 years during the sample period. This restriction
reduces our sample size from 1,179 to 332 (45 unique firms). We estimate Equation (7) for each of these
45 firms:30
Target revisioni,t+1 = λ0 + λ1 Target deviationi,t + λ2 Target deviationi,t× D_NEGi,t
+ λ3 Analyst forecast devi,t+1 + εi,t (7)
In the untabulated results, we find that the mean of the coefficients on Analyst forecast devi,t+1 is
positive and significant (0.697, Z-stat: 30.66), lending support to the results in Table 4.
6.4.5. Robustness to outliers
To check the robustness of our main findings to the effect of outliers, we perform several additional
tests. First, we winsorize all of the variables at the 5% and 95% levels (instead of at the 1% and 99% levels,
as used for our main results) and then re-estimate the models. Second, we estimate the models after
truncating (instead of winsorizing) all of the variables at the 1% and 99% levels. Third, we restrict our
sample to observations that have absolute studentized residual values of less than 2 (Belsley et al. 1980).
Fourth, we delete any observations that have a Cook’s D value (Cook 1977) greater than 4 divided by the
29 Alternatively, we partition the sample based on (i) whether the CEO is close to retirement; (ii) whether CEO tenure
is less than (equal to or greater than) 3 years; and (iii) whether CEO tenure is less than (equal to or greater than) 5
years. We obtain similar results. When we include a variable for CEO tenure (logged value) and its interaction with
Analyst forecast devi, t+1, the interaction is insignificant. 30 Given that the number of observations for each regression is very small (e.g., N = 7), we do not include control
variables in Equation (7) to conserve the degree of freedom.

32
number of observations. Finally, we re-estimate the models using the least absolute deviations estimation,
a form of robust regression also known as median regression, which is less susceptible to the outlier problem
(Indjejikian et al. 2014a). We also check whether our results hold across firms of different size by estimating
the models separately for the subsamples of S&P 500 LargeCap, S&P 400 MidCap, and S&P 600 SmallCap.
The untabulated results show that the coefficients on Analyst forecast devi,t+1 are significantly positive in
all cases.
7. Conclusion
We examine whether firms use externally informed performance expectations to set and revise
performance targets for executive annual bonus contracts. Although economic theories suggest that firms
use a variety of information sources in target setting, existing studies have largely focused on the use of
past performance. A growing body of research has begun to examine various external sources of
information (e.g., the relative performance of peers) and their roles in target setting. However, the relevance
of external performance expectations, such as analyst earnings forecasts, in target setting has received little
attention, despite support from theory and practice. The results reported in this study extend our
understanding of the role of external information in firms’ target-setting process.
Our main results can be summarized as follows. First, we find that external performance
expectations, as proxied by the consensus of analysts’ EPS forecasts, are positively associated with the
revision of future targets in bonus contracts. This result is robust to controlling for the effect of past
performance, peer performance, expected growth, and the presence of management forecasts. This finding
highlights the importance of external performance expectations as a source of information above and
beyond past and peer performance. Based on the test suggested by Bouwens and Kroos (2017), we find
evidence that incorporating analyst forecasts into target setting improves target accuracy.
Second, we find that a firm’s reliance on external performance expectations in target revisions
depends on their informativeness about future firm performance and that firms place more weight on
external performance expectations when they are less likely to be affected by managers. The findings from

33
the cross-sectional tests lend further support to the notion that the association between analyst forecasts and
target revisions varies in a manner consistent with the economic theory on target setting (Murphy 2000).
Our results are robust to several sensitivity tests.
We contribute to the growing literature that examines the use of information sources other than past
performance in target setting (e.g., Bouwens and Kroos 2017). While we provide initial evidence that firms
use externally informed performance expectations in setting internal targets for executive annual bonus
contracts, future research may further investigate the costs and benefits of using externally informed
performance targets, their motivational effect on managerial behaviors, and the complex interrelations
between external and internal targets.

34
Appendix A 2014 Proxy Statement of Biogen Inc.
2014 Performance-Based Plans Our executive compensation programs place a heavy emphasis on performance-based rewards. We
maintain a short-term incentive plan, known as our annual bonus plan, as well as a long-term incentive plan.
Awards to our NEOs under our annual bonus plan are made under our 2008 Performance-Based
Management Incentive Plan, and awards under our long-term incentive plan are granted under our 2008
Omnibus Equity Plan. Awards under our annual bonus plan are directly tied to the achievement of our
annual operating goals, which are aligned with the Company’s short- and long-term strategic plans. Our
long-term incentives are directly tied to the performance of the price of shares of our common stock, which
align our executives’ long-term interests with the interests of our stockholders.
In setting our annual goals, in addition to our internal forecasts, we consider analysts’ projections for our
performance and the performance of companies in our peer group, as well as broad economic and industry
trends. We establish challenging targets that result in payouts at target levels only when Company
performance warrants it. The Compensation Committee is responsible for reviewing and approving our
annual Company goals, targets and levels of payout (e.g., threshold, target, and maximum) and for
reviewing and determining actual performance results at the end of the performance period.

35
Appendix B 2014 Proxy Statement of El Paso Electric Company
2014 Annual Cash Bonus Plan
Bonuses are paid in late February or early March after the Compensation Committee reviews the audited
financial results and operational performance for the previous year. As reported in the Annual Report on
Form 10-K for the year ended December 31, 2014, and as shown in the above table, the Company had net
income of $2.27 per basic share, which includes an accrual for the cost of the bonus pool. The Company
also met (or failed to meet) its customer satisfaction goals, its reliability goal, its three safety goals and its
compliance goal, in each instance at the level reflected in the above table. As a result, each NEO received
a bonus, as set forth in the table below and also in the Summary Compensation Table later in this proxy
statement. The total bonus paid to Company employees for 2014 was approximately $7.4 million, of which
approximately $1.9 million was paid to the NEOs and other executive officers.

36
Appendix C Variable Definitions
Variables Definitions
Target EPSi,t = Firm i’s target EPS used in the firm’s executive bonus plan for fiscal year t.
Actual EPSi,t = Firm i’s actual EPS for fiscal year t.
Target revisioni,t+1 = (Target EPSi,t+1 − Target EPSi,t) divided by Target EPSi,t.
Target deviationi,t = (Actual EPSi,t − Target EPSi,t) divided by Target EPSi,t.
Analyst forecast devi,t+1 = (Analyst forecasti,t+1 − Actual EPSi,t) divided by Target EPSi,t. Analyst forecasti,t+1 is
the average analyst forecast for year t+1 earnings issued from the announcement of
year t earnings to the approval date of the annual bonus plan for year t+1. If the approval
date is missing, we use the end date of the 3 months after the fiscal year-end as the
approval date. If an analyst issues multiple forecasts during this period, we only use
the most recent forecast.
Management forecast devi,t+1 = (Management forecasti,t+1 − Actual EPSi,t) divided by Target EPSi,t. Management
forecasti,t+1 is the most recent management forecast for year t+1 earnings issued from
the announcement of year t earnings to the approval date of the annual bonus plan for
year t+1.
D_NEGi,t = Equals 1 if Target deviationi,t is negative, and 0 otherwise.
Forecast error quartilei,t = The quartile rank of analyst forecast errors in the previous year. Analyst forecast errors
are calculated as the absolute value of actual EPS minus the average of the most recent
analyst forecasts for year t earnings issued from the announcement of year t-1 earnings
to the announcement of year t earnings, scaled by Target EPSi,t.
Forecast dispersion quartilei,t+1 = The quartile rank of analyst forecast dispersion, where dispersion is measured as the
standard deviation of analyst forecasts for year t+1 earnings, scaled by Target EPSi,t.
Analyst followingi,t+1 = The natural logarithm of the number of analysts who issue an EPS forecast for year
t+1.
Cyclicalityi,t = The R2 from the following firm-specific regression over at least 4 of the prior 5 years
(Hutton et al. 2012):
IBi,t = β0 + β1GDPt + εi,t (5)
where IB is income before extraordinary items and GDP is the nominal annual gross
domestic product.
Low (High) bonus targeti,j,t+1 = Equals 1 if the annual bonus target for year t+1 is lower (higher) than Analyst
forecasti,j,t+1, and 0 otherwise. Analyst forecasti,j,t+1 is the most recent individual analyst
forecast for year t+1 earnings issued before the approval date of the annual bonus plan
for year t+1.
Walked-down (up)
analyst forecastsi,j,t+1
= Equals 1 if an analyst’s earliest forecast for year t+1 earnings issued within 7 days of
the approval date of the annual bonus plan for year t+1 is lower (higher) than Analyst
forecasti,j,t+1, and 0 otherwise. Analyst forecasti,j,t+1 is the most recent individual analyst
forecast for year t+1 earnings issued before the approval date.
Growthi,t+1 = The expected EPS growth is estimated from the following model:

37
EPS growthi,,t+1 = 𝛼0+ 𝛼1 Past EPS growthi,t + 𝛼2 Sizei,t + 𝛼3 EPi,t
+ 𝛼4 Leveragei,t + 𝛼5 MKTi,t + 𝛼6 RDi,t + 𝛼7 CAPi,t
+ 𝛼8 BTMi,t + 𝛼9 Div yieldi,t + 𝛼10 Past RETi,t + (2)
Growthi,t+1 is the firm-level predicted value from the above cross-sectional model.
Considering the factors that affect the growth of accounting earnings and sales (Chan
et al. 2003, Ciftci and Cready 2011, Gong and Li 2013), we control for past growth in
EPS over the previous 3 years (Past EPS growth), the natural logarithm of the market
value of equity (Size), the earnings-to-price ratio (EP), leverage (Leverage),
advertising expenses divided by sales (MKT), average R&D expenses divided by sales
over the previous 3 years (RD), average capital expenditures divided by total assets
over the previous 3 years (CAP), the book-to-market ratio (BTM), the dividend yield
ratio (Div yield), and stock returns over the previous 12 months (Past RET). We
compute leverage (Leverage) as liabilities minus cash holdings over total assets minus
cash holdings. We calculate the book-to-market ratio (BTM) as total assets divided by
the market value of equity plus long-term liabilities. The dividend yield ratio (Div
yield) is ordinary cash dividends divided by net income before extraordinary items.
We estimate Equation (2) separately for each fiscal year and two-digit SIC code group.
Relative-to-peersi,t = Firm i’s EPS for fiscal year t minus peer firms’ EPS for fiscal year t. Peer portfolios
are constructed following Albuquerque (2009). To construct peer portfolios matched
on industry and firm size, we first form annual portfolios based on two-digit SIC
codes. We use all of the firms on Compustat to construct the portfolios. Second, we
sort firms by beginning-of-year market value into size quartiles. Third, we match each
firm with an industry-size peer group. Peer performance is the equal-weighted
portfolio EPS for an industry-size peer group. When calculating portfolio EPS, we
exclude the EPS of the observed firm.
Reti,t = The firm’s stock returns over the 12-month period ending 3 months after fiscal year-
end t.
Guidei,t+1 = Equals 1 if a firm issues management forecasts from the announcement of year t
earnings to the approval date of the annual bonus plan for year t+1, and 0 otherwise.
Market Valuei,t = The firm’s market value of equity in millions at the end of fiscal year t.
ATi,t = The firm’s total assets in millions at the end of fiscal year t.
ti,

38
REFERENCES
Albuquerque A (2009) Peer firms in relative performance evaluation. J. Accounting Econom. 48(1):69-89.
Anderson S, Dekker H, Sedatole K (2010) An empirical examination of goals and performance-to-goal
following the introduction of an incentive bonus plan with participative goal setting. Management Sci.
56(1):90-109.
Aranda C, Arellano J, Davila A (2014) Ratcheting and the role of relative target setting. Accounting Rev.
89(4):1197-1226.
Armstrong C, Chau J, Ittner C, Xiao J (2017) Internal versus external earnings per share goals and CEO
incentives. Working paper, University of Pennsylvania, Chinese University of Hong Kong, and
University of Rochester.
Barniv R, Hope O-K, Myring M, Thomas W (2009) Do analysts practice what they preach and should
investors listen? Effects of recent regulations. Accounting Rev. 84(4):1015-1039.
Belsley D, Kuh E, Welsch R (1980) Regression Diagnostics: Identifying Influential Data and Sources of
Collinearity. New York: John Wiley.
Bergman N, Roychowdhury S (2008) Investor sentiment and corporate disclosure. J. Accounting Res.
46(5):1057-1083.
Bol J, Lill J (2015) Performance target revisions in incentive contracts: Do information and trust reduce
ratcheting and the ratchet effect? Accounting Rev. 90(5):1755-1778.
Bouwens J, Kroos P (2011) Target ratcheting and effort reduction. J. Accounting Econom. 51(1):171-185.
Bouwens J, Kroos P (2017) The interplay between forward-looking measures and target setting.
Management Sci. 63(9):2868-2884.
Cassar G, Gibson B (2008) Budgets, internal reports, and manager forecast accuracy. Contemporary
Accounting Res. 25(3):707-737.
Chan L, Karceski J, Lakonishok J (2003) The level of persistence of growth rates. J. Finance. 58(2):643-
684.
Chen C-Y, Chen P (2009) NASD Rule 2711 and changes in analysts’ independence in making stock
recommendations. Accounting Rev. 84(4):1041-1071.
Chen S, Matsumoto D (2006) Favorable versus unfavorable recommendations: The impact on analyst
access to management-provided information. J. Accounting Res. 44(4):657-689.
Cheng Y, Harford J, Zhang T (2015) Bonus-driven repurchases. J. Financ. Quant. Anal. 50(3):447-475.
Cheong F, Thomas J (2011) Why do EPS forecast error and dispersion not vary with scale? Implications
for analyst and managerial behaviour. J. Accounting Res. 49(2):359-401.
Chow C, Cooper J, Waller W (1988) Participative budgeting: Effects of a truth-inducing pay scheme and
information asymmetry on slack and performance. Accounting Rev. 63(1):111-122.
Ciftci M, Cready W (2011) Scale effects of R&D as reflected in earnings and returns. J. Accounting Econom.
52(1):62-80.
Cook R (1977) Detection of influential observations in linear regression. Technometrics. 19:15-18.
Cotter J, Tuna I, Wysocki P (2006) Expectations management and beatable targets: How do analysts react
to explicit earnings guidance? Contemporary Accounting Res. 23(3):593-624.
Dekker H, Groot T, Schoute M (2012) Determining performance targets. Behavioral Res. Account.
24(2):21-46.

39
Dugar A, Nathan S (1995) The effect of investment banking relationships on financial analysts’ earnings
forecasts and investment recommendations. Contemporary Accounting Res. 12(1):131-160.
Gong J, Li S (2013) CEO incentives and earnings prediction. Rev. Quantitative Finance Account. 40:647-
674.
Goodman T, Neamtiu M, Shroff N, White H (2014) Management forecast quality and capital investment
decisions. Accounting Rev. 89(1):331-365.
Grabner I, Moers F, Vorst P (2016) Organizational design and voluntary disclosure: The effect of target
setting quality on the provision and nature of management guidance. Working paper, Maastricht
University.
Graham J, Harvey C, Rajgopal S (2005) The economic implications of corporate financial reporting. J.
Accounting Econom. 40(1):3-73.
Hansen S, Otley D, Van der Stede W (2003) Practice developments in budgeting: An overview and research
perspective. J. Management Account. Res. 15:95-116.
Hassell J, Jennings R, Lasser D (1988) Management earnings forecasts: Their usefulness as a source of
firm-specific information to security analysts. J. Financial Res. 11(4):303-319.
Heckman J (1979) The sample selection bias as a specification error. Econometrica 47(1):153-162.
Hemmer T, Labro E (2008) On the optimal relation between the properties of managerial and financial
reporting systems. J. Accounting Econom. 46(5):1209-1240.
Hoberg G, Phillips G (2016) Text-based network industries and endogenous product differentiation. J.
Political Econom. 124(5):1423-1465.
Holmstrom B (1979) Moral hazard and observability. Bell J. Econom. 10(1):74-91.
Houston J, Lev B, Tucker J (2010) To guide or not to guide? Causes and consequences of stopping quarterly
earnings guidance. Contemporary Accounting Res. 27(1):143-185.
Huang R, Marquardt C, Zhang B (2014) Why do managers avoid EPS dilution? Evidence from debt equity
choice. Rev. Accounting Stud. 19(2):877-912.
Hutton A, Lee L, Zhou S (2012) Do managers always know better? The relative accuracy of management
and analyst forecasts. J. Accounting Res. 50(5):1217-1244.
Indjejikian R, Matějka M, Merchant K, Van der Stede W (2014a) Earnings targets and annual bonus
incentives. Accounting Rev. 89(4):1227-1258.
Indjejikian R, Matějka M, Schloetzer J (2014b) Target ratcheting and incentives: Theory, evidence, and
new opportunities. Accounting Rev. 89(4):1259-1267.
Indjejikian R, Nanda D (2002) Executive target bonuses and what they imply about performance standards.
Accounting Rev. 77(4):793-819.
Ittner C, Larcker D (2001) Assessing empirical research in managerial accounting: A value-based
management perspective. J. Accounting Econom. 32(1-3):349-410.
Ittner C, Larcker D, Meyer M (2003) Subjectivity and the weighting of performance measures: Evidence
from a balanced scorecard. Accounting Rev. 78(3):725-758.
Jayaraman S, Milbourn T, Seo H (2015) Product market peers and relative performance evaluation.
Working paper, University of Rochester, Washington University in Saint Louis, and National
University of Singapore.

40
Kim S, Shin J (2017) Executive bonus target ratcheting: Evidence from the new executive compensation
disclosure rules. Contemporary Accounting Res. Forthcoming.
Laffont J, Tirole J (1993) A Theory of Incentives in Procurement and Regulation. Cambridge, MA: The
MIT Press.
Lennox C, Francis J, Wang Z (2012) Selection models in accounting research. Accounting Rev. 87(2):589-
616.
Leone A, Rock S (2002) Empirical tests of budget ratcheting and its effect on managers’ discretionary
accrual choices. J. Accounting Econom. 33(1):43-67.
Malmendier U, Shanthikumar D (2014) Do security analysts speak in two tongues? Rev. Financial Stud.
27(5):1287-1322.
Matsunaga S, Park C (2001) The effect of missing a quarterly earnings benchmark on the CEO’s annual
bonus. Accounting Rev. 76(3):313-332.
Mercer (2009) Pay for Results: Aligning Executive Compensation with Business Performance. Hoboken,
NJ: John Wiley & Sons, Inc.
Mikhail M, Walther B, Willis R (1997) Do security analysts improve their performance with experience? J.
Accounting Res. 35(supplement):131-157.
Mittendorf B, Zhang Y (2005) The role of biased earnings guidance in creating a healthy tension between
managers and analysts. Accounting Rev. 80(4):1193-1209.
Murphy K (2000) Performance standards in incentive contracts. J. Accounting Econom. 30(3):245-278.
Van der Stede W (2000) The relationship between two consequences of budgetary controls: Budgetary
slack creation and managerial short-term orientation. Accounting Organ. Soc. 25:609-622.
Vuong Q (1989) Likelihood ratio tests for model selection and non-nested hypotheses. Econometrica
57(2):307-333.
Weitzman M (1980) The ratchet principle and performance incentives. Bell J. Econom. 11(1):302-308.
Young S (1985) Participative budgeting: The effects of risk aversion and asymmetric information on
budgetary slack. J. Accounting Res. 23(2):829-842.

41
FIGURE 1
Timeline of Analyst Forecasts
This figure illustrates the timeline of analyst forecasts for year t+1 earnings issued from the announcement of year t
earnings to the approval date of the annual bonus plan for year t+1. If the approval date is missing, we use the end
date of the 3 months after the fiscal year-end as the approval date. If an analyst issues multiple forecasts during this
period, we only use the most recent one. We average the analyst forecasts of year t+1 earnings to derive Analyst
forecasti,t+1. Analyst forecast data come from I/B/E/S.

42
TABLE 1
Sample Selection
S&P 1500 firm years from 2006 to 2014: 13,140
Less firm years that do not use EPS as one of the performance measures
for their executive annual bonus contracts: (9,837)
S&P 1500 firm years that use EPS as a performance measure
for executive annual bonus contracts: 3,303
Less firm years that lack EPS target information for executive bonus contracts: (1,232)
Sample firm years that have EPS target information: 2,071
Less firm years that lack analyst forecast information: (597)
Sample firm years that have EPS target and analyst forecast information: 1,474
Less firm years that lack control variables (e.g., Growth, Relative-to-peers, and Ret): (206)
Sample firm years that have EPS target and analyst forecast information, and control variables: 1,268
Less firm years that lack two consecutive years of target data: (89)
Final sample 1,179
This table presents the sample selection procedure.

43
TABLE 2
Descriptive Statistics
Measure N Mean Median Q1 Q3 Std. Dev.
Target EPSi,t+1−Target EPSi,t 1,179 0.202 0.215 -0.045 0.490 0.728
Target revisioni,t+1 1,179 0.116 0.098 -0.022 0.228 0.355
Actual EPSi,t−Target EPSi,t 1,179 0.039 0.060 -0.080 0.230 0.588
Target deviationi,t 1,179 0.017 0.027 -0.040 0.111 0.318
Analyst forecasti,t+1−Actual EPSi,t 1,179 0.164 0.162 -0.069 0.381 0.640
Analyst forecast devi,t+1 1,179 0.110 0.075 -0.034 0.181 0.380
Management forecasti,t+1−Actual EPSi,t 695 0.052 0.110 -0.150 0.270 0.638
Management forecast devi,t+1 695 0.026 0.050 -0.068 0.114 0.300
Market valuei,t 1,179 12,530 3,927 1,334 11,832 24,789
ATi,t 1,179 16,629 4,306 1,383 12,371 39,695
Relative-to-peersi,t 1,179 0.774 0.602 -0.324 1.629 1.824
Ret i,t 1,179 0.092 0.127 -0.352 0.584 1.014
Growthi,t+1 1,179 0.150 0.134 -0.085 0.333 0.371
D_NEGi,t 1,179 0.348 0.000 0.000 1.000 0.476
Guidei,t+1 1,179 0.589 1.000 0.000 1.000 0.492
This table reports the descriptive statistics for the key variables. The sample includes 1,179 firm-year observations
during the 2006 to 2014 period. Appendix C provides the variable definitions.

44
TABLE 3
Correlations
Target EPSi,t+1
−Target EPSi,t (a) (b) (c)
(a) Actual EPSi,t−Target EPSi,t 0.647 ***
(b) Analyst forecast i,t+1−Actual EPSi,t 0.384 *** -0.186 ***
(c) Management forecast i,t+1−Actual EPSi,t 0.308 *** -0.223 *** 0.779 ***
(d) Growthi,t+1 0.070 *** 0.003 0.128 *** 0.061
This table shows the correlations between the key variables. The sample includes 1,179 firm-year observations during
the 2006 to 2014 period. Appendix C provides the variable definitions. *** denotes statistical significance at the 1%
level.

45
TABLE 4
Test of the Association between Analyst Forecasts and Target Revisions (H1)
Target revisioni,t+1= λ0 + λ1 Target deviationi,t + λ2 Target deviationi,t ×D_NEGi,t + λ3 Analyst forecast devi,t+1
+ λ4 Relative-to-peersi,t + λ5 Growth i,t+1 + λ6 D_NEGi,t + λ7 Ret i,t + λ8 Guide i,t+1
+ Year and industry fixed effects + (1)
Dependent variable: Target revisioni,t+1
Independent variables: Pred. (1) (2)
Intercept -0.023 0.013 (-0.93) (0.68)
Target deviationi,t + 1.073 *** 0.982 *** (15.53) (15.69)
Target deviationi,t × D_NEGi,t − -0.731 *** -0.355 *** (-6.26) (-2.82)
Analyst forecast devi,t+1 + 0.376 *** (5.45)
Relative-to-peersi,t − -0.019 *** -0.006 (-3.84) (-1.59)
Growthi,t+1 + 0.009 0.001 (1.08) (0.00)
D_NEGi,t ? -0.057 ** -0.038 *
(-2.45) (-1.85)
Reti,t + 0.174 *** 0.101 *** (4.95) (3.43)
Guidei,t+1 ? 0.018 0.014
(0.91) (0.80)
Year-fixed effects Included Included
Industry-fixed effects Included Included
Number of observations 1,179 1,179
Adjusted R2 58.03% 69.68%
This table reports the results of estimating Equation (1) using the OLS regression, where all t-statistics (in parentheses)
are based on the standard errors clustered by firm. Appendix C provides the variable definitions. All of the variables
are winsorized at the 1% and 99% levels. ***, **, and * denote statistical significance at the 1%, 5%, and 10% levels,
respectively.
ti,

46
TABLE 5
Effect of Incorporating Analyst Forecasts into Target Setting on Target Accuracy
|Target deviationi,t+1|= λ0 + λ1 |Target deviationi,t |+ (3)
Dependent variable: |Target deviationi,t+1|
Independent variables: Pred. (1) (2)
Intercept 0.096 *** 0.137 *** (7.07) (9.50)
Target deviationi,t + 0.559 *** 0.652 *** (6.11) (7.78)
Number of observations 1,148 1,148
R2 15.15% 16.62%
Vuong’s (1989) Z-statistic Z-statistic: 3.167 (p-value = 0.002)
This table reports the results of estimating Equation (3). |Target deviationi,t| is the absolute value of (Actual EPSi,t −
Target EPSi,t) divided by Target EPSi,t. In Column (1), we define |Target deviationi,t+1| as the absolute value of (Actual
EPSi,t+1 − Target EPSi,t+1) divided by Target EPSi,t. In Column (2), we define |Target deviationi,t+1| as the absolute
value of (Actual EPSi,t+1 − Predicted Target EPSi,t+1) divided by Target EPSi,t. Predicted Target EPSi,t+1 is estimated
as the sum of Target EPSi,t and the predicted target revision for year t+1 is calculated using the following model:
Target revisioni,t+1= λ0 + λ1 Target deviationi,t + λ2 Target deviationi,t ×D_NEGi,t + λ3 Relative-to-peersi,t
+ λ4 Growth i,t+1 + λ5 D_NEGi,t + λ6 Ret i,t + λ7 Guide i,t+1 + Year and industry fixed effects +
The Vuong (1989) test is a likelihood ratio-based test for model selection. The OLS regression is estimated, where all
t-statistics (in parentheses) are based on the standard errors clustered by firm. Appendix C provides the variable
definitions. All of the variables are winsorized at the 1% and 99% levels. *** denotes statistical significance at the 1%
level.
ti,
ti,
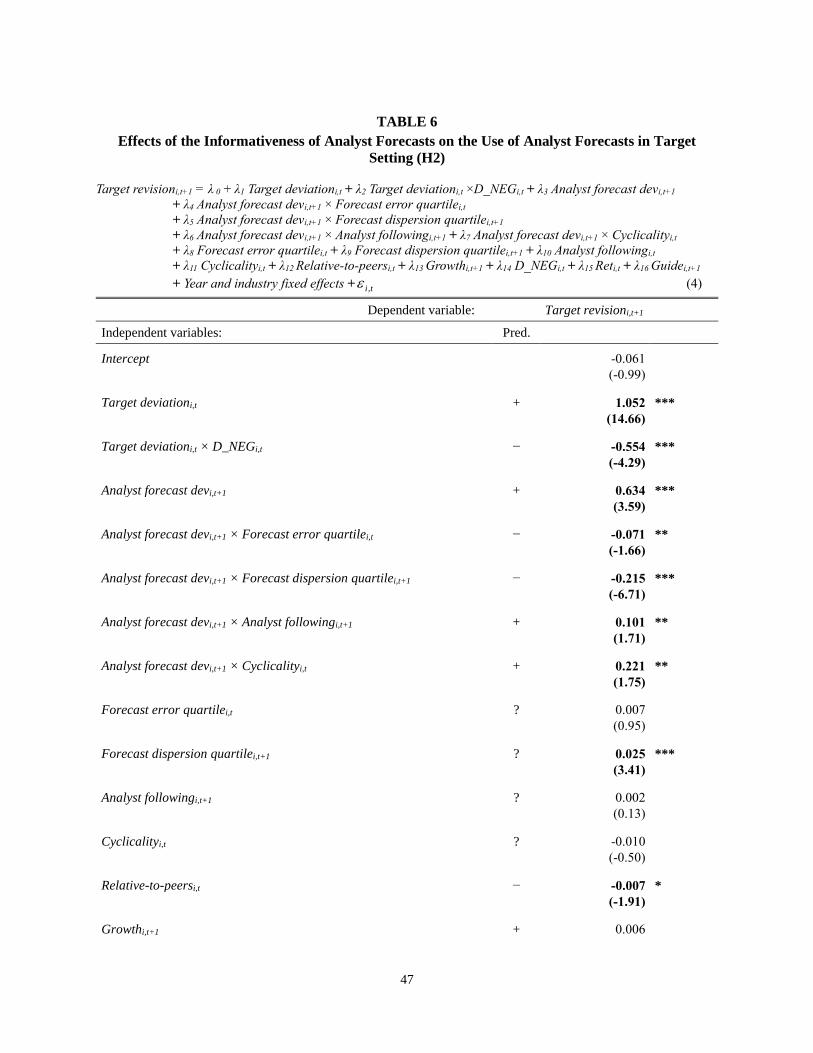
47
TABLE 6
Effects of the Informativeness of Analyst Forecasts on the Use of Analyst Forecasts in Target
Setting (H2)
Target revisioni,t+1 = λ 0 + λ1 Target deviationi,t + λ2 Target deviationi,t ×D_NEGi,t + λ3 Analyst forecast devi,t+1
+ λ4 Analyst forecast devi,t+1 × Forecast error quartilei,t
+ λ5 Analyst forecast devi,t+1 × Forecast dispersion quartilei,t+1
+ λ6 Analyst forecast devi,t+1 × Analyst followingi,t+1 + λ7 Analyst forecast devi,t+1 × Cyclicalityi,t
+ λ8 Forecast error quartilei,t + λ9 Forecast dispersion quartilei,t+1 + λ10 Analyst followingi,t
+ λ11 Cyclicalityi,t + λ12 Relative-to-peersi,t + λ13 Growthi,t+1 + λ14 D_NEGi,t + λ15 Reti,t + λ16 Guidei,t+1
+ Year and industry fixed effects + (4)
Dependent variable: Target revisioni,t+1
Independent variables: Pred.
Intercept -0.061 (-0.99)
Target deviationi,t + 1.052 *** (14.66)
Target deviationi,t × D_NEGi,t − -0.554 *** (-4.29)
Analyst forecast devi,t+1 + 0.634 *** (3.59)
Analyst forecast devi,t+1 × Forecast error quartilei,t − -0.071 **
(-1.66)
Analyst forecast devi,t+1 × Forecast dispersion quartilei,t+1 − -0.215 ***
(-6.71)
Analyst forecast devi,t+1 × Analyst followingi,t+1 + 0.101 **
(1.71)
Analyst forecast devi,t+1 × Cyclicalityi,t + 0.221 **
(1.75)
Forecast error quartilei,t ? 0.007
(0.95)
Forecast dispersion quartilei,t+1 ? 0.025 ***
(3.41)
Analyst followingi,t+1 ? 0.002
(0.13)
Cyclicalityi,t ? -0.010
(-0.50)
Relative-to-peersi,t − -0.007 *
(-1.91)
Growthi,t+1 + 0.006
ti,

48
(0.77)
D_NEGi,t ? -0.057 ***
(-2.62)
Reti,t + 0.080 **
(2.57)
Guidei,t+1 ? 0.020
(1.07)
Year-fixed effects Included
Industry-fixed effects Included
Number of observations 1,158
Adjusted R2 66.07%
This table reports the results of estimating Equation (4). The sample includes 1,158 firm-year observations during the
2006 to 2014 period. The OLS regression is estimated, where all t-statistics (in parentheses) are based on the standard
errors clustered by firm. Appendix C provides the variable definitions. All of the variables are winsorized at the 1%
and 99% levels. ***, **, and * denote statistical significance at the 1%, 5%, and 10% levels (one-tailed for Analyst
forecast devi,t+1 × Forecast error quartilei,t, Analyst forecast devi,t+1 × Forecast dispersion quartilei,t+1, Analyst
forecast devi,t+1 × Analyst followingi,t+1, and Analyst forecast devi,t+1 × Cyclicalityi,t), respectively.

49
TABLE 7
Effects of Analyst Affiliation on the Association Between Analyst Forecasts and Target Revisions
(H3)
Target revisioni,t+1= λ0 + λ1 Target deviationi,t + λ2 Target deviationi,t ×D_NEGi,t + λ3 Analyst forecast devi,t+1
+ λ4 Relative-to-peersi,t + λ5 Growth i,t+1 + λ6 D_NEGi,t + λ7 Ret i,t + λ8 Guide i,t+1
+ Year and industry fixed effects + (1)
Independent variables: Pred.
(1)
Analyst forecasts of
affiliated analysts
(2)
Analyst forecasts of
unaffiliated analysts
Intercept 0.096 0.133 (0.77) (1.06)
Target deviationi,t + 0.791 *** 0.802 *** (2.80) (2.99)
Target deviationi,t × D_NEGi,t − -0.062 -0.012 (-0.22) (-0.05)
Analyst forecast devi,t+1 + 0.580 *** 0.620 *** (6.16) (5.92)
Relative-to-peersi,t − -0.040 *** -0.044 *** (-3.04) (-3.49)
Growthi,t+1 + -0.023 -0.021 (-0.67) (-0.64)
D_NEGi,t ? -0.158 ** -0.149 **
(-2.21) (-2.10)
Reti,t + 0.078 0.055 (1.27) (0.95)
Guidei,t+1 ? -0.028 -0.012
(-0.45) (-0.17)
Chi-squared test: (1) λ3 = (2) λ3, 4.75 (p-value = 0.0293)
Year-fixed effects Included Included
Industry-fixed effects Included Included
Number of observations 119 119
Adjusted R2 80.82% 81.70%
This table reports the results of estimating Equation (1) using the OLS regression, where all t-statistics (in parentheses)
are based on the standard errors clustered by firm. An analyst is classified as an affiliated analyst if his or her brokerage
firm was a lead or co-underwriter of the covered firm’s IPO and SEO over the previous 10 years (Malmendier and
Shanthikumar 2014). Column (1) shows the test results using Analyst forecast devi,t+1 measured based on analyst
forecasts issued by affiliated analysts. Column (2) shows the test results using Analyst forecast devi,t+1 measured based
on analyst forecasts issued by unaffiliated analysts. Appendix C provides the variable definitions. All of the variables
are winsorized at the 1% and 99% levels. *** and ** denote statistical significance at the 1% and 5% levels,
respectively.
ti,

50
TABLE 8
Additional Analyses I
Panel A: Relative Importance of Analyst Forecasts Versus Management Forecasts in Target Setting
Target revisioni,t+1 = λ0 + λ1 Target deviationi,t + λ2 Target deviationi,t × D_NEGi,t + λ3 Analyst forecast devi,t+1
+ λ4 Management forecast devi,t+1 + λ5 Relative-to-peersi,t + λ6 Growthi,t+1 + λ7 D_NEGi,t
+ λ8 Reti,t + Year and industry fixed effects + (6)
Dependent variable: Target revisioni,t+1
Independent variables: Pred. (1) (2) (3) (4) (5)
Intercept -0.043 0.110 *** 0.000 -0.019 0.102 *** (-1.38)
(3.96)
(0.01)
(-0.50)
(3.59)
Target deviationi,t + 1.121 *** 1.068 *** 1.255 *** 1.014 *** 1.048 *** (10.53)
(11.48)
(7.30)
(7.40)
(11.30)
Target deviationi,t ×
D_NEGi,t −
-0.409 *** -0.174 -1.069 *** -0.240 -0.112 (-2.86)
(-1.30)
(-4.00)
(-1.16)
(-0.87)
Analyst forecast devi,t+1
+ 0.551 *** 0.220 ** 0.712 *** 0.550 ***
(6.96)
(2.18)
(6.11)
(6.93)
Management forecast devi,t+1 + 0.284 *** -0.005 -0.054 -0.005
(4.18)
(-0.13)
(-1.18)
(-0.14)
Relative-to-peersi,t − -0.010 * -0.005 -0.010 -0.016 -0.004
(-1.91)
(-1.11)
(-1.04)
(-1.64)
(-0.96)
Growthi,t+1 + 0.004 -0.003 0.003 0.018 -0.003
(0.61)
(-0.61)
(0.16)
(1.21)
(-0.63)
D_NEGi,t ? -0.021 -0.008 -0.104 -0.042 -0.005
(-1.22)
(-0.46)
(-1.64)
(-1.49)
(-0.33)
Reti,t + 0.110 *** 0.053 ** 0.085 -0.103 * 0.057 **
(4.04)
(2.10)
(1.35)
(-1.84)
(2.34)
Year-fixed effects Included Included Included Included Included
Industry-fixed effects Included Included Included Included Included
Number of observations 695 695 484 115 665
Adjusted R2 62.02% 72.71% 61.74% 82.29% 75.30%
ti,

51
TABLE 8 (Continued)
Panel B: Correlations Between Low (High) Bonus Targets and Walked-Down (Walked-Up) Analyst
Forecasts
Low
bonus targeti,t+1
High
bonus targeti,t+1
Walked-down
analyst forecastsi,t+1
High bonus targeti,t+1 -0.961 ***
Walked-down analyst forecastsi,t+1 -0.033 0.025
Walked-up analyst forecastsi,t+1 0.032 -0.026 -0.994 ***
Panel A of this table reports the results of estimating Equation (6). Panel B reports the correlation matrix for the
relation between low (high) bonus targets and walked-down (walked-up) analyst forecasts. In Columns (1) and (2) of
Panel A, the regressions are estimated using a reduced sample of firms that issued management earnings forecasts.
The results in Column (3) are based on a reduced sample of firms that did not issue management earnings forecasts.
The results in Columns (4) and (5) are based on a sample of firms that issued management earnings forecasts, where
Analyst forecast devi,t+1 in Column (4) is measured using analyst forecasts issued before management forecasts and
Analyst forecast devi,t+1 in Column (5) is measured using analyst forecasts issued after management forecasts. The
results in Panel A are based on the OLS regression, where all t-statistics in parentheses are based on standard errors
clustered by firm. The results in Panel B are based on individual analyst-level data. The sample for Panel B is 665
observations at the firm-year-analyst level. Appendix C provides the variable definitions. All of the variables are
winsorized at the 1% and 99% levels. ***, **, and * denote statistical significance at the 1%, 5%, and 10% levels,
respectively.

52
TABLE 9
Additional Analyses II
Panel A: Alternative Growth Measures
Target revisioni,t+1= λ0 + λ1 Target deviationi,t + λ2 Target deviationi,t ×D_NEGi,t + λ3 Analyst forecast devi,t+1
+ λ4 Relative-to-peersi,t + λ5 Growth i,t+1 + λ6 D_NEGi,t + λ7 Ret i,t + λ8 Guide i,t+1
+ Year and industry fixed effects + (1)
Dependent variable: Target revisioni,t+1
Growth measure based on: Sales Income before
extraordinary items
Operating
income before
depreciation
Independent variables: Pred. (1) (2) (3)
Intercept 0.009 0.014 0.017 (0.47) (0.69) (0.72)
Target deviationi,t + 0.982 *** 0.982 *** 0.983 *** (15.85) (15.69) (15.69)
Target deviationi,t × D_NEGi,t − -0.357 *** -0.355 *** -0.357 *** (-2.85) (-2.82) (-2.79)
Analyst forecast devi,t+1 + 0.371 *** 0.376 *** 0.377 *** (5.38) (5.46) (5.46)
Relative-to-peersi,t − -0.006 -0.006 -0.006 (-1.65) (-1.58) (-1.62)
Growthi,t+1 + 0.145 -0.001 -0.009 (1.64) (-0.11) (-0.40)
D_NEGi,t ? -0.039 * -0.038 * -0.039 *
(-1.89) (-1.85) (-1.88)
Reti,t + 0.091 *** 0.102 ** 0.103 ** (3.09) (3.42) (3.53)
Guidei,t+1 ? 0.013 0.014 0.014
(0.76) (0.80) (0.81)
Year-fixed effects Included Included Included
Industry-fixed effects Included Included Included
Number of observations 1,179 1,179 1,176
Adjusted R2 69.78% 69.68% 69.64%
ti,

53
TABLE 9 (Continued)
Panel B: Alternative Measure for Peer Performance
Target revisioni,t+1= λ0 + λ1 Target deviationi,t + λ2 Target deviationi,t ×D_NEGi,t + λ3 Analyst forecast devi,t+1
+ λ4 Relative-to-peersi,t + λ5 Growth i,t+1 + λ6 D_NEGi,t + λ7 Ret i,t + λ8 Guide i,t+1
+ Year and industry fixed effects + (1)
Dependent variable: Target revisioni,t+1
Independent variables: Pred. (1)
Intercept 0.024 (0.51)
Target deviationi,t + 0.985 *** (14.35)
Target deviationi,t × D_NEGi,t − -0.368 *** (-2.48)
Analyst forecast devi,t+1 + 0.322 *** (4.46)
Relative-to-peersi,t − -0.001
(-0.27)
Growthi,t+1 + -0.004
(-0.49)
D_NEGi,t ? -0.041 *
(-1.86)
Reti,t + 0.109 ***
(3.32)
Guidei,t+1 ? 0.017
(0.89)
Year-fixed effects Included
Industry-fixed effects Included
Number of observations 1,028
Adjusted R2 67.00%
Panel A of this table reports the estimation results of Equation (1) using alternative measures of Growthi,t+1. We replace
the dependent variable in Equation (2) with alternative growth proxies, such as growth in sales, income before
extraordinary items, and operating income before depreciation. Panel B reports the results of estimating Equation (1)
using the alternative method of identifying industry peers following Jayaraman et al. (2015) and Hoberg and Phillips
(2016). The OLS regression is estimated, where all t-statistics (in parentheses) are based on the standard errors
clustered by firm. Appendix C provides the variable definitions. All of the variables are winsorized at the 1% and 99%
levels. ***, **, and * denote statistical significance at the 1%, 5%, and 10% levels, respectively.
ti,