Embed Size (px)
Citation preview

FE834
The U.S. Orange and Grapefruit Juice Markets: History, Development, Growth, and Change1
Robert A. Morris2
1. This is EDIS document FE834, a publication of the Food and Resource Economics Department, Florida Cooperative Extension Service, Institute of Food and Agricultural Sciences, University of Florida, Gainesville, FL. Published June 2010. Please visit the EDIS Web site at http://edis.ifas.ufl.edu.
2. Robert A. Morris, associate extension scientist and economist, Food and Resource Economics Department, Citrus Research and Education Center, Lake Alfred, FL; Florida Cooperative Extension Service, Institute of Food and Agricultural Sciences, University of Florida, Gainesville, FL 32611.
The use of trade names in this publication is solely for the purpose of providing specific information. UF/IFAS does not guarantee or warranty the products named, and references to them in this publication does not signify our approval to the exclusion of other products of suitable composition.
The Institute of Food and Agricultural Sciences (IFAS) is an Equal Opportunity Institution authorized to provide research, educational information and other services only to individuals and institutions that function with non-discrimination with respect to race, creed, color, religion, age, disability, sex, sexual orientation, marital status, national origin, political opinions or affiliations. U.S. Department of Agriculture, Cooperative Extension Service, University of Florida, IFAS, Florida A&M University Cooperative Extension Program, and Boards of County Commissioners Cooperating. Millie Ferrer- Chancy, Interim Dean
Introduction
A unique characteristic of both orange and grapefruit juice (hereafter referred to together as citrus juices) is that consumers can and do squeeze fresh oranges and grapefruit at home, when citrus is in season. In contrast, other fruit juices, such as apple, grape or pineapple, are not as easily made at home, thus most consumers are unfamiliar with the fresh-squeezed taste of these other fruit juice varieties. Consequently, the term "fresh-squeezed" has set a taste standard for orange and grapefruit juice that most other fruit juices do not have.
Citrus juices deteriorate quickly once the fruit is squeezed. Enzymes in citrus juices, mainly pectin esterase, cause loss of cloudiness, changes in mouth feel, and deterioration of flavor. The high sugar content in citrus juices causes bacteria, yeasts, and molds to grow rapidly and produce off-flavors. Processes have been developed that increase the time of flavor stability of citrus juices, but the trade-off compromises the flavor of the juice.
Finally, as women have taken jobs outside the home and consumers' real disposable incomes have grown, consumers have increasingly demonstrated a preference for and placed a value on convenience. Citrus juices then, which deteriorate rapidly in fresh-squeezed form, must live up to the higher flavor standard of fresh-squeezed, yet also meet consumers' growing preference for convenience. The challenges faced by citrus juice marketers to meet these exacting and often conflicting criteria tell the story of the successes and failures in the U.S. citrus juice market.
Beginnings of the Citrus Juice Market: Production Development and
Rapid Growth
Prior to the late 1940s, consumers obtained orange and grapefruit juices from either squeezing fresh fruit at home or from canned juice. Although home juicing could produce good-tasting juice, Florida fruit of optimum quality for juicing was only available during a specific season—November through June for oranges and December through April for grapefruit (Figure 1). Also, home juicing was very
Archival copy: for current recommendations see http://edis.ifas.ufl.edu or your local extension office.

The U.S. Orange and Grapefruit Juice Markets: History, Development, Growth, and Change 2
time consuming. While canned citrus juice was available year-round, most consumers considered its flavor to be unacceptably inferior compared to that of fresh-squeezed orange juice. Consequently, the market for citrus juice at that time was relatively small.
Figure 1. Florida citrus fruit harvest seasons for processing different orange and grapefruit types (Source: FASS/USDA 2009)
In the 1940s, as part of the U.S. program to ship food products to its allies, more effort was made to develop an orange juice product that would closely approximate the quality of fresh orange juice in a form that would not spoil quickly and still be available year-round. Such a product was particularly needed by children and expectant or nursing mothers in war-torn Europe as a natural source of vitamin C.
By the mid-1940s, through the combined research efforts of the Florida Citrus Commission and the United States Department of Agriculture (USDA), a type of frozen concentrated orange juice was developed in which the juice was concentrated five- to eight-fold by vacuum evaporation, then diluted with freshly extracted juice to a three- or four-fold concentrate, and then frozen. The concentrate was stable when stored in frozen form, and when the three- or four-fold juice was reconstituted with water, it tasted nearly like fresh juice. In addition, since the product was easier to prepare than fresh-squeezed orange juice, it was felt that its convenience would appeal to many families.
Florida Foods, which later became Minute Maid, was instrumental in the marketing efforts that led to this new product. Early marketing programs consisted of door-to-door product demonstrations and radio commercials by the famous singer and actor, Bing Crosby. Since the quality of frozen concentrated orange juice (FCOJ) was maintained in
frozen form and its price was reasonable, it soon became a leading seller among food products.
Florida production of FCOJ increased from only 226,000 concentrate gallons in the 1945/46 season to over 116 million concentrate gallons by 1961/62 (Florida Canners Association 1963). Moreover, the market growth of concentrate resulted in an enormous growth in demand for oranges. In the 1939/40 season, 15 percent of Florida's 26 million boxes of oranges were processed. By 1969/70, 90 percent of Florida's 143 million boxes of oranges were processed (Florida Canners Association 1972). This 450 percent growth in orange production was largely a result of the growth in demand for FCOJ. In 1969/70, the grapefruit juice market was still predominately canned juice, although by then the 64 million gallon market was only 15 percent as large as the total orange juice market (FDOC 1986).
The growth in demand for FCOJ in the 1950s and 1960s led to the emergence and growth of citrus processors and an increased market focus by the citrus industry. Regulations passed by the Florida Citrus Commission continued to maintain and improve the quality of FCOJ, and a generic advertising program managed by the Florida Department of Citrus (FDOC) helped speed the demand growth for Florida orange juice.
FCOJ was initially exported as part of the Marshall Plan after WWII, and this led to the development of its foreign markets. In 1960, Coca-Cola Company purchased Minute Maid, thereby entering the citrus industry. During this same time, Tropicana began offering orange juice year-round by freezing single-strength juice and storing it for thawing, pasteurizing, packaging, and distribution when Florida oranges were not in season.
Anthony Rossi, Tropicana's founder, believed his customers, who were also milk customers on dairy routes, preferred single-strength orange juice, which he was able to offer during the off-season (Julyin the place of FCOJ. Rossi believed that pasteurization, which did not subject orange juice to high temperatures the way evaporation did, gave a better taste to off-season juice than FCOJ that had been evaporated, and it was easier to produce. Frozen concentrate, by contrast, was cheaper to store and
Archival copy: for current recommendations see http://edis.ifas.ufl.edu or your local extension office.
The U.S. Orange and Grapefruit Juice Markets: History, Development, Growth, and Change 3
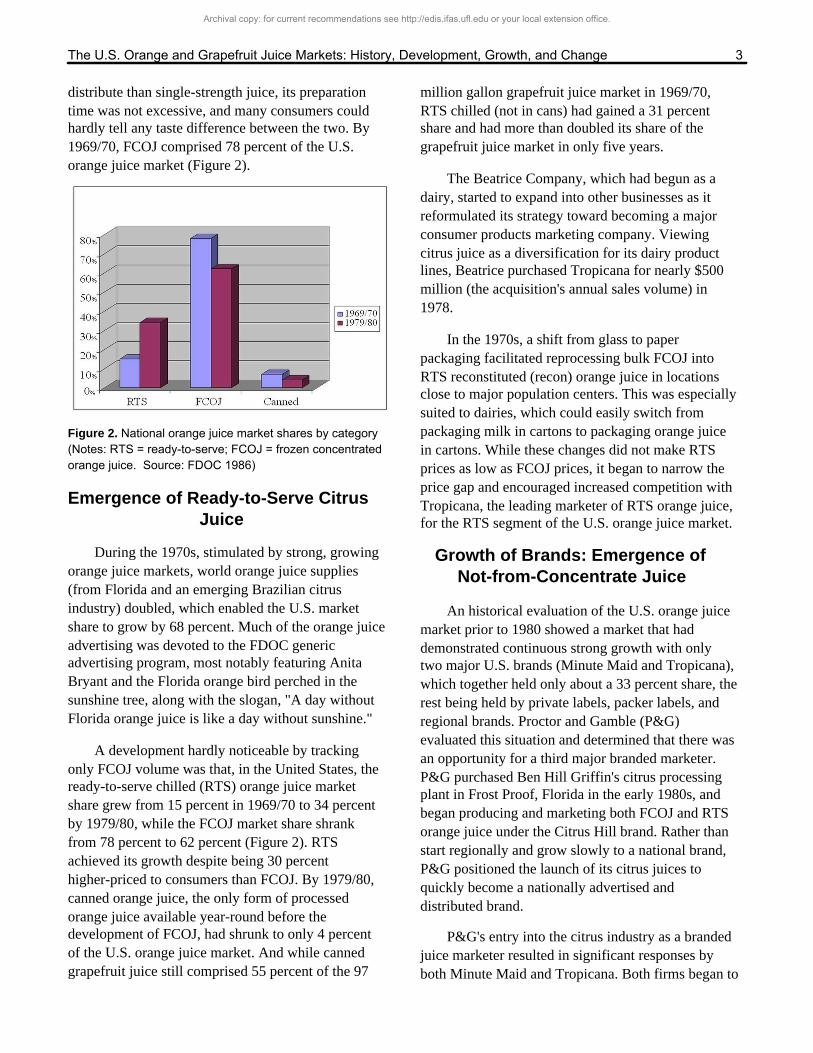
distribute than single-strength juice, its preparation time was not excessive, and many consumers could hardly tell any taste difference between the two. By 1969/70, FCOJ comprised 78 percent of the U.S. orange juice market (Figure 2).
Figure 2. National orange juice market shares by category (Notes: RTS = ready-to-serve; FCOJ = frozen concentrated orange juice. Source: FDOC 1986)
Emergence of Ready-to-Serve Citrus Juice
During the 1970s, stimulated by strong, growing orange juice markets, world orange juice supplies (from Florida and an emerging Brazilian citrus industry) doubled, which enabled the U.S. market share to grow by 68 percent. Much of the orange juice advertising was devoted to the FDOC generic advertising program, most notably featuring Anita Bryant and the Florida orange bird perched in the sunshine tree, along with the slogan, "A day without Florida orange juice is like a day without sunshine."
A development hardly noticeable by tracking only FCOJ volume was that, in the United States, the ready-to-serve chilled (RTS) orange juice market share grew from 15 percent in 1969/70 to 34 percent by 1979/80, while the FCOJ market share shrank from 78 percent to 62 percent (Figure 2). RTS achieved its growth despite being 30 percent higher-priced to consumers than FCOJ. By 1979/80, canned orange juice, the only form of processed orange juice available year-round before the development of FCOJ, had shrunk to only 4 percent of the U.S. orange juice market. And while canned grapefruit juice still comprised 55 percent of the 97
million gallon grapefruit juice market in 1969/70, RTS chilled (not in cans) had gained a 31 percent share and had more than doubled its share of the grapefruit juice market in only five years.
The Beatrice Company, which had begun as a dairy, started to expand into other businesses as it reformulated its strategy toward becoming a major consumer products marketing company. Viewing citrus juice as a diversification for its dairy product lines, Beatrice purchased Tropicana for nearly $500 million (the acquisition's annual sales volume) in 1978.
In the 1970s, a shift from glass to paper packaging facilitated reprocessing bulk FCOJ into RTS reconstituted (recon) orange juice in locations close to major population centers. This was especially suited to dairies, which could easily switch from packaging milk in cartons to packaging orange juice in cartons. While these changes did not make RTS prices as low as FCOJ prices, it began to narrow the price gap and encouraged increased competition with Tropicana, the leading marketer of RTS orange juice, for the RTS segment of the U.S. orange juice market.
Growth of Brands: Emergence of Not-from-Concentrate Juice
An historical evaluation of the U.S. orange juice market prior to 1980 showed a market that had demonstrated continuous strong growth with only two major U.S. brands (Minute Maid and Tropicana), which together held only about a 33 percent share, the rest being held by private labels, packer labels, and regional brands. Proctor and Gamble (P&G) evaluated this situation and determined that there was an opportunity for a third major branded marketer. P&G purchased Ben Hill Griffin's citrus processing plant in Frost Proof, Florida in the early 1980s, and began producing and marketing both FCOJ and RTS orange juice under the Citrus Hill brand. Rather than start regionally and grow slowly to a national brand, P&G positioned the launch of its citrus juices to quickly become a nationally advertised and distributed brand.
P&G's entry into the citrus industry as a branded juice marketer resulted in significant responses by both Minute Maid and Tropicana. Both firms began to
Archival copy: for current recommendations see http://edis.ifas.ufl.edu or your local extension office.

The U.S. Orange and Grapefruit Juice Markets: History, Development, Growth, and Change 4
increase their market-focused approach to the orange juice business. Brand advertising expenditures grew dramatically, greatly outpacing FDOC's generic advertising and almost tripling between 1980 and 1985 (Figure 3). New, more attractive packaging was developed that extended the shelf life of RTS orange juice, product-line extensions containing higher pulp and added calcium were introduced, etc. As the demand for convenience continued to grow, RTS orange juice became the preferred product form, increasing from 34 percent of the market in 1980 to 58 percent by 1989, despite its higher price than FCOJ. Between 1980 and 1989, sales of RTS (mostly recon) grapefruit juice exceeded that of canned, increasing its market share of the industry from 31 percent to 48 percent.
Figure 3. National orange juice advertising for 1980, 1985, and 1990 (Source: Various reports)
In the early 1980s, new senior management with an extensive marketing background was hired at Tropicana to make the business more market driven. During off-season production, Tropicana's RTS orange juice (called "Pure Premium") was made from single-strength juice that had been frozen into blocks and later thawed and pasteurized for packaging. It cost seven times as much to store and distribute as Recon (reconstituted FCOJ), mostly in the major markets where most consumers lived. Tropicana had to charge more for its Pure Premium product in order to cover its cost, but management believed Pure Premium had superior flavor to reconstituted RTS orange juice (Recon) because it had not been subjected to the heat of the evaporation process (Table 1).
To distinguish Pure Premium from other brands and from a growing number of private and packer label RTS products to whom it was losing shares because of Pure Premium's higher price, Tropicana decided to tell the consumer that Pure Premium was not-from-concentrate (NFC), and thus more like fresh-squeezed. Tropicana's marketing programs were highly successful in differentiating Pure Premium as a unique orange juice that had never been concentrated or had water added to it (Figure 4).
Figure 4. Trends in category shares of the U.S. orange juice market, 1988/89–2007/08 (Source: Various reports)
In spite of its premiums to consumers of $1.00 per gallon compared to Recon and almost $2.00 per gallon compared to FCOJ between 1989 and 1998 (Figure 5), NFC doubled its volume in the U.S. orange juice market while both Recon and FCOJ declined (Figure 6). Between 1985 and 1990, marketing successes with Pure Premium catapulted Tropicana to more than double its size. The Seagram Company, Ltd., a major marketer of distilled spirits and wines, spotted Tropicana's success with Pure Premium in the 1980s. Desiring to diversify into the juice business, which fit well with consumer trends toward health and fitness, Seagram purchased Tropicana from Beatrice for $1.2 billion in 1988. Seagram also felt that Tropicana's successes with Pure Premium could be expanded into untapped international markets, an arena where Seagram was an experienced player.
The three national orange juice brands continued their aggressive marketing activities so that, by 1990, brand advertising totaled $71 million, more than four times that of generic and a 417 percent increase over 1980 levels (Figure 3). These increased marketing
Archival copy: for current recommendations see http://edis.ifas.ufl.edu or your local extension office.

The U.S. Orange and Grapefruit Juice Markets: History, Development, Growth, and Change 5
Figure 5. Ten-year average orange juice market prices, 1988/89–1997/98 (Notes: NFC = not-from-concentrate; RECON = reconstituted from concentrate; FCOJ = frozen concentrated orange juice. Source: FDOC 2009a)
Figure 6. Orange juice market category growth, 1988/89ï1997/98 (Notes: NFC = not-from-concentrate; RECON = reconstituted from concentrate; FCOJ = frozen concentrated orange juice. Source: FDOC 2009a)
efforts enabled the national brands to grow their share of the orange juice market from 37 percent in 1983 (Citrus Hill's emergence) to 58 percent by 1989. Moreover, by 1990, these three national brands' share of the more value-added RTS orange juice segment had grown to 68 percent.
Supply disruptions from severe weather freezes and high orange and grapefruit prices in the 1980s also heightened the importance of less commodity-like juice products, such as juice beverages (juice drinks containing added sugar and water) and juice blends, to the national brands. The result was that these juice beverages and blends competed more directly with orange and grapefruit
juice. Juice beverages contained citrus and sometimes other juices, but were not 100 percent juice, which reduced their dependency on fruit crops as a source of supply. Although juice blends were 100 percent juice, they contained several different types of fruit juices and were thus similarly less dependent on supply conditions for a single type of fruit.
Tropicana developed and successfully launched its Twister juice beverage products, Citrus Hill began marketing Sunny Delight and later purchased Hawaiian Punch, and Minute Maid continued to successfully market its Hi-C and 5-Alive juice beverages. Higher orange and grapefruit juice prices also increased demand for Ocean Spray's juice beverage products, enhanced the opportunity for Dole to develop and successfully market its lines of chilled ready-to-serve juice blends (new breakfast juices, pure and light), and created an opportunity for a number of packer labels and regional brands to sell juice blends and juice beverages. The result was that, between 1980 and 1994, juice beverages and juice blends grew their share of the U.S. fruit beverage market from 24 percent to over 40 percent, while orange juice declined from 47 percent to 34 percent and grapefruit juice declined to only about 2 percent of this market (Figure 7). The U.S. consumer, it seemed, was continuing to consume more fruit juice products in spite of supply restrictions that limited growth in orange and grapefruit juice availability.
Figure 7. Fruit juice and beverage market (Source: A.C. Nielsen, various issues)
Archival copy: for current recommendations see http://edis.ifas.ufl.edu or your local extension office.

The U.S. Orange and Grapefruit Juice Markets: History, Development, Growth, and Change 6
Despite a severe freeze in late December of 1989, Florida's orange crop rebounded sharply. Since most of the citrus trees were now farther south, the 1989 freeze destroyed oranges but left most of the state's trees with little damage. By the early-to-mid 1990s, Florida's inventory of orange and grapefruit trees was the largest in history, and with Brazilian orange tree inventories also at record levels, world orange supplies grew dramatically while fruit prices tumbled to record lows. Juice marketers scrambled to move the large and growing supplies into the marketplace.
As a grower-owned cooperative with many fresh-fruit grower members and (prior to the mid-1990s) as a regional brand, Florida's Natural searched for ways to market its members' supplies of red grapefruit. In 1989, the cooperative introduced the first NFC red grapefruit juice. It was a better-tasting product than the other Recon grapefruit juices on the market, the taste of which suffered from the heat of evaporation. Consumers liked Florida's Natural NFC grapefruit juice so well that Tropicana followed with its own Ruby Red NFC grapefruit juice in 1993, which was also successful. The Florida Citrus Commission raised quality standards for grapefruit juice and processors improved blending to enhance taste, color, and mouth feel, so that the product was more palatable to consumers.
Although P&G supposedly had developed a new, superior orange juice in the 1980s, the product was reportedly too costly to produce and distribute commercially. This left P&G to compete with FCOJ against Minute Maid and with RTS against Tropicana, both well-established brands, particularly in their key segments. In 1992, P&G announced that they were selling their citrus processing facilities and retiring their orange juice brand, Citrus Hill, which had about a 7–8 percent share of the U.S. orange juice market. P&G cited losses in the orange juice business combined with a shift in corporate objectives as reasons for its exit. Citrus World (renamed Florida's Natural Growers) had been a strong regional brand for decades with Donald Duck, and a small national brand with Blue Bird canned citrus juices. Now, as Florida's Natural NFC orange juice, it soon captured much of P&G's market share which, along with successes from its new NFC red grapefruit juice
product line, enabled Florida's Natural to become the third largest national citrus juice brand.
Under Seagram ownership, Tropicana continued its aggressive growth as a growing base as consumers chose Tropicana Pure Premium and its various line extensions in preference to other orange juices. Despite a severe supply-disrupting freeze in 1989, Tropicana sales of Pure Premium and total consumption of NFC (which was mostly Tropicana products) grew every year. In the early 1990s, Tropicana successfully expanded Pure Premium sales into Europe and Japan, and in spite of an even higher price due to shipping costs from Florida (Europe and Japan do not have significant supplies of domestic juice oranges), consumers responded strongly in favor of Tropicana's NFC. Spotting Tropicana's successes, PepsiCo purchased the company in 1998 for $3.3 billion.
Current Times: Challenges from Diseases and the Marketplace
Between 1998 and 2008, the Florida citrus industry continued to experience sweeping changes. On the supply side, the Florida orange crop was battered by hurricanes, an atypically expensive real estate market, citrus canker that spread out of control, and the emergence of the most devastating citrus disease known—Huanglongbing (HLB), or citrus greening. The result was that Florida's citrus crops were reduced from surplus to scarcity (Table 2). Between 1997/98 and 2006/07, orange production plummeted by 47 percent, from 244 million boxes to 129 million boxes, while grapefruit production dropped about as much, from 50 million boxes to 27 million boxes, a 46 percent decline (Table 2). Oranges rebounded somewhat in 1997/98, to 170 million boxes, but grapefruit production remained static.
In addition, the production base for Florida citrus was substantially eroded. Between 1997/98 and 2007/08, the number of orange trees declined by 23 percent and the number of grapefruit trees were reduced to only 44 percent of its 1998 level (Table 3). The result is that using five-season (1993/94–1997/98) average yields per bearing tree, benchmark orange production levels have declined
Archival copy: for current recommendations see http://edis.ifas.ufl.edu or your local extension office.

The U.S. Orange and Grapefruit Juice Markets: History, Development, Growth, and Change 7
from the 212 million box level in the 1993/94–1997/98 period to the current 167 million box level. Likewise, grapefruit production has been reduced from a production level of 53 million boxes in the 1993/94–1997/98 period to the current level of about 23 million boxes. However, the figures shown are based on yield-per-tree data before greening or endemic canker. Due to impacts of endemic canker and greening, future yields per tree will likely be less than these historical levels—current expectations are that as a result of greening, tree numbers as well as yields will continue to decline in the future.
Reduced production brought about much higher prices for fruit and juice. Delivered-in processed orange prices per pound-solids increased from $0.87 in 1997/98 to $2.11 in 2006/07 (Table 2). Grapefruit production was affected differently by the hurricanes in 2004 and 2005 than orange production, thus delivered-in processed grapefruit prices peaked in 2005/06 rather than in 2006/07 like orange prices (Table 2). Processed grapefruit prices per pound-solids went from $0.23 in 1997/98 to $2.06 in 2004/05. The problem was that even though supplies were substantially below levels at the end of the 1990s, the increased fruit prices were temporary. During the 2008/09 season, delivered-in processed orange prices dropped to just over $1.00, and delivered-in processed grapefruit prices dropped to just over $0.60.
The reason for these price declines was reduced retail juice consumption resulting from the higher juice prices. Unfortunately, when fruit prices began to decline with recovering crops, retailers did not lower the prices they charged for juice, which further eroded consumption. For example, between 2003/04 and 2006/07, retail orange juice prices increased by 32 percent and consumption declined by 19 percent (Table 4). During this same period, retail grapefruit juice prices increased by 33 percent and consumption declined by 41 percent (Table 5). In the past, retail juice prices, bulk concentrate prices, and fruit prices were much more correlated (Figure 8).
Figure 8. Grower/Bulk frozen concentrated orange juice (FCOJ), and retail orange juice prices, 1999/00-2008/09 (Notes: SSE gal = single-strength equivalent gallons. Sources: Florida Citrus Mutual 1999ï2009; FCPA 1997ï2008; FDOC 2009a)
There are likely two key causes for the changes in these retail/fruit price relationships: changes in the market shares of food retailers, and changes in the
market shares of the three major U.S. orange juice brands. Between 1998 and 2008, the market shares of the five largest retail food chains increased from 34.7 percent to 55.7 percent (Table 6). During this same period, the market shares of the three largest orange juice brands also increased, from 53.3 percent to 65.7 percent (Table 7). Both of these changes are part of longer-term trends, but their shares have now grown to a level that has likely increased the pricing power of both groups.
The increased market share of the largest food retailers is the result of significantly increased mergers and acquisitions in this industry in the late 1990s. Between 1997 and 2000, more than 4,100 stores were acquired, representing almost 20 percent of all U.S. supermarkets. On a regional basis, market concentration of the largest food retailers is probably larger. This may explain why retail Recon orange juice prices have not been responsive to reduced bulk concentrate prices and why the margin between retail Recon, retail FCOJ, and bulk concentrate prices has increased, as illustrated in Figure 8 (no data are available for bulk NFC prices).
The increased market share of the three largest orange juice brands is likely the result of the increased brand focus of these firms. When PepsiCo purchased Tropicana from Seagram in 1998, it subsequently moved Tropicana's sales and marketing functions from Bradenton, Florida to the Chicago
Archival copy: for current recommendations see http://edis.ifas.ufl.edu or your local extension office.

The U.S. Orange and Grapefruit Juice Markets: History, Development, Growth, and Change 8
headquarters of the non-soft drink beverage division (a division that also includes Gatorade). This move was supposedly to help gain an increased market focus for Tropicana. In similar fashion, Coca-Cola (owner of Minute Maid and Simply Orange) successfully launched its Minute Maid NFC brand 2001, and moved Minute Maid's headquarters to Coca-Cola's Atlanta headquarters, again to help increase the market focus of Minute Maid/Simply Orange.
Current evidence suggests that rather than the relationship between fruit and juice prices being permanently unhinged, the associated price margin's lag time has increased, probably to about two years. For example, comparing 2007/08 to 2008/09 (season-to-date as of August 29, 2009), orange juice prices decreased 4.7 percent and volume increased 0.8 percent. Comparing 2006/07 to 2007/08 (season-to-date as of August 30, 2008), prices actually increased by 3.9 percent and volumes decreased 4.5 percent (Table 8). The grapefruit juice market, however, is behaving somewhat differently. Volume and price were both down season-to date as of August 29, 2009, and both price and volume were up in the same period for 2007/08 (Table 8). This is likely because grapefruit volumes were still recovering from hurricane-induced reductions in supplies in 2007/08 and, by 2008/09, the market had largely completed this adjustment process to the lower volumes by losing the more price-sensitive customers from the category.
Conclusions
The citrus juice industry has always had challenges and always will because citrus is produced in abundance in only a few geographical regions of the world, which increases its risks. The numerous supply-reducing freezes of the past were addressed by planting farther south and developing supplies in Brazil where there were no freezes. Diseases that kill citrus trees like tristeza and blight have been conquered by using different rootstocks. Now the industry is dealing with diseases such as citrus canker and the more devastating citrus greening.
Taking risks is what has made the citrus industry profitable, and to the winners go the spoils. The story
of the past, present, and the future of the citrus industry can be summarized in a single phrase: "satisfying the consumer's search for product superiority and convenience."
This consumer-driven phenomenon led to the development of all the forms of citrus juices sold in today's marketplace, and created the dynamic forces that reshape the citrus industry—from an individual grower's decision to plant groves, to global corporations acquiring citrus processing facilities and marketing orange juice worldwide, to the southward movement of the Florida citrus supplies, to the birth and growth of the huge Brazilian orange juice export industry.
This same phenomenon also will be the defining force that predicts the future of the citrus industry. If/when some individual or firm discovers a way to further improve the fresh-squeezed taste quality and/or convenience of citrus juices, supply and market forces will again reshape the citrus industry in the effort to get new juice products to consumers in the most consistent, cost-efficient manner feasible. And in turn, the market will reward that individual or firm.
References
A.C. Nielsen. Various issues. Nielsen Data for U.S. Grocery Stores Doing $2 Million and Greater Annual Sales, Wal-Mart Stores Excluding Sam's Clubs, Mass Merchandisers and Drug Stores Doing $1 million and Greater Annual Sales. A.C. Nielsen, New York, NY.
FASS/USDA. 2009. Citrus Summary 2007-08 (p. IV). Florida Agricultural Statistics Service, United States Department of Agriculture, Orlando, FL (March).
FCPA. 1999. 1997/98 Weighted Average Prices for Grapefruit Used in FCGJ Frozen Concentrated Grapefruit Juice) and SSGJ (Single Strength Grapefruit Juice) by Season. Florida Citrus Processors Association, Lakeland, FL.
FCPA. 1999. 1997/98 Weighted Average Prices for Oranges Used in FCOJ (Frozen Concentrated Orange Juice) and SSOJ (Single Strength Orange
Archival copy: for current recommendations see http://edis.ifas.ufl.edu or your local extension office.

The U.S. Orange and Grapefruit Juice Markets: History, Development, Growth, and Change 9
Juice) by Season. Florida Citrus Processors Association, Lakeland, FL.
FDOC. 2009a. Florida Department of Citrus, Economic and Market Research Department. Citrus Reference Book, pp. 64–66. Gainesville, FL ( May).
FDOC. 2009b. Florida Department of Citrus, Nielsen Retail OJ Sales Summary, Report Number 12 of the 2008/09 Season and the 2007/08 Season, Florida Department of Citrus, Gainesville, FL (September).
FDOC. 1986. Nielsen Marketing Research: Annual Report on Orange Juice and Grapefruit Juice, 1985. Florida Department of Citrus, Lakeland, FL.
Florida Canners Association. 1972. Statistical Summary 1970-71 Season, Utilization of Florida Citrus Crop by Processors. Florida Canners Association, Winter Haven, FL.
Florida Canners Association.1963. Year Book Season of 1961-1962, Processed Concentrated Orange Juice and Frozen Grapefruit Annual Packs in the State of Florida, Seasons 1940-41 to 1961-62 Inclusive. Florida Canners Association, Winter Haven, FL.
Florida Citrus Mutual. Various issues 1999/00 Summary of Citrus Statistics. Florida Citrus Mutual, Lakeland, FL.
LNA. Various reports. Leading National Advertisers, Inc., New York,
Muraro, R.P. 2008. Summary of 2007/08 Citrus Budgets for the Southwest Florida Production Region. University of Florida, Citrus Research and Education Center, Lake Alfred, FL (September).
______. Various issues in 2008. Supermarket News, New York, NY.
Archival copy: for current recommendations see http://edis.ifas.ufl.edu or your local extension office.

The U.S. Orange and Grapefruit Juice Markets: History, Development, Growth, and Change 10
Table 1. Making orange juice
The Orange Juice Production Process and Product Forms
Oranges are hand-picked in the field, loaded into trailers, and delivered to the processing plant. Oranges do not ripen after picking, and the deterioration process begins as soon as they are separated from the tree. The fruit is dumped from trailers onto conveyors, where it is carried through a washing process. The fruit is then graded, and oranges not acceptable for processing are separated and diverted to be used for by-products. The Florida Department of Agriculture and Consumer Services (FDACS) under the authority of the United States Department of Agriculture (USDA) then tests for juice and solids content and calculates the unit of payment for growers, after which the oranges are diverted to storage bins labeled according to juice specifications represented by each tested load of fruit. Oranges are then selected from labeled bins to enable blending juices of optimal quality and transported via conveyor to juicing machines (extractors). After juice extraction, the stream of pulpy juice goes through a finisher (screen) where the pulp and seeds are removed and, along with the peel, are diverted to be used for by-products. At this stage, the juice is made into one of two product forms: bulk frozen concentrated orange juice (FCOJ) or not-from-concentrate (NFC).
Juice made into bulk FCOJ is sent to an evaporator where vacuum and heat are used to remove excess water to obtain a base concentrate of 65°Brix, which is a seven-to-one strength ratio to normal single-strength juice. The bulk FCOJ is then stored at 20°F (Fahrenheit) or lower in a tank farm or in 55-gallon drums until it is sold or packaged for sale.
Juice made into NFC is de-oiled to 0.02%–0.04% oil levels with a centrifuge, then either pastueurized, chilled, and packaged, or stored for future sale and/or packaging. NFC is stored a number of ways: frozen in 55-gallon drums; pastueurized and chilled in large stainless steel, aseptic tanks; or pasteurized and chilled in 4'x4' wooden boxes containing a plastic bag that holds about 300 gallons of juice.
Bulk FCOJ is packaged by orange juice marketers into either frozen concentrated orange juice or chilled reconstituted (Recon) ready-to-serve (RTS) orange juice. Packaged FCOJ is made by adding single-strength juice or water and flavor oils and essences to bulk FCOJ to reduce it from 65°Brix to 42°Brix, which is a four-to-one strength ratio to normal single-strength juice. Then the product is packaged into 6-, 12-, or 24-ounce cans and sold in frozen form. To convert FCOJ into ready-to-drink orange juice, it is thawed and then mixed using the ratio of one part FCOJ to three parts water.
Recon RTS is made by adding water and flavor oils and essences to bulk FCOJ to reduce it from 65°Brix to 11.8°Brix and then pasteurizing it. It is then packaged in cardboard cartons or glass containers, and sold as chilled RTS orange juice.
Archival copy: for current recommendations see http://edis.ifas.ufl.edu or your local extension office.

The U.S. Orange and Grapefruit Juice Markets: History, Development, Growth, and Change 11
Table 2. Florida orange and grapefruit crops and prices
Season Florida Orange Production
Delivered-In Processed Orange Prices
Florida Grapefrut Production
Delivered-In Processed Grapefruit Prices
(million boxes) (dollars per pound-solids) (million boxes) (dollars per pound-solids)
EM* Valencia Combined
2008/09 162.4 1.01 1.13 1.06 21.7 0.62
2007/08 170.2 1.39 1.39 1.39 26.6 0.55
2006/07 129.0 1.95 2.23 2.11 27.2 0.67
2005/06 147.7 1.16 1.46 1.33 19.3 2.06
2004/05 149.8 0.80 1.03 0.91 12.8 1.84
2003/04 242.0 0.65 0.77 0.71 40.9 0.49
2002/03 203.0 0.87 1.03 0.94 38.7 0.49
2001/02 230.0 0.75 0.94 0.84 46.7 0.60
2000/01 223.3 0.70 0.90 0.76 46.0 0.61
1999/00 233.0 0.85 1.00 0.91 53.4 1.14
1998/99 186.0 1.05 1.12 1.07 47.1 0.53
1997/98 244.0 0.69 1.13 0.87 49.6 0.23
* EM = early/mid-season orangesSources: FCPA 1997–2009; FASS/USDA 2009
Table 3. Florida orange- and grapefruit-bearing acreage in millions of bearing trees by season
Season Oranges Grapefruit
2007/08 61.7 6.0
2006/07 64.0 6.3
2005/06 65.0 6.5
2004/05 72.6 7.8
2003/04 75.4 9.0
2002/03 78.0 10.3
2001/02 77.6 10.9
2000/01 79.6 11.7
1999/00 78.7 12.2
1998/99 79.6 12.4
1997/98 78.6 13.5
Source: FASS/USDA 2009
Archival copy: for current recommendations see http://edis.ifas.ufl.edu or your local extension office.

The U.S. Orange and Grapefruit Juice Markets: History, Development, Growth, and Change 12
Table 4. U.S. retail orange juice market and prices, 1997/98–2008/09
Season Volume % Change Price % Change
(million SSE gallons)* (dollars/gallon)
2008/09 622.2 0.8 5.67 –4.1
2007/08 623.2 –3.9 5.91 3.5
2006/07 649.9 –12.8 5.71 21.7
2005/06 745.3 –6.3 4.69 6.3
2004/05 795.1 –1.5 4.41 1.6
2003/04 807.0 –4.2 4.34 –1.4
2002/03 836.4 –2.9 4.40 0.3
2001/02 861.2 –3.1 4.39 0.5
2000/01 887.7 1.9 4.37 0.9
1999/00 872.5 2.3 4.33 3.3
1998/99 852.6 –1.4 4.19 11.4
1997/98 864.7 — 3.76 —
* Single-strength equivalent gallonsSource: FDOC 2009a
Table 5. U.S. retail grapefruit juice market and prices, 1997/98–2008/09
Season Volume % Change Price % Change
(million SSE gallons)* (dollars/gallon)
2008/09 21,6 0.0 6.42 0.0
2007/08 21.8 10.1 6.42 1.9
2006/07 19.8 –2.9 6.30 8.7
2005/06 20.4 –14.2 6.25 21.3
2004/05 23.8 –29.0 5.75 2.7
2003/04 33.5 –9.0 4.74 2.2
2002/03 36.8 –7.8 4.87 3.5
2001/02 39.9 –13.8 4.98 7.7
2000/01 4.63 10.1 5.08 0.9
1999/00 51.5 13.4 4.91 7.7
1998/99 59.5 3.6 4.56 6.3
1997/98 57.4 — 4.29 —
* Single-strength equivalent gallonsSource: FDOC 2009a
Archival copy: for current recommendations see http://edis.ifas.ufl.edu or your local extension office.

The U.S. Orange and Grapefruit Juice Markets: History, Development, Growth, and Change 13
Table 6. Market shares among major U.S. retailers, 1998 and 2008
Company 1998 Share (%)
Kroger 9.6
Albertson's 8.0
Wal-Mart 7.1
Safeway 5.6
Ahold USA 4.4
Top 5 Combined Market Share 34.7
SuperValu 4.0
Fleming 3.4
Winn-Dixie 3.1
Publix 2.7
A&P 2.3
Top 10 Combined Market Share 50.4
Company 2008 Share (%)
Wal-Mart 29.0
Kroger 8.6
Costco 8.1
SuperValu 5.0
Safeway 5.0
Top 5 Combined Market Share 55.7
Loblaw 3.5
Publix 2.7
Ahold USA 2.4
Delhaize America 2.1
C&S Wholesale 2.1
Top 10 Combined Market Share 68.5
Source: Supermarket News 2008
Archival copy: for current recommendations see http://edis.ifas.ufl.edu or your local extension office.

The U.S. Orange and Grapefruit Juice Markets: History, Development, Growth, and Change 14
Table 7. Retail orange juice market shares of the largest three orange juice brands*
Year Top Three Shares (%)
1997/98 53.3
2002/03 61.4
2007/08 65.7
* Note: The largest three orange juice brands are Tropicana, Minute Maid, and Florida's Natural.Source: A.C. Nielsen, various issues
Table 8. A comparison of orange and grapefruit juice volume and price changes season-to-date, October 2008–August 2009 and the same period in 2007/08
Season-to-Date Total Orange Juice Total Grapefruit Juice
Price Volume Price Volume
(%) (%) (%) (%)
09/28/08–08/29/09 versus 09/30/07–08/30/08 –4.7 0.8 –1.5 –3.8
09/30/07–08/30/08 versus 10/01/06–09/01/07 –4.5 3.9 10.3 0.8
Source: FDOC 2009b
Archival copy: for current recommendations see http://edis.ifas.ufl.edu or your local extension office.