Embed Size (px)
Citation preview

The U.S. Automobile Industry:
Three Essays on Multinational Corporations
Thesis Submitted in total fulfillment of the
requirements of the degree of Doctor of Philosophy in Economics
February 8th, 2012
Alessandro Poggianti
Supervisor: Prof. M.P. Tucci
Scuola di Dottorato in Economia Politica
XXII Ciclo
Università degli Studi di Siena

1
To my family for the strong support to this project.
To my Professor, M.P. Tucci, who has been an important guide to me and whose ethic has an important influence on my way of working.

2
Index
Introduction ………………………………………………………………………………..4
• Chapter 1: The U.S. Automotive Industry: The Impact of Foreign Entrance on U.S. Multinational Companies ……………………………………………………………..9 1.1 Introduction ………………………………...………………………………10 1.2 Historical background …………………...…………………………………11 1.3 Motor Vehicles MNCs: General trends ...………………………………….16 1.4 Data and methodology ...…………………………………………………...21 1.5 Estimation results ....………………………………………………………..28
• 1.5.1 U.S. Parents ....……………………………………………………28 • 1.5.2 U.S. Affiliates …………………………………………………….35
1.6 Conclusions.....……………………………………………………………...40 Appendix 1: Variables ………………………………………………………….43
• Chapter 2: Is the Productivity of Multinational Companies in the Automobile Industry Affected by Complementarities? A Macroeconomic Perspective …………………...45 2.1 Introduction …………………………………………………………...……46 2.2 Plant-level evidence …………………………………………………...…...47
• 2.2.1 The general framework ……………………………………...…...48 • 2.2.2 The dataset ………………………………………………………..49 • 2.2.3 Methodology …………………………………………………......50 • 2.2.4 Results …………………………………………………………....51
2.3 Productivity from a macroeconomic perspective ………………………......53 • 2.3.1 The dataset ………………………………………………………..53 • 2.3.2 Macro-level proxies ………………………………………………56
2.4 Estimation and results …………………………………………………...…57 • 2.4.1 Plant-level modeling ……………………………………………...58 • 2.4.2 U.S. Parents ………………………………………………………63 • 2.4.3 U.S. Affiliates …………………………………………………….67
2.5 Conclusions ………………………………………………………...………71
• Chapter 3: Towards a Qualitative Meso-Economic Analysis: A Micro-Macro Perspective …………………………………………………………………………...74 3.1 Introduction ……………………………………………………...…………75 3.2 Technological framework and competition ……………………………...77
3
3.3 Patenting activity: A microeconomic analysis ……………………..……...81 • 3.3.1 Technology level ……..………………………………………….82 • 3.3.2 Firm level ………………...………………………………………84
3.4 Micro and Macro interaction: Toward a qualitative meso-economic analysis …………………………………………………………………………………..86
• 3.4.1 Data and methodology ……………………………………………87 • 3.4.2 U.S. Parents ……………………...……………………………….88 • 3.4.3 U.S. Affiliates ………………………...…………………………..90
o 3.4.3.1 First hypothesis: U.S. Affiliates R&D expenditures as technology-exploiting FDI …………………...………………...91
o 3.4.3.2 Second hypothesis: U.S. Affiliates R&D expenditures as technology-sourcing FDI …………………………………….....93
o 3.4.3.3 The interval of R&D FDI …………………………...….94 3.4.4 Macroeconomic integration: Country-level evidence ………………...….96
• 3.4.4.1 First hypothesis: U.S. Affiliates R&D expenditures as technology-exploiting FDI: Aggregated perspective …………………..…………...97
• 3.4.4.2 Second hypothesis: U.S. Affiliates R&D expenditures as technology-sourcing FDI: Aggregated perspective ………………….…99
3.5 Conclusions ……………………………………………………………….102 Appendix 3 ……………………………………………………………………106
Conclusions …………………………………………………………………………111
References …………………………………………………………………………..120

4
Introduction
A striking increase of the globalization process characterized the period 1980–
2007. The increasing trend in world’s trade levels is due to the decline in trade barriers and
trade costs, which in turn affects the production process. The production chain is more and
more vertically decomposed in its different stages, which are located worldwide to benefit
comparative advantages of different countries. These international production linkages, in
turn, impact the increase in the world’s trade level. This increasing globalisation allows the
activity of multinational corporations (MNCs) to rise, strengthening the links among
different regions of the world.
Foreign Direct Investment (FDI) is the most important channel through which
MNCs organise their activity and their production across countries because FDI is strictly
related to control and management activities. Indeed, “Direct Investment is ownership that
carries with it actual control over what is owned” (Graham and Krugman, 1995). The
OECD Benchmark Definition of FDI qualifies foreign investment as reflecting “the
objective of obtaining a lasting interest by a resident entity in one economy (‘direct
investor’) in an entity resident in an economy other than that of the investor (direct
investment enterprise)”. The “lasting interest” is conceived as implying a “long-term
relationship between the investor and the enterprise and a significant degree of influence in
the management of the enterprise”. The “significant degree of influence in the management
of the enterprise” is recognised to a foreign investor who owns at least 10 percent of the
ordinary shares or voting power.1 The absolute control is not required by the foreign
investor.2
In the Balance of Payments Manual Fifth Edition (IMF, 2004), direct investment
includes equity capital (claims on affiliated enterprises plus liabilities to affiliated
enterprises), reinvested earnings, other capital (including claims on affiliated enterprises
plus liabilities to affiliated enterprises), and financial derivatives associated with various
intercompany transactions between affiliated enterprises. As reported by IMF (2004)
1 The 10 percent cut-off point is only a general suggestion by OECD. It is possible to find direct investors who own less than 10 percent of voting shares having an effective voice in the management, as well as cases in which the ownership of the 10 percent of shares does not lead to any significant influence. 2 From the generality of this definition a problem of misclassification arises, that is, the possibility of overstatement or understatement of FDI. It is possible to find investment meeting the 10 percent criterion with no operational control as well as the opposite case. However, the problem is not so common due to the fact that in the aggregate foreign affiliates are majority owned, and so the foreign control is unambiguously applied.

5
“Direct Investment abroad is usually shown with a negative figure, reflecting an increase
in net outward investment by residents, with a corresponding net payment outflow from
the reporting economy.”
FDI can be divided into two main groups according to its direction, that is Inward
Foreign Direct Investment (IFDI) and Outward Foreign Direct Investment (OFDI). IFDI is
the investment country A receives from an enterprise located in another country B (i.e. the
source country), while OFDI is the investment a company located in country A undertakes
in country B different from its home-country. In addition, FDI is classified in vertical and
horizontal investment according to their scope. Vertical FDI is that investment undertaken
to lower production costs. It implies a fragmentation of the production chain in its basic
stages, which will be relocated according to countries’ comparative advantages, in order to
benefit from the most profitable conditions. Horizontal FDI is usually undertaken to enter
new markets. It implies the replication of the whole production process in the foreign
country. Another basic distinction is between resource-seeking and advantage-exploiting
FDIs. The former is investment undertaken to access the host countries’ advantages. On
the other hand, exploiting FDI is undertaken to exploit firm-specific advantages in a
foreign country, as suggested by Dunning (1980) in the “Eclectic Paradigm”.
The world’s stock of OFDI have increased six times in the last three decades, rising
from 5.6 percent of the world’s Gross Domestic Product (GDP) (US$548,675 million) in
1980 to 28.9 percent (US$15.6 billion) in 2007. This pattern has been characterised by a
parallel increase in the OFDI of both developed and less developed countries (LDCs). On
the other hand, the world stock of IFDI rose from 6.6 percent of the world’s GDP
(US$704,256 million) in 1980 to 27.9 percent (US$15.2 billion) in 2007.3 The great
majority of IFDI stock is held by the developed countries (DCs). Indeed IFDI stock of
developed economies, being half of that of LDCs in 1980 had reached quite the same
amount in 2007 (27.2 percent and 29.8 percent, respectively of world’s GDP ). Also, at the
flow level DCs’ IFDI accounted for 1.9 percent of Gross Fixed Capital Formation in 1970,
which rose to reach 15.6 percent in 2007. This increase overtook that of LDCs, which had
moved from 4.6 percent of Gross Fixed Capital Formation in 1970 to 12.6 percent in 2007.
The outward flows are, instead, characterised by a noticeable positive trend of investment
out of developing economies (UNCTAD, 2008).
The United States has historically been the most attractive destination for FDI until
the late 1980s (U.S. Department of Commerce, 2008). The majority of foreign investment
3 Source: www.unctad.org.

6
was from OECD countries until 2002. Starting the new millennium, however, emerging
countries such as India, Russia, Chile, South Korea, and Brazil have a growing role in the
U.S. IFDI. The U.S. share of IFDI at the world level decreased from 31 percent of the
world total in 1980 to 13 percent in 2006. The decrease in U.S. IFDI was counterbalanced
by the increase in investment inflows in China and the United Kingdom. In 2005 China
captured a larger FDI inflow than U.S. However, by 2006 the U.S. regained its lead
position in attracting foreign investments (U.S. Department of Commerce, 2008).
Given the role of the United States in attracting FDI, this thesis focuses on the
analysis of the operations of multinational corporations (MNCs) in the U.S. The
dissertation consists of three chapters, each of which analyzes separately different topics
related to multinationals’ activity. The chapters are based on empirical analysis. The first
two chapters carry out a quantitative analysis of the U.S. operations of MNCs, while the
third focuses on a qualitative perspective. The dissertation is based on the use of a unique
dataset in order to make homogeneous and comparable results. The data used here are from
the U.S. Bureau of Economic Analysis (BEA). This represents a novelty in the FDI
literature, given that a work based solely on the BEA dataset does not exist in the
literature. “The BEA is one of the world’s leading statistical agencies”
(http://www.bea.gov). It collects economic data on the U.S. economy at national,
international, regional, and industry levels. As for MNCs, it provides useful information on
companies’ total assets, number of and compensation to employees, export and import of
goods, net income, total sales, capital expenditures, and expenditures on research and
development (R&D). MNCs are split by ownership in order to investigate differences
between domestic MNCs, i.e. U.S. Parents, and foreign-owned companies, i.e. U.S.
Affiliates. Depending on the availability of data, the period analyzed is 1983–2007.
The thesis analyzes MNCs’ activity in the U.S. in the automotive sector. The U.S.
auto industry has been chosen because it has been the object of important political debates
regarding its competitiveness and social impact. Consequently several government policies
have been formulated in order to improve its performance against foreign competition.
That makes the U.S. auto industry an interesting sector by analyzing the activity of MNCs
and pairing domestic versus foreign companies. Indeed U.S. automakers have been
traditionally focused on the production of big size cars until the 1960s, when foreign
producers successfully entered the U.S. market by importing small and compact vehicles.
During late 1970s and early 1980s, the two oil shocks tilted consumers’ preferences toward
small and compact cars. U.S. car producers continuously lost their market shares in favour

7
of importers of foreign vehicles so much as feeling as in a recession. In the early 1980s the
Japanese government imposed voluntary export restraints (VERs) on Japanese automotive
export toward U.S. At the end of 1981 the U.S. Government passed the Fair Practices for
Automotive Product Act requiring foreign automakers to start U.S. based production in
order to retain their current levels of U.S. sales. In 1982 foreign car producers started
creating U.S. production transplants. As a consequence, the U.S. Big Three market shares
continued to fall in favour of the foreign competitors until recent times.
First, this thesis intends to assess the differences and causality relationships
between U.S. Parents and foreign-owned U.S. Affiliates. A great part of FDI literature is
devoted to analyzing the inter-relationship among differently owned companies, but
evidence is mixed. It is not possible to generalize the effects of foreign investments from
existing empirical works (Lipsey, 2002). Two simultaneous equations systems will be
constructed to investigate the economic behaviour of the two different types of MNCs. The
system specifications will take into account all the variables available from BEA website
in order to be as complete as possible. In addition, for each variable a Granger-causality
test between activities of U.S. Parents and U.S. Affiliates will be run. The activity of the
competitors will be taken into account in order to underline possible inter-relationship
between the two types of MNCs. Finally, the role of rational expectations will be
accounted for by using variables one-period forward. This chapter represents a novelty in
the literature. Indeed it is likely to be the first attempt in estimating a simultaneous
equations system in a multivariate framework concerning multinational corporations.
Chapter 2 of the dissertation addresses the productivity issue in the multinational
framework. More precisely it investigates whether the results on productivity in the U.S.
automotive industry discussed in the recent microeconomic literature hold when
macroeconomic data are used. In particular, the impact of models’ variety on productivity
will be investigated, given that the supply of differentiated products is a key issue in the
automotive market. To this aim, the recent model estimated by Van Biesebroeck (2007)
has been taken as reference and it has been estimated again for both U.S. Parents and U.S.
Affiliates using the macroeconomic dataset from BEA. In order to deal with endogeneity
problems and un-observables bias, estimations are carried out through the construction of
two simultaneous equations systems for productivity, one for each type of MNCs.
Empirical results will show whether the same productivity equation can be estimated for
both U.S. Parents and U.S. Affiliates and whether the two types of MNCs differ in their
productivity behaviors. In addition, the presence of spillover effects and causality

8
relationships between domestic and foreign-owned firms will be tested by adding specific
variables in the systems.
Chapter 3 consists of a qualitative analysis of the R&D patterns of U.S. automotive
multinationals. Indeed from the early 1990s stringent environmental regulations induced
car manufacturers to develop alternative fuel vehicles. It is very important to develop a
good strategy in technological innovation in order to retain market power and lead the
automotive market. Technological innovations are the final output for patenting activity,
while R&D expenditures can be taken as proxy for innovation input. Macroeconomic data
relative to U.S. Parents and U.S. Affiliates do not allow distinguishing the portion of R&D
devoted to each single technology. Here the microeconomic evidence on firms’ patenting
activity is exploited in order to decompose by technology the macroeconomic dataset from
BEA. The analysis of firms’ patenting activity of Oltra and Saint-Jean (2009) is taken as
microeconomic reference on the firms’ technological specialization. The R&D of U.S.
MNCs will be split by technology. U.S. Parents’ R&D expenditures will be split following
the specialization of the American Big Three. U.S. Affiliates’ R&D will be split in two
extreme ways in order to account for the two main FDI strategies, that is, technology
sourcing versus technology exploiting. By this procedure an interval including the real
R&D strategy will result. The procedure will lead to an innovative and more integrated
meso-economic analytical perspective. The novelty of exploiting microeconomic results to
improve the macroeconomic perspective is likely to be very important for the
macroeconomic research.

9
Chapter 1
The U.S. Automotive Industry:
The Impact of Foreign Entrance on U.S. Multinational Companies
Abstract
The goal of the analysis is to assess differences and causality relationships between
U.S. multinational corporations (MNCs) and foreign-owned MNCs over the period
1983-2007. The result will be the estimation of two systems of simultaneous
equations. Empirical results show very different economic patterns for the two types
of MNCs. In addition both U.S. Parents and U.S. Affiliates are likely to strongly
influence each other. A significant role in influencing U.S. Parents’ activity is
played also by the expectations on competitors’ strategies, underlining the important
role of research departments. At the best of our knowledge this is the first attempt in
estimating a simultaneous equations system in a multivariate framework concerning
multinational corporations.

10
1.1 Introduction
The present analysis is aimed at investigating the economic activity of U.S.
Multinational Corporations (MNCs) in the manufacturing sector motor vehicles and
equipment manufacturing through a system of simultaneous equations.4 The analysis of the
American automotive industry is very interesting given the ongoing loss of U.S. firms’
market shares and its involvement on multinational activity. In this respect MNCs will be
investigated distinguishing between domestic(U.S.)-owned and foreign-owned companies.
U.S. automakers focused their production in big-size cars. In the 1960s small and
compact cars imported from abroad gained popularity in the U.S. market. In the early
1980s consumers’ preferences changed because of the two oil shocks. Foreign market
shares were continuously increasing until 1981, when voluntary trade restrictions were
implemented through international agreements. In the eighties foreign MNCs entered the
U.S. through Foreign Direct Investment (FDI) in order to additionally increase their
presence on the U.S. market. US automakers were greatly damaged by the foreign
presence and its increasing competition on the American market (Section 1.2).
Here the dataset from the U.S. Bureau of Economic Analysis (BEA) is used in
order to investigate differences and similarities between the two types of MNCs over the
period 1983-2007. U.S. automakers (i.e. U.S. Parents) and foreign-owned U.S. firms (i.e.
U.S. Affiliates) differ a lot in their economic activity and their structures (Section 1.3). The
data used are in millions of U.S. dollars at current prices. The use of monetary variables at
current prices is not likely to bias the results given that the analysis is aimed at comparing
the two types of MNCs in the same year and not over different periods of time.
In the literature there has been little formal systematic modeling on FDI. In addition
the analyses accounting for simultaneity miss to investigate the topic through a
multivariate framework. In order to fill these gaps here the dataset will be analyzed
through a simultaneous equations system (Section 1.4). The analysis of MNCs will be
additionally deepened by distinguishing between U.S.-owned and foreign owned
multinationals operating in the United States. At the best of our knowledge this is the first
4 The manufacturing sector motor vehicles and equipment manufacturing is the SIC 371, and NAICS 3361, 3362, 3363. The sector Motor Vehicles and Equipment manufacturing is part of the broader sector Transportation Equipment Manufacturing SIC 37 and NAICS 336.

11
attempt in estimating such a general system taking into account the difference in firms’
ownership. Possible interrelationships between the two differently owned firms will be
considered empirically in order to account for spillover effects or causality relationships.
Estimation results will be introduced in Section 1.5 for both U.S. Parents (Section
1.5.1) and U.S. Affiliates (Section 1.5.2). Empirical results show that the two types of
multinationals significantly influence each other. In addition strong influence on U.S.
Parent companies is exerted by the rational expectations on foreign competitors’ activity.
Section 1.6 concludes.
1.2 Historical background
U.S. automakers traditionally focused on the production of big-size cars until the
1960s when foreign car manufacturers entered successfully the U.S. market by importing
small and compact cars. The continuously decreasing market shares of American firms
induced the U.S. Government to follow trade protection measures in order to protect U.S.
firms and employment. Despite the policy issues, U.S. automakers did not succeeded in
retaining their level of sales, and foreign competition reached very high levels in the recent
past. The following are the main facts on the economic development of the American
automotive industry.
U.S. automotive industry relied until the seventies on the water-cooled, carbureted
V8 engine, automatic transmission, rear-wheel drive developed in the 1930s. In the 1960s
U.S. consumers’ tastes start changing toward different and smaller car models with respect
to the American automotive tradition. Foreign producers (primarily European companies)
entered the U.S. market through an increasing import of vehicles. From less than 1% of
consumption through the mid 1950s, import raised to over 10% in 1959. General Motors
(GM) and Ford reacted by importing small cars from their foreign affiliates located in
Germany and England. In 1959 the two American giants started to produce small cars
domestically, successfully reducing the market shares of foreign cars to 6.4% in 1960 and
4.9% in 1961. Despite the domestic production of small cars, in 1966 import started to rise
again with a 10% market share and a steady rate of growth to a 24% in 1970 (Nelson,

12
1996). This time the import growth was not only from European firms. Japanese firms
started their U.S. import penetration. The Big Three continued their strategy of captive
imports and small cars production. The new American cars were lighter, smaller, and
cheaper than traditional U.S. vehicles, but still larger than foreign vehicles and sold for a
higher price (Eden et al., 1996).5 In addition foreign competitors benefited of established
marketing networks and good reputation in the small and compact cars segment. American
firms started losing market shares in favor of foreign imported cars (Nelson, 1996). In this
way foreign competitors captured the small and compact cars’ segment, while the Big
Three continued to concentrate in the family-size cars, where they could have much higher
profitability.6
At the end of 1970s and early 1980s the great publicity about gasoline shortages
after the oil shocks of the 1970s pushed consumers’ cars preferences to change in favor of
small and compact cars. GM, Ford, and Chrysler continued to downsize their products, but
their market shares did not stop to decrease (Eden et al., 1996). The Big Three were
strongly affected by the Iran crises of 1979 (“second oil price shock”). In 1980 the U.S.
automotive industry felt as in a recession, declining its production and increasing the
unemployment rate because of reduced market demand. At the same time fuel-efficient
Japanese cars increased their import rate by 500% from 1973 to 1980 (Cooney, 2005).
Japanese imports were also favored by the Yen-Dollar exchange rate, which made
Japanese products relatively cheaper with respect to American cars until the early eighties
(Co, 1997). The Big Three closed many production plants in order to reduce total capacity.
Plants located in highly unionized areas of the Northern regions were replaced by new
plants located in the Southern U.S. to take advantage of low wages, weak trade unions, and
5 In this period “Ford, Chrysler and GM all introduced compact cars, one meter shorter than their conventional full sized models in 1960” (Eden et al., 1996).
About the price differential between American and Japanese cars, Nelson (1996) cited Abernathy et al. (1981), and Abernathy et al. (1983) which found that Japanese automakers had a labor cost advantage in the $1100-$1400 range and a material costs advantage in the $600-$800 range. Abernathy et al. (1981) show additionally that the differentials do not result from a difference in capital intensity given that the Japanese producers apply less capital per unit of output with respect to U.S. automakers. Accounting for transportation and marketing cost, Abernathy et al. (1983) show that the Japanese cost advantage over U.S. firms is in the $1200-$1500 range. Flynn (1984) addressed the topic in more detail, finding a Japanese cost advantage of $1432 for labor and of $1498 for land.
6 Abernathy et al. (1983) show that, while the production cost for small cars were slightly less than those for large cars, the price differential was considerable. At the same time, hypothesizing a sufficiently inelastic demand for auto transportation, most consumers with a preference for small cars would buy large cars if small cars were not available (Nelson, 1996). In this respect White (1971) suggests that concern with the stability of the oligopoly encouraged the Big Three to stay out of the small cars’ market. Indeed the small cars segment might support one firm, while it would not be profitable for all the Big Three together.

13
liberal work rules. The United Auto Workers (UAW) unionized also the new plants and the
Southern strategy revealed immediately its weakness.
Given the importance of the automotive industry in the whole U.S. economy, the
Big Three and the UAW were successful in lobbying for a political support. In 1979
through the Chrysler Loan Guarantee Act, Chrysler received a government-backed loan in
order to avoid bankruptcy. Free Trade Sub-Zones and duty-free benefits were stipulated in
order to stimulate U.S. firms’ competitiveness.7 In addition the Reagan Administration
pressed Japan to act in its own by imposing “voluntary export restraints” (VERs) on
Japanese automotive exports.8 To avoid a possible conflict with U.S. antitrust rules, in
1981 the Japanese Government through the Ministry of International Trade and Industry
(MITI) undertaken two important policies in May and December 1981 in order to reduce
Japanese auto export and pushing Japanese FDI into the United States. First, in May 1981
the MITI placed VERs on Japanese auto export to the U.S. The VERs program started with
a three years quantitative restriction on automobiles export, in order to roll back Japanese
import level to the 1978 average. Japanese exports were restricted to 1.68 million units in
the first year, with an unspecified growth in the last two years. The 70% of the U.S. VERs
was allocated to Toyota, Nissan, and Honda. The rest was to Mitsubishi, Mazda, Fuji,
Isuzu, and Suzuki. In this way Japanese cars import would be reduced by 7.7% with
respect to the previous period. VERs program has been renewed for several years by the
Japanese Government in order to avoid further American actions against Japanese auto
imports (Bhagwati et al., 1992; Eden et al., 1996; Nelson, 1996; Carbaugh, 2002; Cooney,
2005). The import-regulation program was mainly aimed at providing the Big Three with
the possibility to upgrading their production techniques in order to compete with superior
Japanese products. On the other hand, Japanese automakers could increase their prices
because of the disequilibrium between Japanese cars’ demand and supply. Also the Big
7 The Foreign-Trade Zones (FTZs) Program dates back to the FTZ Act authorized by the Congress in 1934. It was aimed at encouraging value-added activity at U.S. facilities in competition with foreign alternatives by reducing duty payments on foreign imports in the U.S.. In 1952 the law changed allowing a manufacturing plant to be a Free Trade Subzone (FTSZ). By the duty-free benefits many U.S. companies maintained their competitive advantages in the U.S., not moving to foreign facilities to reduce costs. In the late 1970s automotive companies started receiving the FTSZ designation. In the mid-1980s all the U.S. Big Three were given the duty-free status and all of them benefited from the FTSZ legislation. In addition in 1965 the Canada-U.S. Automotive Products Agreement (APTA) was signed. The Big Three greatly benefited from the APTA that removed tariffs on cars, trucks, buses, tires, and automotive parts between the two countries.8 The Government action was consequently to the lobby by the Big Three and the UAW for tariff protection against Japanese import (Eden et al., 1996). UAW requests were also to restrict imports unless Japanese auto producers invested in U.S. production (Nelson, 1996).

14
Three rose their prices registering record level profits in 1984, but they did not use the
increased profits on technological upgrading, paying their executives large salary bonus.
Given the Big Three’s behavior and because of these bonuses, the Reagan Administration
did not pressure to renewal the VER program (Eden et al., 1996). On the other hand the
scenario was profitable for Japanese firms, and the Japanese Government decided to
continue the restriction program, that lasted until 1994.
Figure 1.1: Exchange rate of Japanese Yen to US Dollar, 1983–2007
UAW was still encouraging U.S. production by Japanese firms to hire American
workers, face the same competitive manufacturing conditions as the domestic Big Three,
and lose the export advantage of the Yen/Dollar exchange rate. The appreciation of the
U.S. dollar reached a maximum in 1985 and then dropped sharply (Figure 1.1). In the early
1980s the high Yen/Dollar exchange rate created serious problems for import-competing
firms. Indeed the fluctuating exchange rate was influencing not only the purchasing power
of U.S. consumers, but also the relative costs of Japanese producers and consequently their
productivity advantage (Eichengreen et al., 1988).9 Consequently, in December 1981 the
9 In their study on the international competition of U.S. firms, Eichengreen et al. (1988) show the “power of exchange rate movements to bring about dramatic shifts in relative labor costs”. In particular they argue that “the greater impact of exchange rate changes on autos and steel than on textiles and apparel makes sense when one observes that the dollar has fluctuated most dramatically (especially since the beginning of 1985) not against the currencies of developing countries, which are the principal suppliers of textile exports to the
050100150200250300
JPY/USD
JPY/USD

15
U.S. Government passed the Fair Practices for Automotive Product Act (H.R. 5133). This
legislation required that Toyota, Nissan, Honda, Toyo Kogyo, Mitsubishi, Isuzu, and
Volkswagen engaged in local production in order to retain their current levels of sales
(Nelson, 1996; Cooney and Yacobucci, 2005). More precisely, as stated by the Director of
the Congressional Budget Office in 1982, “H.R. 5133 would attempt to restore U.S. auto
industry jobs by instituting minimum domestic content requirements for passenger vehicles
and light trucks sold in the United States…the domestic content requirements – defined as
U.S. value added as a percentage of the wholesale price – would have to be met by each
foreign or domestic auto manufacturer producing more than 100,000 units for sale in the
U.S. market” (Rivlin, 1982).
In order to retain their market share and to circumvent trade frictions, in 1982
Japanese firms started the creation of U.S. production facilities (Singleton, 1992; Park,
2003; Chung et al., 2003), developing additional products specifically designed for the new
American market (Cooney and Yacobucci, 2005). Japanese automakers were also
encouraged to shift output to their U.S. transplants by the ongoing depreciation of the
dollar that reached a minimum level in 1995, making it less expensive to start new
production lines in the U.S. and making the U.S. an attractive manufacturing site for
foreign automakers (Fine et al., 1996). As reported in Co (1997), “VERs on Japanese cars’
export to the U.S. caused Japanese direct investment into the U.S. automobile industry”. In
addition, “a dollar depreciation (or a Yen appreciation) is expected to increase the
likelihood of Japanese FDI into the U.S.” The consequence of Japanese transplant in the
U.S. was that the share of U.S. foreign sales held by imports fell from 30.9 per cent in
1983 to 15.7 percent in the late 1990s. At the same time the share of the U.S. Affiliates’
production rose from 3 per cent in 1983 to 23 percent in 1998 and the Big Three’s market
shares continued to fall. Japanese products were better than American ones. Foreign firms
had a much greater productivity level, and they were based on different and more efficient
production techniques (Chung et al., 2003).10 Japanese transplants established good and
U.S. market, but against the currencies of industrial countries such as Germany and Japan, which are the main suppliers of autos and steel.”10 An example of the competitiveness of Japanese firms with respect to the Big Three can be found in the words of Carbaugh (2002): “One factor that influences the number of workers hired is a company’s job classification, which stipulates the scope of work each employee performs. As the number of job classifications increases, the scope of work decreases, along with the flexibility of using available employees; this can lead to falling worker productivity and raising production costs. Japanese-affiliated auto companies have traditionally used significantly fewer job classifications than traditional US auto companies. Japanese transplants use work teams, and each team member is trained to do all the operations performed by the team.

16
cooperative relations with intermediate suppliers, motivating them to support the Japanese
business (Zhang et al., 2009).
1.3 Motor Vehicle MNCs: General Trends
Accounting for Japanese transplants in the U.S. is very helpful in analyzing the
patterns of the American motor vehicles industry. In doing that, it is also important to
account for the foreign activity of the Big Three. GM, Ford, and Chrysler maintained the
production of big cars in the U.S. leaving the production of small and compact cars to
foreign, mostly European, affiliates. It has been well documented that the production of big
size cars was held in the U.S. because it allows having higher markups than the production
of small and compact vehicles (Abernathy et al., 1983). Furthermore, when foreign plants
first started manufacturing in the U.S., most of their revenue was from sales of foreign
produced cars, and the U.S. Affiliates were, therefore, classified as wholesale traders rather
than manufacturers. Foreign-owned affiliates got moved into the manufacturing sector only
when the majority of sales came from cars made in the U.S. as pointed out by Prof. R.E.
Lipsey.11 Indeed FDIs in the U.S. were mainly driven by trade restrictions and the
investing firms entered the U.S. market as importers before being local producers.
Accordingly the U.S. market shares of foreign MNCs were computed as including the total
sales of the wholesale trade of foreign-owned enterprises. The U.S. Parents’ market shares
were computed as including the import shipped to U.S. Parents by their own foreign
affiliates to account for the small-size cars produced in their foreign facilities and sold in
the U.S. with American brand (Figure 1.2).12
A typical Japanese-affiliated assembly plant has three to four job classifications… In contrast, traditional US auto plants have enacted more than 90 different job classifications, and employees generally perform only those operations specifically permitted for their classifications.”
11 “Indeed BEA collects data at the enterprise level and affiliates are classified into one industry code based on their sales. Therefore a company generally considered to be a manufacturer may be classified in wholesale trade”, as pointed out by the Direct Investment Division, Bureau of Economic Analysis. 12 Data from BEA on MNCs are in the “International Account”, Section “Operations of Multinational Corporations”. The “International Account” does not provide data on US total sales, but only on the MNCs’ total sales in the U.S. Data on the U.S. Industry as a whole are on the “Industry Account”. The “Industry Account” provides data on U.S. Industry’s total sales. Since the two sections collect data based on different

17
Figure 1.2 shows that U.S. Parents’ market shares follow a declining pattern in
favor of their foreign competitors over the period analyzed. U.S. Parents held around 75
percent of the U.S. market in 1983 and only around 57 percent in 2007. In 1997, the
Standard Industrial Classification (SIC), used to classify industries, was changed to the
Noth America Industrial Classification System (NAICS). Here the SIC-to-NAICS shift has
been dealt with by using the bridge tables provided by the U.S. Census Bureau.13 Despite
the use of bridge tables the year 1997 presents an abnormal change in the market shares.
By dividing the time span into two sub-periods, U.S. Parents’ market shares moved from
around 75 percent to something more than 70 percent in 1996. A much more pronounced
decrease (around 10 percent) has been registered by U.S. Parents’ market shares during
1999–2007.
Figure 1.2: MNCs’ market shares: U.S. Parents versus U.S. Affiliates
As suggested by Prof. R.E. Lipsey and by the BEA Direct Investment Division, a
company generally considered to be a manufacturer may have been classified in wholesale
trade. This bias arises because data are classified at the enterprise level and affiliates are
classified into one industry code based on their sales. Only when the majority of sales was
methodologies, “data on MNCs are not directly compatible with data on the U.S. Industry” (BEA: Balance of Payments Division). Accordingly U.S. Parents’ and U.S. Affiliates’ market shares are computed here over the MNCs total sales. 13 The SIC code lasted from 1930 to 1997, when the new NAICS code was introduced. The main difference between the two industry codes was that the SIC groups classified establishments by their primary types of activities, while the NAICS classified establishments according to production processes. Here the time series have been created by using the “bridge tables between SIC and NAICS” provided by the US Census Bureau (http://www.census.gov/epcd/ec97brdg/). In the “bridge tables” the US Census Bureau provides a correspondence between the two coding systems for the year 1997, providing a double classification in SIC and NAICS codes.
0
0.1
0.2
0.3
0.4
0.5
0.6
0.7
0.8
USA
USP

18
from U.S. production, U.S. affiliates were classified as manufacturers. The great share of
U.S. Affiliates’ wholesale trade total sales (WHLE) over their total manufacturing (MFG)
sales (Figure 1.3) is likely to bias estimation results for the period 1983–1998. In order to
account for this bias, a dummy variable will be interacted with the level of U.S. Affiliates’
wholesale total sales in estimation. The dummy (dummyWHLE) will take the value of 1
for the period in question (1983–1998), 0 otherwise.
Figure 1.3: U.S. Affiliates motor vehicles: Percentage of wholesale total sales over the manufacturing total sales
From Figure 1.3, it appears also that the percentage of wholesale total sales over the
manufacturing total sales decreased until 1984. This suggests that the VERs influence is
still decresing U.S. imports. As stated earlier, the Fair Practices for Automotive Product
Act required foreign firms to undertake local production in order to retain their current
levels of sales. After the high level of the U.S. Dollar appreciation in 1985, Japanese
automakers intensified their FDI into the U.S., and started transplant production that
allowed them raising imports again. That scenario lasted until 1987 when a great
depreciation of the U.S. Dollar continued to encourage foreign investment and discourage
U.S. imports. The abnormal peack in U.S. import of Japanese cars in 1987 is possibly due
to the end of the second run of restraints in Japanese exports. As Figure 3 shows, from
1987 onwards the imports as percentage of manufacturing total sales declined sharply until
1997. From 1998 onwards the WHLE total sales stabilized their percentage over the
manufacturing total sales, representing about 0.7 percent of U.S. Affiliates’ total sales in
the U.S. motor vehicles industry until the end of the period analyzed.
Figure 1.4 shows the level of sales per employee for both types of manufacturing
multinationals. U.S. Affiliates registered the highest level of sales per employee from 1989
024681012141618
SalesWHLE/SalesMFG
SalesWHLE/SalesMFG

19
onwards. The abnormally low level in 1997 is still attributable to the SIC/NAICS shift. On
the other hand, the low level of U.S. Affiliates’ sales per employee in the early years of the
analysis is possibly due to the fact that in this period the majority of foreigners’ sales were
from the wholesale motor vehicle sector.14 U.S. Affiliates are likely to have a great level of
sales per employee because they are productive plants, leaving all the “non-productive”
activities located in the foreign headquarters. Data are in millions of U.S. Dollar at current
prices in order to compare the two types of multinationals.
Figure 1.4: Sales per employee: U.S. Parents versus U.S. Affiliates (million US dollars)
U.S. Parents are the multinationals involved in R&D activities the most (Figure
1.5). As previously hinted, U.S. Parents’ headquarters and research centers are based in the
U.S. On the contrary, the foreign-owned firms are productive plants, established mainly to
avoid trade restrictions and to maintain market shares. In this line foreign multinationals
are likely to leave the research and development centers close to the foreign headquarters.
In addition, foreigners’ market shares were based on the small and compact cars segment,
while U.S. firms were focused on the production of big and family-size cars.15 Thus FDI in
the U.S. were mainly undertaken to maintain the U.S. market shares and not due to
14 Adding the wholesale motor vehicle sector to the U.S. Affiliates, the sales per employee change the figure in the years before 1998 according to the wholesale over manufacturing sales ratio of U.S. Affiliates in Figure 3. Values at current prices are used here to compare U.S. Parents and U.S. Affiliates.
15 In the early 1960s the Big Three imported small cars from their foreign affiliates and sold them in the US under the American brand (Nelson, 1996). US firms did not implement specific production line focused on the small and compact cars sector. They just tried a production of resized traditional vehicles.
0
100
200
300
400
500
600
700
800
900
USA
USP

20
technology-seeking and research motives.16 Accordingly, the low level of U.S. Affiliates’
R&D per employee is in line with the theory of market-seeking FDI. Figure 1.5 shows that
also in the case of the R&D variable the SIC/NAICS bridge implies some bias in the time
series. Data are in millions of current U.S. dollars. The use of money variables at current
prices does not bias the comparison between foreign-owned and American MNCs.
Figure 1.5: R&D expenditures per employee: U.S. Parents versus U.S. Affiliates
Figure 1.6 shows that domestic MNCs’ compensation per employee is higher on
average than the U.S. Affiliates’ levels. On the contrary, many studies in the literature
found that on average, foreign-owned firms pay higher wages than domestically owned
companies. The wage gap is usually explained by the differential in productivity between
foreign-owned and domestic owned firms. Even if once controlled for difference in wage
determinants, the foreigners’ wage premium falls substantially at least in developed
countries (Lipsey and Feliciano, 1999).17 Here the U.S. Parents’ highest wage level is
likely due to the fact that U.S. Parents’ employment include headquarters high-wage
employment, while U.S. Affiliates are mostly based on production-blue-collar workers.
Also in this case values at current U.S. dollars are taken just for the sake of comparison.
16 For the distinction between market-seeking and technology- or resource-seeking FDI, see Barba Navaretti and Venables (2004)17 Lipsey (2002) reports, “it is rare to find a study of FDI and wages in any host country that does not find that foreign owned firms pay higher wages, on average, than at least privately owned local firms. That is the case not only in developing countries…but also in developed, high wage countries…” Foreign-owned firms pay higher wages because they hire superior workers or because they acquire high wage plants or firms, or because they concentrate their activity in high wage industries (Lipsey, 2002).
0
5
10
15
20
25
USA
USP

21
Figure 1.6: Employees’ compensation per employee: U.S. Parents versus U.S. Affiliates
In the following sections an empirical analysis will further investigate the economic
activity of U.S.-based multinational firms. By empirical estimations, differences and
similarities between U.S. Parents and U.S. Affiliates will be underlined. In addition, inter-
relationships between the economic activity of U.S.-owned and foreign-owned
multinationals will be further investigated.
1.4 Data and methodology
The present analysis is based on the motor vehicles manufacturing sector. The
dataset used is from the U.S. Bureau of Economic Analysis (BEA). The BEA collects the
most accurate dataset on the activity of multinational corporations in the U.S. Data are
from the Operations of Multinational Companies section in the International Account. The
time-series span over the period 1983–2007.18 In 1997 the coding system used to collect
data was changed. Until 1997 data were collected according to the Standard Industrial
Classification system (SIC). From 1997 onwards data are collected according to the North
America Industrial Classification System (NAICS). The two different coding systems
differ in the methodology used to count establishments. The motor vehicles manufacturing
sector is the three-digit 371 SIC “Motor Vehicles and Equipment” and the four-digit
18 For 2008 only preliminary estimates are available. Accordingly the analysis lasts until the year 2007.
0
10
20
30
40
50
60
70
80
90
USA
USP

22
NAICS 3361 “Motor Vehicles Manufacturing”, 3362 “Motor Vehicle Bodies and Trailers
Manufacturing”, and 3363 “Motor Vehicle Parts Manufacturing”. Here homogeneous time
series have been constructed according to the “bridge tables between SIC and NAICS”
provided by the U.S. Census Bureau.19 Data are on total assets, employees’ compensation,
total employment, export, import, capital expenditures, net income, research and
development (R&D) expenditures, and total sales for both U.S. Parents and U.S. Affiliates.
The dataset will be used to estimate a system of simultaneous equations for both
U.S. Parents and U.S. Affiliates. As Ma et al. (2000) stated, “despite the increasing
importance of FDI and its multinational corporations, there has been little formal
systematic econometric modeling of the multinational firms”. The system explained here
intends to fill this gap by giving a modeling framework of the available variables of U.S.
multinational enterprises. The system will analyze the multinationals’ activity by allowing
for endogeneity through a complete specification (Mullen, 2007).20 In addition it is
important to analyze the relationship between FDI and multinationals’ activity in a
multivariate framework. Thus it is possible to get insights on indirect causality running
from FDI through auxiliary variables to economic outcomes (Ajaga and Nunnenkamp,
2008).21 This is likely to be the first attempt in constructing a system to investigate all the
available variables on multinational companies in the U.S. automotive sector from a
macroeconomic perspective.
First of all, given the absence of a pre-specified model to estimate the variables
investigated, each variable was estimated through OLS by a two-step procedure. In the
spirit of the LSE Approach (Sargan, 2001; Hendry, 2003), each variable is first estimated
by constructing a general unrestricted model. The unrestricted specification includes all
the regressors likely to impact on the dependent variable. Based on the results of this first
estimation, a restricted model has been developed. The restricted model resulted from the
unrestricted specification by eliminating the regressors not statistically significant. In such
a way all the redundant variables have been eliminated, and the correct specification able
19 www.census.gov
20 Mullen and Williams (2007) assume exogeneity in order to analyze the impact of FDI on domestic productivity through OLS. They stated explicitly: “a more complete specification might explore the determinants of inward FDI as part of a simultaneous system.”
21 Ajaga and Nunnenkamp (2008) investigate “the long-run relationships between inward FDI and economic outcomes in terms of value added and employment” by applying Johansen’s co-integration technique and Toda and Yamamoto’s Granger causality tests. They recognized that extending the analysis in a multivariate framework “would raise complex data and methodological issues”.

23
to explain the dependent variable has been found. For each model several diagnostic tests
have been performed in order to assess the consistency of each regression by avoiding
autocorrelation and non-normality of the residuals.22 Finally, each unrestricted/restricted
pair of models has been tested in order to identify the correct specification and to eliminate
redundant variables. The unrestricted/restricted models F-test was performed. For all the
specifications’ pairs the restricted models have passed the F-test. Accordingly, the
unrestricted specifications were rejected and the restricted models were taken as the
correct specifications to construct the system.
The system specification has been constructed by aggregating the models used to
estimate the single variables. The risk of endogeneity and simultaneously correlated
residuals is deterred through the construction of a simultaneous equations system, treating
as endogenous all the dependent variables and handling at the same time all the
coefficients to be estimated. Being investigated the activities of both US Parents and US
Affiliates, two different systems were elaborated. The two systems were estimated through
Two Stages Least Squares (2SLS) and Three Stages Least Squares (3SLS). As it is known,
the 2SLS procedure does not estimate the variance–covariance matrix, taking it as given.
The 3SLS procedure provides asymptotically more efficient estimates than 2SLS, because
it accounts for possibly correlated residuals. It estimates the variance–covariance matrix
and gives standard errors lower than those provided by the 2SLS technique. As expected,
3SLS estimates give lower standard errors and higher t-statistics than 2SLS, providing the
consistency of both the specifications and the dataset used in the present analysis. Indeed
the 3SLS technique is feasible only if the model specification is correct and the sample
presents an appropriate number of observations.23
22 A general test for the first order autocorrelation is the Durbin–Watson statistic (DW). When the lag of the dependent variable is among the regressors, the DW statistic is no more valid. Accordingly, in such cases the generalization of the DW proposed by Durbin (1970) has been used, i.e. the h-test. Further order serial correlation is checked through the Breusch–Godfrey serial correlation LM test. The normality assumption is checked through the Jarque-Bera Normality test.
23 In the case in which the specification is not correct or the number of observations is not appropriate to estimate the variance-covariance matrix, 3SLS does not provide standard errors lower than 2SLS and the estimation results have to be considered not statistically correct.

24
Note that during the period 1983–2007 many financial troubles occurred.24
Accordingly, the estimates are likely to be biased during the financial crises. The bias
usually occurs as an over- or under-estimation of the data. In such cases the graph of the
residuals is shifted upward or downward based on the bias. The use of dummy variables is
the fastest way to prove the occurrence of a crisis and to solve its estimation bias. The use
of dummy variables improves the fit of the models but reduces at the same time their level
of generality and their number of degrees of freedom. The decrease in the number of
degrees of freedom can severely alter the results, especially in such cases where two or
more dummies are needed. Here specific financial variables are introduced as reasonable
alternative to reduce the bias due to financial crises. Indeed through the use of financial
variables it is possible to account for financial instability as well as real economic
conditions and monetary policy decisions influencing firms’ activity. The variables in
question refer to the stability of the Dow Jones Industrial Average Index, U.S. money
supply (seasonally adjusted M2),25 and both short-term and long-term U.S. interest rates.
Financial data are from the Federal Reserve, the Dow Jones Industrial Average, and the
International Monetary Fund. The presence of such variables and their economic
relationship with the dependent variable will be discussed in presenting the results.
Additional regressors are the level of U.S. Parents’ import shipped by their own
24 A financial crisis occurred in 1987. On October 19 1987 the stock markets around the world crashed, shedding a huge value in a very short time. It was the largest one-day percentage decline in the stock market history. About ten years later, in 1996, a financial slowdown occurred at world’s level starting from the South East Asian stock market, the Hong Kong Exchanges and Clearing Limited. It spread immediately to the world’s principal stock markets. In 2001 the United States registered a period of market closure following the terrorist attack, from September 11 to September 17. That caused a period of financial and economic instability not only in the American region but also in the whole world. From 2007 to present several financial institutions collapsed, with many downturns around the world. It has been considered the worst financial crisis (the so called Great Recession) since the Great Depression of the 1930s.
25 As defined by the Federal Reserve Bank, “M2 consists of M1 plus (1) savings deposits (including money market deposit accounts); (2) small-denomination time deposits (time deposits in amounts of less than $100,000), less individual retirement account (IRA) and Keogh balances at depository institutions; and (3) balances in retail money market mutual funds, less IRA and Keogh balances at money market mutual funds. Seasonally adjusted M2 is constructed by summing savings deposits, small-denomination time deposits, and retail money funds, each seasonally adjusted separately, and adding this result to seasonally adjusted M1… M1 consists of (1) currency outside the U.S. Treasury, Federal Reserve Banks, and the vaults of depository institutions; (2) traveler's checks of nonbank issuers; (3) demand deposits at commercial banks (excluding those amounts held by depository institutions, the U.S. government, and foreign banks and official institutions) less cash items in the process of collection and Federal Reserve float; and (4) other checkable deposits (OCDs), consisting of negotiable order of withdrawal (NOW) and automatic transfer service (ATS) accounts at depository institutions, credit union share draft accounts, and demand deposits at thrift institutions. Seasonally adjusted M1 is constructed by summing currency, traveler's checks, demand deposits, and OCDs, each seasonally adjusted separately”. Available at www.federalreserve.gov.

25
foreign affiliates;26 the U.S. Gross Domestic Product (GDP) in its absolute and per capita
value; and the dummy WHLE.27
Estimations have been run using data in levels. In economics, the major problem
related to the use of level data is the high probability of having a unit root in the time-
series. The unit root makes the series a non-stationary process for which the standard
asymptotic theory is no more valid.28 Non-stationary series are usually differentiated, in
order to find a stationary process to be estimated. Here standard Unit Root tests have been
run on the BEA time series. The tests failed in rejecting the null hypothesis of unit root in
the series in level, while rejecting the unit root for the series in first difference. Many
authors show that unit root tests have low power in finite samples. Indeed unit root tests
are said to be unable in finite samples to distinguish the unit root null from nearby
stationary alternatives (Hamilton, 1994; Christiano and Eichenbaum, 1990; Diebold and
Kilian, 2000; Levin, Lin, and Chu, 2002). The question of whether a time series has a unit
root is inherently unanswerable on the basis of a finite sample of observations (Hamilton,
1994).29 In fact, “application of unit root tests without consideration of their low power and
for the restrictions that they inevitably impose in a finite sample can be misleading”
(Cochrane, 1991). Hamilton (1994) adds that “unit root and stationary processes differ in
their implications at infinite time horizons, but for any given finite number of observations
on the time series, there is a representative from either class of models that could account
for all the observed features of the data.” Indeed it is possible to have consistent results
from the estimation of non-stationary series. The point is that the linear combination of two
or more non-stationary processes can give a stationary process with constant mean and
variance. When the linear combination of two I(1) variables is an I(0) series, the two
variables are said to be co-integrated (Johnston and Di Nardo, 1996). Indeed Johnston and
Di Nardo (1996) pointed out that, “I(1) variables display a tendency to wander. When two
I(1) variables are co-integrated, however, they will tend to wander together. The zero mean
26 The level of import shipped to U.S. Parents by their own foreign affiliates is taken to account for the U.S. firms’ foreign production of small and compact cars sold in the U.S. under the American brand.27 This variable is in order to account for the cars’ import related bias on the early years of the analysis.
28 A stationary process is defined as a process having mean, variance, and auto-covariance constants independent of time. In the presence of unit root the unconditional mean and variance of the series do not exist and the series is said to be non-stationary (Johnston and Di Nardo, 1996).
29 “…for any unit root process there exists a stationary process that will be impossible to distinguish from the unit root representation for any given sample size T. Such stationary process is found easily enough by setting one of the Eigen values close to but no quite equal to unity…the converse proposition is also true…” (Hamilton, 1994).
26
and constant variance of their linear combination prevent them from drifting too far apart.”
Here the specifications have been estimated following Hamilton’s suggestion, that is, “one
practical guide is to estimate both with and without the unit root imposed. If the key
inferences are similar, so much the better” (Hamilton, 1994). Surprisingly, results from
estimations of the BEA series in levels and in first differences are very similar to each
other. In addition, the level specifications passed the standard tests for auto-correlation,
serial correlation, and non-normality of the residuals. For this reason, here results from
levels’ estimations will be presented, given that the level model is preferred until 70 annual
observations (Diebold and Kilian, 2000).
The following are the system to be estimated. Section 1.5 presents the results of
3SLS estimation, first for the U.S. Parents, and then for the U.S. Affiliate companies.

27
Table 1.1: Systems’ Specifications: U.S. Parents and U.S. Affiliates
U.S. Parents Dependent Variables
Regressors
Total Asset
Employees’ Compensation
Total Employment
K Expenditure
R&D
Total Sales
Export
Import
c(1) + c(2)*employmentUSP(-1) + c(3)*importUSP(-1) + c(4)*salesUSP + c(5)*assetUSA(+1) + c(6)*gdp_us + c(7)*importUSPbyaff + c(8)*ir_us(-1) + c(9)*m2_us c(10) + c(11)*employmentUSP + c(12)*exportUSP + c(13)*importUSP + c(14)*rdUSP(+1) + c(15)*m2gr_us c(16) + c(17)*employeescompensationUSP + c(18)*employmentUSP(-1) + c(19)*importUSP + c(20)*netincomeUSP(-1) + c(21)*rdUSP(-1) + c(22)*salesUSA(-1) + c(23)*importUSPbyaff(-1) + c(24)*irst_us(-1) + c(25)*m2gr_us + c(26)*dummy83_98*saleswhle(-1) c(27) + c(28)*employeescompensationUSP(-1) + c(29)*exportUSP + c(30)*importUSP(-1) + c(31)*netincomeUSP(-1) + c(32)*salesUSP(-1) + c(33)*kexpenditureUSA(-1) + c(34)*gdppcgr_us(-1) + c(35)*ir_us(-1) + c(36)*salesUSA(-1) + c(37)*importUSP c(38) + c(39)*assetUSP(-1) + c(40)*employeecompensationUSP + c(41)*empoymentlUSP(-1) + c(42)*exportUSP(-1) + c(43)*importUSP(-1) + c(44)*netincomeUSP(-1) + c(45)*salesUSP(-1) + c(46)*rdUSA(+1) + c(47)*importuspbyaff(-1) +c(48)*irst_us(-1) c(49) + c(50)*assetUSP + c(51)*employeecompensationUSP(-1) + c(52)*kexpenditureUSP + c(53)*netincomeUSP(-1) + c(54)*salesUSP(-1) + c(55)*salesUSA(-1) + c(56)*gdppcgr_us(-1) + c(57)*ir_us(-1) c(58) + c(59)*assetUSP + c(60)*importUSP + c(61)*netincomeUSP(-1) + c(62)*rdUSP(-1) + c(63)*djia(-1) + c(64)*kexpenditureUSA(-1) + c(65)*m2gr_us c(66) + c(67)*assetUSP + c(68)*employmentUSP(-1) + c(69)*exportUSP+ c(70)*netincomeUSP(-1) + c(71)*rdUSP +c(72)*dummy83_98*saleswhle(-1) + c(73)*m2_us
U.S. Affiliates Total Asset
Employees’ Compensation
Total Employment
K
Expenditure
R&D
Total Sales
Import
Export
c(1) + c(2)*assetUSA(-1) + c(3)*employeecompensationUSA(-1) + c(4)*employmentUSA(-1) + c(5)*exportUSA(-1) + c(6)*importUSA(-1) + c(7)*netincomeUSA + c(8)*salesUSA(-1) + c(9)*dummy83_98 c(10) + c(11)*assetUSA + c(12)*employmentUSA(-1) + c(13)*salesUSA(-1) + c(14)*dummy83_98*saleswhle c(15)+c(16)*assetUSA(-1) + c(17)*employeecompensationUSA + c(18)*rdUSA + c(19)*djia c(20) + c(21)*assetUSA(-1) + c(22)*exportUSA(-1) + c(23)*importUSA + c(24)*rdUSA + c(25)*salesUSA + c(26)*kexpenditureUSP(-1) + c(27)*djiahlc c(28) + c(29)*assetUSA(-1) + c(30)*employeecompensationUSA(-1) + c(31)*employmentUSA(-1) +c(32)*importUSA + c(33)*kexpenditureUSA(-1) + c(34)*netincomeUSA + c(35)*salesUSA(-1) c(36) + c(37)*assetUSA + c(38)*employeecompensationUSA + c(39)*employmentUSA(-1) + c(40)*importUSA + c(41)*netincomeUSA + c(42)*rdUSA(-1) + c(43)*gdppcgr_us(-1) + c(44)*m2_us c(45) + c(46)*employeecompensationUSA + c(47)*exportUSA(-1) + c(48)*kexpenditureUSA + c(49)*importUSP + c(50)*irst_us + c(51)*djia(-1) c(52)+ c(53)*assetUSA(-1) + c(54)*employeecompensationUSA + c(55)*employmentUSA + c(56)*importUSA(-1) + c(57)*kexpenditureUSA(-1) + c(58)*netincomeUSA + c(59)*salesUSA(-1) + c(60)*xrydgr(-1) +c(61)*djia + c(62)*exportUSA(-1)
Note: The variables and their sources are described in Appendix 1 in the variables’ list. USP: U.S. Parents USA: U.S. Affiliates The lag operator, i.e. (-1), represents the variable lagged one year, given that here it is dealing with annual data.

28
1.5 Estimation results
Estimation results are presented here separately for U.S. Parents and U.S.
Affiliates. As earlier, the systems have been developed treating all the dependent variables
as endogenous in order to deter from correlation between the residuals. The following are
the 3SLS estimation results.
1.5.1 U.S. Parents
U.S. Parents’ total sales (Table 1.2) are positively driven by the current level of
assets, while the current capital expenditures have a negative influence. Total assets are the
cumulative stock of current expenditures in both R&D and capital. Capital expenditures
have a negative sign because they represent investments undertaken to develop domestic
plants focused on family-size cars (Nelson, 1996).30 R&D expenditures, included in total
assets, are aimed at increasing the variety of products supply and consequently entered the
sales regression with a positive sign. Indeed, after the two oil shocks, US consumers
changed their preferences toward small and compact cars, imported in the US mainly by
Japanese and European firms, as introduced in Section 1.2. U.S. firms left the production
of small and compact cars outside the U.S. to subsequently import and assemble them
domestically (Nelson, 1996). Given the trend in consumer preferences, the enlargement of
domestic plants producing big cars obviously has a negative influence on the sales
performance. The U.S. Parents’ lagged sales level is negatively related to actual total sales,
while the lagged value of U.S. Affiliates’ total sales positively affects the U.S. Parents’
current sales. It can be a matter of product demand that determines such an opposite result
for the two lagged sales levels. Indeed an increase in U.S. Affiliates’ total sales represents
an increasing demand for small and compact cars. The demand for small cars positively
affects the U.S. Parents’ total sales which are moving from the family-size to the small cars
segment. On the other hand, the negative influence of the lagged level of sales can be also
due to the delay in the adjustment process in consumers’ demand due to external factors
such as an increase in the interest rates or a decrease in the purchasing power.
U.S. Affiliates’ total sales one year lagged shows that the U.S. demand of small
cars is increasing thus positively affecting the share of U.S. firms producing those cars. On
30 The Big Three maintained in the U.S. the production of family-size cars because it offered a greater profitability than the production of small and compact cars (Nelson, 1996).

29
the other hand, U.S. Parents’ total sales, principally based on family-size cars, faced a
continuously decreasing demand. This is likely to be the case given the established
marketing networks and good reputation of foreign competitors in the small and compact
cars segment. As expected the growth rate of U.S. per capita GDP enters the regression
with a positive sign, while the U.S. interest rate is strictly negative.
Expenditures in R&D activities by U.S. Parents are negatively influenced by the lag
of the assets variables (Table 1.2). The more the R&D undertaken in year t-1, the lower the
R&D in year t.31 Current employees’ compensation is positively related to current R&D
expenditures. The wage level is a reasonable proxy for the workers’ skill level.32 An
increase in the skill level is required to deal with innovations deriving from the R&D
activities. The lagged employment level enters the R&D regression with a negative sign. It
seems that increasing the labor-intensity impacts negatively on the investment in R&D.
This relationship is also due to the fact that R&D is usually devoted to develop innovative
and labor-saving production technologies. The lags of both the trade-related variables are
negatively related with U.S. Parents’ R&D. The higher the level of sales in the previous
year, the greater the expenditures in R&D in the current year. Also the lag of import
shipped to U.S. Parents by their own foreign affiliates is positively related to current R&D
expenditures. Taking the import shipped by foreign affiliates as proxy for outsourcing, and
the R&D as proxy for models’ variety, it has been shown that increasing variety implies a
productivity decline, while outsourcing production processes help in lowering the
productivity penalty (Van Biesebroeck, 2007). So the positive sign of the outsourcing
proxy is in line with previous findings. The expectation on U.S. Affiliates’ R&D is instead
negatively related to U.S. Parents’ R&D. U.S. firms seem to improve foreign-based
facilities’ innovative products to compete with foreign-owned companies. That is because
foreign competitors are leaders in the small and compact cars sector. As expected, the
interest rate variable enters the regression with a negative sign.
31 Remind that total assets include also intangible rights deriving from R&D activities, as defined by BEA.
32 Here the employees’ compensation is taken as proxy for the skill level. It would be more appropriate to use the percentage of R&D workers or the ratio between white-collar and blue-collar workers. Unfortunately the BEA dataset does not provide such information, so that it is not possible to find a precise proxy for the workers’ skill level.

30
Table 1.2: U.S. Parents and U.S. Affiliates estimation results: Total sales; R&D
expenditures
U.S. Affiliates U.S. Parents Dependent variable: Total sales
Asset 0.445*** (0.04)
Asset 0.22*** (0.036)
Employees' compensation
1.298*** (0.34)
Employees' compensation-1
6.4*** (0.616)
Employment -1 294.3*** (36.9)
K Expenditures -2.8*** (0.463)
Import 0.31*** (0.05)
Net income -1 0.69*** (0.24)
Net income 1.32*** (0.31)
Sales -1 -0.89*** (0.14)
R&D -1 -20.2*** (3.1)
Sales of US Affiliates -1
2.24*** (0.25)
US per capita GDP growth rate-1
860.1* (453.2)
US per capita GDP growth rate-1
9157*** (2136)
M2 US 0.01*** (0.002)
US Long Term Interest rate -1
-7329.9** (2525)
R2
Adjusted R2 0.999 0.998
R2
Adjusted R2 0.993 0.990
Dependent variable: R&D expenditures Asset -1 0.024***
(0.004) Asset -1 -0.02***
(0.004) Employees' compensation-1
-0.182*** (0.055)
Employees' compensation
0.011*** (0.02)
Employment -1 22.66*** (4.80)
Employment -1 -11.96*** (1.88)
Import 0.008** (0.003)
Export -1 -0.437*** (0.031)
K Exp -1 -0.058*** (0.015)
Import -1 -0.16*** (0.038)
Net income 0.082*** (0.02)
Net income -1 0.08*** (0.01)
Sales -1 -0.023*** (0.008)
Sales -1 0.063*** (0.0069)
R&D US Affiliates +1 -0.827*** (0.223)
Import shipped by foreign aff. -1
0.634*** (0.05)
US short term interest rate -1
-373.6*** (94.4)
R2
Adjusted R2 0.989 0.985
R2
Adjusted R2 0.985 0.971
Notes: Instruments are used following H. Theil (1971). For each variable the estimated coefficient is reported. The respective standard error is given within brackets. * significant at 10% ** significant at 5% *** significant at 1%.

31
U.S. Parents’ employees’ compensation (Table 1.3) is positively driven by the
current level of employment as expected. Also the export variable exerts a positive
influence on the dependent variable as well as the expected level of R&D expenditures. It
is likely that the more the expected R&D in time t +1, the higher the workers’ skill level at
time t in order to improve best practices and to deal with innovations. As hinted in the
R&D case, and found in the literature, an increase in the skill level is required to exploit
innovation-related advantages. It is puzzling that the growth rate of the U.S. money supply
negatively affects the employees’ compensation level.
U.S. Parents’ capital expenditures (Table 1.3) are positively driven by the lagged
level of compensation of employees. The increase in employment and consequently in the
compensation of employees requires investment in plants’ enlargement. The export
variable enters the regression negatively, suggesting that U.S. firms prefer to serve foreign
markets with foreign-based production. It is likely that foreign markets are focused on the
small cars segment, which U.S. Parents supply by their foreign-based production. On the
other hand, the past import level supports current expansion and capital investments to
develop new assembly plants or to expand existing facilities. It is likely that U.S.
companies enlarge their American plants to fine-tune the imported products to specific
characteristics of the domestic market. The current imports negatively influence capital
expenditures. The latter relationship stands for the fact that the current disposable income
is split based on the tradeoff between in-sourcing and out-sourcing activities, that is,
increasing U.S. production facilities or importing foreign-based products to serve the local
market. A large literature focuses on this trade-off showing that import, taken as proxy for
outsourcing, is negatively related with in-sourcing activities. The lagged level of total sales
influences the investments in fixed capital negatively. As U.S. demand for automobile
production shifted toward the small and compact cars, U.S. Parents find much more
profitable to import their foreign affiliates’ small cars production. As in Section 1.2, the
Big Three maintained the production of big cars in the U.S. in order to gain higher
markups. U.S. Parents’ total sales are likely to be biased toward family-size cars, not in
line with the new consumers’ preferences. The past level of U.S. Affiliates’ capital
expenditures is also negative. U.S. Parents are losing market shares and profitability over
the period analyzed, and they seem not able to react effectively to a foreign expansion.
Instead, the effect of U.S. Affiliates’ sales is positive, representing an expansion of the
U.S. small cars’ market, which can induce U.S. firms to enlarge assembly establishments.
The growth rate of the per capita GDP is still positive in the regression. It is generally used

32
as proxy for the consumers’ purchasing power. The lagged level of U.S. long-term interest
rate enters the regression with a negative sign, as expected.
Table 1.3: U.S. Parents’ and U.S. Affiliates’ estimation results: Employees’ compensation, capital expenditures.
U.S. Affiliates U.S. Parents Dependent variable: Employees' compensation
Asset 0.055*** (0.012)
Employment 57.06*** (6.53)
Employment -1 115.56*** (12.04)
Export 0.756*** (0.084)
Sales -1 −0.1303*** (0.026)
Import −0.343*** (0.048)
Sales USA WHLE
0.042*** (0.012)
R&D +1 1.38*** (0.2)
US M2 growth rate
−150258*** (22024)
R2
Adjusted R2 0.98
0.976 R2
Adjusted R2 0.926 0.903
Dependent Variable: Capital Expenditures Asset -1 0.079***
(0.006) Employees' Compensation -1
1.49*** (0.12)
Export -1 0.221*** (0.021)
Export −0.67*** (0.103)
Import 0.288*** (0.015)
Import -1 0.842*** (0.112)
R&D 3.85*** (0.51)
Net Income -1 0.377*** (0.049)
Sales −0.90*** (0.011)
Sales -1 −0348*** (0.023)
K Exp US Parents -1
−0.232*** (0.014)
K Exp US Affiliates -1
−1.06*** (0.279)
Dow Jones Instability Index
21065*** (5950)
GDP per capita growth rate -1
1289*** (390.7)
US Long Term Interest Rate -1
−3676*** (641.04)
Sales US Affiliates -1
0.716*** (0.051)
Import −0.582*** (0.139)
R2
Adjusted R2 0.996 0.994
R2
Adjusted R2 0.987 0.976
Notes: Instruments are used following H. Theil (1971). For each variable the estimated coefficient is reported. The respective standard error is given within brackets. * significant at 10% ** significant at 5% *** significant at 1%

33
Total employment (Table 1.4) is positively related to the current compensation of
employees, U.S. money supply, and the lags of total employment, net income, and that of
the import shipped to U.S. Parent by their foreign affiliates. This shows that U.S. Parents
increased the U.S. production of medium cars, and their assembly lines in order to refine
the products imported from the foreign affiliates. The influence of total import and lags of
R&D, U.S. Affiliates’ total sales, U.S. short-term interest rate, and U.S. Affiliates’
wholesale total sales is negative. Current total import affects the employment negatively as
it did in the capital expenditures regression. Current total import is likely to consist of final
product (small and compact cars) substituting for the firms’ enlargement. R&D seems
mainly focused on labor-saving techniques and practices or it can be related to product
variety. As an increase in the variety of products supplied decreases productivity, it is
standard practice to outsource some intermediate production in order to reduce the
productivity penalty. U.S. Affiliates’ total sales and wholesale total sales lower U.S.
Parents’ market shares and negatively influence U.S. firms’ expansion as expected. The
U.S. short-term interest rate is strictly negative influencing both the demand and supply
sides of the market.
U.S. Parents’ total assets (Table 1.4) are negatively related to the lagged level of
employment. On the other hand, import lagged at one period, current sales, import shipped
to U.S. Parents by their foreign affiliates, and U.S. money supply, all have a strictly
positive influence on the firms’ size. U.S. Parents started to react to foreign competition by
importing foreign-based production (Eden and Molot, 1996). In the second step U.S. firms
invested in the U.S. in order to start local production of small cars and fine tune imported
products. This pattern is particularly underlined by the strictly positive and significant sign
related to the imports shipped to U.S. Parents by their foreign affiliates. On the other hand,
the expected value of investment in total assets made by foreign competitors influence U.S.
Parents’ total assets negatively. It seems that the more the expected foreign presence in the
U.S., the less the U.S. Parents’ investment in domestic facilities. In this line U.S. Parents
will try to fight foreign competition on the small and compact cars market by importing
these from abroad. As it has been introduced while foreign producers were entering the
small and compact car market, U.S. automakers remained focused on family-size cars,
where they had much greater profitability (Nelson, 1996). U.S. GDP influences the
investments in total assets negatively, while U.S. money supply has a positive effect. As
expected, the U.S. long-term interest rate lagged one period enters the regression with a
negative sign.

34
Table 1.4: U.S. Parents’ and U.S. Affiliates’ estimation results: Total employment, total assets.
U.S. Affiliates U.S. Parents Dependent variable: Total employment
Asset -1 −0.0004** (0.0001)
Employees' compensation
0.005*** (0.0004)
Employees' Compensation
0.0081*** (0.001)
Employment -1 0.182*** (0.036)
R&D 0.051*** (0.007)
Import −0.004*** (0.0007)
Dow Jones Index
0.008*** (0.0014)
Net income -1 0.003*** (0.0003)
R&D -1 −0.009*** (0.0015)
Sales US Affiliates -1
−0.003*** (0.0004)
Import shipped by foreign affiliates -1
0.006*** (0.0012)
US short term interest rate -1
−20.05*** (2.299)
US M2 growth rate 1645*** (177)
Sales USA WHLE-1 −0.0044*** (0.0003)
R2
Adjusted R2 0.995 0.994
R2
Adjusted R2 0.983 0.968
Dependent variable: total assets Asset -1 2.77***
(0.113) Employment -1
−501.4*** (76.97)
Employees' compensation -1
−12.4*** (1.15)
Import -1 5.99*** (1.27)
Employment -1 1462*** (107.2)
Sales 0.864*** (0.181)
Export -1 −4.02*** (0.345)
Asset US Affiliates +1
−0.86*** (0.17)
Import -1 2.694*** (0.19)
US GDP −0.0002*** (0.00002)
Net Income 4.53*** (0.495)
Import shipped by Foreign Affiliates
11.75*** (1.81)
Sales -1 −2.44*** (0.21)
US long term interest rate -1
−29513*** (5161)
Dummy 83_98 88048*** (8965)
M2_US 0.29*** (0.024)
R2
Adjusted R2 0.998 0.997
R2
Adjusted R2 0.994 0.991
Notes: Instruments are used following H. Theil (1971). For each variable the estimated coefficient is reported. The respective standard error is given within brackets. * significant at 10% ** significant at 5% *** significant at 1%

35
The import regression (Table 1.5) shows a positive impact of the firm’s size, export
and net income. Since the import is related to the production of small cars to be sold in the
U.S., the greater the firm’s size, the greater the market share, and consequently the greater
will be the import of product to the market. The same mechanism works for the positive
sign related to the export variable. That between the two trade variables is a two-way
relationship as it is shown by the export regression. U.S. Parents’ R&D negatively
influences their imports, given that through innovations U.S. firms can implement a new
U.S. production line, which will substitute for cars’ import from foreign affiliates. Also the
U.S. Affiliates’ wholesale total sales negatively affect the import of U.S. Parents. It is
likely that both U.S. Affiliates’ wholesale total sales as well as U.S. Parents’ import meet
the same sector demand. As expected an increase in the money supply is positively related
to import of products.
U.S. Parents’ export (Table 1.5) is negatively related with current total assets,
suggesting that U.S. establishments are mainly aimed at serving the domestic market.
Firms’ enlargements are aimed at producing U.S. marketed cars. The sign of the import
variable is strictly positive, confirming the two-way relationship between the trade
variables. The lagged R&D expenditures and the Dow Jones Industrial Average index are
positive and significant. Negative influence is from the U.S. Affiliates’ capital
expenditures, which can substitute for U.S. Parents’ export in the nearest countries,
enlarging foreign-owned U.S. plants.
1.5.2 U.S. Affiliates
U.S. Affiliates’ total sales (Table 1.2) are positively driven by the firm’s size.
Indeed the current levels of total assets and employees’ compensation, and the lag of total
employment, all have a positive and significant influence on total sales. Still the import
variable is positive and significant. Importing final and intermediate production from
abroad allows U.S. Affiliates to be more competitive than domestic firms. In addition,
imports lower production costs, given that in the period analyzed it was much cheaper to
import from Japan than produce in the U.S. because of the high Yen/Dollar exchange rate.
The money supply (M2 U.S.) and the growth rate of U.S. consumers’ purchasing power
(here proxied by the per capita GDP) are both positively related to total sales as expected.

36
Table 1.5: U.S. Parents and U.S. Affiliates estimation results: import and export
U.S. Affiliates U.S. Parents Dependent variable: Import
Employees' compensation
−1.2*** (0.32)
Asset 0.04*** (0.005)
Export -1 −1.32*** (0.18)
Employment -1
−10.8*** (4.6)
K Exp 2.12*** (0.31)
Export 0.5*** (0.06)
Import US Parents
−0.58*** (0.11)
Net income -1 0.12*** (0.035)
US short term interest rate
1814.5*** (474.1)
R&D −0.47*** (0.19)
Dow Jones Index -1
13.2*** (1.33)
Sales USA WHLE-1
−0.08*** (0.014)
M2 US 0.007*** (0.001)
R2
Adjusted R2 0.965 0.952
R2
Adjusted R2 0.997 0.995
Dependent variable: Export Asset -1 0.27***
(0.073) Asset −0.05***
(0.006) Employees' Compensation
−8.1*** (1.14)
Import 0.6*** (0.07)
Employment 760.3*** (99.2)
Net Income -1 0.17*** (0.03)
Import -1 1.07*** (0.23)
R&D -1 1.4*** (0.21)
K Exp -1 1.36*** (0.3)
Dow Jones Index -1
5.06*** (0.51)
Net Income −2.26*** (0.46)
K Exp US Affiliates -1
−1.02*** (0.14)
Sales -1 −0.3*** (0.1)
US M2 growth rate
−188610*** (211039
xr growth -1 −16752* (9705)
Dow Jones Index
−5.2*** (1.1)
Export -1 −2.4*** (0.4)
R2
Adjusted R2 0.948 0.904
R2
Adjusted R2 0.991 0.987
Notes: Instruments are used following H. Theil (1971). For each variable the estimated coefficient is reported. The respective standard error is given within brackets. * significant at 10% ** significant at 5% *** significant at 1%
The lags of total assets and total employment are strictly positive in the R&D
expenditures equation (Table 1.2). An expansion of U.S. facilities has a positive influence

37
on the research and development activities. Lagged levels of employees’ compensation are
instead negatively related to R&D expenditures. It is likely that U.S. Affiliates engage in
R&D activities through direct investments or indirectly by hiring high-wage workers such
as engineers and development managers. A similar tradeoff is also seen between R&D
expenditures and lagged investment in fixed capital, while actual R&D and capital
expenditures are positively related in the capital expenditures regression. It seems both the
investments are directed to improve the firms’ productivity and profitability and that high
levels of investments in year t imply a lowest level in year t +1. Concerning the import
variable, an increase in import can be associated with an increase in outsourcing activities.
The increase in outsourcing activities in low cost countries allows a productivity gain and a
consequent increase in R&D expenditures aimed at differentiating the products and
offering a greater variety of models.33 The lagged sales level has a negative effect on R&D
expenditures. Taking R&D activities as proxy for models’ variety, a good sales
performance in the previous period does not require additional investment in the current
period.34 The positive sign of the net income variable is the results of a two-way
relationship between net income and R&D expenditures. First, the greater the returns of a
firm, the greater the investments undertaken. Second, the greater the R&D investments, the
greater the firm’s competitiveness and the consequent returns. Managers strive for R&D to
create excess returns in the competition process, given that R&D can be seen as a measure
of corporate innovation (Ito and Rose, 1999).
The employees’ compensation (Table 1.3) is positively dependent on the past level
of employment and the current level of assets. The variable assets includes among the
others the intangible rights developed through R&D to improve the firm’s performance.35
Accordingly, it is likely that the employees’ compensation increases not only for an
increased employment level, but also because of the increase in the skill level to support
the R&D expenditures undertaken to improve the firm’s result and labor saving practices.
The lagged sales level impacts negatively on total employees’ compensation. On the other
hand, the sales of the wholesale sector exert a positive and strictly significant effect on the
33 For the relationship among outsourcing activities, productivity, and models’ proliferation see Van Biesebroeck (2007).
34 It is also likely that well-performing firms in time t do not invest in innovative activities to improve their performances in time t+1.35 As defined by BEA, total assets include “any owned physical object or intangible rights having economic value to a firm”. (www.bea.gov)

38
dependent variable. This suggests that the expansion of the retail industry implies an
expansion of the manufacturing establishments in order to respect VERs program.36
U.S. Affiliates’ capital expenditures (Table 1.3) are positively driven by the lags of
total assets and export, and by the current levels of import, R&D expenditures, and the
Dow Jones Industrial Average Index. The positive sign of the import variable is likely to
be related to the trade restriction policy sustained by the U.S. until the mid-1990s. In order
to import foreign-produced cars, automakers were required to invest in the U.S. and hire
American workers to sustain U.S. economy. At the same time the negative sign related to
the current level of sales testify that an increase in U.S. demand is faced by imports from
abroad without expanding U.S. facilities. R&D is likely to involve investments in fixed
capital in order to develop new products specifically developed for the American
consumers’ preferences. The Dow Jones Index is a proxy for U.S. economic development
and registers the expected positive sign. Strong negative influence on foreigners’ capital
expenditures is from the expansion of domestic producers. Indeed investments in fixed
capital by U.S. Parent companies are likely to impact negatively on U.S. Affiliates’
investments.
The negative sign of the lagged level of total assets on the employment regression
(Table 1.4) suggests that U.S. Affiliates invest mainly in labor saving technologies and
machineries. Indeed U.S. Affiliates started their production in the southern states, in order
to take advantage of low wages, weak trade unions, and liberal work rules. During the
period analyzed the UAW unionized the new plants, and many pants were closed during
the 1980s and 1990s. In this line it is likely that U.S. Affiliates tried to lower employment
costs by introducing advanced machinery and production techniques. The positive sign of
the R&D and employees’ compensation variables confirms that U.S. Affiliates hired R&D
personnel to innovate production and white-collar workers in order to introduce best
practices and innovative management techniques.
Total assets (Table 1.4) are strictly and positively driven by their lagged value and
the lags of employment and import. Still positive are the effects of current values of net
income and the dummyWHLE variable. Strictly negative are the lags of employees’
compensation, export, and sales. The positive impact of the lagged import level is in line
36 Remember that the sales of the wholesale sector are interacted with the period dummy 1983–98 in order to account for the fact that during 1983–1998 many manufacturing firms could be registered as in the wholesale industry.

39
with the Japanese VERs framework.37 It is likely that foreign MNCs established retail and
service networks in the U.S. before introducing foreign-owned production, as it is also
suggested by the positive coefficient of the dummy variable. The negative impact of the
employees’ compensation is straightforward as foreign-owned plants are usually located
where production costs are the lowest. The export variable is likely to have a negative
impact on FDI into the U.S. As discussed in Section 1.2, FDI in the U.S. automotive
industry are mainly from Japan. Japanese MNCs tend to export home production and not to
invest in the U.S. as export platform, given that they face much lower production costs in
Japan because of the relatively high Yen/Dollar exchange rate, especially in the first years
of the period analyzed. The negative sign related to the lagged sales’ level suggests that
increasing U.S. demand for foreign cars does not imply an increase in U.S. inward FDI. It
is likely that foreign MNCs continue to import home production in order to have much
lower production costs, as it is from the signs related to employees’ compensation and
import.
As regards total imports (Table 1.5), U.S. Affiliates are likely to import high-skilled
home production in order to compete with U.S. automakers. An upgrading in workers’
skill level will reduce import from abroad. This is likely to be the motivation for the
negative sign related to the employees’ compensation in the import equation.38 On the
other hand, the negative impact exerted by the export variable suggests that the U.S. is not
taken as an export platform by foreign MNCs. Actual levels of capital expenditures are
strictly positive given that fixed investments have been the prerequisite of import in the
U.S. at least until the end of the VERs program.39 As expected, the influence of U.S.
Parents’ import is strictly negative. Indeed, U.S. automotive firms outsourced the
production of small and compact cars to their foreign affiliates, especially in Europe and
Japan, in order to be competitive with respect to foreign MNCs in the domestic markets.
So the import of U.S. Affiliates and U.S. Parents are competing in the U.S. in the same
market segment. The U.S. interest rate impacts positively on import, given that an increase
in the interest rates consequently increases the production costs and subsequent
outsourcing activities. The Dow Jones Index stands for an expansion of the U.S. economy.
37 As previously discussed, VERs were imposed in order to stimulate local U.S. production by foreign multinationals.38 In economics it is common to use the average wage as proxy for the workers’ skill level.
39 In this respect it must be reminded that the VERs program regarded not only Japanese firms. Also Volkswagen has invested in the US in order to maintain US market shares.

40
It enters the regression with a positive sign because import of cars is used by U.S.
Affiliates to satisfy an increased market demand.
U.S. Affiliates’ size, proxied here by total assets, total employment, and capital
expenditures, exerts a positive influence on the export regression (Table 1.5). It is likely
that large foreign-owned firms are used to serve the markets close to the U.S. Also the lag
of import variable has a positive sign, suggesting that the U.S. Affiliates’ imports are
complementary to final production, as it is the case also in the sales regression.
Employees’ compensation enters the regression with a negative sign, given that an increase
in the labor cost decreases the competitiveness of U.S. Affiliates’ production in the world
market. Lagged level of U.S. sales is negatively related with export given that an increase
in U.S. demand decreases the number of cars to be exported. Negative is also the sign of
the Yen/Dollar exchange rate growth even if it is statistically significant only at 10 percent
level. An appreciation of the U.S. dollar makes it more expensive to produce in the U.S.
than in Japan. In this line Japanese automakers prefer to serve foreign market with
domestic production, not by U.S.-based facilities. As shown earlier, the Dow Jones
Industrial Average index is taken as a proxy of U.S. economic development. An increase in
the index has a negative effect on the export variable given that it suggests an increase in
domestic demand. The negative sign related to the lagged export variable may show that
foreign MNCs establish plants in the U.S. to serve the local market, supplying the foreign
demand with different production.
1.6 Conclusions
In the literature there has been little formal systematic modeling on FDI. The
present analysis is likely to be the first attempt in filling this gap. Here MNCs’ activity in
the U.S. automotive industry has been analyzed in detail through a system of simultaneous
equations. In addition, in the analysis multinational enterprises have been distinguished
between domestic (U.S.)-owned (U.S. Parents) and foreign-owned companies (U.S.
Affiliates).
In the 1960s foreign automakers became strong competitors in the U.S. automotive

41
market against the American Big Three. Foreign firms entered the U.S. market through the
import of small and compact cars, which were not produced by American firms. U.S. Big
Three continuously decreased their market shares until the 1980s, when international trade
agreements limited U.S. car imports. In the early 1980s, in order to retain their market
shares, foreign competitors, especially Japanese firms, started U.S. cars production through
the lens of FDI. Foreign-owned U.S. firms continuously increased their market shares by
producing small and compact cars. Indeed after the two oil shocks, U.S. consumer
preferences tilted toward small cars, powered by a smaller engine than the traditional U.S.
family-size cars in order to reduce fuel consumption. U.S. Big Three were competing in
the small and compact cars sector by importing these from their European affiliates, and
continue to produce family-size cars in the U.S. U.S. MNCs’ market shares continued their
declining trends in favor of foreign competitors (Section 1.2).
The U.S. Bureau of Economic Analysis (BEA) collects the most accurate dataset on
the operations of multinationals in the U.S. Data from BEA are used here in order to
analyze MNCs’ activity in the U.S. automotive sector over the period 1983–2007. From a
first glance, the data reveal that U.S. Parents and U.S. Affiliates differ a lot in their
structure and economic activity (Section 1.3).
The analysis is deepened through the estimation of a simultaneous equations
system. To the best of our knowledge this is the first attempt to construct such a system by
investigating all the available variables on the operations of MNCs in the U.S. automotive
sector. In addition, the present work further analyzes the multinationals’ topic by
distinguishing between domestic (U.S.)-owned and foreign-owned multinationals. In the
spirit of LSE approach each variable has been estimated by a “two-step procedure”. First
of all a very general model including all the possible relevant variables has been created.
Then a restricted model is reached by eliminating all the redundant variables. Several tests
were run on both unrestricted and restricted models to deter from non-normality of the
residuals, serial correlation, and autocorrelation. Then an F-test between unrestricted and
restricted models has been run in order to single out the correct specification. The
restricted model passes the F-test for all the variables. Once the appropriate specifications
have been identified, two simultaneous equations systems have been elaborated, one for
U.S. Affiliates and the other for U.S. Parents. The use of simultaneous equations is very
useful in empirical analysis because it deters endogeneity in the estimation by treating all
the variables as endogenous (Section 1.4).
Three Stages Least Squares (3SLS) results (Section 1.5) confirm that the systems

42
have been constructed with the correct specifications and that the dataset used is consistent
for correct estimations. Empirical results show that U.S. Parents’ (Section 1.5.1) and U.S.
Affiliates’ (Section 1.5.2) economic activities are substantially different from each other
and they are explained in a very different way. Indeed all the investigated variables are
explained through greatly different specifications for U.S.-owned and foreign-owned
companies. At the same time both types of multinationals strongly influence each other on
their economic activities. In particular there exists a positive relationship between the U.S.
Parents’ sales and the lag of U.S. Affiliates’ total sales, and between the latter and the U.S.
Parents’ capital expenditures. These positive relationships suggest an increased U.S.
market for small and compact size cars, as foreign automakers are the leaders in this sector.
However, the relationships among the actual U.S. Parents’ capital expenditures and the
lagged levels of U.S. Affiliates’ capital expenditures, between U.S. MNCs’ employment
and the lagged levels of foreigners’ sales, and between the U.S. Parents’ export and the
lagged capital expenditures of foreign firms are negative. In addition, U.S. Parents are
strongly influenced also by their expectation on foreigners’ R&D expenditures and
expansion (as it is from the negative sign related to the expected level of U.S. Affiliates’
total assets in the assets regression and to their expected level of R&D expenditures in the
R&D equation). Accordingly with estimation results, it is likely that U.S. MNCs are
strongly and negatively affected by the foreign presence in the U.S. It is likely that the
increasing foreign presence in the U.S. reflects the new demand for small and compact
cars, which are mainly imported to the U.S. by American firms. This pattern is likely to
reduce U.S. Parents’ activity in the domestic market. On the other hand U.S. Affiliates are
influenced at the margin by U.S. MNCs’ activity. Negative influence exists only from the
U.S. Parents’ lagged capital expenditures and import. This stands for the fact that U.S.
Affiliates’ and U.S. Parents’ imports are competing for the same demand, and that a part of
U.S. Parents’ capital expenditures is devoted to establish small cars production.40
In addition, U.S. Parent companies strongly react on the expectations of U.S.
Affiliates’ behavior. This is a very important point given that in the literature very few
studies analyzed MNCs’ inter-relationships and none of these have taken into account the
rational expectations on competitors’ behavior.
40 As has been underlined, the U.S. Parents import small and compact cars from abroad to sell them under the American brand.
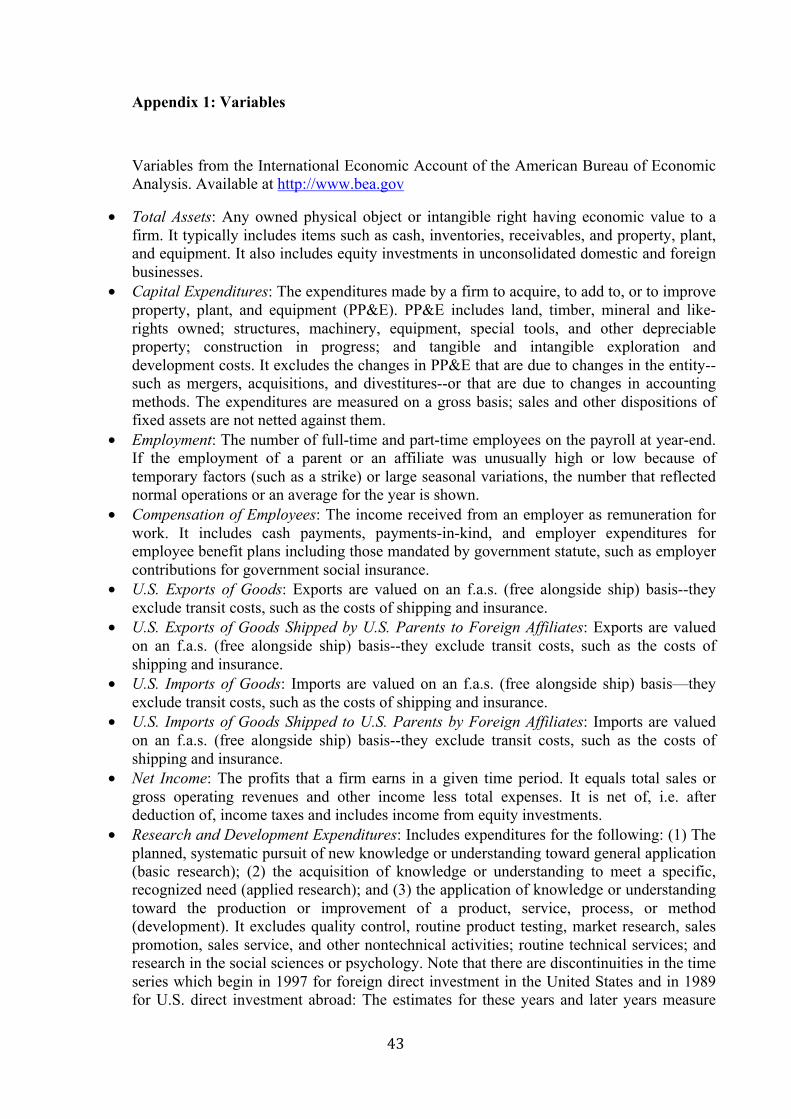
43
Appendix 1: Variables
Variables from the International Economic Account of the American Bureau of Economic Analysis. Available at http://www.bea.gov
• Total Assets: Any owned physical object or intangible right having economic value to a firm. It typically includes items such as cash, inventories, receivables, and property, plant, and equipment. It also includes equity investments in unconsolidated domestic and foreign businesses.
• Capital Expenditures: The expenditures made by a firm to acquire, to add to, or to improve property, plant, and equipment (PP&E). PP&E includes land, timber, mineral and like-rights owned; structures, machinery, equipment, special tools, and other depreciable property; construction in progress; and tangible and intangible exploration and development costs. It excludes the changes in PP&E that are due to changes in the entity--such as mergers, acquisitions, and divestitures--or that are due to changes in accounting methods. The expenditures are measured on a gross basis; sales and other dispositions of fixed assets are not netted against them.
• Employment: The number of full-time and part-time employees on the payroll at year-end. If the employment of a parent or an affiliate was unusually high or low because of temporary factors (such as a strike) or large seasonal variations, the number that reflected normal operations or an average for the year is shown.
• Compensation of Employees: The income received from an employer as remuneration for work. It includes cash payments, payments-in-kind, and employer expenditures for employee benefit plans including those mandated by government statute, such as employer contributions for government social insurance.
• U.S. Exports of Goods: Exports are valued on an f.a.s. (free alongside ship) basis--they exclude transit costs, such as the costs of shipping and insurance.
• U.S. Exports of Goods Shipped by U.S. Parents to Foreign Affiliates: Exports are valued on an f.a.s. (free alongside ship) basis--they exclude transit costs, such as the costs of shipping and insurance.
• U.S. Imports of Goods: Imports are valued on an f.a.s. (free alongside ship) basis—they exclude transit costs, such as the costs of shipping and insurance.
• U.S. Imports of Goods Shipped to U.S. Parents by Foreign Affiliates: Imports are valued on an f.a.s. (free alongside ship) basis--they exclude transit costs, such as the costs of shipping and insurance.
• Net Income: The profits that a firm earns in a given time period. It equals total sales or gross operating revenues and other income less total expenses. It is net of, i.e. after deduction of, income taxes and includes income from equity investments.
• Research and Development Expenditures: Includes expenditures for the following: (1) The planned, systematic pursuit of new knowledge or understanding toward general application (basic research); (2) the acquisition of knowledge or understanding to meet a specific, recognized need (applied research); and (3) the application of knowledge or understanding toward the production or improvement of a product, service, process, or method (development). It excludes quality control, routine product testing, market research, sales promotion, sales service, and other nontechnical activities; routine technical services; and research in the social sciences or psychology. Note that there are discontinuities in the time series which begin in 1997 for foreign direct investment in the United States and in 1989 for U.S. direct investment abroad: The estimates for these years and later years measure

44
R&D performed by the firm, either for itself or for others under contract; the estimates for earlier years measure R&D performed for the firm.
• Total Sales: The value of goods and services sold and, for financial firms, also includes investment income. It is net of returns, allowances, and discounts and excludes sale or consumption taxes levied directly on the consumer and excise taxes levied on manufacturers, wholesalers, and retailers. Other Variables:
• IR_US: U.S. long-term interest rate: source: OECD Statistics, Country Statistical Profiles. Available at http://stats.oecd.org/Index.aspx.
• IRST_US: U.S. short-term interest rate: source: OECD Statistics: Country Statistical Profiles, available at: http://stats.oecd.org/Index.aspx.
• GDP_US: U.S. Gross Domestic Product: source: The World Bank, available at: http://data.worldbank.org/
• GDPPCGR_US: growth rate of U.S. Gross Domestic Product: source: The World Bank, available at: http://data.worldbank.org/
• M2_US: U.S. money stock M2: Federal Reserve Bank, available at: http://www.federalreserve.gov/
• XRYD: Japanese Yen/U.S. Dollar exchange rate: Japanese Yen per units of U.S. Dollar: source: OECD Statistics: Country Statistical Profiles, available at: http://stats.oecd.org/Index.aspx
• DJIA: Dow Jones Industrial Average: source: Dow Jones Indexes, available at: http://www.djindexes.com/

45
Chapter 2
Is the Productivity of Multinational Companies in the Automobile Industry Affected by Complementarities?
A Macroeconomic Perspective
Abstract
The main goal of this paper is to see if the results on productivity in the U.S. automotive industry discussed in the recent microeconomic literature can be confirmed when macroeconomic data are used.
Using the BEA dataset on multinational corporations, the productivity model presented in Van Biesebroeck (2007) has been re-estimated for both U.S. and foreign firms.
Empirical results show that it is possible to infer similar conclusions using data at different aggregation levels even if some differences will persist between the micro and macro analysis. Surprisingly the difference in firms’ ownership does not imply different models to explain multinationals’ productivity. In addition the main variable involved in the productivity analysis show the presence of spillovers and strong interrelationships between U.S.- and foreign-owned companies, while the productivity variable does not show any spillover effect.

46
2.1 Introduction
Many studies in the literature show how firms’ performance is affected by internal
organizational design choices. The potential importance of interactions between different
elements of organizational design has been recently emphasized. It has been additionally
shown that the adoption of organizational design practices is correlated across firms and
that some practices appear together. Theory suggests that such clustering arises if the
organizational choices are complements (Athey and Stern, 2003). Complementarities are
defined as a positive dependency between groups of activities (Milgrom and Roberts,
1990).41 This topic has been largely analyzed at microeconomic level, while little
macroeconomic modeling exists in the complementarities’ analysis.
Among others, in his “Complementarities in automobile production”, J. Van
Biesebroeck (2007) analyzes the automobile industry in North America during the period
1994–2004 using plant level data. The author focuses on the increase in cars’ and light
trucks’ models produced in North America and its impact on firms’ productivity. He infers
that the increase in models’ variety could not be due to innovations in production
technology. On the contrary it mainly represents the firms’ reaction to changes in
consumers’ demand. This process will result in severe production difficulties. Indeed a
great variety of models can be produced at minimal extra costs by the leading firms, while
less competitive firms will incur in much greater productivity penalty in order to follow the
market trend and to preserve their market shares.
Do these microeconomic results hold in a macroeconomic context? Can
Biesebroeck's "productivity penalty" be detected and measured when industry level data,
as those published by the U.S. Bureau of Economic Analysis (BEA), are used? In addition,
the present work will separately consider U.S.- and foreign-owned multinational
corporations (MNCs). To the best of our knowledge this is the first attempt to compare the
plant-level productivity analysis of Van Biesebroeck with industry-level results in the U.S.
automotive industry.
41As in Milgrom and Roberts (1990) “the defining characteristic of these groups of complements is that if the levels of any subset of the activities are increased, then the marginal return to increases in any or all of the remaining activities rises.”

47
Section 2.2 will briefly review Van Biesebroeck’s 2007 work. First, his plant-level
dataset and the problem of models proliferation will be discussed. The author identifies
three activities, which affect productivity in the automotive industry, namely product
variety (Variety), technological flexibility (Flexibility), and Insourcing, that is, the
opposite of outsourcing. Even though these activities are associated with productivity
penalties, firms carry them out in order to adapt their production to new consumers’
preferences. Then he “investigate(s) the potential complementarities between these three
activities on the universe of all car and light truck assembly plants in North America over
the 1994–2004 period” (Van Biesebroeck, 2007). Finally the firm-level results on
productivity will be discussed.
In Section 2.3 the industry dataset from BEA will be discussed. Here proxies for
the investigated activities will be constructed, given that the available dataset does not
provide the same information. Then a specification very similar to that used by Van
Biesebroeck at plant-level is estimated, in order to see if results similar to those discussed
in Section 2.2 continue to hold. Section 2.4 introduces the econometric procedure under
estimations. First, the productivity specification is estimated through Least Squares. Then,
in order to deal with the problem of endogenous adoption decisions on the three activities
at the plant level, a simultaneous equations system for productivity will be constructed for
each type of MNC. This procedure will result in the estimation of two systems, one for
U.S. Parents (Section 2.4.1) and the other for U.S. Affiliates (Section 2.4.2). Systems
estimation represents a novelty in the MNCs’ analysis (Ma et al., 2000) and it is very
important because by a complete specification it is possible to account for endogeneity and
unobservable bias (Mullen, 2007). Section 2.5 concludes the analysis.
2.2 Plant level evidence
In his 2007 paper, Van Biesebroeck analyzes the impact on productivity deriving
from the different models proliferation on the automotive industry in North America from
1994 to 2004.

48
Firms engage in three main activities in order to supply a much greater variety of
models and maintain their market power. These are (i) the increase in the number of
models produced in a single plant: Variety; (ii) Flexibility, i.e. the adoption of flexible
technology; and (iii) In-sourcing, i.e. the adoption of multi-task plants, which is the
opposite of out-sourcing. The author first investigates the impact of each activity on
productivity, then their joint influence through the inclusion of interaction terms between
the three activities in the estimated model.
2.2.1 The general framework
The number of different models supplied in the North American automotive market
followed an increasing trend over the last decades. The number of different models of cars
and light trucks rose enormously from 1974 to 2004. It was in 1994 that the car models
increased the most. In that period the number of variations per model, that is Variety, also
increased a lot. In addition, while the number of models produced in the North American
countries has caught up with the number of models for sale in those markets, the number of
plants did not change as much. Accordingly the average number of models produced in a
single plant increased enormously. Furthermore, the increase in the models supplied has
been greater than the increase recorded by total sales (Van Biesebroeck, 2007).
Therefore, firms offer an increasing variety of different models by producing
several models in the same assembly plant (Van Biesebroeck, 2007). This phenomenon
implies an increase in manufacturing complexity in the production line as well as several
changes in the organization of the production processes inside the firms. Indeed, while
models proliferation starts by differentiating models in appearance, in a little time the
market will need to differentiate further the products supplied. Accordingly, a reduction in
similarities among vehicles produced by the same assembly plant will result. The process
will develop into increasing assembly lines per plant or into assembling on the same
platform models derived from different production lines. The adoption of flexible
technology will result as the principal way to make it feasible. Flexible technology is taken
only as an efficient way to produce a greater variety of vehicles per assembly line. Given
the data reported by Van Biesebroeck, this is likely to be the case from 1994 onwards. In
addition, the activity of assembling models from different production lines induces the firm
to solve the “make or buy dilemma”. That is the option to carry out in the same plant all

49
the production chain (In-sourcing) or to out-source some intermediate steps to other plants,
accordingly to factor-cost advantages. Data analysis suggests that firms adopt multi-task
plants, i.e. they In-source intermediate stages of the production chain to maintain their
competitiveness in the market.
2.2.2 The dataset
Van Biesebroeck (2007) uses a plant level dataset from The Harbour Report North
America, which is available for 1980, 1981, 1989, and every year from 1994 onwards. The
dataset is collected by integrating information supplied by the firms with plant visits by
representatives of Harbour Consulting. The data analyzed refer to all car and light track
assembly plants in U.S., Canada, and Mexico over the period 1994–2004.
The dependent variable is “hours-per-vehicle,” that is, the number of hours taken
by each plant to assemble a single vehicle. “Hours-per-vehicle” represents the principal
output of the Harbour Consulting report. This productivity measure is anomalous, given
that it represents exactly the inverse of the standard labor productivity.42 Indeed it is
standard practice in the literature to use a measure of productivity expressed in value and
not in hours. In addition the use of hours-per-vehicle as productivity proxy can be
misleading given that the product, i.e. automobiles, is not homogeneous. Indeed the
production of different car models requires different production techniques and skill levels.
The author uses it as an informative measure of the firms’ productivity by “assuming that
other inputs are fixed over time and across plant or vary proportionally to output.” Note
that prior to 1998 the productivity measure was computed as workers-per-vehicle, as
underlined by the author. That procedure “ignored daily fluctuations in production and
converted employment to full-time equivalent workers. Given that both measures (of
productivity) are available in 1998 and 1999,” Van Biesebroeck converts the workers-per-
vehicles into hours-per-vehicles using a conversion factor influenced by ownership (firm)
and location (country). In the regressions he includes a pre-1998 dummy to control for
that.
42The author also recognized this feature. In order to take hours-per-vehicle as an informative productivity measure, Van Biesebroeck implicitly assumes that the other inputs are fixed over time and across plants or vary proportionally to output.

50
Additional control variables are location dummies (U.S., Canada, and Mexico);
ownership dummies; segment dummies, in order to distinguish between the production of
compact cars, mid/full size cars, sport/specialty cars, luxury cars, SUVs, pickup, trucks,
mini vans, and full-size vans; a year trend; and a scale economies index, measured by the
logarithm of production capacity.43
2.2.3 Methodology
According to the general scenario, the three phenomena involved are the following:
(i) increasing Variety in models supplied, (ii) the adoption of Flexible Technology in
production, and (iii) the In-sourcing processes. Van Biesebroeck investigates the impact of
the three activities on firms’ productivity and to what extent they are likely to create
positive or negative externalities. The following are the ways in which the author measures
the three variables and the instruments used in the estimation.
Variety is measured by “the sum of the number of body styles and chassis
configurations produced in the plant.” As an instrument for a plant variety “the average
number of varieties produced by plants of other firms, limited to models that compete in
the same segment” is used.
The adoption of flexible technology is proxied by the number of platforms per
line.44 Instruments for flexibility are the inside area of the plant and the way in which shift
relief is organized. These are indeed the two phenomena mainly involved in the adoption
of flexible technology. As in Van Biesebroeck (2007), “size is important as only larger
plants have the option to duplicate assembly lines, an alternative approach to producing
more variety.” The organization of the shift relief is also crucial because it reflects the
interaction among blue-collar and white-collar workers. This interaction is very important
in the adoption decision, given that flexibility requires high-skilled workers. As with the
size of the plant, the shift relief organization is also likely to be uncorrelated with
unobservables in the plant-level productivity, once controlled for ownership.
43 The scale economy index is calculated using a constant line rate and the regular shift pattern followed during the year (Van Biesebroeck, 2007).
44 Note that a plant adopts flexible technology, but it could or could not have been exploited. As from the author, “one has to somehow distinguish between acquiring and exploiting the capability”.

51
The In-sourcing strategy is measured as the share of materials in final sales.45 Note
that the author does not find a time trend in the outsourcing decision, or peculiarities
among different plants. As reported, “the range of materials and components each
assembly plant receives from other plants is relatively similar. Much of the changes in
sourcing are likely to happen at the firm instead of the plant level.” Instruments are the
distances between each plant from the center of the industry computed by year for the
entire North American industry and by country. Indeed plants located far away from the
industry’s center are likely to find the availability of intermediate suppliers more costly.
The author shows that each of the mentioned phenomena creates a productivity
penalty in its own, but their joint adoption can produce positive externalities reducing the
productivity penalties through a complementary effect.
2.2.4 Results
Van Biesebroeck’s analysis shows that the model proliferation phenomenon, that is,
producing a number of different models, increases labor requirement. An increase in direct
labor requirement is also due to the adoption of “flexible technology,” because of a
complication of the production process, and by the In-sourcing decision, because of the
carrying out of more activities in the same plant. The analysis was conducted through the
following steps:
First, the author focuses on the productivity penalties associated with the
production of a greater Variety. In the estimated model hours-per-vehicle is the dependent
variable, and several measures of Variety are the regressors one at a time, with the
inclusion of the mentioned control variables.46 In the Least Squares (LS) estimation all the
coefficients are significantly positive, demonstrating a strictly negative impact on
productivity.
45 Materials mean the sum of raw materials, intermediate inputs, and purchased business services in final sales.
46 In this first regression the indices of variety are the number of platforms, models, body styles, chassis configurations, and the sum and product of styles and configurations.

52
Then the author elaborates an additional model to include the measures of
Flexibility, In-sourcing, and their interaction terms in the set of regressors.47 Estimation is
run by LS and by Generalized Method of Moments (GMM) after instrumented the
regression as in the previous section.48 GMM estimations are run in order to treat the three
activities as endogenous one at a time, and, in a second step, all together to account for the
firms’ endogenous adoption decisions. The different regressions differ from the point
estimates, the coefficients’ p-values, and R2 of the regression. However, all the estimates
report the same signs of the coefficients, suggesting similar conclusions. Given the
dependent variable, all three activities have a positive impact on it, increasing labor
requirement. In conclusion, the three activities are associated with productivity penalties.
On the other hand, their joint adoption brings about positive externalities in the
productivity equation, given that each interaction term reports a negative sign. This stands
for the complementary effects between the three activities. In fact the joint occurrence of
the three phenomena reduces the productivity penalties deriving from their single adoption.
The idea is that the increased labor requirement to produce additional variety can be
reduced because of flexible technology and positive spillovers from In-sourcing activities.
As pointed out by the author, “increasing one activity tends to decrease productivity, but
this reduction is diminished if other activities are increased as well. In particular, while
flexibility and performing more tasks in-house increases direct labor requirements, they
reduce the marginal labor requirement associated with increases in variety.” In conclusion,
the negative effect on productivity due to the production of greater variety is more than
offset by the positive effect of the interactions between variety, flexibility and in-sourcing.
On the other hand, the total increase in labor requirement due to the adoption of the three
activities is greater than the positive effects of their interaction.
47 Here Variety is measured as the sum of the number of body styles and chassis configurations produced in the plant. Among the regressors the controls described before are included.
48 For Variety the instrument is the average number of different models produced at plant level by competing firms in the same market segment. For Flexibility the instruments are the area of the plant and the shift relief organization. For In-sourcing the distance from the plant to the center of the industry is used as instrument.

53
2.3 Productivity from a macroeconomic perspective
Here the industry-level dataset from the U.S. Bureau of Economic Analysis (BEA)
will be used. The time considered spans from 1983 to 2007. From the available data it is
possible to construct proxies for the activities investigated in the plant-level analysis. The
general framework is taken as given from Van Biesebroeck (2007). As in the previous
section, attention will be focused on the analysis of complementarities between the three
activities of Variety, Flexibility, and In-sourcing influencing the firms’ productivity. Using
data from BEA productivity will be investigated at a much more aggregated level, as
introduced in Section 2.3.1. To the best of our knowledge this is the first study comparing
macro- and micro-level productivity analysis. In addition, MNCs will be distinguished as
U.S.- and foreign-owned companies to investigate whether the difference in ownership
implies difference in productivity. Indeed data from BEA are divided among U.S. MNCs
and foreign-owned MNCs. Obviously it is not possible to estimate exactly the same
models because of differences in data characteristics. However, reasonable proxies will be
found (Section 2.3.2) and the same issue will be analyzed at different levels of data
aggregation (Section 2.4). The present paper is very important because it shows that it is
possible to carry out similar analyses from such different perspectives.
2.3.1 The dataset
As already mentioned, the data are from BEA. They span over the 1983–2007
period. The dataset concerns total assets, total employment, compensation of employees,
Research and Development (R&D) expenditures, capital expenditures, total sales, import,
and export. For all the variables, the values are in millions of chained 2005 U.S. dollars.
The investigated companies are from the SIC 371 “Motor Vehicles and Equipment
Manufacturing” and NAICS 3361, 3362, 3363 “Motor Vehicles, Bodies and Trailers, and

54
Parts” sectors.49 The dataset is distinguished by ownership between U.S. Multinational
Companies (MNCs), that is U.S. Parents, and U.S. Affiliates of foreign MNCs, that is U.S.
Affiliates. This allows investigating whether the different ownership also implies different
firms’ organization and economic behavior. Van Biesebroeck also distinguishes among
firms’ ownership, but he does not focus the attention on the difference between them. The
author only refers to the superiority in productivity of foreign-owned firms. He does not
discriminate estimations among domestic-owned and foreign-owned companies. This
distinction is very important, given that different firms’ types are likely to be influenced by
different factors. This is expected to be the case, especially in this framework where
differently owned firms produce different products. Indeed U.S. automakers have mainly
focused on the production of big-sized cars while foreign-owned transplants in the U.S.
were producing small and compact cars (Cooney and Yacobucci, 2005). Both U.S. Parents
and U.S. Affiliates follow different patterns in the available variables that are explained by
different models for U.S.- and foreign-owned firms (Chapter 1). In order to investigate the
impact of Variety, Flexibility, and In-sourcing and their interactions on productivity, the
following procedure has been used according to Van Biesebroeck (2007). The model used
by Van Biesebroeck is:
hpv = áv Variety + áf Flexibility + áI Insourcing + (âvf Flexibility + âvIInsourcing)*Variety
+ áfIFlexibility*Insourcing + ás Scale + Other controls
Hours-per-vehicle (hpv) is the dependent variable. As it is the case in economic
literature, productivity is generally measured by a value index. It is anomalous to use hpv
in order to measure labor productivity.50 Many studies in the macroeconomic literature use
the ratio Value Added over Total Employment or Total Sales over Total Employment to
proxy for labor productivity. Given data availability from BEA, the series Value Added
49As it is well known, the Standard Industrial Classification (SIC) system starts in 1930 and lasts until 1997, when the North America Industrial Classification System is introduced. The main difference between the two codes is that the SIC groups establishments by their primary types of activity, while the NAICS classifies establishments according to similar production processes. Here homogeneous time series have been created by using the “bridge tables between SIC and NAICS” provided by the US Census Bureau at http://www.census.gov/epcd/ec97brdg/. In the “bridge tables” the U.S. Census Bureau provides a correspondence between the two coding systems for the year 1997, providing a double classification in SIC and NAICS codes.
50 The use of hours-per-vehicle to measure productivity is not the ordinary way, given that it represents exactly “the opposite of the standard measure of labor productivity” (Van Biesebroeck, 2007).

55
shows many missing values.51 Accordingly the ratio Total Sales over Total Employment is
used here as proxy for productivity. In this way it is possible to count in U.S. dollars the
value to be attributed to each unit of labor.
According to data availability, the terms Scale and Other controls will be dropped
from the models. Indeed Scale refers to a proxy for scale economies and the other controls
used are location dummies, a year trend, and segment dummies, which are not present in
the BEA dataset. Therefore, the analysis will only focus on the effects of the three
variables and their interaction terms. In addition, the U.S. Gross Domestic Product (GDP)
is included among the regressors to account for exogenous factors.
Figure 2.1 shows that both U.S. Parents’ and U.S. Affiliates’ sales per employee
start the period analyzed with almost the same level.52 After 1989 foreign firms registered
a higher level of productivity with respect to domestic companies. Both types of MNCs
follow an increasing trend, with domestic firms being characterized by a lower rate of
growth than foreign plants. The 1997 abnormal point in the U.S. Affiliates’ trend is likely
due to the SIC/NAICS shift, while data for U.S. Parents do not suffer from this bias.
Figure 2.1: Sales per employee for U.S. Parents and U.S. Affiliates – 1983–2007 (millions of chained 2005 U.S. dollars)
51Data on Value Added are available only from 1993 to 2001 for U.S. Affiliates and from 1993 to 2007 for U.S. Parent companies.
52 The low levels of U.S. Affiliates’ sales per employee in the early 1980s are likely to be biased. Indeed when the first transplants were established in the U.S., their majority was registered as wholesale trade motor vehicles, while here the attention is focused on the manufacture of motor vehicles.
0
200
400
600
800
1000
1983
1985
1987
1989
1991
1993
1995
1997
1999
2001
2003
2005
2007
produsa
produsp

56
2.3.2 Macro level proxies
The three activities under analysis in the productivity regression are Variety,
Flexibility, and In-sourcing. At plant-level, Van Biesebroeck constructs the variables using
the number of body styles and chassis configurations produced in a plant for Variety;
platforms per line for Flexibility; and the share of raw materials in final sales for In-
sourcing. Here the different data aggregation does not offer the same information. The
proxies proposed for the three activities are the following.
Variety: In this thesis the BEA dataset has been chosen for econometric estimation
because of both its homogeneity and accuracy in collecting data on operations of
multinational corporations in the U.S. The BEA dataset offers a great variety of
macroeconomic variables. Among the others Research and Development Expenditures is
the main variable representative of innovation processes. Expenditure in R&D is a
reasonable proxy for input innovation (Dodgson and Hinze, 2000), even if it includes effort
for both process and product innovations (Rosekranz, 2003). In order to use this variable as
proxy for Variety, it is assumed here that both types of innovation, i.e. process and product
innovation, are held in constant ratio on firms’ R&D projects. Therefore, there is a strong
link between R&D and output innovation (Chen and Mohnen, 2009; Aw and Batra, 1998).
Obviously this is a strong assumption. In future research it will be interesting to construct a
proxy for Variety by combining expenditures in R&D and the new models introduced year
by year. Here such an analysis is over the goal of the paper, and the previous hypothesis is
assumed to ensure data homogeneity. In line with microeconomic results, the variable
should enter the productivity regression with a negative figure, that is, increasing Variety
reduces labor productivity.
Flexibility: The main characteristics of flexible technology are the availability of
flexible capital and skilled labor. Capital must be flexible in the sense that production
machineries must be useful to apply for different production processes in order to
implement the production of different models in the same plant. High-skilled labor is
required to face an increasing production complexity, to have problem solving skills, and
to interact with manager, in order to implement flexibility in production (Van Biesebroeck,

57
2007). Accordingly the proxy for Flexibility has been constructed here through the
following interaction:53
In-sourcing: In-sourcing activities are the opposite of out-sourcing (Van
Biesebroeck, 2007). The import variable could be a reasonable proxy for out-sourcing. In
fact here import consists of raw materials and intermediate goods, given that this
framework is dealing with the production side of the economy. The trade of goods among
affiliates of the same MNC located in different countries is registered here as import. This
allows using import as proxy for outsourcing at plant-level. This is in line with the In-
sourcing index of Van Biesebroeck, as he accounted for the plant-level import. Then the
import variable is taken as proxy for the opposite of In-sourcing. Accordingly with plant
level analyses, it should enter the productivity regression with a positive sign. All the
variables are taken in their per capita values.54
2.4 Estimation and results
Can Biesebroeck's "productivity penalty" be detected (and measured) when
industry level data, as those published by BEA, are used? Here the first goal is to see if the
results on productivity in the U.S. auto industry reported in the microeconomic literature
(e.g. Van Biesebroeck, 2007) continue to hold when a macroeconomic perspective is used.
In addition, the present work will separately consider U.S.- and foreign-owned MNCs. For
the first time a specification very close to that used at plant level by Van Biesebroeck
(2007) is estimated using the dataset from BEA to analyze the impact of product Variety,
technological Flexibility and In-sourcing on firms’ productivity at industry level. Two
53In the literature white-collar workers, or the share of total employment devoted to R&D, are usually taken as proxy for the labor’s skill level. The BEA dataset on operations of multinational corporations does not collect data on the composition of the labor force. Accordingly, here the compensation per employee has been taken as reasonable proxy for the labor’s skill level.
54 Per capita values are values per employee.

58
estimations will be run, one for U.S. Parents and the other for U.S. Affiliates. The double
estimation will allow operational differences for the two different MNCs. Surprisingly
using exactly the same specification, the productivity of both U.S. Parents and U.S.
Affiliates is explained up to over 97 percent. This is very surprising given that U.S. Parents
and U.S. Affiliates are structurally very different. Indeed U.S. Parents are “headquarters
companies” while U.S. Affiliates are productive transplants ruled from abroad. Section
2.4.1 shows the results of the productivity equations for both U.S. Parents and U.S.
Affiliates. Then the results of the estimated productivity models will be presented
separately for both U.S. Parents (Section 2.4.2) and U.S. Affiliates (Section 2.4.3).
2.4.1 Plant-level modeling
For both U.S. Parents and U.S. Affiliates, a model very close to that of Van
Biesebroeck has been estimated using the BEA dataset. The regressions contain the values
of R&D expenditures per employee as proxy for Variety, those of Import per employee as
proxy for the opposite of In-sourcing, and those of the constructed Flexibility index. In the
spirit of the LSE approach (Sargan, 2001; Hendry, 2003), each specification has been
constructed by a “two-step” estimation procedure. First an unrestricted model has been
elaborated including all the regressors above and their interaction terms. The U.S. GDP has
been included in both U.S. Parents’ and U.S. Affiliates’ regressions in order to account for
the effect of exogenous economic factors.55 Then a restricted model results from the
elimination of the variables not strictly significant.56 The restricted models exclude the
level of import per employee for U.S. Parents, and the interaction term between R&D and
flexibility for U.S. Affiliates. Therefore the resulting productivity equations are estimated
by LS. The residuals’ graphs of the two restricted models, that is, U.S. Parents (Figures 2.2
and 2.3) and U.S. Affiliates (Figures 2.4 and 2.5) are given below.
55 The GDP of the economy can be taken as representative of economic expansion and increased market demand, that can influence the firms’ adoption decisions in terms of more efficient production technologies.
56 Each model has been tested for autocorrelation and normality of the residuals through the Jarque–Bera Normality test, the Breusch–Godfrey serial correlation LM test, and by the Durbin–Watson (DW) statistics. When the lagged dependent variable is included among the regressors the DW is no more valid. In such cases the normalization of the DW has been used, i.e. the h-test proposed by Durbin (1970). For each unrestricted/restricted pair of models an F-test has been computed to individuate the correct specification. For both kinds of MNCs, the F-test singled out the restricted specifications as the correct model to be estimated.

59
U.S. Parents reach a very good fit (Figure 2.2), except in 1991, 1995, and 2002–
2003, when the residuals lie outside the predefined range. In 1995 and 2002–2003 there is
an under-estimation of the actual data, while in 1991 an over-estimation is presented.
However, the bias is negligible and the model is representative of the actual trend.57
Figure 2.2: U.S. Parents’ productivity: Fitted LS residuals
The productivity equation results (Figure 2.3) show that U.S. Parents’ productivity
is positively but not significantly related to the lag of R&D expenditures per employee, and
to the current values of the flexibility index, statistically significant at 1 percent level.
Positive influence is also from the interaction between lagged R&D per employee and
import per employee, and from the U.S. current GDP, all significant at 1 percent level. On
the other hand, the interaction term between lagged R&D per capita and flexibility enters
the regression with a negative sign. Negative is also the influence of the interaction
between flexibility and import per employee, but it is not statistically significant.
In order to investigate interrelationship between U.S. Parents and U.S. Affiliates
productivity and to account for the spillover mechanism, a Granger causality test has been
conducted. Foreign firms’ productivity has been tested up to three lags. The test failed in
the sense that all the regressors were not statistically significant. For this reason they have
been dropped from the final regression. This suggests that U.S. Parents’ productivity is not
influenced by that of foreign firms and that the spillover mechanism is not at work. The
57 The U.S. Parents’ residuals’ graph apparently suggests autocorrelated residuals, nevertheless the regression has been tested with the Breusch-Godfrey serial correlation test with the inclusion of up to ten lags. The test rejects the hypothesis of autocorrelation.

60
main explanation is that domestic and foreign companies produce different-segment cars,
whose production techniques are likely to differ and to imply different production
processes. Indeed the Big Three’s U.S. production is mainly focused on family-size cars,
while foreign-owned U.S. transplants are the leading producers of small and compact cars.
It has been well recognized that U.S. Parents outsource the production of small cars in their
European affiliates, to be imported and sold under the American brand (Nelson, 1996;
Eden and Molot, 1996; Cooney and Yacobucci, 2005).
Figure 2.3: U.S. Parents’ Productivity Equation: LS results
U.S. Parents’Productivity Equation (LS)
R&D (−1) −2.75 (1.49)
Flexibility 0.128*** (0.037)
R&D (−1) * Flex −0.005** (0.001)
R&D (−1) * Imp 0.148*** (0.03)
Flex * Imp −0.0001* (0.0001)
gdp_us 0.00001* (0.000008)
R2
Adjusted R2 0.992 0.989
Notes: For each variable the estimated coefficient is reported. The respective standard errors are given within brackets. Values are in chained 2005 US dollars. * significant at 10% level ** significant at 5% level *** significant at 1% level
Also for U.S. Affiliates the fit is very good, even if the residuals trend is outside the
range in 1997 and 2005 (Figure 2.4). The peak of 1997 in the U.S. Affiliates’ residuals is
likely due to the strong financial crisis that affected the South East Asian countries, given
that the majority of U.S. Affiliates are from Japanese multinationals.58 An additional
motivation for this abnormal point is the SIC/NAICS shift in the coding system occurred in
1997.
58In 1996 a financial crisis occurred at the world level and it is likely to be shown by data one period later. The 1996 financial crisis started from the South East Asia stock market, that is the Hong Kong Exchanges and Clearing Limited. Accordingly it is likely to interest especially Japanese and Asian automakers.

61
Figure 2.4: U.S. Affiliates’ productivity: Fitted LS residuals
U.S. Affiliates’ productivity (Figure 2.5) is positively influenced by the lag of R&D
expenditures per employee, and by the current levels of import per employee and that of
the interaction term between the flexibility index and import per employee. Negative
influence is from the flexibility index and from the interaction between the lag of R&D
expenditures per employee and import per employee. As in the U.S. Parents’ case, the
interaction term between R&D and Flexibility has been dropped in the first step of the
estimation procedure because it was not significant at all. As for U.S. Parents, also for U.S.
Affiliates, a Granger causality test for productivity has been conducted. The productivity
of U.S. Parents has been included in its current and lagged values. It has been subsequently
dropped because it was not significant in the regression. Also for U.S. Affiliates the
presence of U.S. MNCs is not likely to influence their productivity level excluding any
spillover effect. Strictly positive and significant is the influence of current U.S. GDP,
accounting for exogenous economic factors.

62
Figure 2.5: U.S. Affiliates’ productivity equation: LS results
U.S. Affiliates’Productivity Equation(LS)
R&D (−1) 56.04*** (15.7)
Flexibility −0.09*** (0.028)
Import 1.55*** (0.46)
R&D (−1) * Imp −0.41*** (0.117)
Flex * Imp 0.001*** (0.0002)
GDP_US 0.00005*** (0.00001)
R2 Adjusted R2
0.978 0.971
Notes: For each variable the estimated coefficient is reported. The respective standard errors are given within brackets. Values are in chained 2005 US dollars. * significant at 10% level ** significant at 5% level *** significant at 1% level
Van Biesebroeck allows for endogeneity treating the three activities as endogenous
by instrumenting the regressions as described in Section 2.2.3. Here endogeneity will be
dealt with by constructing a simultaneous equations system. Indeed it is recognized that by
a complete specification it is possible to account for endogeneity (Mullen, 2007). The
system specification will be elaborated by treating all the three phenomena under analysis
as endogenous in addition to productivity. The final models for Variety, Flexibility, and In-
sourcing will still be reached through the LSE approach. As has already been discussed
two systems will be constructed in order to investigate the influence of different firms’
ownership. The systems will be estimated applying Two Stages Least Squares (2SLS) and
Three Stages Least Squares (3SLS), in order to deal with endogeneity and unobservables
bias. The construction of the system will fill the gap of little formal systematic modeling in
the FDI literatures (Ma et al., 2000). As expected 3SLS give standard errors lower than
those by 2SLS, confirming the consistency of the dataset and the models used. Indeed
3SLS estimate the variance-covariance matrix, for which it occurs a given number of data
to be feasible. 3SLS results are very similar to the productivity equations’ results.
Estimated coefficients register the same sign and similar magnitudes. 3SLS results will
follow for U.S. Parents (Section 2.4.2) and U.S. Affiliates (Section 2.4.3).

63
2.4.2 U.S. Parents
As in the productivity equation, U.S. Parents’ productivity (Figure 2.6) is positively
but not significantly related to the lag of R&D expenditures per employee, and to the
current values of the flexibility index, statistically significant at 1 percent level. Positive
influence is also from the interaction between lagged R&D per employee and import per
employee, and from the U.S. current GDP, all significant at 1 percent level. On the other
hand, the interaction term between lagged R&D per employee and flexibility enters the
regression with a negative sign. Negative is also the influence of the interaction between
flexibility and import per employee, but it is not statistically significant.
In light of the analysis of Van Biesebroeck (2007), the R&D expenditures, used
here as a proxy for Variety, and the flexibility index register the opposite sign than in the
plant level analysis. In addition, the coefficient of R&D expenditures is not statistically
significant at standard levels, as in Van Biesebroeck (2007) when treating the three
activities as endogenous. The interaction term between R&D and flexibility is strictly
negative and significant, while in the plant level it was positive but not significant at all.
The interaction between flexibility and import has a negative influence on productivity and
it is not significant at standard levels, while in the plant level study it reduced the
productivity penalties deriving from the single activities. The interaction term between
R&D expenditures (i.e. Variety) and import (i.e. opposite of out-sourcing) enters the
regression with the expected positive sign and it is statistically significant at 1 percent. The
import variable has been dropped from the regression because it was not statistically
significant in the first step of the procedure followed to construct the system. The Granger
causality test failed to show any inter-relationship between U.S. Parents’ and U.S.
Affiliates’ productivity. U.S. Parents’ productivity is not influenced by foreign firms’
productivity and the spillover mechanism is not at work.
U.S. Affiliates’ activity strongly influences the three activities investigated on the
U.S. Parents’ productivity regression. The flexibility index (Figure 2.6) is significantly and
positively affected by the lagged levels of foreigners’ flexibility and productivity, and by
their current capital expenditures. This suggests that domestic companies invest in flexible
technology as a way to respond to foreign competition and expansion, in order to increase

64
their productivity and to react quickly to changes in consumers’ demand.59 Also the
negative influence of U.S. Parents’ productivity on the flexibility index suggests that
investments in flexible technology are aimed at increasing the firms’ productivity levels.
The higher the actual productivity, the lower the investment to increase it in the near
future. The influence of U.S. Parents’ capital expenditures per employee and the lagged
growth rate of the Yen/Dollar exchange rate are also strictly negative.60 The latter suggests
that U.S. Parents’ investment in U.S. plants’ flexibility substitutes for investment in
foreign production facilities. The lagged values of employees’ compensation per employee
and import enter the flexibility regression with a positive and significant sign.
The influence of U.S. Affiliates’ sales and export in the import regression (Figure
2.6) is likely to represent market characteristics. Indeed U.S. Parents focus on the
production of big-size cars and leave the small and compact segment production to their
foreign affiliates, while foreign MNCs mainly produce small and compact vehicles. The
sales of foreign companies enter the import regression with a strictly positive sign,
suggesting that an increase in the foreigners’ sales in the U.S. represents an increase in the
U.S. demand for small and compact cars. Foreign firms’ export registers a negative sign. It
suggests that domestic automakers supply small and compact vehicles in the foreign
countries directly by their foreign affiliates. Given that U.S. Parents produce domestically
big-size cars and import small vehicles from their foreign affiliates, also their current
capital and R&D expenditures per employee, and the lagged levels of sales are negatively
related to import per employee, because they respond to different production. U.S. Parents
lagged flexibility index, productivity, current level of the Dow Jones index, and the U.S.
long-term interest rate, all enter the import regression with a positive coefficient.
U.S. Parents’ R&D expenditures per employee (Figure 2.6) are strongly influenced
by the foreign MNCs’ productivity, R&D, and import. Indeed lagged values of U.S.
Affiliates’ productivity and import both enter the R&D regression with a positive sign, still
suggesting that U.S. consumers are increasingly demanding small and compact cars. In this
line is the negative influence of the U.S. GDP per capita, suggesting that the greater the
59 The U.S. Affiliates’ capital expenditures is taken here as representative of an increase in demand for foreign cars. Given that foreign automakers are specialized in the production of small and compact vehicles, it is likely that an increase in the demand for foreign vehicles is representative of a change in consumers’ preferences toward small and compact cars. 60 Obviously the Yen/Dollar exchange rate growth implies an appreciation of the U.S. Dollar, and a consequent increase in the purchasing power in foreign countries.

65
consumers’ purchasing power, the greater the demand for small and compact cars. On the
other hand the lag of the foreign firms’ R&D registers a negative coefficient. This suggests
that U.S. Parents’ R&D are focused on the development of different products and that they
engage in foreign affiliates’ R&D investment to develop small vehicles. Domestic average
employees’ compensation, productivity, and import from their own foreign affiliates all
enter the R&D regression with a positive and statistically significant sign.

66
Figure 2.6: U.S. Parents’ productivity model: 3SLS results

67
2.4.3 U.S. Affiliates
As in the productivity equation (Figure 2.5), U.S. Affiliates’ productivity (Figure
2.7) is positively influenced by the lag of R&D expenditures per employee, and by the
current levels of import per employee and that of the interaction term between the
flexibility index and import per employee. Negative influence is from the flexibility index
and the interaction between the lag of R&D expenditures per employee and import per
employee. As in the U.S. Parents’ case, the interaction term between R&D and Flexibility
has been dropped in the first step of the estimation procedure because it was not significant
at all. Also a Granger causality test for productivity has been conducted here. The
productivity of U.S. Parents has been included in its current and lagged values. It has been
subsequently dropped because it was not significant in the regression. Also for U.S.
Affiliates the presence of U.S. MNCs is not likely to influence their productivity level
excluding any spillover effect. Strictly positive and significant is the influence of current
U.S. GDP, accounting for exogenous economic factors.
From the results on U.S. Affiliates’ productivity (Figure 2.7) it is possible to infer
conclusions close to those of Van Biesebroeck (2007). Indeed the flexibility index, taken
on its own, has a negative and strictly significant effect on productivity. The import
variable enters the regression with a positive sign. It represents the opposite of the In-
sourcing process, so it has a negative and significant influence on labor productivity as at
the plant level. Also the interaction term between flexibility and import (opposite of In-
sourcing) registers a positive and statistically significant coefficient. On the other hand, the
lagged levels of R&D as proxy for Variety enter the productivity regression with a positive
and significant sign. In the plant-level regression it registered a negative sign but it was not
statistically significant when the three investigated activities were treated as endogenous
all together. Also the interaction between R&D and import is in contrast with the study of
Van Biesebroeck. Here it registers a negative sign, significant at 1 percent level, while in
the microeconomic analysis it was positive and significant at 5 percent level. As before the
Granger causality test for productivity between U.S. Affiliates and U.S. Parents rejects the
hypothesis of any spillover effect between them.
As discussed earlier, the U.S. Affiliates’ Variety, Flexibility, and In-sourcing are
also strongly influenced by the U.S. Parents’ behavior. Indeed the flexibility index of
foreign firms (Figure 2.7) is negatively influenced by the U.S. Parents’ sales and positively
by their lagged R&D per employee. The negative sign of the domestic sales level is due to

68
the different production between U.S. and foreign MNCs. Indeed an increase in U.S.
Parents’ sales suggests an increase in the demand for big cars, which implies a lower
flexibility to differentiate further U.S. Affiliates’ production of small and compact cars.
Strictly negative are the foreigners’ employees’ compensation and productivity lagged one
period. Also the current level of U.S. long-term interest rate enters the flexibility
regression with a negative sign. Positive and statistically significant at 1 percent level are
instead the coefficients of import per employee and total sales with one-period lag. It is
likely that the more the import from the home country, the more the flexibility needed to
assemble different models. In the same direction the more the sales level, the greater the
demand for small vehicles, the more the flexibility required to differentiate products.
U.S. Affiliates’ import per employee (Figure 2.7) is strictly related to U.S. Parents’
current productivity and R&D with one period lag. Negative and significant are the
coefficients of foreign companies’ employees’ compensation, and the lags of both total
export and total sales. It is likely that foreign automakers supply the U.S. market by
enlarging their American facilities and leaving foreign-based plants to serve foreign
countries, as suggested also by the negative sign related to the export level. In this respect
it must be reminded that from the early 1980s foreign MNCs, especially Japanese
companies, have undertaken investments in the U.S. in order to retain their market shares
and to lower their levels of exports to U.S. according to the Voluntary Export Restraints
(VERs) program imposed by the Japanese Ministry of International Trade and Industry
(MITI). The VERs program consisted in a quantitative restriction on Japanese automobile
export toward the U.S. unless the imports were followed up by productive investments in
the U.S. The U.S. Government pressed Japan to impose such restrictions in order to
stimulate U.S. automakers’ competitiveness by relaxing the foreign competition favored by
the high Yen/Dollar exchange rate and the low Japanese production costs. Accordingly
MITI imposed VERs in order to avoid further U.S. actions against Japanese auto imports
(Bhagwaty et al., 1992; Eden and Molot, 1996; Nelson, 1996; Carbaugh, 2002; Cooney
and Yacobucci, 2005). As expected the flexibility index, the productivity and the past level
of R&D, all enter the import regression with a positive sign. It seems that U.S. Affiliates
import basic production to be finished and assembled according to U.S. consumers’
preferences. Positive influence is also from the Dow Jones Industrial Average Index taken
as proxy for an expansion of the U.S. market.

69
U.S. Affiliates’ R&D per employee (Figure 2.7) is positively driven by the lag of
flexibility and total employment, as proxy for firms’ enlargements. Positive is the
influence of the current level of export suggesting a diversification between U.S. and
foreign markets’ demand. As expected, the U.S. Parents’ productivity enters the R&D
regression with a positive sign. R&D is a proxy for models variety. It is likely that an
increase in the productivity of the competitors induces an increase in investments aimed at
supplying a greater variety of models and to adapt the products to the consumers’
preferences. Negative are the sign of import per employee and capital expenditures. Indeed
the more the outsourcing process the less the R&D at home, and the more the investment
in fixed capital, the less the investment in intangible assets. As expected the R&D lagged
one period is negatively related to its current level. The Yen/Dollar exchange rate enters
the R&D regression with a negative sign, given that an appreciation of the dollar implies
lower costs for Japanese imports and services. The negative and statistically significant
coefficient related to the per capita U.S. GDP is puzzling.

70
Figure 2.7: U.S. Affiliates’ productivity model 3SLS results

71
2.5 Conclusions
During the period analyzed, the American Big Three lost their market shares
continuously in favor of foreign competitors, especially from Japan. Foreign firms had a
greater productivity level and they were based on more efficient production techniques
(Chung et al., 2003). Japanese automakers started creating U.S. Affiliates in 1982
(Singleton, 1992; Park, 2003; Chung et al., 2003) developing specific products for the new
American market (Cooney and Yacobucci, 2005). Both U.S. Parents and U.S. Affiliates
showed almost the same productivity level in 1983 and this is the same case in the early
years of foreigners’ U.S. production. From 1989 onwards U.S. Affiliates started raising
their productivity, registering the highest level among all the years under analysis. At the
same time from 1980 and even more from 1994, a great increase in models’ variety
supplied in the market has registered a negative impact on the firms’ productivity (Van
Biesebroeck, 2007). Microeconomic studies showed that productivity is severely affected
by complementarities among organizational design choices.
As in the introduction, the goal of this paper is to see if the results on productivity
in the U.S. auto industry reported in the microeconomic literature (e.g., Van Biesebroeck,
2007) continue to hold when a macroeconomic perspective is used. For the first time a
model very close to that used at plant level by Van Biesebroeck (2007) is estimated using
the dataset from BEA to analyze the impact of product Variety, technological Flexibility
and In-sourcing on firms’ productivity at industry level (Section 2.3). As it is a very
different aggregation level, different proxies are used to account for the three investigated
activities (Section 2.3.2). At the best of our knowledge this is the first attempt in pairing
such different analytical levels. Multinational corporations (MNCs) are distinguished in
U.S.-owned (i.e. U.S. Parents) and foreign-owned companies (i.e. U.S. Affiliates) to see if
they are characterized by a different behavior. First a productivity equation has been
estimated for the two types of multinationals treating all the other variables as exogenous.
Then a simultaneous equations system has been constructed treating as endogenous both
productivity and Variety, Flexibility, and In-sourcing. The system is intended to account
for endogeneity, that is, endogenous adoption decisions of the three organizational
activities (Mullen, 2007). In addition, by the construction of a system it is intended to fill
the gap of formal systematic modeling in the FDI literature (Ma et al., 2000).

72
Specifications of both the productivity equation and the productivity model are very
close to those generally estimated in the microeconomic literature (Section 2.4). Estimation
results show that the microeconomic specification is able to explain more than 97 percent
of the macroeconomic productivity of both U.S. Parents and U.S. Affiliates even if the two
types of MNCs are very different from each other. Indeed U.S. Parents are headquarters
enterprises, while U.S. Affiliates are productive transplants. Nevertheless it is surprising
that both their specifications are exactly the same. The estimated specifications have been
augmented by the inclusion of current and lagged levels of U.S. Affiliates’ productivity for
U.S. Parents, and vice versa for U.S. Affiliates in order to account for the spillovers
mechanism among differently owned companies and to test for Granger causality between
them. Still surprisingly, both U.S. Parents’ as well as U.S. Affiliates’ productivity does not
show any spillover effects between the two types of MNCs. As in the macroeconomic
literature the total sales over total employment ratio is taken as proxy for productivity. As
regards U.S. Parents (Section 2.4.2) the productivity results are different in sign with
respect to the microeconomic analysis. Here, the firms’ productivity is positively
influenced by both Variety, proxied by R&D expenditures, and the Flexibility index,
constructed by the interaction of capital expenditures per employee, and compensation per
employee. These results contrast with the microeconomic analysis, where both Variety and
Flexibility negatively influence the productivity proxy. The interaction between Variety
and Flexibility and between Flexibility and Import exert a negative influence on the
dependent variable still in contrast with the plant-level work. Import per employee is taken
as proxy for outsourcing activities, that is, the opposite of In-sourcing. Therefore, it must
be interpreted with the opposite sign. In the microeconomic analysis In-sourcing enters the
productivity regression with a negative sign, while in the present work it has been dropped
from the productivity specification because it was not statistically significant. On the other
hand, the interaction term between In-sourcing and Variety registers a positive sign as
expected, while that between In-sourcing and Flexibility has a negative sign in contrast
with the microeconomic study. In the case of U.S. Affiliates (Section 2.4.3) macro results
are similar to plant level evidence. Indeed the flexibility index is strictly negative, as also
the in-sourcing proxy. The coefficient of the interaction between flexibility and import is
positive as expected, while that between R&D and import enters the regression with a
negative sign in contrast with the plant-level analysis. The positive sign of the Variety
proxy is still contrasting with the microeconomic study. The interaction term between
Variety and Flexibility has been dropped from the productivity specification because not

73
significant at all. The combined effect on productivity of In-sourcing and Variety is
negative in contrast with the plant-level analysis, while that between In-sourcing and
Flexibility registers the expected positive sign.
Strong spillover effects are suggested from the models used to estimate the three
activities of Variety, Flexibility, and In-sourcing. The significant inter-relationships
between U.S.- and foreign-owned firms are present in both the U.S. Parents’ and U.S.
Affiliates’ regressions. Indeed U.S. Parents’ Import, taken here as proxy for outsourcing, is
positively influenced by the U.S. Affiliates’ lagged sales level, and negatively by the U.S.
Affiliates’ export.61 U.S. Parents’ Flexibility index is positively related to the U.S.
Affiliates’ lagged Flexibility and Productivity levels and by their current capital
expenditures. U.S. companies’ R&D is positively influenced by the foreigners’ lagged
Productivity and imports levels, and negatively by U.S. Affiliates’ lagged R&D.
U.S. Affiliates’ Import is positively related to the U.S. Parents’ lagged R&D
expenditures, and negatively by the U.S. companies’ Productivity proxy. The foreigners’
Flexibility index is positively influenced by U.S. Parents’ R&D, while U.S. Parents’ sales
register a negative sign in the U.S. Affiliates’ Flexibility specification. U.S. Parents’
Productivity one-year lagged influences positively the U.S. Affiliates R&D expenditures.
61 Given the different production of U.S.- and foreign-owned firms, the relationship suggests an increase in U.S. consumer preferences toward small and compact cars.

74
Chapter 3
Towards a Qualitative Meso-economic Analysis:
A Micro-Macro Perspective
Abstract
From the early 1990s stringent environmental regulations induced car manufacturers to develop alternative fuel vehicles. Current macro data relative to U.S. Parents and U.S. Affiliates do not allow distinguishing the portion of R&D expenditures devoted to the development of each technology. In this paper we exploit the micro-evidence on firms’ patenting activity from Oltra and Saint Jean (2009) in order to decompose the macro-data from BEA on aggregated US R&D expenditures of U.S. Parents and U.S. Affiliates by technology. The interval including the real firms R&D strategy at country level will result by accounting for the two principal FDI strategies, i.e. technology-sourcing versus technology-seeking FDI.
To the best of our knowledge this is the first attempt to exploit microeconomic results to improve the macro-perspective on firms’ innovation activity in the U.S. automotive industry. This procedure leads to an innovative and much more integrated analytical level, which can be qualified as a Qualitative Meso-economic perspective. Finally this work improves the research on multinational activity in the U.S. automotive sector by investigating the innovation strategies of the different-owned U.S. MNCs and the aggregated expenditures.
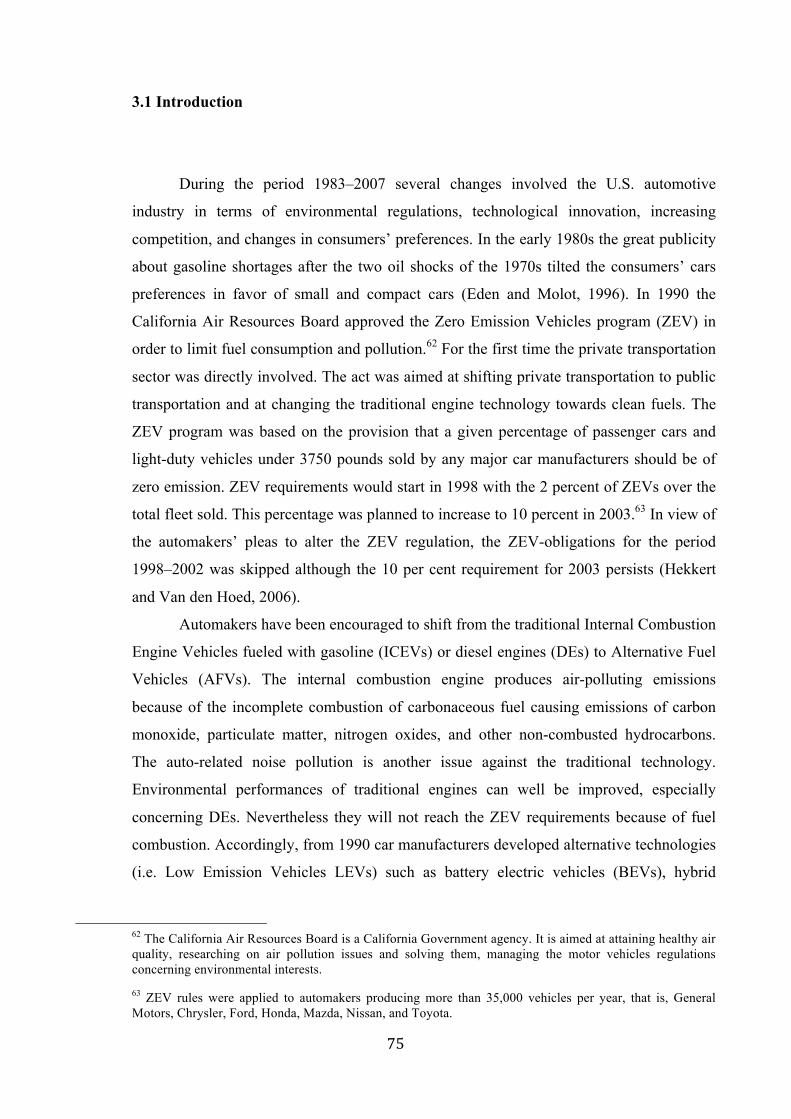
75
3.1 Introduction
During the period 1983–2007 several changes involved the U.S. automotive
industry in terms of environmental regulations, technological innovation, increasing
competition, and changes in consumers’ preferences. In the early 1980s the great publicity
about gasoline shortages after the two oil shocks of the 1970s tilted the consumers’ cars
preferences in favor of small and compact cars (Eden and Molot, 1996). In 1990 the
California Air Resources Board approved the Zero Emission Vehicles program (ZEV) in
order to limit fuel consumption and pollution.62 For the first time the private transportation
sector was directly involved. The act was aimed at shifting private transportation to public
transportation and at changing the traditional engine technology towards clean fuels. The
ZEV program was based on the provision that a given percentage of passenger cars and
light-duty vehicles under 3750 pounds sold by any major car manufacturers should be of
zero emission. ZEV requirements would start in 1998 with the 2 percent of ZEVs over the
total fleet sold. This percentage was planned to increase to 10 percent in 2003.63 In view of
the automakers’ pleas to alter the ZEV regulation, the ZEV-obligations for the period
1998–2002 was skipped although the 10 per cent requirement for 2003 persists (Hekkert
and Van den Hoed, 2006).
Automakers have been encouraged to shift from the traditional Internal Combustion
Engine Vehicles fueled with gasoline (ICEVs) or diesel engines (DEs) to Alternative Fuel
Vehicles (AFVs). The internal combustion engine produces air-polluting emissions
because of the incomplete combustion of carbonaceous fuel causing emissions of carbon
monoxide, particulate matter, nitrogen oxides, and other non-combusted hydrocarbons.
The auto-related noise pollution is another issue against the traditional technology.
Environmental performances of traditional engines can well be improved, especially
concerning DEs. Nevertheless they will not reach the ZEV requirements because of fuel
combustion. Accordingly, from 1990 car manufacturers developed alternative technologies
(i.e. Low Emission Vehicles LEVs) such as battery electric vehicles (BEVs), hybrid
62 The California Air Resources Board is a California Government agency. It is aimed at attaining healthy air quality, researching on air pollution issues and solving them, managing the motor vehicles regulations concerning environmental interests.
63 ZEV rules were applied to automakers producing more than 35,000 vehicles per year, that is, General Motors, Chrysler, Ford, Honda, Mazda, Nissan, and Toyota.

76
vehicles (HVs), and fuel cell vehicles (FCVs) powered by hydrogen. They are all
competing with the traditional ICEVs and DEs.
The ongoing competition among different engine technologies increases the
competition among the firms’ technological innovations. Firms continuously develop
innovative technologies through their R&D centers, whose output is represented by the
firms’ patenting activity. At firm level the direction of firms’ patenting activity in new
technology is increasingly important in order to be competitive in the market. The firms’
R&D expenditures is the main input of their patenting activity (Dodgson and Hinze, 2000).
Indeed there is a strong link between R&D and output innovation (Chen and Mohnen,
2009; Aw and Batra, 1998). At a macroeconomic level, the firms’ R&D expenditures are
the only proxy for technological innovation. In this line it is important to analyze the
direction of the companies’ R&D expenditures by technology in order to find differences
and similarities in their innovation strategies. Accordingly, the present work is aimed at
analyzing for the first time how R&D expenditures are split among the different
technologies in the U.S. automotive industry. It is also investigated how technological
investments of U.S. MNCs differ among different firms’ ownership. It is important to
analyze the firms’ R&D effort in order to infer on the competitiveness and operational
strategies of different firms. Indeed during the period 1995–2005 U.S. automakers lost
around 10 percent of their market shares in favor of foreign competitors. R&D is crucial in
the development of new engine technologies that are responsible for the increasing
competition in the U.S. automotive market. Through interacting micro-level results from
previous research on technological patent applications and macro-level data on R&D
expenditures by U.S. MNCs, the technological specializations of U.S. R&D centers will be
inferred. MNCs will be distinguished between U.S. MNCs, that is U.S. Parents, and U.S.
affiliates of foreign MNCs, that is U.S. Affiliates, in order to investigate the difference in
R&D activity according to different firms’ ownership. The microeconomic results on
patenting activity will be aggregated in order to qualitatively decompose the macro data on
total R&D expenditures of U.S. companies by technology. The aggregated R&D activity
will be split by technology among U.S. Parents and U.S. Affiliates. In the case of U.S.
Affiliates, R&D expenditures will be divided by technologies following the two extreme
hypotheses suggested by the literature on FDI, that is, technology-exploiting FDI versus
technology-sourcing FDI. Finally the macroeconomic dataset will be aggregated again.
The results will infer the technological specialization of U.S. R&D centers at the country
level by accounting for the real firm level strategy.

77
At the best of our knowledge this is the first attempt to integrate data from different
aggregation levels in order to improve the analysis of innovative technologies on a meso-
economic perspective. Indeed micro-level results are exploited here in order to
qualitatively improve the macroeconomic analysis. The disintegration of macro data and
the consequent integration with micro-evidence will result in an innovative, more
integrated, analytical perspective. This procedure can well be qualified as a Qualitative
Meso-economic Analysis.
Section 3.2 shows the main innovations in terms of alternative fuel vehicles. The
development of new technologies increases models variety and competition. Section 3.3
discusses a microeconomic analysis by Oltra and Saint Jean (2009) on automakers’ patent
application for the period 1990–2005. In Section 3.4 data from Oltra and Saint Jean (2009)
are used to deepen the analysis of macroeconomic data on R&D expenditures by
multinationals from the BEA. U.S. Parents’ R&D is split according to the technological
specialization of the U.S. Big Three (Section 3.4.2). U.S. Affiliates’ R&D is divided in two
extreme ways. First, assuming technology-exploiting FDI, R&D is split following the
home-based firms technological specialization (Section 3.4.3.1). Then, in the technology-
sourcing FDI hypothesis, R&D is divided according to the U.S. automakers’ technological
specialization (Section 3.4.3.2). By these two extreme hypotheses U.S. Affiliates’ real
R&D is guessed by computing the interval between the two FDI strategies. Finally the U.S.
R&D expenditures will be split by technology at country-level. The technological
composition of the aggregate figure results by combining the R&D expenditures of U.S.
Parents and U.S. Affiliates split as before. Also the total U.S. R&D expenditures is split by
technology in two extreme ways in order to find the real R&D strategy followed by U.S.-
based firms with no ownership distinction (Section 3.4.4). Conclusions are given in
Section 3.5.
3.2 Technological framework and competition
Traditional and alternative engines compete each other on the strategic agenda of
the leading firms. Each engine has different characteristics, which in turn differ in the use

78
and implementation costs concerning both the demand and supply side of the market.
Technologies are clustered in two groups, that is, traditional technologies, such as gasoline
or diesel ICEVs,64 versus alternative technologies, i.e. EVs, HVs, and FCVs.65
The development of alternative technologies gives rise to competition involving
both car and infrastructure. Competition among different car models is related to technical
issues. That related to infrastructure concerns the organizational complexity of the
innovation, that is required network changes. Changes in technical complexity are divided
among incremental and radical innovations. Organizational innovations are divided into
modular and system innovations.
Incremental innovations refer to small technical changes to the incumbent
technology. Radical innovations are based on changes in technological paradigms to
substitute the incumbent design (Hekkert and Van den Hoed, 2006). In the case of different
engines, a radical innovation implies structural changes in the scientific principles of the
mechanical power train.
From the organizational perspective, an innovation is modular when it does not
imply a radical change in the general framework, that is the fuel supply chain. When the
relationship among the principal actors is affected by many changes, the innovation is
classified as a system innovation. A system innovation implies different fuel production
techniques and distribution networks.
64 The internal combustion engine (ICEV) is the traditional technology powering vehicles. It is distinguished between standard ICEV using gasoline and diesel engine (DE), using diesel fuel. Even if many improvements have been made in order to lower polluting emissions, doubts arise whether it can respect the ongoing environmental regulations on air pollution standards.
65 Electric vehicles are powered by electricity stored in batteries and they do not produce emissions during use. The ZEV program introduced EVs because of their zero emissions features. On the other hand, the batteries needed are very expensive, they have a short lifecycle and a limited storage capacity. Because of their narrow range of use, they are limited to niche market (Oltra and Saint Jean, 2009) and not to be used intensively (Hekker and van den Hoed, 2006)
Hybrid vehicles (HVs) are powered by an internal combustion engine and an electric engine. They are fueled with traditional and alternative fuels. The two engines can be alternatively or simultaneously used to drive the car offering many options of hybrid configuration. HVs can be taken as a transition technology undertaken by automakers as a research platform to develop innovations.
Fuel cell vehicles (FCVs) are driven by an electric engine powered by a fuel cell. When the fuel is hydrogen, the FCV emits only water vapor. When other fuels are used to produce hydrogen, the fuel conversion gives rise to polluting emissions (Frenken et al., 2004). On the other hand, the direct storage of hydrogen requires strong and costly changes in the actual fueling infrastructures.

79
In the automotive industry, the ICEV represents the incumbent technology (i.e.
dominant design) and the reference point. HVs are the most common examples of
incremental and modular innovations. They maintain the conventional principles of the
mechanical power train, integrating the oil engine with an electric propulsion system.
Electricity is generally recovered from braking and stored in a battery. HVs do not require
changes in fuel distribution infrastructures, or fuel production.
The fuel cell technology represents the most radical innovation. It implies the
development of an electrochemical cell in order to convert the chemical energy of a fuel
into electricity. From the organizational point of view it is located among modular and
system innovations depending on the fuel used to generate electricity. When the fuel is
gasoline, no particular network changes are implied. Nevertheless, it is considered to be
fueled only by hydrogen, given that it is dealing with environmental performance.
Hydrogen fueling requires structural changes in both the production and distribution
dimensions of the fuel supply implying a system innovation. It is an example of radical and
system innovation. The fuel cell technology is likely to experience numerous barriers in its
development and marketability given the great changes required in both the technical and
the organizational perspective. At the same time hybrid vehicles will experience much less
barriers given their compatibility with both the traditional technology and the current
infrastructures (Hekker and van den Hoed, 2006).
Fig. 3.1: Innovation characteristics of fuel chains
Note: These characteristics are based on technological changes (incremental→ radical) and network changes (modular→system). Circle sizes indicate carbon emission reduction relative to gasoline ICEV fuel chain (Hekkert and van den Hoed, 2006).
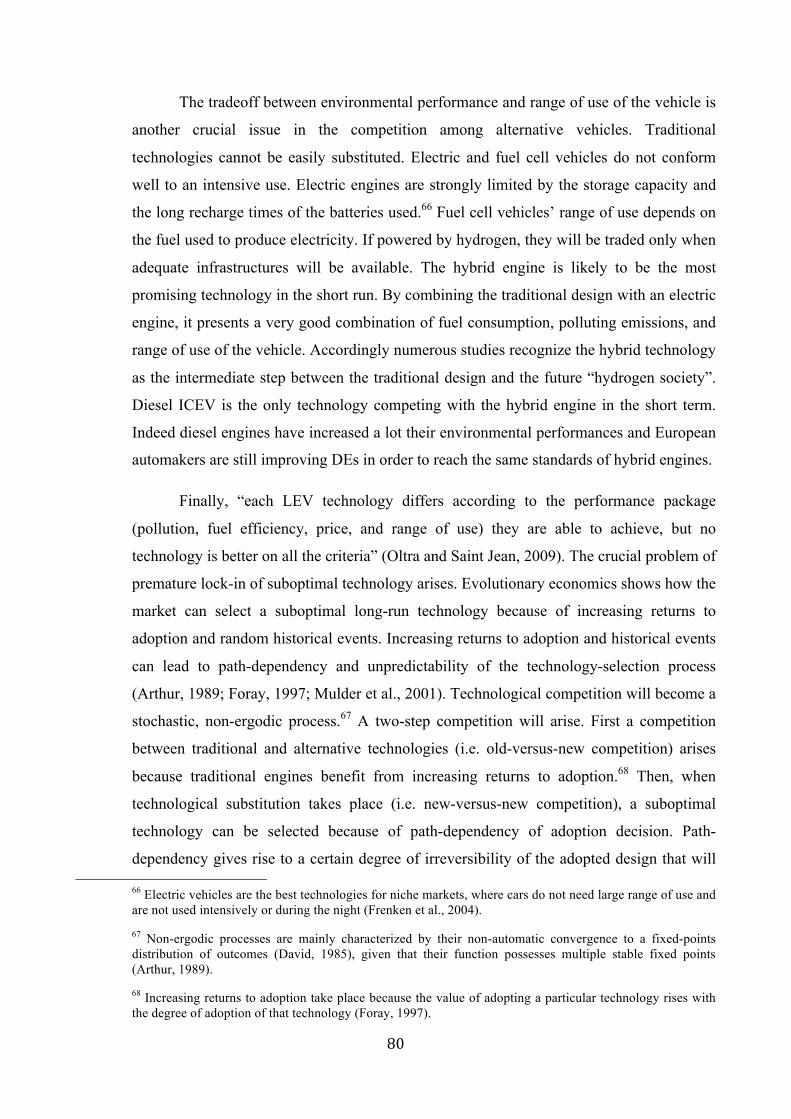
80
The tradeoff between environmental performance and range of use of the vehicle is
another crucial issue in the competition among alternative vehicles. Traditional
technologies cannot be easily substituted. Electric and fuel cell vehicles do not conform
well to an intensive use. Electric engines are strongly limited by the storage capacity and
the long recharge times of the batteries used.66 Fuel cell vehicles’ range of use depends on
the fuel used to produce electricity. If powered by hydrogen, they will be traded only when
adequate infrastructures will be available. The hybrid engine is likely to be the most
promising technology in the short run. By combining the traditional design with an electric
engine, it presents a very good combination of fuel consumption, polluting emissions, and
range of use of the vehicle. Accordingly numerous studies recognize the hybrid technology
as the intermediate step between the traditional design and the future “hydrogen society”.
Diesel ICEV is the only technology competing with the hybrid engine in the short term.
Indeed diesel engines have increased a lot their environmental performances and European
automakers are still improving DEs in order to reach the same standards of hybrid engines.
Finally, “each LEV technology differs according to the performance package
(pollution, fuel efficiency, price, and range of use) they are able to achieve, but no
technology is better on all the criteria” (Oltra and Saint Jean, 2009). The crucial problem of
premature lock-in of suboptimal technology arises. Evolutionary economics shows how the
market can select a suboptimal long-run technology because of increasing returns to
adoption and random historical events. Increasing returns to adoption and historical events
can lead to path-dependency and unpredictability of the technology-selection process
(Arthur, 1989; Foray, 1997; Mulder et al., 2001). Technological competition will become a
stochastic, non-ergodic process.67 A two-step competition will arise. First a competition
between traditional and alternative technologies (i.e. old-versus-new competition) arises
because traditional engines benefit from increasing returns to adoption.68 Then, when
technological substitution takes place (i.e. new-versus-new competition), a suboptimal
technology can be selected because of path-dependency of adoption decision. Path-
dependency gives rise to a certain degree of irreversibility of the adopted design that will
66 Electric vehicles are the best technologies for niche markets, where cars do not need large range of use and are not used intensively or during the night (Frenken et al., 2004).67 Non-ergodic processes are mainly characterized by their non-automatic convergence to a fixed-points distribution of outcomes (David, 1985), given that their function possesses multiple stable fixed points (Arthur, 1989).
68 Increasing returns to adoption take place because the value of adopting a particular technology rises with the degree of adoption of that technology (Foray, 1997).

81
allow a given technology to be locked-in to a technological paradigm (Mulder et al.,
2001).69 High technological variety and organizational competition can avoid the
premature lock-in problem. A high technological variety implies an R&D equally
distributed among the different technologies. The high organizational competition reduces
the risk of technological lock-in within a technology developed by a few dominant actors
(Frenken et al., 2004).
3.3 Patenting activity: A microeconomic analysis
Many studies analyze the development of innovative engine technologies (Frenken
et al., 2004; Hekkert and van den Hoed, 2006; van den Hoed, 2006; Oltra and Saint Jean,
2009). Patents application is usually taken as proxy for innovation activities. The use of
patents application implies a bias because not all patents result in innovation activity, nor
all innovations are patented. In addition, patent activity tends to vary among countries,
given that countries differ in their patent application systems with respect to the degree of
novelty required.70 Nevertheless, patent data is preferred to R&D expenditures to
investigate innovation activity because it represents the output rather than input of the
innovation process (Frenken et al., 2004).
Among the others, Oltra and Saint Jean (2009) make a very important analysis of
car manufacturers’ innovation activity in engines’ technology. Here their work has been
taken as a reference point because of the accuracy and precision of the analysis. The
authors investigate firms’ patenting activity related to new environmental standards in the
automotive industry.71 They collect data on patent applications from 1990 to 2005 from the
69 When the returns increase with the number of adopters of a given design, a little dominance of one technology at the starting point will be self-reinforcing, and the irreversibility problem will arise (Frenken et al., 2004).70 Oltra and Saint Jean (2009) underline that “…national differences exist between patent systems in terms of required degree of novelty and constraint attached to the patent system in its whole… it is less expensive to patent in Japan than in the US or in Europe such that it results an over-representation of Japanese patents.”
71 “Several studies have shown the correlation, if not the causality, between environmental regulation and patenting” (Oltra and Saint Jean, 2009).

82
European network of patent databases based on the European Patent Office (EPO).72 Their
analysis is on patents applied by the 11 major car manufacturers ranked according to the
top sales units in 2002 by the European Commission (European Competitiveness Report,
2004).73 They compare innovation activity among Japanese, American, and European
companies. As countries differ in their environmental standards and patents regulations,
companies located in different countries are expected to vary in their patenting activity. In
addition, a different level of patent applications is likely to reflect a difference in strategies
and relative specialization at the firm level depending on the main characteristics of the
target market. Indeed the American, Japanese, and European automotive markets greatly
differ each other with respect to consumer preferences, fuel costs, and environmental
regulations.
3.3.1 Technology level
The analysis of Oltra and Saint Jean (2009) shows an increasing trend for patents
on traditional technologies in the whole period. They were the leading technologies from
1990 to 2005. For all the 1990s, R&D activities greatly involves also electric engines,
while from the end of the century patents application in hybrid and fuel cell vehicles
register a sharp increase. The hybrid technology is attracting companies’ R&D the most.
Patents applications in fuel cell are the lowest, but they rose sharply after 2002 (Figure
3.2).
The two traditional designs are still attracting the principal innovation effort of the
major car manufacturers as the most promising technologies. This path reflects the
increasing returns to the incumbent design. The traditional technologies present high levels
of environmental innovations, as confirmed by the abstract of the patents applied (Oltra
and Saint Jean, 2009).
72 http://ep.espacenet.com
73 Accordingly Toyota, Honda, Renault, Ford, Nissan, Mitsubishi, Hyundai, General Motors, Peugeot, Daimler-Chrysler, and Volkswagen form the sample.

83
Fig. 3.2: Patents applied by the sample of car manufacturers
Source: Oltra and Saint Jean, 2009
The analysis shows that in the early years, among alternative technologies, electric
engine was the leading design mainly because it is the most feasible green technology in
the short term. Through the spillover mechanism74 the hybrid design was gradually
improved until the shift of the firms’ R&D from electric to hybrid technologies in 2002.75
Indeed the hybrid design is equipped with two different engines and it is likely to fulfill
much larger demand characteristics than electric vehicles. It allows a larger range of use,
lower electricity storage and consequently lower battery costs, shorter recharge time
because of conversion of kinetic energy, and much greater power depending on the
combination of the two subsystems.76 These characteristics allow the hybrid technology to
serve larger markets than electric vehicles, and respecting zero emission regulations for
74 Concerning alternative technologies, Frenken et al. (2004) underline that R&D activity in a technology can produce technological spillovers to another design. More precisely, “when two technologies are technologically interrelated, an adoption of one technology contributes to increasing returns of the other, although to a lesser extent.” Here this mechanism can well be at work given that hybrid vehicles are propelled by two propulsion systems: an internal combustion engine and an electric engine.
75 While this is the trend of the patents activity of the eleven car manufacturers analyzed, the total number of patents applied follows a little different pattern. The total figures show that electric engine is the leading alternative technology from 1990 to 2004. Hybrid patents rise until 1998. During the early years of the new millennium they increased sharply until they caught up with the electric vehicles’ patents in 2005 (Oltra and Saint Jean, 2009). This is an interesting point that shows that patent activity is carried out also from several additional agents as minor car manufacturers, engine producers, federal agencies, university departments and so on, and not just by leading firms. However, the total figures also reflect an increasing role of the hybrid design among the alternative technologies.76 There are two types of hybrid vehicles, that is, serial and parallel. In the first case the car is powered by the electric engine, while in the latter, the two engines work simultaneously delivering more power.

84
short distances.77 Hybrid vehicles are taken as the transition technology between the
traditional design and the fuel cell.
The fuel cell design registered the lowest R&D for the whole period. It represents a
radical and system innovation with respect to the dominant design and the available
infrastructure. Indeed in order to be zero emissions it is fueled with hydrogen. Hence it will
imply great investments on both the technical perspective and the organizational structure,
requiring completely new power train and fuel supply network. The different fuel supply
network required by fuel cell vehicles is the determinant for their development.78 Interest
towards hydrogen vehicles started in 1990 with the ZEV mandate. The regulation was
gradually changed over time because of lobbying by the leading automotive firms, and
consequently the R&D in fuel cell technology remained at low levels. In the new century,
car manufacturers refreshed their interest in fuel cell vehicles because of the approaching
ZEV requirements and because of expectations that an increasing number of countries will
adopt them.79
3.3.2 Firm level
Oltra and Saint Jean (2009) provide the share of patents by technology applied by
each firm (Table 3.1). Toyota is the first mover in both the traditional as well as electric
and hybrid engines. In 1990 Honda invested mainly in gasoline ICEVs and EVs, and then
it moved its R&D towards diesel, fuel cell, and hybrid vehicles during the period analyzed.
The great share of patents held by the two Japanese leaders shows a bias in patenting
activities due to the countries’ difference in patent regulation. “…It is less expensive to
patent in Japan than in the U.S. or in Europe such that it results in an over-representation of
Japanese patents…compared to the European and the U.S. ones” (Oltra and Saint Jean,
77 For a short distance, as it is in the case of urban use, hybrid vehicles can be classified as ZEVs as well as EVs. On the other hand, once outside the ZEV regulation area, they can be powered by the traditional engine guaranteeing standard performances in terms of power and range of use.
78 The present expected value of a new engine technology is dependent upon the availability of the specific infrastructure (David, 1985).79 David (1985) stated: “intuitions suggest that if choices were made in a forward-looking way, rather than myopically on the basis of comparisons among the currently prevailing costs of different systems, the final outcome could be influenced strongly by expectations.” In this line, expectations on worldwide regulations towards ZEV standards can strongly influence the sharp increase in FCV patent applications of the main car manufacturers after 2002.

85
2009). Because of this bias, the patents portfolio of each company is separately analyzed
by computing an index of technological specialization.
Table 3.1: Share of patents applied by each car manufacturer by technology, selected years
Source: Oltra and Saint Jean, 2009
General Motors and Renault are relatively specialized in fuel cell technology, while
Hyundai, Mitsubishi, and PSA direct their R&D expenditures mostly towards traditional
diesel engine. Traditional gasoline is strongly supported by Volkswagen, Daimler-
Chrysler, Renault and Ford, while Japanese firms are likely to be the most involved in EVs
and HVs, with the exception of Nissan that strongly supports also the fuel cell engine. The
specialization index shows that Toyota holds a balanced patent portfolio, while General
Motors is highly specialized on fuel cell vehicles, trading its products mainly in the U.S.,
where ZEV regulations are binding.
In conclusion, the traditional designs are still under improvement, as more than 50
percent of the patent portfolios are on traditional technologies. This confirms that
increasing returns to adoption make it hard to substitute the dominant design with an
alternative technology. Second, almost all car manufacturers direct R&D to develop
alternative technologies. HVs and FCVs are likely to be the most promising of these.
Electric vehicles lost their initial importance on companies’ patents portfolios as their
advantages are exploited mainly in niche markets. Finally, among the three alternative
engines, hybrid designs seem to be preferred over fuel cell ones by large car
manufacturers. Indeed HVs imply much less radical innovations than FCVs. The hybrid
technology does not imply a system innovation as fuel cell technology does. It does not
require fundamental changes in fuel supply and it can achieve strict environmental

86
regulations for a limited range of use. This makes the hybrid design as the most promising
technology in the short and medium term.
3.4 Micro and macro interaction: Toward a qualitative meso-economic analysis
From 1990 to 2005 in the motor vehicles sector U.S. Parents lost about 13 percent
of their market power in favor of their foreign-owned competitors. The ongoing
globalization process allows a growing presence of foreign competitors and several
changes in the production chain. New production techniques, operational strategies, and
relocations of production strongly impact the supply side. On the other hand, the demand
side is changing according to new consumer preferences, different use of vehicles,
different costs, new technologies, improved safety devices, and more and more strict
environmental regulations. R&D and technology innovations are the main drivers of firms’
competitiveness. To the best of our knowledge it is for the first time that the number of car
manufacturers’ patent applications is being integrated with macro-data on R&D
expenditures of U.S. MNCs. The goal is to match micro and macro analysis to qualitatively
differentiate R&D expenditures by technology between U.S. Parents and U.S. Affiliates.
Discussion of R&D patterns will result in important considerations on U.S. firms’
strategies.
Economic theory suggests that MNCs diversify their production and distribution
according to the relative advantage of the reference country and with the different demand
characteristics of the target markets. By analyzing the worldwide patenting activity it is not
possible to infer whether firms follow different R&D strategies in different countries.
Micro-level analyses investigate how firms’ spread their innovation effort among the
different designs by reporting the number of patents by technology applied by each firm all
over the world. On the other hand these analyses do not investigate whether firms diversify
their technological specialization in different countries as suggested by literature on
MNCs. Accordingly, the focus here is on the different technological specialization of
automakers in the U.S. Following sections are arranged thus: data used and the rationale of
the analysis will be discussed in Section 3.4.1. Then intuitive results on R&D expenditures

87
of U.S. Parents and U.S. Affiliates will be presented. It is assumed that U.S. Parents invest
in R&D following their technological specialization (Section 3.4.2). As regards U.S.
Affiliates, two alternative scenarios will be assumed. The first hypothesis is that U.S.
Affiliates’ R&D is split among different technologies following the technological
specialization of the foreign headquarters (Section 3.4.3.1). Under this assumption foreign
MNCs will exploit their R&D advantages in the U.S. market through their U.S. Affiliates
(i.e. technology-exploiting FDI). The second hypothesis is that U.S. Affiliates invest in
R&D following U.S. Parents’ technological specialization. In this case foreign MNCs
undertake technology-seeking FDI into U.S. to draw advantages from the American
leading technology (Section 3.4.3.2). Once the macroeconomic perspective is disintegrated
and qualitatively improved with microeconomic results, data on U.S. R&D expenditures
will be aggregated again. The U.S. firms’ technological specialization will be drawn at the
country level through the firm-level integration. The two hypotheses will allow find an
interval containing the real composition of R&D expenditures (Section 3.4.4).
3.4.1 Data and methodology
Worldwide patents application activity of the major car manufacturers is analyzed
in the previous study.80 Data on patents application are from Figure 3.2 (Oltra and Saint
Jean, 2009). The share of patents by technology applied by each car manufacturer is
available from Table 3.1 (Oltra and Saint Jean, 2009). Table 3.1 presents data at five-year
intervals. Here firms are assumed to follow a linear trend in the five-year intervals. Hence
the linear trend has been computed for the time intervals 1990–1995, 1995–2000, and
2000–2005 (Table A.1). The interaction between Figure 3.2 and Table A.1 will result in
the number of patents applied by each car manufacturer by technology and the total
number of patents applied by each automaker (Tables A.2 and A.3). Data on R&D
expenditures of U.S. MNCs are from BEA database.81 Data collected by BEA are
distinguished between U.S. Parents and U.S. Affiliates.82
80 The sample is formed by the eleven major car manufacturers according to the top sales ranking in output units in 2002 by the European Commission. Hence the sample includes Toyota, Honda, Renault, Ford, Nissan, Mitsubishi, Hyundai, General Motors, Peugeot, Daimler-Chrysler, and Volkswagen.81 Data are from the International Account, Section “Operations of Multinational Corporations” at: http://www.bea.gov. R&D expenditures are defined by BEA as “expenditures for the following: (1) the planned systematic pursuit of new knowledge or understanding toward general application (basic research); (2) the acquisition of knowledge or understanding to meet a specific, recognized need (applied research); and

88
3.4.2 U.S. Parents
The annual reports of General Motors Company and Ford Motor Company provide
statistics on U.S. Combined Cars and Trucks Market Shares.83 From 1990 to 1995 Ford,
General Motors, and Chrysler jointly account for 99.3 percent of the total U.S. car
manufacturers.84 From 1995 onwards Ford, General Motors, and Daimler-Chrysler85 are
the only U.S. companies reported.86 Accordingly they are taken as representative of U.S.
Parent companies.
Theory suggests that a country’s comparative advantage depends on its relative
factors endowment. It is assumed here that firms are “skilled” in the technology the most
advanced in the home country and the most applied to goods traded in the home market.
MNCs will develop in the home R&D centers the most improved technology in the home
country and the most promising for the nearest markets, leaving foreign R&D centers to
develop the most improved and applied technology in the foreign country/market. Then
U.S. Parents’ R&D expenditures are split according to the technological specialization of
Ford, General Motors, and Daimler-Chrysler.
Figure 3.3 shows that in the 1990s U.S. car manufacturers focused their R&D on
the traditional technologies. From 2001 onwards investments in alternative designs register
a sharp increase until they caught up with expenditures on the traditional gasoline design.
(3) the application of knowledge or understanding toward the production or improvement of a product, service, process, or method (development). It excludes quality control, routine product testing, market research, sales promotion, sales service, and other non-technical activity; routine technical services; and research in the social sciences or psychology.
82 BEA defines a “U.S. parent company” as “the person, resident in the United States, that owns or controls 10 percent or more of the voting securities of an incorporated foreign business enterprise or an equivalent interest in an unincorporated foreign business enterprise”. Note that A U.S. parent comprises the domestic operations of a U.S. multinational company. A “U.S. affiliate” is defined as a “U.S. business enterprise in which a single foreign person owns or controls, directly or indirectly, 10 percent or more of the voting securities if the enterprise is incorporated or an equivalent interest if the enterprise is unincorporated.”
83 Annual reports of General Motors and Ford Motor Company are available from the SEC Edgar website of the U.S. Securities and Exchange Commission available at http://www.sec.gov/edgar.shtml.
84 For this period the statistics provide data for Ford, General Motors, Chrysler, Navistar, total U.S. manufacturers, Japanese, and all other foreign-based manufacturers.85 As reported, “Chrysler and Daimler-Benz merged in late 1998. The figures shown combine Chrysler and Daimler-Benz on a pro-forma basis for the periods prior to their merger.”
86 For this period statistics provide data for Ford, General Motors, and Daimler-Chrysler.
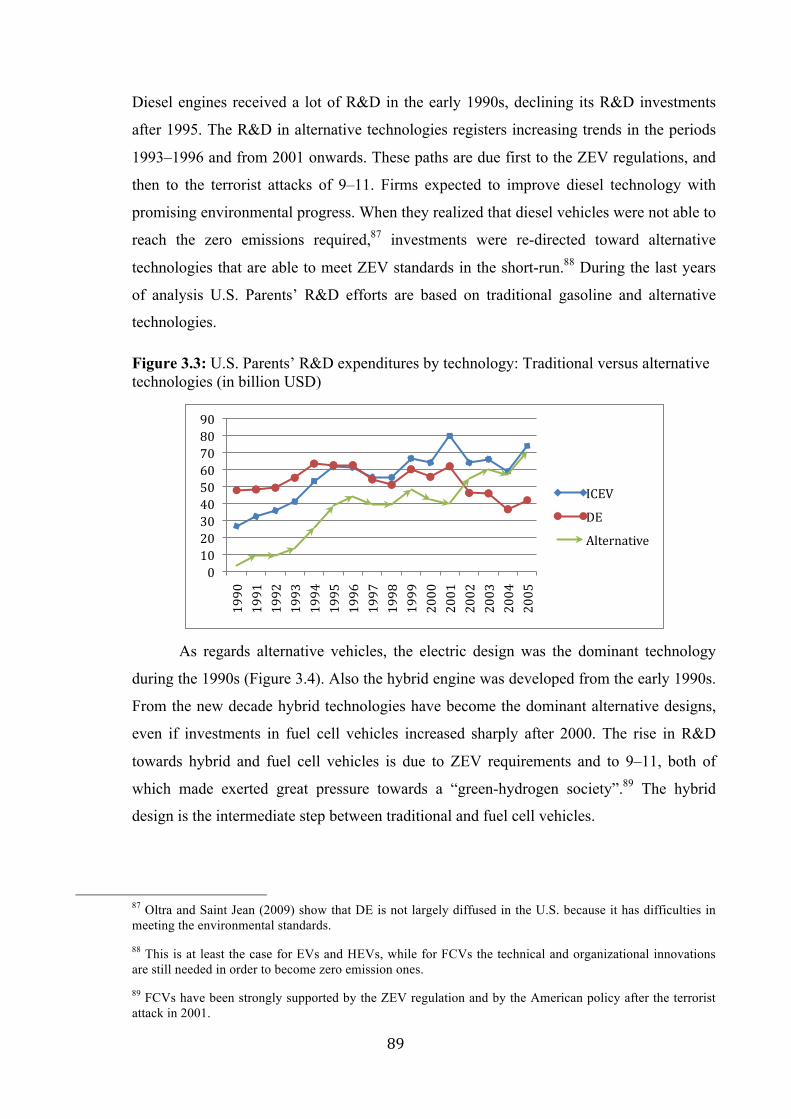
89
Diesel engines received a lot of R&D in the early 1990s, declining its R&D investments
after 1995. The R&D in alternative technologies registers increasing trends in the periods
1993–1996 and from 2001 onwards. These paths are due first to the ZEV regulations, and
then to the terrorist attacks of 9–11. Firms expected to improve diesel technology with
promising environmental progress. When they realized that diesel vehicles were not able to
reach the zero emissions required,87 investments were re-directed toward alternative
technologies that are able to meet ZEV standards in the short-run.88 During the last years
of analysis U.S. Parents’ R&D efforts are based on traditional gasoline and alternative
technologies.
Figure 3.3: U.S. Parents’ R&D expenditures by technology: Traditional versus alternative technologies (in billion USD)
As regards alternative vehicles, the electric design was the dominant technology
during the 1990s (Figure 3.4). Also the hybrid engine was developed from the early 1990s.
From the new decade hybrid technologies have become the dominant alternative designs,
even if investments in fuel cell vehicles increased sharply after 2000. The rise in R&D
towards hybrid and fuel cell vehicles is due to ZEV requirements and to 9–11, both of
which made exerted great pressure towards a “green-hydrogen society”.89 The hybrid
design is the intermediate step between traditional and fuel cell vehicles.
87 Oltra and Saint Jean (2009) show that DE is not largely diffused in the U.S. because it has difficulties in meeting the environmental standards.88 This is at least the case for EVs and HEVs, while for FCVs the technical and organizational innovations are still needed in order to become zero emission ones.
89 FCVs have been strongly supported by the ZEV regulation and by the American policy after the terrorist attack in 2001.
0102030405060708090
1990
1991
1992
1993
1994
1995
1996
1997
1998
1999
2000
2001
2002
2003
2004
2005
ICEV
DE
Alternative

90
Figure 3.4: U.S. Parents’ R&D expenditures by technology: Alternative technologies (billion USD)
3.4.3 U.S. Affiliates
In the literature many authors investigate whether an MNC undertakes FDI to
exploit its ownership-specific advantages or to benefit from the relative specialization of
the target country. An MNC invests abroad to exploit its technological superiority or to
profit from the technological leadership of the reference country. In the microeconomic
analysis the locations of patents applications are not investigated. Two alternative
scenarios will be discussed in order to construct an interval to include the real values of
MNCs’ R&D expenditures in the U.S.
First, in the technology-exploiting FDI hypothesis, U.S. Affiliates’ R&D
expenditures are divided by technologies according to the technological specialization of
non-American car manufacturers.90 Here, U.S. Affiliates will perform R&D activities to
refine the most developed technology in the home country. The R&D efforts will be aimed
at fitting foreign consumer preferences and meeting the regulations of the target country.
Second, U.S. Affiliates will invest in the most developed technology in the country where
they are located (i.e. technology-seeking FDI [Barba Navaretti and Venables, 2004]). U.S.
Affiliates’ R&D expenditures are split by technology according to the U.S. Parents’
technological specialization.
90 Given that it is not possible here to distinguish among firms because of data availability, the sample is divided between U.S. and non-U.S. firms. As Ford, General Motors, and Daimler-Chrysler are demonstrated to account for 99.3 percent of U.S. Parents, U.S. Affiliates are reasonably taken as affiliates of the remaining firms of the sample. This is in line with Oltra and Saint Jean (2009), which states that the eleven car manufacturers in the sample are selected according to the top sales ranking in output units in 2002 from the European Commission.
0510152025303540
1990
1991
1992
1993
1994
1995
1996
1997
1998
1999
2000
2001
2002
2003
2004
2005
FCV
HV
EV

91
The R&D expenditures of U.S. Affiliate companies will be divided in two extreme
ways using the two hypotheses in order to find an interval including the real FDI strategy.
Obviously the hypotheses imply a great level of generalization on the firms’ R&D
strategies. In addition, the analysis has the same limitations as reported by Oltra and Saint
Jean (2009), given that the data used are from their work. Nevertheless the procedure is
very important from an analytical point of view because it allows deepening the analysis of
macro data in a qualitative way by exploiting micro level results, leading to an innovative,
more integrated perspective. To the best of our knowledge this is the first attempt in
matching micro and macro data toward a new level of analysis. This procedure can well be
qualified as a Qualitative Meso-economic Analysis deriving from the micro–macro
integration. The results of the two hypotheses are the following.
3.4.3.1 First hypothesis: U.S. Affiliates’ R&D expenditures as technology-exploiting
FDI
MNCs undertake technology-exploiting FDI into the United States. U.S. Affiliates
will perform R&D activities in the most developed technologies in the home country
following their home technological specialization. U.S. R&D will be aimed at improving
specific features to fit at best U.S. consumers’ preferences and market regulations.
As seen from Oltra and Saint Jean (2009), non-U.S. automakers’ R&D activities are
greatly based on diesel technologies because of a relative “diesel-specialization” of
European firms. Japanese firms are, instead, the first mover on alternative designs,
especially in electric and hybrid vehicles.
Minor R&D effort is devoted to standard gasoline engine. From 2001 onwards,
alternative vehicles attract the most R&D efforts. This trend is in line with the European
and Japanese specializations and with the shift towards alternative engine at the end of the
1990s (Figure 3.5).
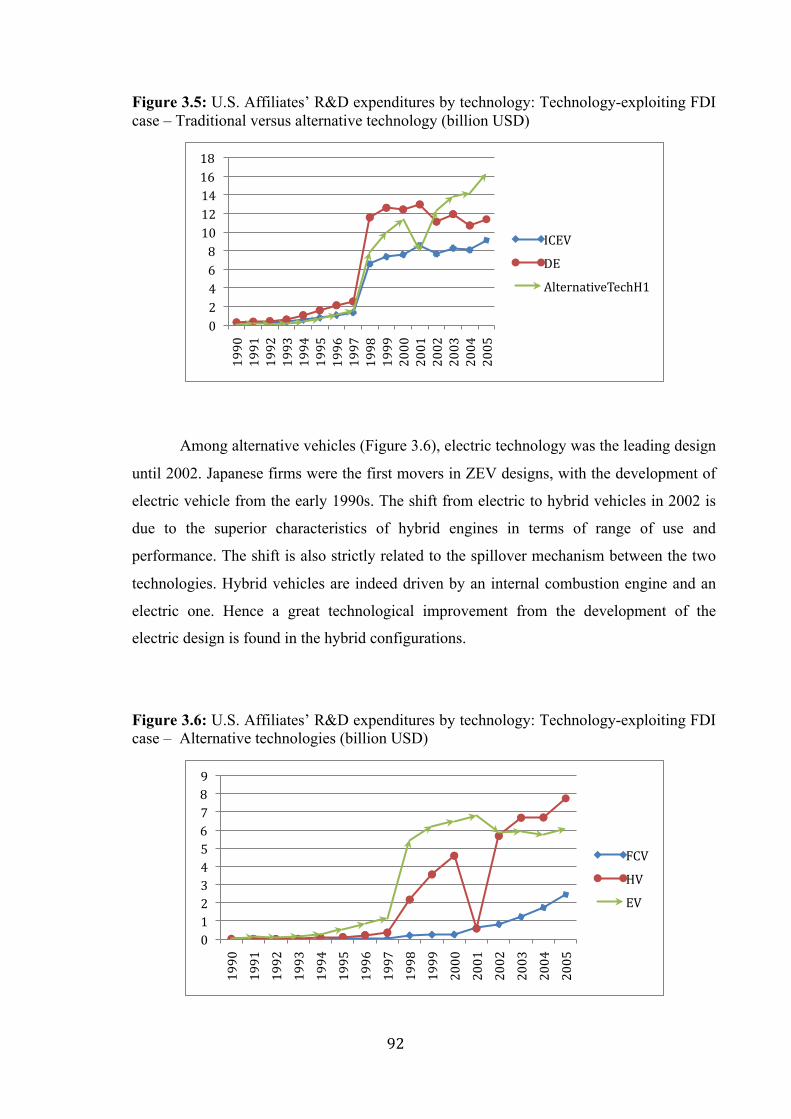
92
Figure 3.5: U.S. Affiliates’ R&D expenditures by technology: Technology-exploiting FDI case – Traditional versus alternative technology (billion USD)
Among alternative vehicles (Figure 3.6), electric technology was the leading design
until 2002. Japanese firms were the first movers in ZEV designs, with the development of
electric vehicle from the early 1990s. The shift from electric to hybrid vehicles in 2002 is
due to the superior characteristics of hybrid engines in terms of range of use and
performance. The shift is also strictly related to the spillover mechanism between the two
technologies. Hybrid vehicles are indeed driven by an internal combustion engine and an
electric one. Hence a great technological improvement from the development of the
electric design is found in the hybrid configurations.
Figure 3.6: U.S. Affiliates’ R&D expenditures by technology: Technology-exploiting FDI case – Alternative technologies (billion USD)
024681012141618
1990
1991
1992
1993
1994
1995
1996
1997
1998
1999
2000
2001
2002
2003
2004
2005
ICEV
DE
AlternativeTechH1
0123456789
1990
1991
1992
1993
1994
1995
1996
1997
1998
1999
2000
2001
2002
2003
2004
2005
FCV
HV
EV

93
3.4.3.2 Second hypothesis: U.S. Affiliates’ R&D expenditures as technology-sourcing
FDI
“Technology sourcing would be a motive for FDI if the firm invests abroad in order
to get access of foreign technologies. There are different ways a firm could source foreign
technology through a foreign affiliate…(one way) would be to directly acquire a foreign
firm with advanced technology, in which case knowledge only had to be transferred within
the firm” (Barba Navaretti and Venables, 2004).91 The U.S. is a capital-intensive country
and it is among the leader countries on advanced technology. U.S. Affiliates are involved
here in R&D activities according to the most developed technologies in U.S. In this line
U.S. Affiliates’ R&D expenditures is split among the different technologies as in the case
of U.S. Parents.
Figure 3.7 shows the patterns of R&D expenditures in the two traditional designs
and alternative technologies. As for U.S. Parents, the two traditional engines strongly
dominate the automakers’ innovative effort until 2001, when the approaching of ZEV
mandate and the 9–11 terrorist attack induces a shift in R&D towards alternative engines.
From 2001 onwards, alternative technologies sharply improved until they caught up with
the R&D expenditures in the gasoline internal combustion engine. However, the traditional
engine still attracts firms’ R&D the most.
Figure 3.7: U.S. Affiliates’ R&D expenditures: Technology seeking FDI case – Traditional versus alternative technologies (billion USD)
91 Evidence of the positive impact of R&D intensity in the host country in attracting FDI is taken from Kogut and Chang (1991) in the case of Japanese FDI in the U.S., and from Neven and Siotis (1995) in the case of Japanese and U.S. FDI towards EU.
0246810121416
1990
1991
1992
1993
1994
1995
1996
1997
1998
1999
2000
2001
2002
2003
2004
2005
ICEV
DE
AlternativeTechH2

94
Among alternative engines (Figure 3.8) hybrid and electric vehicles followed
almost the same trend until 1999. From 1998 onwards the firms’ R&D expenditures were
increasingly focused on fuel cell technology until those reached the same level as electric
engines in 2004. Hybrid technology R&D has been growing until the end of the period
analyzed. This stands for the fact that hybrid engines are taken as the most promising
technology in the short run. Indeed hybrid vehicles are able to satisfy both consumers’
utility (in terms of costs, range of use, and fuel supply) and environmental regulations,
given that when powered by electricity they become zero emission vehicles.
Figure 3.8: U.S. Affiliates’ R&D expenditures: Technology seeking FDI case – Alternative technologies (billion USD)
3.4.3.3 The interval of R&D FDI
The interval including the real U.S. Affiliates’ R&D expenditures will be discussed
here (Figures 3.9 and 3.10) pairing the results under the two hypotheses discussed earlier.92
H1 is the hypothesis in which U.S. Affiliates invest in R&D to exploit their ownership-
specific advantages. In this case U.S. Affiliates’ R&D is split according to the
technological composition of the non-American automakers. Under H2, i.e. technology-
92 The R&D expenditures of U.S. Affiliates and U.S. Parents differ very much in their magnitudes. Therefore, matching the R&D expenditures of the two types of firms does not give intuitive insights. In this line only the R&D expenditures of U.S. Affiliates is reported here. By depicting the two hypotheses, the figures will allow differentiating the strategies of U.S. Affiliates and U.S. Parents. It is possible to pair the paths of R&D expenditures between U.S. Parents and U.S. Affiliates by computing their growth rates. Growth rates of R&D expenditures by technologies are reported in Figures A.1 and A.2. It can be seen from the figures that U.S. Affiliates register growth rates greater than U.S. Parents for almost the whole period in traditional technologies both in the first as well as in the second FDI hypothesis. As regards alternative vehicles, U.S. Parents registered the lowest R&D growth rates from 1995 to 2001. After 2002 both types of MNCs follow similar trends.
012345678
1990
1991
1992
1993
1994
1995
1996
1997
1998
1999
2000
2001
2002
2003
2004
2005
FCV
HV
EV

95
sourcing FDI, U.S. Affiliates’ R&D expenditures are divided by technology according to
the American automakers’ specialization.
In the case of traditional designs both the American and non-American car
manufacturers had almost the same technological specialization until 1998. From 1998
onwards U.S. car manufacturers specialized in traditional technologies more than non-
American car manufactures. This can be seen from Figure 3.9, where the red line stands
for the U.S. Affiliates’ R&D expenditures under the technology-sourcing FDI hypothesis
and the blue line for the U.S. Affiliates’ R&D expenditures under the technology-
exploiting hypothesis. This trend is mainly due to the investments of U.S. firms in the
traditional gasoline ICEVs (Oltra and Saint Jean, 2009).
Figure 3.9: Interval for U.S. Affiliates’ R&D expenditures: Technology-exploiting versus technology-sourcing FDI – Traditional technologies
In the case of alternative technologies, automakers followed similar technological
specializations until 1997. From 1998 onwards, U.S. Affiliates’ R&D expenditures under
the first hypothesis is directed towards improvement of alternative technologies more than
under the other hypothesis (technology-sourcing FDI). This pattern is due to strong
technological specializations of Japanese and European firms in electric and hybrid
vehicles (Figure 3.10).
0
5
10
15
20
25
1990
1991
1992
1993
1994
1995
1996
1997
1998
1999
2000
2001
2002
2003
2004
2005
TraditionalH1
TraditionalH2

96
Figure 3.10: Interval for U.S. Affiliates’ R&D expenditures: Technology-exploiting versus technology-sourcing FDI – Alternative technologies
Figures 3.9 and 3.10 show the constructed interval including the real U.S.
Affiliates’ R&D expenditures by technology. Firms’ technological specializations followed
similar patterns until 1997 in both the traditional as well as alternative technologies. After
1998, non-American car manufacturers increased their investments in alternative
technologies. At the same time U.S. firms continued to improve traditional engines.
Among alternative vehicles, U.S. firms’ R&D was mainly aimed at developing fuel cell
engines according to ZEV requirements. Indeed ZEV requirements strongly support the
improvement of hydrogen-fueled engines as the most promising zero emission vehicles.
Fuel cell vehicles are still limited because of the non-availability of hydrogen’s
infrastructures. On the other hand, non-U.S. firms were the first movers in developing
electric and hybrid vehicles. The first movers’ advantage allows developing such
alternative technologies as intermediate step between traditional and fuel cell vehicles. In
addition, hybrid vehicles are also the most promising option in the short run. This fact
induces Japanese automakers pursuing the improvement of such alternative vehicles.
3.4.4 Macroeconomic integration: Country-level evidence
Finally it is possible to differentiate the patterns of aggregate U.S. R&D
expenditures separated by technology. Here the technological composition of the aggregate
figure results by combining the R&D expenditures of U.S. Parents and U.S. Affiliates split
as in the previous sections. The data aggregation will consider the two hypotheses used to
024681012141618
1990
1991
1992
1993
1994
1995
1996
1997
1998
1999
2000
2001
2002
2003
2004
2005
AlternativeTechH1
AlternativeTechH2

97
decompose the U.S. Affiliates’ R&D activity according to the tradeoff within technology-
exploiting and technology-sourcing FDI. In this way the total U.S. R&D expenditures will
also be split by technology in two extreme ways in order to find the real R&D strategy
followed by U.S.-based firms with no ownership distinction.
The macro-data integration is the final and most important result of the analysis. In
the previous sections the micro results on patenting activity have been aggregated in order
to qualitatively decompose the macro data on total R&D expenditures of U.S. companies.
The aggregated R&D activity has been split by technology in order to account for different
strategies of foreign-owned U.S. Affiliates. Finally it is possible to aggregate the
macroeconomic data resulting from the qualitative analysis. The integration of the
resulting data will lead to a more accurate macroeconomic perspective. To the best of our
knowledge this conclusion is very important because it allows differentiating car
manufacturers’ technological specialization in the U.S. at the country level by accounting
for the real strategy followed at the firm level. Sections 3.4.4.1 and 3.4.4.2 will show the
macro-level aggregation accounting for the two hypotheses on U.S. Affiliates’ R&D path
as in Section 3.4.3.2.
3.4.4.1 First hypothesis: U.S. Affiliates’ R&D expenditures as technology-exploiting
FDI: Aggregated perspective
As in Section 3.4.3.1, in the first hypothesis foreign MNCs undertake technology-
exploiting FDI into the United States. U.S. Affiliates will perform R&D activities in the
technologies already developed in the home country following their home technological
specialization. U.S. foreign-owned R&D centers are aimed at improving specific features
to fit at best U.S. consumers’ preferences and market regulations (Figures 3.11 and 3.12).
The relative technological specialization of non-American car manufacturers emphasizes
the importance of traditional diesel, electric, and hybrid technologies while lowering that
of traditional gasoline design.93
93 European firms are relatively specialized in DE because of the large diesel market in the European countries. At the same time Japanese firms are likely to be the first mover in LEV technologies, especially as regards EV and HV. ICEV design attracts less R&D among the standard technologies in the non-US firms patenting activity (Oltra and Saint jean, 2009).

98
Figure 3.11: Aggregated R&D expenditures by technology: Traditional versus alternative technologies – Technology-exploiting FDI hypothesis
Figure 3.11 shows that the influence of U.S. Affiliates implies a great increase of
R&D on alternative technologies in the last years of the analysis. Here the R&D
expenditures on alternative vehicles catch up with those in traditional designs. From 2001
onwards the diesel engine is the technology attracting the lowest share of R&D.
Figure 3.12: Aggregated R&D expenditures by technology: Alternative technologies – Technology-exploiting FDI hypothesis
Figure 3.12 shows the case of alternative technologies. Here the presence of U.S.
Affiliates under the first hypothesis leads to an increased role of EVs. Also the R&D
expenditures in hybrid design increases because of the shift in R&D from EVs to HVs in
2001 by both U.S. and non-U.S. car manufacturers.
0
20
40
60
80
100
1990
1991
1992
1993
1994
1995
1996
1997
1998
1999
2000
2001
2002
2003
2004
2005
ICEV
DE
AlternativeH1
05101520253035404550
1990
1991
1992
1993
1994
1995
1996
1997
1998
1999
2000
2001
2002
2003
2004
2005
FCV
HV
EV

99
3.4.4.2 Second hypothesis: U.S. Affiliates R&D expenditures as technology-sourcing
FDI: Aggregated perspective
As in Section 3.4.3.2, under the second hypothesis foreign-owned U.S. Affiliates
are involved in R&D activities according to the U.S. Parents’ technological specialization.
In this line U.S. Affiliates’ R&D expenditures are split by technologies as for U.S. Parents.
The U.S. Affiliates will benefit from the technological leadership of the U.S. automakers in
the traditional gasoline and fuel cell technologies. That is done in order to serve the U.S.
market in line with consumer preferences and to transfer leading technologies through the
multinational channel.
In the case of traditional versus alternative technologies (Figure 3.13), the trends of
U.S. Parents is shifted upward by the R&D expenditures of U.S. Affiliates, which follow
here the same technological specialization. From 1990 to 1995 R&D expenditures were
mainly devoted to develop diesel engines. The approaching of ZEV requirements induces
the shift from traditional diesel to traditional gasoline and alternative technologies.
Traditional gasoline vehicles are still in progress in the car manufacturers’ agenda to lower
their environmental emissions. The sharp rise in alternative designs after 2001 is due to the
2003 term of the Californian ZEV program.
Figure 3.13: Aggregated R&D expenditures by technology: Traditional versus alternative technologies – Technology-sourcing FDI hypothesis
Figure 3.14 shows the aggregated U.S. R&D expenditures by alternative
technologies under the hypothesis of technology-sourcing FDI. R&D expenditures in fuel
0102030405060708090100
1990
1991
1992
1993
1994
1995
1996
1997
1998
1999
2000
2001
2002
2003
2004
2005
ICEV
DE
AlternativeH2

100
cell vehicles follow a continuous growing trend, while after 2001 investments have been
mainly devoted to improve the hybrid technologies. Indeed hybrid vehicles are likely to be
the most promising ZEV designs in the short-term (Oltra and Saint Jean, 2009).
Figure 3.14: Aggregated R&D expenditures by technology: Alternative technologies – Technology-sourcing FDI hypothesis
Figures 3.15 and 3.16 show the constructed interval for U.S. MNCs’ R&D
expenditures by technology at the country-level. As stated earlier, U.S. and foreign MNCs
followed the same pattern until 1998. From 1998 to 2005 a little difference arose in
technological specialization between the two hypotheses. U.S. car manufacturers strongly
support R&D investments in traditional vehicles, while foreign automakers invest
intensively in alternative engines, especially in electric and hybrid technologies. Despite
the two extreme hypotheses, the constructed interval for MNCs’ R&D expenditures is very
narrow and it singles out the real pattern of R&D investment in the U.S. automotive
industry. As shown in Figures 3.15 and 3.16, the difference in the R&D expenditures by
technology under the two hypotheses is very small. This is mainly due to the fact that here
it is dealing with country-level data, in which the impact of U.S. Affiliates’ R&D
expenditures is minor with respect to the U.S. Parents’ expenditures. Indeed until 1997
U.S. Affiliates’ R&D expenditures were very low. Only after 1998 does R&D performed
by foreign-owned firms account for around 20 percent of the U.S. Parents’ R&D
expenditures.
0
10
20
30
40
50
1990
1991
1992
1993
1994
1995
1996
1997
1998
1999
2000
2001
2002
2003
2004
2005
FCV
HV
EV

101
Figure 3.15: Interval for U.S. MNCs’ R&D expenditures, technology-exploiting (H1) versus technology-sourcing (H2) FDI: Traditional technologies
0
20
40
60
80
100
120
140
160
180
TraditionalH1
TraditionalH2

102
Figure 3.16: Interval for U.S. MNCs’ R&D expenditures, technology-exploiting (H1) versus technology-sourcing (H2) FDI: Alternative technologies
3.5 Conclusions
The analysis of the macro data on MNCs’ R&D expenditures have been augmented
by exploiting micro-evidence on the firms’ patenting activity over the 1990–2005 period.
Multinationals are differentiated as U.S.-owned and foreign-owned firms to account for
different strategies.
From the early 1990s automakers undertook investments aimed at developing
alternative technologies to meet the binding environmental standards required by the ZEV
program. The traditional ICE faces competition of the alternative electric, hybrid, and fuel
cell vehicles. The ongoing competition among different engine technologies increases the
competition among firms’ technological innovations. Firms continuously develop
innovative technologies by their R&D centers, whose output is represented by firms’
patenting activity. At the firm level the direction of the firms’ patenting activity in new
0
10
20
30
40
50
60
70
80
90
100
AlternativeH1
AlternativeH2

103
technologies is increasingly important in order to be competitive in the market. Indeed, in
the literature patent data are used to investigate firms’ innovation activity. Microeconomic
results show that the traditional engine still draws the most R&D efforts. Among
alternative vehicles, the electric technology was strongly developed until the end of the
1990s. From 2001 onwards HVs and FCVs become the leading alternative engines.
Japanese firms are the first movers in electric and hybrid vehicles, while American firms
started the development of fuel cell technology.
At macroeconomic level, the firms’ R&D expenditure is the main input of their
patenting activity (Dodgson and Hinze, 2000). Indeed there is a strong link between R&D
and output innovation (Chen and Mohnen, 2009; Aw and Batra, 1998). At the
macroeconomic level the firms’ R&D expenditures are the only proxy for technological
innovation. In this line it is important to analyze the direction of companies’ R&D
expenditures by technology in order to account for innovation strategies. Accordingly, the
present work analyzes for the first time how Research and Development (R&D)
expenditures are split among different technologies in the U.S. automotive industry. It is
also investigated how technological investments of U.S. MNCs differ among different
firms’ ownership. The technological specializations of U.S.-based R&D centers have been
inferred through interacting micro-level results from previous research on technological
patent applications and macro-level data on R&D expenditures by U.S. MNCs. MNCs are
differentiated between U.S. Parents and U.S. Affiliates, and the difference in R&D
activities due to difference in firms’ ownership is investigated.
The micro-level analysis of Oltra and Saint Jean (2009) has been taken as
microeconomic reference in order to deepen the macroeconomic research on R&D
expenditures by U.S. MNCs. U.S. Parents are taken as investing in the home country
following their own technological specialization (Section 3.4.2). Until the end of the
1990s, American firms were mainly focused on traditional technologies. After 2001 their
R&D has increasingly been devoted to the development of alternative technologies.
Among the traditional technologies, the gasoline engine is the most important for all
periods. Among alternative engines, EVs and HVs are the leading technologies, with an
important surge in investment in FCVs after 2000. For U.S. Affiliates two possible
scenarios have been assumed (Section 3.4.3). First, U.S. Affiliates’ R&D expenditures are
split by technology following their home-country technological specialization. Under this
hypothesis foreign MNCs undertake technology-exploiting FDI in the U.S. (Section

104
3.4.3.1). Foreign firms’ R&D is mainly focused on diesel and alternative engines. Among
alternative technologies the EVs are the leaders, immediately followed by hybrid
technologies. FCVs have a minor role in foreign companies’ R&D for all the period
analyzed. The second hypothesis is that U.S. Affiliates invest in R&D according to the
U.S. Parents’ technological specialization. In this case MNCs invest in U.S. according to
technology-sourcing strategies (Section 3.4.3.2). In this case U.S. Affiliates follow exactly
the same specialization as for U.S. Parents. By the two hypotheses the U.S. MNCs’ R&D
expenditures have been decomposed in two extreme ways to find the interval containing
the real R&D expenditures of U.S. Affiliates. Obviously the assumptions imply a great
level of generalization on the firms R&D investments. In addition, this study reports all the
limitations recognized by Oltra and Saint Jean (2009), given that the data used are from
their work. Nevertheless, the procedure is very important from an analytical point of view
because it allows deepening the analysis of macro data in a qualitative way by exploiting
micro level results leading to an innovative, much more integrated perspective. This
procedure can well be qualified as a Qualitative Meso-economic Analysis derived from the
micro–macro integration.
Finally, the macroeconomic data have been aggregated in order to identify the
R&D strategies at country-level by exploiting firm-level results. The data aggregation
considered the two hypotheses used to decompose the U.S. Affiliates’ R&D activity. In
this way U.S. MNCs’ total R&D expenditures have been split by technology in the two
extreme ways and the real R&D strategy followed by the U.S. firms without ownership
distinction has been found (Section 3.4.4). The macro-data integration is the final step of
the analysis. This is a very important result because it allows differentiating the car
manufacturers’ technological specialization in the United States at the country-level in
terms of aggregated R&D expenditures by accounting for the real strategy followed at the
firm-level.
The decrease in market shares of U.S.-owned car manufacturers is likely to be due
to a technological specialization of U.S. firms in the traditional as well as fuel cell
vehicles. The traditional technologies are decreasing in popularity because of the current
environmental regulations. On the other hand, fuel cell is not feasible in the short-term.
Foreign competitors devoted large R&D expenditures to the development of electric and
hybrid technologies. HVs are considered by car manufacturers as the most promising
technology in the short-term. The great specialization of Japanese firms in hybrid engines

105
is likely to determine the future patterns of the automotive industry, at least in the short and
medium term.

106
Appendix 3
Table A1: Share of patents applied by each car manufacturer in the total applied by the sample of car manufacturers, Linear Trend evolution
continued

107
Table A.1contd

108
Table A2: Number of patents by technology for each car manufacturer

109
Table A3: Total number of patents applied by each car manufacturer
Figure A1: Growth rates of R&D expenditures: US Parents and US Affiliates – technology-exploiting (H1) and technology-sourcing (H2) hypotheses: Traditional technologies
Figure A2: Growth rates of R&D expenditures: US Parents and US Affiliates – technology-exploiting (H1) and technology-sourcing (H2) hypotheses: Alternative technologies
‐0.5
0
0.5
1
1.5
2
2.5
1990
1991
1992
1993
1994
1995
1996
1997
1998
1999
2000
2001
2002
2003
2004
2005
TraditionalUSP
TraditionalUSA‐H1
TraditionalUSA‐H2
‐0.5
0
0.5
1
1.5
2
2.5
19901992199419961998200020022004
AlternativeTechUSP
AlternativeTech‐USA‐H1
AlternativeTech‐USA‐H2
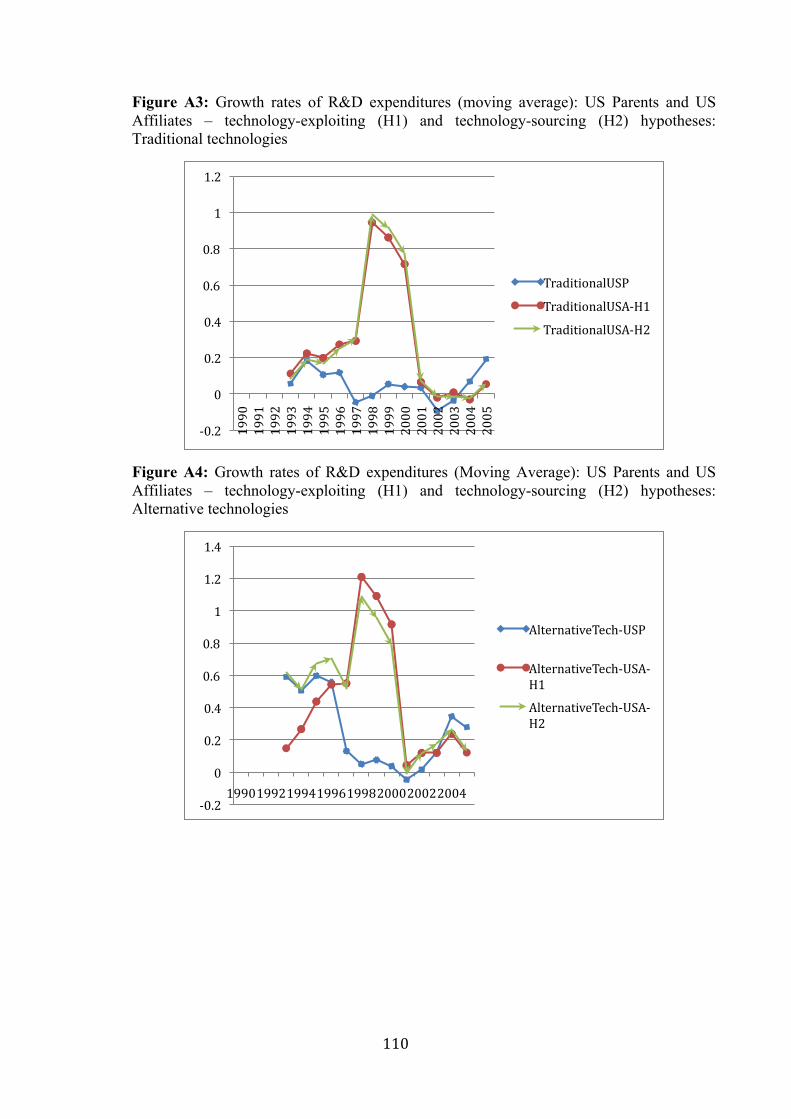
110
Figure A3: Growth rates of R&D expenditures (moving average): US Parents and US Affiliates – technology-exploiting (H1) and technology-sourcing (H2) hypotheses: Traditional technologies
Figure A4: Growth rates of R&D expenditures (Moving Average): US Parents and US Affiliates – technology-exploiting (H1) and technology-sourcing (H2) hypotheses: Alternative technologies
‐0.2
0
0.2
0.4
0.6
0.8
1
1.2
1990
1991
1992
1993
1994
1995
1996
1997
1998
1999
2000
2001
2002
2003
2004
2005
TraditionalUSP
TraditionalUSA‐H1
TraditionalUSA‐H2
‐0.2
0
0.2
0.4
0.6
0.8
1
1.2
1.4
19901992199419961998200020022004
AlternativeTech‐USP
AlternativeTech‐USA‐H1
AlternativeTech‐USA‐H2

111
Conclusions
With the increase of the globalization process in the last three decades, the analysis
of the activity of multinational corporations (MNCs) is a key economic issue. Foreign
Direct Investment (FDI) is the most important channel through which MNCs organise their
activity and their production across countries because FDI is strictly related to control and
management activities. The United States have historically been the most attractive
destination for FDI. In 2005 it was surpassed by China, but in 2006 it regained the leading
role in receiving foreign investments. Inside U.S., the automotive industry is one of the
sectors most involved in FDI activity. From 1982, foreign automakers started creating U.S.
production transplants strengthening the competition in the U.S. market. The strong
foreign competition made the American Big Three lose their market power continuously
until present.
This thesis addresses the analysis of MNCs’ activity through three empirical
chapters sharing a focus on the U.S. auto industry. Each chapter focuses on a specific topic
in order to investigate U.S. automotive MNCs from different perspectives. The first two
sections develop a quantitative analysis of the companies’ behaviour through the use of
econometric techniques. The last chapter focuses on a qualitative perspective. The analyses
carried out in the three chapters use a unique dataset of the U.S. Bureau of Economic
Analysis (BEA). “BEA is one of the world’s leading statistical agencies” (www.bea.gov).
It collects data on the U.S. economy at national, international, regional, and industry level.
On MNCs, it provides useful information on companies’ total assets, total employment,
compensation to employees, export and import of goods, net income, total sales, capital
expenditures, and research and development (R&D) expenditures. MNCs are distinguished
by ownership in order to investigate differences between domestic firms, that is U.S.
Parents, and foreign-owned companies, that is U.S. Affiliates. The period analyzed is
1983–2007 according to the availability of data.
In Chapter 1 it was investigated whether domestic and foreign-owned companies
are characterized by different economic behaviours. U.S. automakers lost their market

112
shares against their foreign competitors from the early 1960s. Foreign competitors entered
the U.S. market by importing small and compact cars, while U.S. Big Three focused on the
production of big-size cars. A great decrease in U.S. companies’ market shares started in
the early 1980s following the two oil shocks. In the same period the U.S. Government
passed the Fair Practices for Automotive Product Act requiring foreign automakers to start
a U.S. based production in order to retain their current levels of U.S. sales. The
government regulation was intended to facilitate a recovery in Big Three’s
competitiveness, but U.S. automakers continued losing market power. In the meantime
foreign producers entered the U.S. with productive transplant further strengthening their
competitive pressure (Section 1.2). A first glance at data reveals the continuous loss in the
market power of U.S. Parents from 1983 to 2007. U.S. Affiliates’ sales per employee are
higher than their American counterparts, while U.S. Parents have an R&D per employee
greater than U.S. Affiliates. Also the average labour compensation of U.S. Parents is
greater than that of U.S. Affiliates, in contrast to the main FDI literature, where “it is rare
to find a study of FDI and wages in any host country that does not find that foreign owned
firms pay higher wages, on average, than a least privately owned local firms” (Lipsey,
2002) (Section 1.3). To analyze the dataset, homogeneous time series spanning the 1983–
2007 period have been constructed. Indeed until 1997 data were collected according to the
Standard Industrial Classification (SIC) system, while from 1997 onwards data are
collected according to the North America Industrial Classification System (NAICS). The
two coding systems differ in the methodology of counting establishments. Homogeneous
time series have been constructed according to the “bridge tables between SIC and
NAICS” provided by the U.S. Census Bureau. The data pertain to total assets, employees’
compensation, total employment, export, import, capital expenditures, net income, R&D
expenditures, and total sales for both U.S. Parents and U.S. Affiliates. In the spirit of LSE
approach two simultaneous equations systems have been elaborated, one for each type of
MNC. The use of the system deals with endogeneity problems, un-observable bias, and
simultaneous correlation bias. In order to take into account the financial troubles occurred
in the time span investigated, many financial variables are included in the estimations. By
this procedure it is possible to solve the bias avoiding the use of dummy variables, which
will reduce the generality of the models and their degree of freedom (Section 1.4). As
expected, Three Stages Least Squares (3SLS) results show that U.S. Parents and U.S.
Affiliates follow very different behaviour in all the variables analyzed, while they strongly
influence each other (Section 1.5). In particular, U.S. Parents’ total sales are positively and

113
significantly affected by the foreigners’ total sales lagged one period. Given that foreign
automakers are focused on small cars production, the effect of U.S. Affiliates’ total sales
stands for the fact that the U.S. demand of small cars is increasing and so positively
affecting the share of U.S. firms producing such cars. The R&D expenditures of the
American firms are negatively related to the rational expectations on U.S. Affiliates’ R&D
one-period forward. It is likely that U.S. firms improve in foreign-based facilities the
innovative products to compete with foreign-owned companies, given the difference in
products supplied by American and foreign car producers. The U.S. Parents’ employee
compensation specification does not present inter-relationship with U.S. Affiliates’ activity
in contrast with many studies on FDI spillovers. The capital expenditures carried out by
American firms are negatively influenced by the lagged levels of capital expenditures and
total sales of foreign-owned companies. It is likely that U.S. Parents do not react to a
foreign expansion. Given the focus of U.S. Affiliates on small cars, their total sales can be
taken as proxy for market demand in the small and compact vehicles sector. The positive
influence of foreigners’ total sales on U.S. Parents’ capital expenditures suggests that
American firms try to increase their production facilities to start local production of small
and compact cars. That is in order to regain competitiveness on the American market,
whereas consumers’ preferences have changed after the two oil shocks of the 1970s and
early 1980s. As expected, U.S. Parents’ total employment is negatively related to U.S.
Affiliates’ total sales lagged one-period. Indeed the greater the foreign sales, the greater
their market shares, the lower the U.S. Parents’ market shares, the lower their production
and employment level. Total assets of American companies are negatively related to
rational expectations on U.S. Affiliates’ local expansion, proxied here by the total assets
variable one-period forward. It is likely that U.S. Parents react to U.S. Affiliates’ expected
expansion through captive import from abroad, as suggested by Eden and Molot (1996).
U.S. Parents’ total import is negatively influenced by the foreigners’ sales level as
expected. American companies’ total export is negatively affected by the lag of U.S.
Affiliates’ capital expenditures (Section 1.5.1).
About U.S. Affiliates, surprisingly only the capital expenditures and the import
regressions show a link with U.S. Parents’ activity. Indeed foreign capital expenditures and
total imports are negatively related to U.S. Parents’ lagged levels of capital expenditures
and import respectively. On the other hand, U.S. Affiliates’ total sales, R&D expenditures,
employees’ compensation, total employment, total assets, and total export are not

114
significantly related to U.S. Parents’ behaviour. This pattern is likely due to the fact that
U.S. Affiliates are mere production facilities ruled from the foreign headquarters and they
are not reflecting strategic influences (Section 1.5.2).
Chapter 2 dealt with the automakers’ productivity issue. In particular it investigated
whether results on productivity in the U.S. auto industry discussed in recent
microeconomic literature can be confirmed when macroeconomic data are used. In
addition, the productivity analysis is carried out maintaining the distinction between U.S.
Affiliates and U.S. Parents. By this procedure differences in productivity among local and
foreign-owned firms is also investigated. The plant-level study of Van Biesebroeck (2007)
on the North American auto industry is taken as reference point to develop the
macroeconomic perspective. The analysis of auto industry’s productivity is a key issue in
the recent development of the automotive industry. Indeed from the early seventies the
different models of cars and light trucks supplied on the market rose continuously in
number. In addition, the number of productive plants did not change as much. Then the
average number of models produced in a single plant increased enormously (Van
Biesebroeck, 2007). The production of different models in the same assembly plant implies
several changes in the organization of the production process. From Van Biesebroeck
(2007), firms adopt flexible technology in order to produce efficiently a greater variety of
vehicles per assembly line. In addition, American automakers’ in-source intermediate
activities in order to maintain their competitiveness on the market (Section 2.2.1).
Given the general framework, Van Biesebroeck uses plant-level data to further
investigate firms’ productivity with respect to the phenomena of increasing Variety,
Flexibility, and In-sourcing (Section 2.2.2). In particular, the author investigated whether
the joint adoption of the three single activities and their interactions have influence on
productivity (Section 2.2.3). Van Biesebroeck’s results show that the adoption of the three
single activities negatively influences productivity, while their interactions have positive
effects on productivity. In addition, the author shows that the productivity penalty due to
the production of increased variety is more than offset by the positive effects of the
interactions between the three activities under analysis (Section 2.2.4).
As in Chapter 1, the industry-level dataset from the U.S. BEA has been used. In this
case the novelty has been the estimation of a model very close to the one elaborated in the

115
microeconomic reference with a macroeconomic dataset. As earlier, the time period spans
from 1983 to 2007, and homogeneous time series have been created by using the Bridge
Tables between NAICS and SIC provided by the U.S. Census Bureau. Another novelty is
the distinction between local firms, that is U.S. Parents, and U.S. Affiliates in the
productivity analysis. As resulted from Chapter 1, the two types of MNCs are very
different to each other in their economic activity. So the distinction is a key issue also in
the productivity context (Section 2.3.1). Given the difference in the aggregation levels
among the dataset used by Van Biesebroeck (2007) and the BEA dataset, different proxies
for the three investigated activities have been constructed (Section 2.3.2).
In the spirit of the LSE approach (Sargan, 2001; Hendry, 2003), for both U.S.
Parents and U.S. Affiliates a model very close to that used at the plant-level has been
constructed and estimated first through Ordinary Least Squares (OLS). Surprisingly, using
exactly the same specification, the productivity of both U.S. Parents and U.S. Affiliates is
explained up to over 97 percent. This is very surprising given that U.S. Parents and U.S.
Affiliates are structurally very different. Indeed U.S. Parents are “headquarters companies”
while U.S. Affiliates are productive transplants ruled from abroad. In the two estimated
models the U.S. Gross Domestic Product (GDP) has been included to account for
exogenous factors. In addition, possible inter-relationships between U.S. Parents’ and U.S.
Affiliates’ productivity have been investigated through a Granger-causality test.
Surprisingly the test failed in assessing the relationship between the productivity of the two
types of MNCs. It is likely that domestic and foreign-owned companies producing
different cars adopt different production techniques (Section 2.4.1).
In order to deal with endogeneity of adoption decisions on the three investigated
activities and with serial correlation problems, two simultaneous equations systems have
been developed. The systems have been constructed by treating as endogenous the three
activities of Variety, Flexibility, and In-sourcing. The 3SLS results show that in the U.S.
Parents’ case, Variety and the Flexibility index enter the productivity specification with a
positive sign, in contrast with the plant-level work. The In-sourcing proxy has been
dropped from the specification because it was not significant at all. The interaction terms
between Variety and Flexibility and between Variety and In-sourcing had the expected
positive signs, while that between Flexibility and In-sourcing registers a negative sign,
even if with a very small magnitude. The U.S. GDP enters the specification positively. As
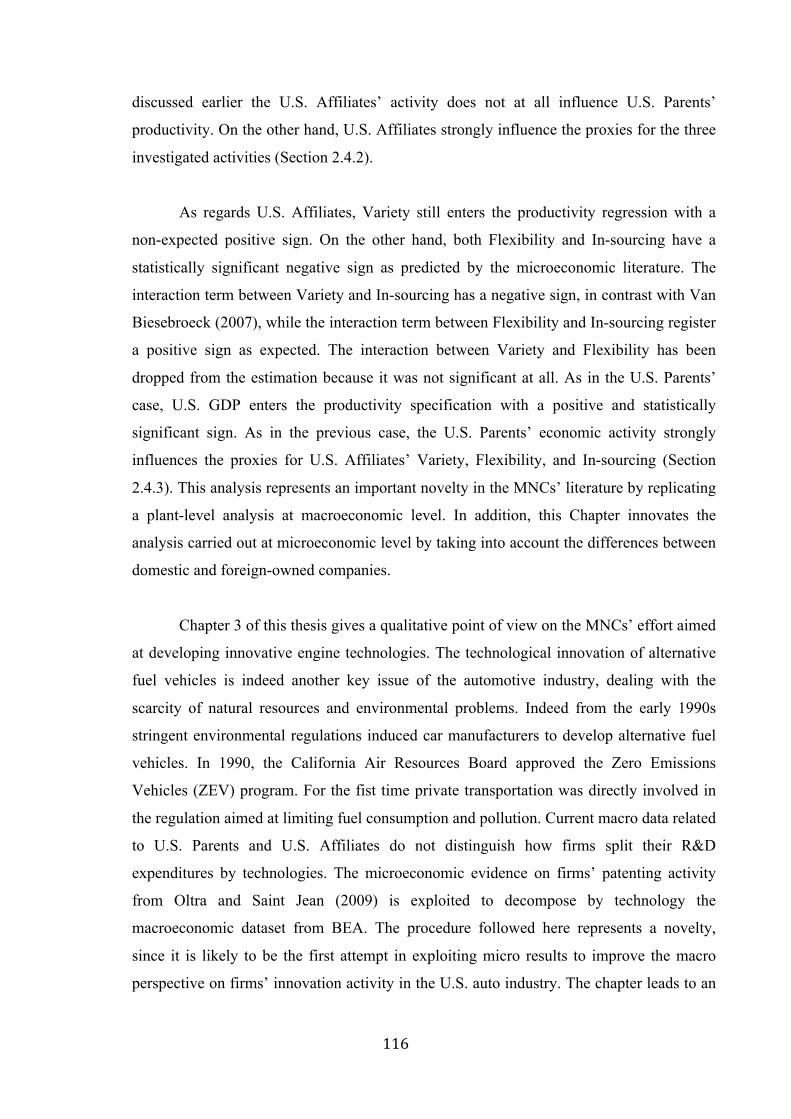
116
discussed earlier the U.S. Affiliates’ activity does not at all influence U.S. Parents’
productivity. On the other hand, U.S. Affiliates strongly influence the proxies for the three
investigated activities (Section 2.4.2).
As regards U.S. Affiliates, Variety still enters the productivity regression with a
non-expected positive sign. On the other hand, both Flexibility and In-sourcing have a
statistically significant negative sign as predicted by the microeconomic literature. The
interaction term between Variety and In-sourcing has a negative sign, in contrast with Van
Biesebroeck (2007), while the interaction term between Flexibility and In-sourcing register
a positive sign as expected. The interaction between Variety and Flexibility has been
dropped from the estimation because it was not significant at all. As in the U.S. Parents’
case, U.S. GDP enters the productivity specification with a positive and statistically
significant sign. As in the previous case, the U.S. Parents’ economic activity strongly
influences the proxies for U.S. Affiliates’ Variety, Flexibility, and In-sourcing (Section
2.4.3). This analysis represents an important novelty in the MNCs’ literature by replicating
a plant-level analysis at macroeconomic level. In addition, this Chapter innovates the
analysis carried out at microeconomic level by taking into account the differences between
domestic and foreign-owned companies.
Chapter 3 of this thesis gives a qualitative point of view on the MNCs’ effort aimed
at developing innovative engine technologies. The technological innovation of alternative
fuel vehicles is indeed another key issue of the automotive industry, dealing with the
scarcity of natural resources and environmental problems. Indeed from the early 1990s
stringent environmental regulations induced car manufacturers to develop alternative fuel
vehicles. In 1990, the California Air Resources Board approved the Zero Emissions
Vehicles (ZEV) program. For the fist time private transportation was directly involved in
the regulation aimed at limiting fuel consumption and pollution. Current macro data related
to U.S. Parents and U.S. Affiliates do not distinguish how firms split their R&D
expenditures by technologies. The microeconomic evidence on firms’ patenting activity
from Oltra and Saint Jean (2009) is exploited to decompose by technology the
macroeconomic dataset from BEA. The procedure followed here represents a novelty,
since it is likely to be the first attempt in exploiting micro results to improve the macro
perspective on firms’ innovation activity in the U.S. auto industry. The chapter leads to an

117
innovative and much more integrated analytical level, which can be qualified as
Qualitative Meso-economics perspective.
Innovations on engine technologies are the main output of firms’ patenting activity,
while R&D expenditures represent the innovation input (Dodgson and Hinze, 2000). At the
macroeconomic level, the firms’ R&D expenditures are the only proxy for technological
innovation. Accordingly, the present work analyzed for the first time how R&D
expenditures are split among the different technologies in the U.S. automotive industry. In
addition, it is investigated how technological investments of U.S. MNCs differ among
different firms’ ownership, that is between U.S. Parents and U.S. Affiliates.
Automakers have been encouraged to shift from the traditional internal combustion
engine vehicles (ICEVs) fuelled with gasoline or diesel (DE) to alternative low emissions
vehicles (LEVs), such as battery electric vehicles (EVs), hybrid vehicles (HVs), and fuel
cell vehicles (FCVs) powered by hydrogen. Section 3.2 introduces the main characteristics
of the different technologies, and the ongoing new competition involving both cars and
infrastructure. Competition among different car models is related to technical issues, while
that related to infrastructure concerns the organizational complexity of the innovation, that
is required network change. Changes in technical complexity are divided among
incremental and radical innovations. Organizational innovations are divided into modular
and system innovations.
The microeconomic analysis of the firms’ patenting activity from Oltra and Saint
Jean (2009) is taken as reference point in order to deepen the macroeconomic perspective.
The authors collected data on patents applications by the 11 major car manufacturers from
1990 to 2005 (Section 3.3). At the technology level, Oltra and Saint Jean (2009) show that
traditional engines follow an increasing trend in the firms’ patenting activity for the whole
period considered still attracting the principal innovation effort of automakers. Among
alternative technologies EVs and HVs are those most developed by American car
manufacturers, while the fuel cell design registers the lowest innovation effort for the
whole period (Section 3.3.1). At firm level, Toyota and Honda are the leading companies
in patenting activity. Toyota is the first mover in the development of traditional, electric
and hybrid technologies, while Honda focuses its innovation efforts mainly on diesel, fuel
cell, and hybrid engines. General Motors and Renault are relatively specialized in fuel cell

118
technology, while Hyundai, Mitsubishi, and PSA direct their innovation effort mostly
towards traditional diesel engine. Traditional gasoline is strongly supported by
Volkswagen, Daimler-Chrysler, Renault and Ford, while Japanese firms are likely to be the
most involved in electric and hybrid vehicles, with the exception of Nissan that strongly
supports the fuel cell engine also (Section 3.3.2).
Micro and macro analyses are matched and R&D expenditures are qualitatively
differentiated by technology between U.S. Parents and U.S. Affiliates. By this procedure
the comparative advantages in innovative technologies have been highlighted. The
innovation advantages are a fundamental key issue in the new competition among different
car manufacturers (Section 3.4). The data on patents applications are taken from Oltra and
Saint Jean (2009) while that on U.S. MNCs’ R&D expenditures are from BEA (Section
3.4.1). The main assumption under the analysis is that firms are “skilled” in the most
advanced technology in the home country and the most applied to goods traded in the
home market. MNCs will develop the most improved technology in the home country and
the most promising one for the nearest markets in the home R&D centers, leaving foreign
R&D centers for the most developed and applied technology in the foreign country/market.
Then U.S. Parents’ R&D expenditures are split according to the technological
specialization of Ford, General Motors, and Daimler-Chrysler. For all the 1990s, American
firms were focused in developing traditional technologies, with particular attention to the
gasoline engine. From 2001, investments in alternative designs register a sharp increase
until it caught up with the expenditures on the traditional gasoline design. Among
alternative vehicles, the electric design was the dominant technology during the 1990s.
From the new decade, hybrid technologies become the dominant alternative designs, even
if investments in FCVs increase sharply after 2000 (Section 3.4.2). For U.S. Affiliates two
alternative scenarios will be assumed in order to construct an interval to include the real
values of MNCs’ R&D expenditures in the U.S. First in the technology-exploiting FDI
hypothesis, U.S. Affiliates’ R&D expenditures are split by technology according to the
technological specialization of non-American car manufacturers. Here, U.S. Affiliates will
perform R&D activities to refine the technology the most developed in the home country.
The R&D effort will be aimed at fitting foreign consumer preferences and meeting the
regulations of the target country. In the second hypothesis U.S. Affiliates will invest in the
most developed technology in the country where they are located (i.e. technology-seeking
FDI [Barba Navaretti and Venables, 2004]). U.S. Affiliates’ R&D expenditures are split by
technology according to the U.S. Parents’ technological specialization. By the two

119
hypotheses the R&D expenditures of U.S. Affiliate companies are divided in two extreme
ways in order to find an interval including the real FDI strategy. This procedure represents
a novelty here. Indeed it allows deepening the analysis of macro data in a qualitative way
by exploiting micro level results, leading to an innovative, much more integrated
perspective. It can well be qualified as a Qualitative Meso-economic Analysis deriving
from the micro-macro integration (Section 3.4.3). In the technology exploiting case, U.S.
Affiliates were mainly focused in the diesel technology until 2001. From 2002 onwards
they direct the major efforts toward alternative engines. The leading alternative technology
for the non-American firms is EV, immediately followed by HV (Section 3.4.3.1). In the
technology-sourcing FDI hypothesis, U.S. Affiliates’ R&D expenditures are split by
technology as in the U.S. Parents’ case (Section 3.4.3.2). By interacting the results of the
two hypotheses the interval including the real FDI strategy in the U.S. auto industry is
found. Until 1998 U.S. Affiliates follow the same technological specialization under the
two hypotheses. After 1998 in the technology-sourcing hypothesis U.S. Affiliates are more
focused in traditional engines than in the technology-exploiting case. Regarding alternative
fuel vehicles, the two hypotheses show the same pattern of technological specialization
until 1996, while from 1997 onward U.S. Affiliates exploiting the foreign specialization
are more focused in developing alternative engines than in the technology-sourcing case
(Section 3.4.3.3). At this point it has been possible to split the U.S. R&D expenditures by
technology at country-level. The technological composition of the aggregate figure results
by combining the R&D expenditures of U.S. Parents and U.S. Affiliates split as before.
Also the total U.S. R&D expenditures is split by technology in two extreme ways in order
to find the real R&D strategy followed by U.S.-based firms with no ownership distinction.
The macro-data integration is the final and most important result of the analysis. The
difference in the country-level R&D expenditures by technology under the two hypotheses
is very small. This is mainly due to the fact that here it is dealing with country-level data,
in which the impact of U.S. Affiliates’ R&D expenditures is minor with respect to the U.S.
Parents’ expenditures. Indeed until 1997 U.S. Affiliates’ R&D expenditures were very low.
Only after 1998, R&D performed by foreign-owned firms accounted for around 20 percent
of the U.S. Parents’ R&D expenditures (Section 3.4.4).

120
References
Abernathy W., 1983, “The competitive status of the U.S. auto industry”, Washington D.C.: National Academy Press.
Abernathy W., Clark K., and Kantrow A., 1983, “Industrial Renaissance: Producing a competitive future for America”, New York: Basic Books (ACK)
Ajaga E., Nunnenkamp P., 2008, “Inward FDI, Value Added, and Employment in US States: A Panel Cointegration Approach”, Kiel Working Paper No. 1420, May.
Arrow K., 1995, “Economic as it is and as it is developing: A very rapid survey”, in Albach and Rosenkranz (eds), Intellectual Property Rights and Global Competition, Berlin: Sigma, 11–32.
Arthur W.B., 1989, “Competing technologies, increasing returns, and lock-in by historical events”, The Economic Journal, 99 (March): 116–131.
Athey S. and Stern S., 2003, , “An empirical framework for testing theories about complementarity in organizational design”, Sloan Working Paper, June.
Automotive Department, International Metalworkers Federation, 2000, “IMF Auto Report 2000”.
Aw B.Y. and Batra G., 1998, “Firm size and the pattern of diversification”, International Journal of Industrial Organization, 16(3): 313–331.
Barba Navaretti G., Venables A. J., 2004, “Multinational Firms in the World Economy”, Princeton University Press.
Belderbos R., 2001, “Overseas Innovation by Japanese Firms: An Analysis of Patent and Subsidiary Data”, Research Policy, 30(2): 313–332.
Belderbos R., Lykogianni E., and Veugelers R., 2008, “Strategic R&D location in European manufacturing industries”, Review of World Economics, 144(2): 183-206.
Benjamin D.K., 1999, “Tangents”, PERC Reports, 17(4) (September).
Berry S., Levinshon J., Pakes A., 1999, “Voluntary Export Restraints on Automobiles: Evalutaing a Trade Policy”, The American Economic Review, 89(3) (June).
Bhagwati J.N., Dinopoulos E., and Wong K.Y., 1992, “Quid pro Quo Foreign Investment”, The American Economic Review, 82(2) (May): 186-190.
Blonigen B.A., Feenstra R.C., 1997, “Protectionist Threats and Foreign Direct Investment”, in Feenstra R.C., “The Effects of US Trade Protection and Promotion Policies”, University of Chicago Press, January.
Branstetter L. and Saggi K., 2009, “Intellectual property rights, foreign direct investment, and industrial development”, NBER Working Paper No. 15393.

121
Branstetter L., 2006, “Is Foreign Direct Investment a Channel of Knowledge Spillovers? Evidence from Japan’s FDI in the United States”, Journal of International Economics, 68(2): 325–344.
Branstetter R., Fisman R., Foley C.F., and Saggy K., 2007, “Intellectual property rights, imitation, and foreign direct investment: Theory and evidence”, NBER Working Paper No. 13033 (April 2007).
Brian A.W., 1989, “Competing technologies, increasing returns, and lock in by historical events”, The Economic Journal, 99(394) (March): 116–131.
Carbaugh R.J., 2002, “International Factor Movements and Multinational Enterprises”, in Carbaugh R.J. 9th edition, “International Economics”, Chapter 10, South-Western.
Chen F. and Mohnen P., 2009, “FDI, R&D and Innovation Output in the Chinese Automobile Industry”, United Nations University, Working Paper Series #2009-044.
Christiano L.J. and Eichenbaum M., 1990, “Unit roots in Real GNP: do we know and do we care?”, Discussion Paper/Institute for Empirical Macroeconomics 18, Federal Reserve Bank of Minneapolis.
Chung W., Mitchell W., and Yeung B., 2003, “Foreign Direct Investment and host country productivity: The American automotive component industry in the 1980s”, Journal of International Business Studies 34(2): 199-218
Co C.Y., 1997, “Japan FDI into the US automobile industry: An empirical investigation”, Japan and the World Economy 9(1): 93–108.
Cochrane, J.H., 1991, “A critique of the application of unit root tests”, Journal of Economics Dynamics and Control, 15(2): 275–284.
Collantes G. and Sperling D., 2008, “The origin of California’s zero emission vehicle mandate”, Transportation Research Part A, 42(10): 1302–1313.
Cooney S., and Yacobucci B.D., 2005, “US Automotive Industry: Policy Overview and Recent History”, Congressional Research Service Report for Congress, April 25.
David P.A., 1985, “Clio and the economics of Qwerty”, The American Economic Review, 75(2) (May): 332–337.
Department of Commerce, United States of America, 2008, “US Automotive Parts Industry Annual Assessment”, Office of Aerospace and Automotive Industries, US Department of Commerce, March.
Diebold F.X. and Kilian L., 2000, “Unit root tests are useful for selecting forecasting models”, Journal of Business and Economics Statistics, 18(3): 265–273.
Dodgson M. and Hinze S., 2000, “Indicators used to measure the innovation process: Defects and possible remedies”, Research Evaluation,8(2) (August): 101-114.
Dunning, J.H., 1980, “Towards an eclectic theory of international production”, Journal of International Business Studies, 11(1) (Spring-Summer), pp. 9-31

122
Durbin J., 1970, “Testing for serial correlation in least squares regression when some of the regressors are lagged dependent variables”, Econometrica, 38(3) (May): 410–421.
Eden L. and Molot M.A., 1996, “Made in America? The US auto industry 1955–95”, The International Executive, 30(4) (July/August): 501–541.
Eichengreen B.J., Parry C.W., Caldwell P., 1988, “International Competition in the Products of U.S. Basic Industries”, in Feldstein M., “The United States in the World Economy”, University of Chicago Press, 1988, pp. 279-366.
European Commission, 2004, “The European automotive industry,” in European Competitiveness Reports, Chapter 4: Commission Staff Working Document, SEC, European Communities p. 1397.
Fine H.C., Lafrance J.C., and Hillebrand D., 1996, “The US Automobile Manufacturing Industry”, Meeting the Challenge: US Industry Faces the 21st Century, Office of Technology Policy.
Florida R., Jenkins D., 1998, “The Japanese Transplants in North America: Production Organization, Location and R&D”, in Steven Tolliday (ed.), Between Imitation and Innovation: The Transfer and Hybridization of Production Systems in the International Automobile Industry, Oxford University Press: pp. 189–215.
Flynn P.C., 2001, “Commercializing an alternative vehicle fuel: lessons learned from natural gas for vehicle”, Energy Policy, 30(7): 613-619
Foray D., 1997, “The dynamic implications of increasing returns: Technological change and path dependence inefficiency”, International Journal of Industrial Organization, 15(6): 733–752.
Frenken K., Hekkert M., Godfroij P., 2004, “R&D portfolios in environmentally friendly automotive propulsion: Variety, competition, and policy implications”, Technological Forecasting & Social Change, 71(5): 485–507.
Ghosh A., 2004, “Increasing Market Share as a Rational for Corporate Acquisitions”, Journal of Business Finance & Accounting 31(1&2) (January/March), 209-247.
Graham, E.M., Krugman, P.R., 1995, “Foreign Direct Investment in the United States”, Third Edition, Washington: Peterson Institute for International Economics.
Hamilton, J.D., 1994, Time Series Analysis, Princeton University Press.
Hekkert M. and Van den Hoed, R., 2006, Competing technologies and the struggle toward a new dominant design: The emergence of the hybrid vehicles at the expense of the fuel cell vehicle?”, Greener Management International, (47): 29–47.
Hendry D.F., 2003, “J. Denis Sargan and the origins of LSE econometric methodology”, Econometric Theory, 19(3): 457–480.
International Monetary Fund, 2004, “Balance of Payments Manual”, Fifth Edition, Statistic Department, International Monetary Fund, April.

123
Isely P.N. and Simons G.P.W., 2007, “Globalization in the US auto industry: International mergers and acquisitions as drivers of information sharing”, Global Journal of International Business Research,1(1).
Ito K., Rose E.L., 1999, “Innovations and geographic focus: A comparison of US and Japanese firms”, International Business Review, 8(1): 55–74.
Johnston J. and Di Nardo J., 1996, “Econometric Methods”, McGraw-Hill/Irvin, 4th edition,
Jorgensen K., 2007, “Technologies for electric, hybrid and hydrogen vehicles: Electricity from renewable energy sources in transport”, Utilities Policy, 16(2): 72–79.
Kogut B. and Chang S.J., 1991, “Technological capabilities and Japanese foreign direct investments in the United States”, Review of Economic and Statistics, 73(3): 401–413.
Levin A., Lin C.F., and Chu C.S.J., 2002, “Unit root tests in panel data: Asymptotic and finite sample properties”, Journal of Econometrics, 108 (1): 1–24.
Lipsey R.E., 2000, “Interpreting Developed Countries’ Foreign Direct Investment”, NBER Working Paper No. 7810.
Lipsey R.E., 2002, “Home and Host Country Effects of FDI”, NBER Working Paper No. 9293.
Lipsey, R.E. and Feliciano Z., 1999, “Foreign Ownership and Wages in the United States, 1987–1992”, NBER Working Paper No. W6923.
Lipsey, R.E. and Sjoholm J., 2005, “The Impact of Inward FDI on Host Countries: Why Such Different Answer?”, in Moran T.H., Graham E.M., and Blomstrom M., “Does Foreign Direct Investment Promote Development?”, Institute for International Economics, Center for Global Development, Chapter 2.
Lipsey, R.E., 2000, “Interpreting Developed Countries’ Foreign Direct Investment”, NBER Working Paper No. 7810.
Liu Y. and Helfand G.E., 2009, “The alternative motor fuels act, alternative fuel vehicles, and greenhouse gas emissions”, Transportation Research Part A, 43(8): 755–764.
Ma Y., Morikawa K., and Shone R., 2000, “A macroeconomic model of direct investment in foreign affiliates of Japanese firms”, Japan and the World Economy, 12(4) 311–335.
Milgrom P. and Roberts J., 1990, “The economics of modern manufacturing: Technology, strategy, and organization”, American Economic Review, 80(3): 511–528.
Muldler P., De Groot, H.L.F., and Hofkes M.V., 2001, “Economic growth and technological change: A comparison of insights from a neo-classical and an evolutionary perspective”, Technological Forecasting & Social Change, 68(2): 151–171.
Mullen J.K., Williams M., 2007, “Foreign direct investment and regional productivity spillovers in US manufacturing”, Review of Urban & Regional Development Studies, 19(3): 185-196.

124
Nair-Reichert U. and Duncan R., 2008, “Patent regimes, host country policies, and the nature of MNE activities”, Review of International Economics, 16(4): 783–797.
Nelson D.R., 1996, “The Political Economy of US Automobile Protection”, in Krueger A.O. (ed.) The Political Economy of American Trade Policy, University of Chicago Press, pp. 133–196.
Neven D. and Siotis G., 1995, “Technology sourcing and FDI in the EC: An empirical evaluation”, International Journal of Industrial Organization, 14(5): 543–560.
Nunnenkamp P. and Spatz J., 2004, “Intellectual property rights and foreign direct investment: A disaggregated analysis”, Review of World Economics, 140(3): 393-414
Oltra V. and Saint Jean M., 2009, “Variety of technological trajectories in low emission vehicles (LEVs): A patent data analysis”, Journal of Cleaner Production, 17(2) 201–213.
Park K.H., 2003, “Patterns and strategies of Foreign Direct Investment: The case of Japanese firms”, Applied Economics, 35(16):1739–1746.
Pil F.K. and MacDuffie J.P., 1999, “What makes transplants thrive: Managing the transfer of best practice at Japanese auto plants in North America”, Journal of World Business, 34(4): 372-391.
Rivlin, M.A., 1982, “The political economy of budget choices: A view from Congress”, The American Economic Review, 72(2): 351–55.
Rosenkranz S., 2003, “Simultaneous choice of process and product innovation when consumers have preference for product variety”, Journal of Economic Behavior and Organization,50(2) 183–201.
Sargan J.D., 2001, “Model building and data mining”, Econometric Reviews, 20(2): 159–170.
Singleton C.J., 1992, “Auto industry jobs in the 1980’s: A decade of transition”, Monthly Labor Review, 115(2).
Sudarsanam S., 2004, “Discussion of increaasing market share as a rationale for corporate acquisitions”, Journal of Business Finance & Accounting, 31(1&2) (January/March): 249-256.
Theil, H., 1971, “Principles of Econometrics”, New York: Wiley 1971
UNCTAD, 2008, “World Investment Report: Transnational Corporations and the Infrastructure Challenge”, United Nations publication, New York and Geneva 2008.
U.S. Department of Commerce, 2008, “Assessing Trends and Policies of Foreign Direct Investment in the United States”, International Trade Administration, July 2008.
Van Biesebroeck J., 2007, “Complementarities in automobile production”, Journal of Applied Econometrics, 22(7): 1315–1345.

125
Van den Hoed R., 2006, “Sources of radical technological innovation: The emergence of fuel cell technology in the automotive industry”, Journal of Cleaner Production 15(11&12): 1014–1021.
Wakasugi R. and Ito B., 2009, “The effect of stronger property rights on technology transfer: Evidence from Japanese firm-level data”, Journal of Technology Transfer, 34(2): 145–158.
Weinhold D. and Nair-Reichert U., 2008, “Innovation, inequality and intellectual property rights”, World Development,37(5): 889–901.
Zhang C., Henke J.W., and Griffith D.A., 2009, “Do buyer cooperative actions matter under relational stress? Evidence from Japanese and US assemblers in the US automotive industry”, Journal of Operations Management, 27: 479–494.

126
Acknowledgements
I would like to thank my supervisor, Prof. Tucci, who is an example for me to
follow.
I am particularly grateful to Prof. Di Matteo for the support and useful suggestions
for this project.
I am delighted to thank Prof. Lipsey who has given me the opportunity to work
with him and his team. I have very much enjoyed the atmosphere of the prestigious NBER
office in New York.