Embed Size (px)
Citation preview
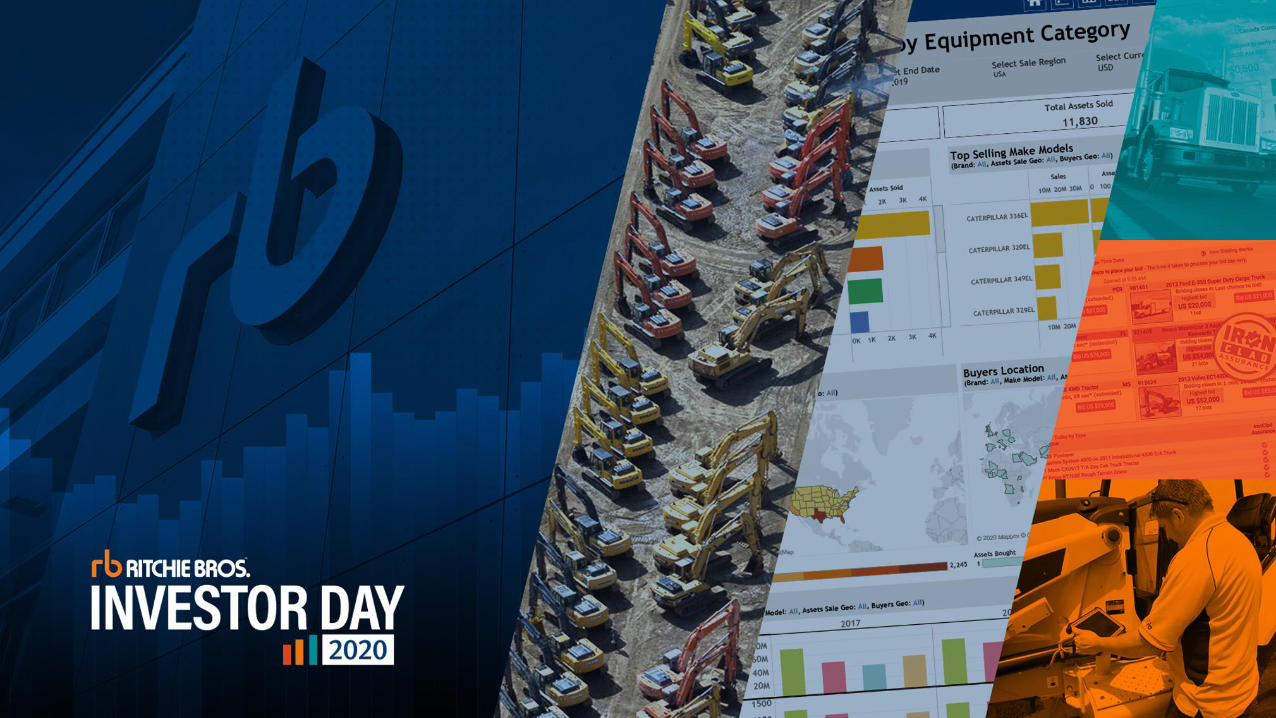
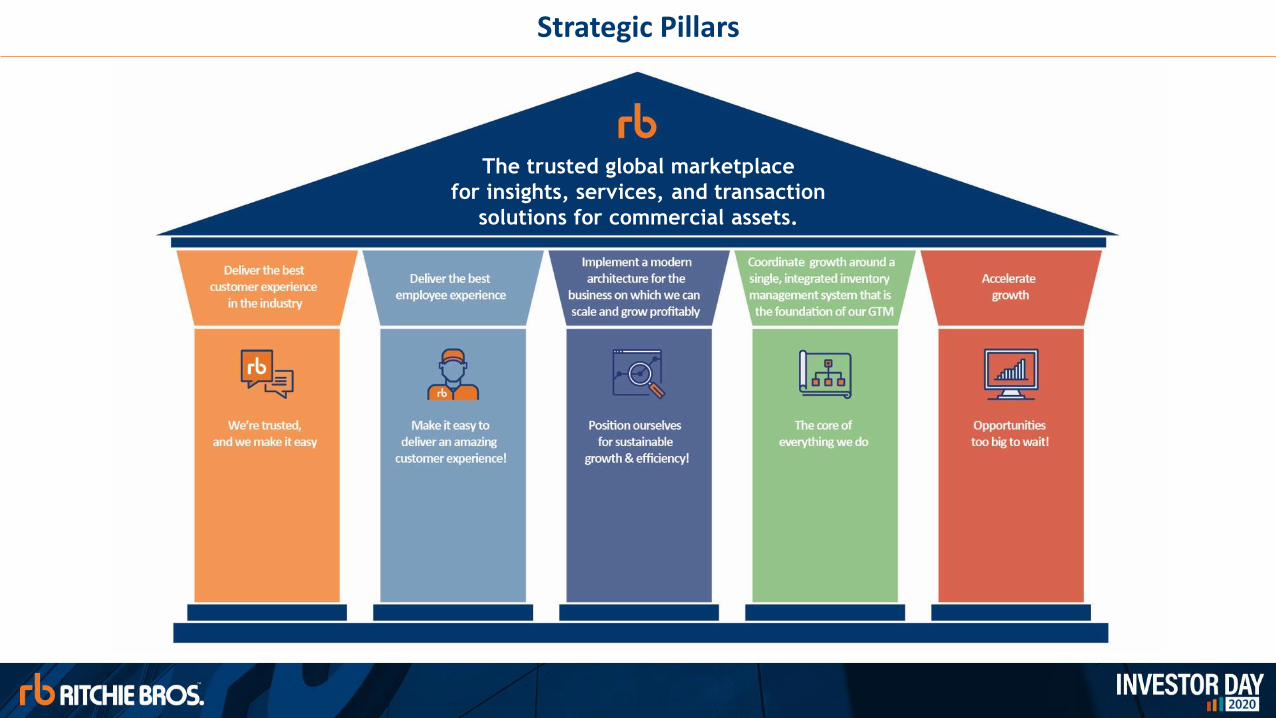
The trusted global marketplace for
insights, services, and transaction
solutions for commercial assets.

Caution Regarding Forward-Looking Statements
This presentation contains forward-looking statements and forward-looking information within the meaning of applicable US and Canadian securities legislation (collectively, “forward-looking statements”), including, in particular, statements regarding the benefits and synergies of the proposed Rouse transaction, future opportunities for the combined businesses of Ritchie Bros. and Rouse, the terms and conditions of the proposed Rouse transaction, the expected timetable for completing the Rouse transaction, future financial and operational results and any other statements regarding events or developments that Ritchie Bros. believes or anticipates will or may occur in the future. Forward-looking statements are statements that are not historical facts and are generally, although not always, identified by words such as “expect”, “plan, “anticipate”, “project”, “target”, “potential”, “schedule”, “forecast”, “budget”, “estimate”, “intend” or “believe” and similar expressions or their negative connotations, or statements that events or conditions “will”, “would”, “may”, “could”, “should” or “might” occur. All such forward-looking statements are based on the opinions and estimates of management as of the date such statements are made. Forward-looking statements necessarily involve assumptions, risks and uncertainties, certain of which are beyond Ritchie Bros.’ control, including risks and uncertainties related to: the duration and impact of the COVID-19 pandemic on Ritchie Bros.’ operations, the operations of our customers and general economic conditions, general economic conditions and conditions affecting the industries in which Ritchie Bros operates; each of Ritchie Bros.' and Rouse's ability to satisfy the acquisition agreement conditions and consummate the transaction on the anticipated timetable, or at all; Ritchie Bros.’ ability to successfully integrate Rouse; the ability to realize anticipated growth and synergies in the Rouse transaction; the maintenance of important business relationships; our ability to commercialize new platform solutions and offerings; deterioration of or instability in the economy, the markets we serve or the financial markets generally; as well as the risks and uncertainties set forth in Ritchie Bros.’ Annual Report on Form 10-K for the year ended December 31, 2019 and Ritchie Bros.' Interim Report on Form 10-Q for the quarter ended September 30, 2020, which are available on the SEC, SEDAR, and Ritchie Bros.’ websites. The foregoing list is not exhaustive of the factors that may affect Ritchie Bros.’ forward-looking statements. There can be no assurance that forward-looking statements will prove to be accurate, and actual results may differ materially from those expressed in, or implied by, these forward-looking statements. Forward-looking statements are made as of the date of this presentation and Ritchie Bros. does not undertake any obligation to update the information contained herein unless required by applicable securities legislation. For the reasons set forth above, you should not place undue reliance on forward-looking statements.
This presentation contains certain non-GAAP financial measures. For a discussion of non-GAAP measures and the most directly comparable GAAP financial measures, see the Appendix to this presentation as well as our earnings release and our Form 10-Q interim report, which are available at: investor.ritchiebros.com. These non-GAAP financial measures are not measures of financial performance in accordance with GAAP and may exclude items that are significant in understand and assessing our financial condition and results. Therefore, these measures should not be considered in isolation or as alternatives to measures of profitability, liquidity or other performance under GAAP. These measures may not be comparable to similarly-titled measures used by other companies.
This presentation also includes certain forward-looking non-GAAP financial measures. We are unable to present a quantitative reconciliation of this forward-looking non-GAAP financial information because management cannot reliably predict all of the necessary components of such measures. Accordingly, investors are cautioned not to place undue reliance on this information.
All figures are in US dollars, unless otherwise noted.
Forward Looking Statements and Non-GAAP Measures

Strategic Vision
Ann FandozziChief Executive Officer
• Growth Agenda• Strategic Pillars Overview• Organization Changes• Learning Organization

The trusted global marketplace for
insights, services, and transaction
solutions for commercial assets.
Strategic Vision
The trusted global marketplace for insights, services, and transaction solutions for
commercial assets.

Time (Eastern) Section Topics Speaker
10:00 – 10:20 CEO Perspectives • Strategic Pillars Overview• Organization Changes • Learning Organization
Ann Fandozzi, Chief Executive Officer
10:20 – 10:25 Employee Experience• Employee Experience • Diversity and Inclusion
Carmen Thiede, Chief Human Resources Officer
10:25 – 10:30 ESG • Inaugural sustainability report Ann Fandozzi, Chief Executive Officer
10:30 – 10:50 Learning Organization • North America Growth Strategy• International Satellite Site Strategy
Kari Taylor, President, North America SalesKarl Werner, President, International
10:50 – 11:15 Question and Answer Executive Team
11:15 – 11:25 Break
11:25 – 11:45 Marketplace
• Inventory Management System• Data & Analytics• Service• Marketplace implications for Strategic Accounts • Enabling Innovation and Speed to Market
Matt Ackley, Chief Marketing OfficerJeff Jeter, President, Global Strategic AccountsBaron Concors, Chief Information Officer
11:45 – 11:55 Customer Experience• Buyer / Seller Journey• Deconstructing Sales Day
Jim Kessler, Chief Operating Officer
11:55 – 12:10 Finance Review• Review of Financial Performance• Refreshing Evergreen metrics • Capital Allocation Strategy
Sharon Driscoll, Chief Financial Officer
12:10 – 12:20 Closing Remarks • Excited about the future Ann Fandozzi, Chief Executive Officer
12:20 – 1:00 Question and Answer Executive Team
Growth Agenda

Ann FandozziChief Executive Officer
Sharon DriscollChief Financial Officer
Jim KesslerChief Operating Officer
Karl WernerPresident, International
Kari TaylorPresident, North America Sales
Jeff JeterPresident, Global Strategic Accounts
Kieran HolmPresident, RB Services
Carmen ThiedeChief Human Resources Officer
Baron ConcorsChief Information Officer
Matt AckleyChief Marketing Officer
Kevin GeisnerChief Strategy Officer
Darren WattSenior Vice President & General Counsel
Management Team Brings History of Shareholder Value Creation and Experience

Strategic Vision
Now the rest of the story…
Current
USA Canada International International
Growth hypothesis before joining
Canada USA
InternationalCanada USA
Potential
The trusted global marketplace for
insights, services, and transaction
solutions for commercial assets.
Strategic Pillars
The trusted global marketplace
for insights, services, and transaction
solutions for commercial assets.

Executive Leadership Team Changes Aligned to Strategy
The trusted global marketplace
for insights, services, and transaction
solutions for commercial assets.
Baron Concors CTO
Jim KesslerCOO
Carmen ThiedeCHRO
Kevin GeisnerCSO
Kari TaylorPres. NA Sales

2020 – COVID-19 Learnings
In our controlOut of our control: COVID
The World
• COVID-19
• Government policy
• Boarder restrictions
• Size, shape, type and focus of Stimulus
• COVID-19 impacts on business confidence and macro environment
-60%
-40%
-20%
0%
20%
40%
60%
80%
100%
20
19-1
2-3
1
20
20-0
1-3
1
20
20-0
2-2
9
20
20-0
3-3
1
20
20-0
4-3
0
20
20-0
5-3
1
20
20-0
6-3
0
20
20-0
7-3
1
20
20-0
8-3
1
20
20-0
9-3
0
20
20-1
0-3
1
20
20-1
1-3
0
RBA S&P 500 TSX
• Health and safety of our employees and customer through COVID-19 protocols
• Corporate staff from home• PPE for employees and customers• Alter work shifts to improve social
distancing • People
• Transparent dialog• Maintaining “Team feel” during these tough
times – we are all in this together• Keeping everyone focused on our “True
North” – being there for our customers
• Efficient operations• Not ramping• Sale day 100% online• TAL for agriculture and international • Scheduling of equipment pick up
• Market Demand • Marketing tools that we are enabling by
driving all transactions online • Technology
• Capacity, functionality, usability • Capital allocation
• No long paying down debt• Acquiring Rouse
Source: Bloomberg; dividends reinvested in index or equity; daily returns 2019-12-31 to 2020-12-03
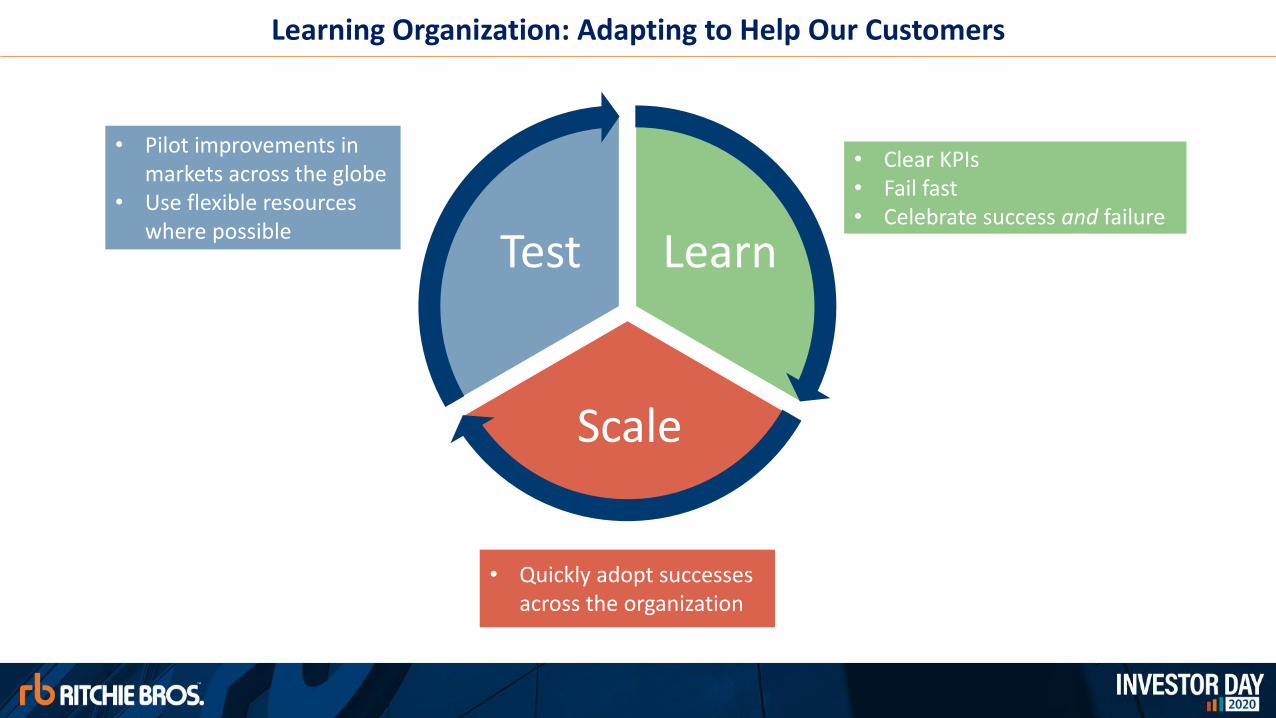
Learn
Scale
Test
• Pilot improvements in markets across the globe
• Use flexible resources where possible
• Clear KPIs• Fail fast• Celebrate success and failure
• Quickly adopt successes across the organization
Learning Organization: Adapting to Help Our Customers

Employee Experience / Diversity and Inclusion
Carmen ThiedeChief Human Resources Officer
• Employee Experience • Diversity and Inclusion
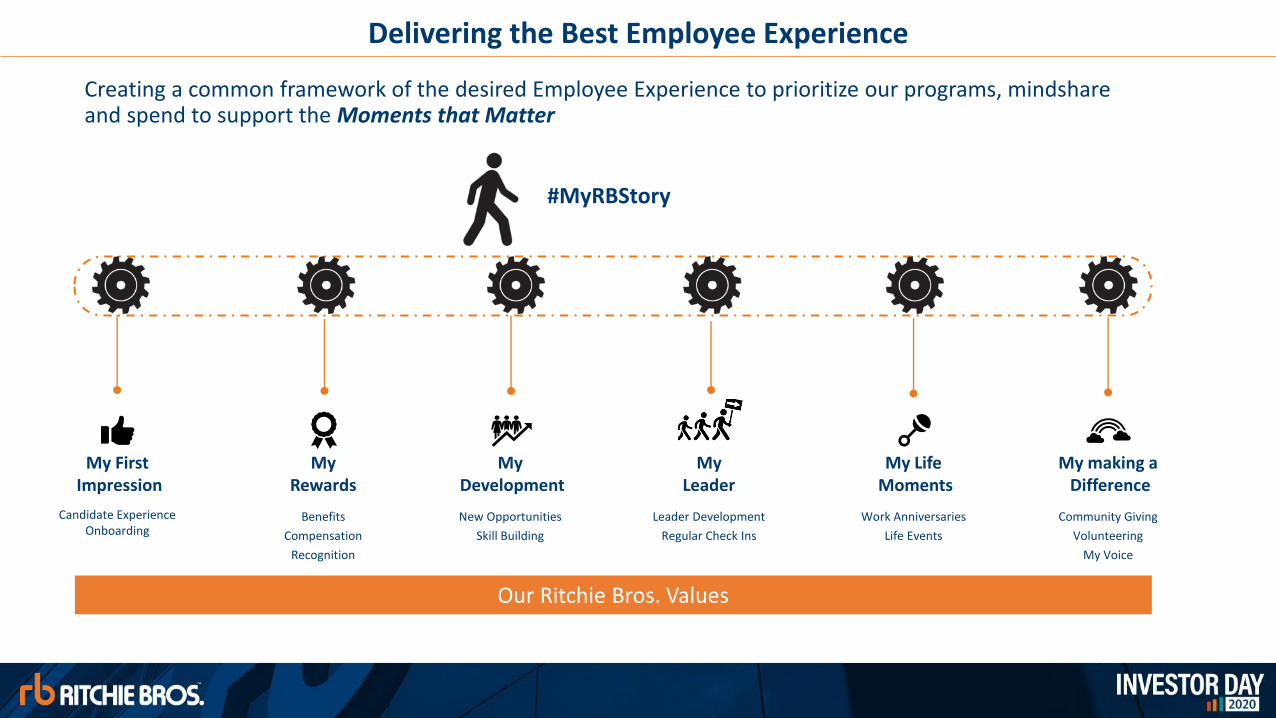
Creating a common framework of the desired Employee Experience to prioritize our programs, mindshare and spend to support the Moments that Matter
Our Ritchie Bros. Values
#MyRBStory
My Leader
Leader Development
Regular Check Ins
My FirstImpression
Candidate ExperienceOnboarding
My Rewards
Benefits
Compensation
Recognition
MyDevelopment
New Opportunities
Skill Building
My making aDifference
Community Giving
Volunteering
My Voice
My LifeMoments
Work Anniversaries
Life Events
Delivering the Best Employee Experience

Communication
Education / Training
Talent Practices
Community
Four BLM Committees
Connecting with Our People & Communities
Greater Vancouver Food Bank

ESG
Ann FandozziChief Executive Officer
• Inaugural sustainability report
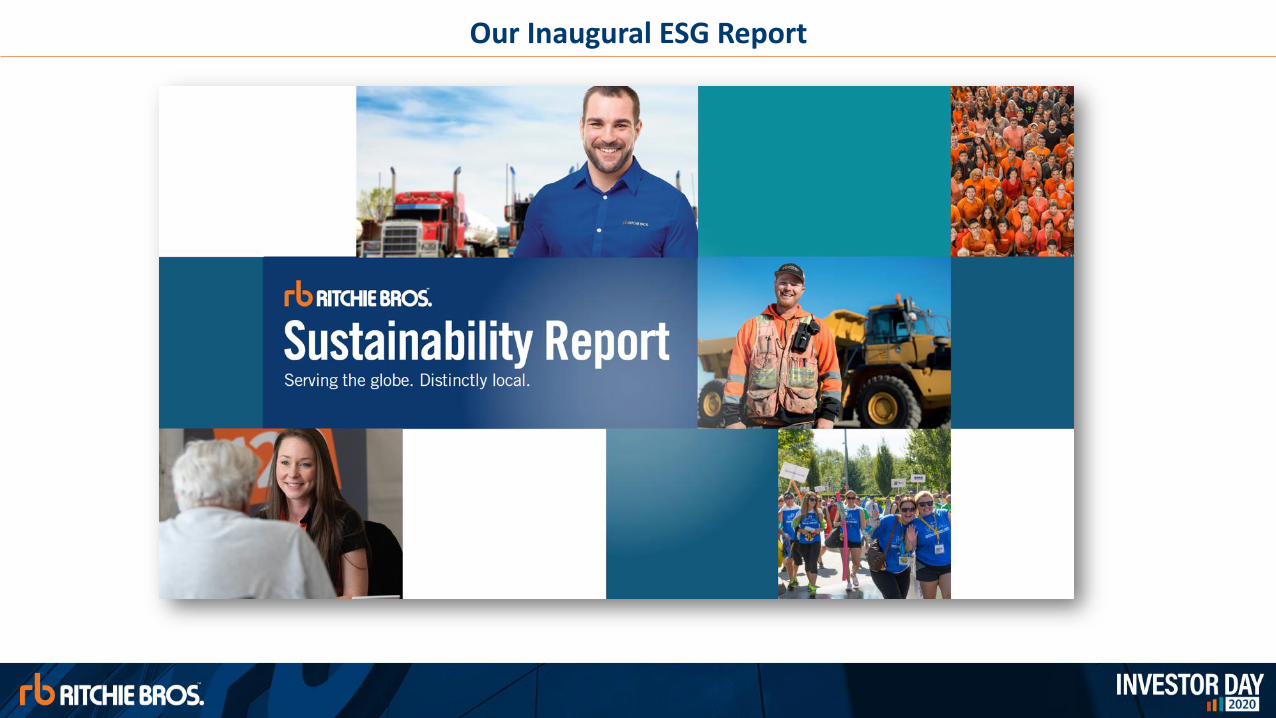
Our Inaugural ESG Report

To be a great global company, you have to be a great local company.
At The Heart Of The Circular
Economy
Ritchie Bros. is one of the world’s largest “practical green” re-commerce companies, meaning we enable and encourage the market liquidity of heavy equipment and trucks like no other. Each year, hundreds of thousands of customers use our solutions and services to re-use and recycle previously owned assets, given them a new life and avoiding landfill waste.
Doing Our Part for ESG: Enabling the Circular Economy

Test, Learn, Scale
Kari TaylorPresident, North America Sales
• North America Growth Strategy

Cascading successes as trusted business advisors, selling solutions,to inform sustainable growth across North America.
Building blocks for this growth initiative bring clarity to…
what we sell through named initiatives, framing solution selling
how we intersect complementary digital touch strategies
how we challenge news sales coverage models to move faster and cover more opportunities, and
how we solve for greater market reach and seller productivity
Spearheading Growth as a Thriving, Learning Organization
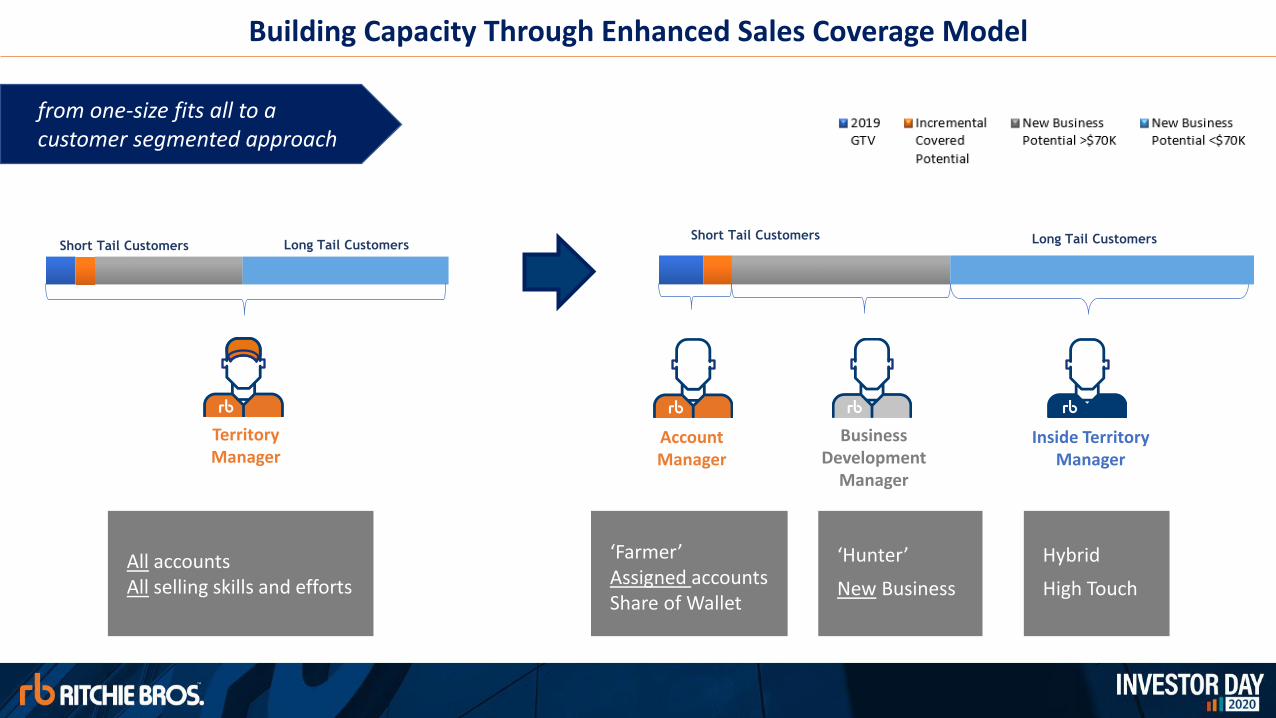
Building Capacity Through Enhanced Sales Coverage Model
BusinessDevelopment
Manager
AccountManager
Inside TerritoryManager
from one-size fits all to acustomer segmented approach
TerritoryManager
Short Tail Customers Long Tail Customers Short Tail Customers Long Tail Customers
All accounts All selling skills and efforts
‘Farmer’ Assigned accounts Share of Wallet
‘Hunter’
New Business
Hybrid
High Touch
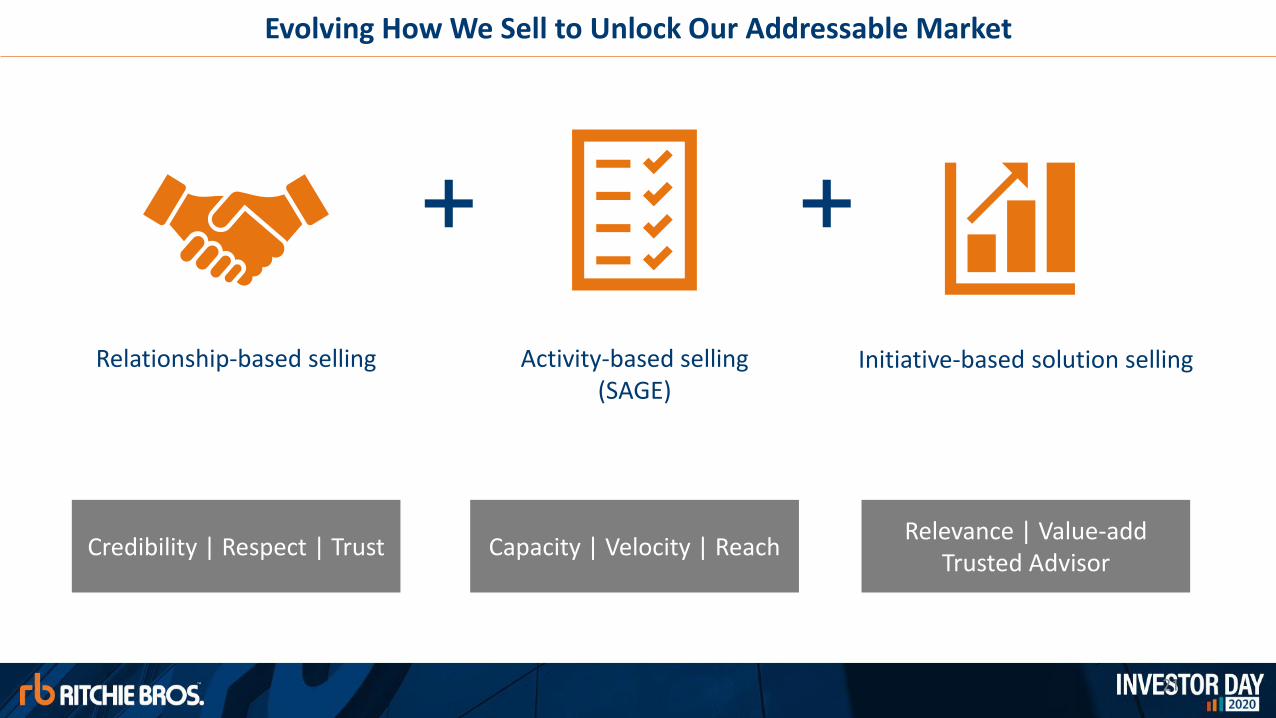
Evolving How We Sell to Unlock Our Addressable Market
21
Relationship-based selling Activity-based selling (SAGE)
Initiative-based solution selling
+ +
Credibility | Respect | Trust Capacity | Velocity | ReachRelevance | Value-add
Trusted Advisor

22
Reseller Solution
Oil & Gas Targeted Campaigns
Scaling ‘SARP’(Streamlined At Risk Program)
RPO Lease Buybacks
Customer Targeted
Morphing Our Sales Team, Armed With Data and Analytics, Into Trusted Advisors
Evolving Sales Process

Cascading Proven Results To Accelerate Growth as a Learning Organization
Incubating
Proving results
SCALING
Identify growth Initiatives
Test and Incubatein Texas
Expand to other regions
Starting H2-2021• Sub-initiatives to
cascade incrementally(not dependent on one another)
• Deployment triggered by proven success metrics
H2-2020• Sales coverage
model• Expanded solutions
named by sub-initiatives
Full Year 2021• Learn• Iterate• Prove
USA-So CA
Ca-So Ontario
Ca-Quebec
Ca-No Ontario
USA-No CA
USA-C CA

Test, Learn, Scale
Karl WernerPresident, International
• International Satellite Site Strategy

Understanding the Customers Benefits of a Satellite Site
1. Yards closer in proximity to customers reduces transportation barriers and attracts customers and accessibility, brand awareness and online traffic
2. Customers value the care, custody, and control that is offered by physical locations as it reduces friction in the transaction process and supports the online marketplace
3. Satellite sites have a lower cost profile compared to traditional auction sites and can generate incremental GTV with high ROI
Online digital model allows us to transact globally, however we think equipment transportation costs remains a hurdle in attracting customers.

We Gained Confidence With Our Australia “Mini-Test” in 2020
Results
Overall, very positive results and feedback from customers during the initial test pilot
Satellite sites further expanded RB’s online presence with sellers and buyers around each site vicinity
Perth, Australia • GTV up 85% in 2 years• YoY Online session - 48%• YoY User growth - 35%
COVID-19 further accelerated customer adoption of online platforms


Confirming Our Hypothesis at Scale in 2021
Proprietary Satellite Site Selection MethodologyBlending quantitative and qualitative factors
The successful test pilot serves as a proof point for our yard selection methodology
Australia
1. Identify additional satellite sites using our proprietary site selection methodology
2. Open 3 additional satellite sites in Eastern Australia (Adelaide, Mittagong, Dubbo)
3. Nurture our existing sites in Perth, Brisbane, and Geelong
GTV potential heat map
1
2
3
Brisbane Auction Yard
Geelong Auction Yard
2
Perth Satellite Yard
Planned ‘21 Satellite Yards
1
3
Qualitative(RB Sales Team)
Quantitative(Data Science)
Validation
Site Selection
Potential

Confirming Our Hypothesis at Scale in 2021
United States Example
1. Continue to scale our
learnings and insights from
Australia to the US and
abroad
2. Accelerate the adoption of
the online marketplace with
additional satellite sites to
provide a seamless online and
offline experience
GTV potential heat map
Replicating our successful pilots to accelerate and scale organic growth in Australia and the US
Potential

Sharon Driscoll
Chief Financial Officer
Jim Kessler
Chief Operating Officer
Karl Werner
President, International
Kari Taylor
President, North America Sales
Jeff Jeter
President, Global Strategic Accounts
Kieran Holm
President, RB Services
Carmen Thiede
Chief Human Resources Officer
Baron Concors
Chief Information Officer
Matt Ackley
Chief Marketing Officer
Kevin Geisner
Chief Strategy Officer
Darren Watt
Senior Vice President & General Counsel
Question & Answer
Ann. Fandozzi
Chief Executive Officer

10 Minute Break

Evolution to Marketplace
Ritchie Bros.Live auction
IronPlanet
Xcira
Mascus
Rouse
Marketplace
RBFS
Trusted Advisor

Marketplace
Matt AckleyChief Marketing Officer
• Inventory Management System• Data & Analytics• Service

RBAS Represents a New Way to Go to Market

Making It Easier to Add Inventory

Taxonomy and Classification Is Key to Valuation

The End Goal Is Better Decision Making for Our Customers

Enable Predictions with Machine Learning and Better Data

A Platform to Enable an Entire Suite of Services
Branded Webshops Third Party Marketplaces
RB Mascus Listings Site
RB Reserved Online Marketplace
RB Unreserved Online Marketplace
RB Unreserved Online Marketplace
Data Analytics/ Insights
• Decision-Making Tools• Market Trends• RB Asset Valuator• RB Price Estimate• Depreciation Curves• Reports & Dashboards• Fleet Recommendations
Services
• Inspections• Storage• AAS• Redeploy• R&R
Channels Data
Services
Inventory Management System
PUT THE CUSTOMER IN THE DRIVER’S SEAT
Customer Data
Integrations
TM’s Load Assets Into
MARS
• Asset Management, Status Visibility
• Business Rule Management
• Asset Disposition Scheduler
• Web-Based, Mobile Friendly Tool
• Dashboards• Channel Workflow
Management• User Management
Smart DIY Data Input
Forms
Spreadsheet Uploads
Scraping Assets
Buyer Wins Asset(s) in an RB Channel

Marketplace
Jeff Jeter
President, Global Strategic Accounts
• Marketplace implications for Strategic Accounts

Marketplace
Baron ConcorsChief Information Officer
• Enabling Innovation and Speed to Market

Future State – Microservices Architecture
• Microservice architecture allows a system to be divided into several smaller, individual and independent services.
• Organized around business capabilities not technologies.
• Improved productivity and speed by decomposing applications into manageable services that are faster to develop.
• Flexibility in Using Technologies - each microservice can be written using a different technology.
• Improved reliability – if a service does down, it does not impact the rest of the platform.
• Autonomous, Small, Cross-functional Teams

Video Streaming Platform Example
UI Microservice
Most Liked Microservice
Video Uploading Microservice
Content Microservice
User InfoMicroservice
Most TrendingMicroservice
Recommendations Microservice

Creating a Business Capability Map to Serve as a Blueprint for Microservices
Bids, Offers
Fraud Prevention
Listings
Risk Management
Inventory
My AccountBrowse/Search
Content Financing
Item Details Checkout Payment PriorityBid
Transactions
Assets
Inspections
Taxonomy
Pricing
Buyer Experience

Exposing Our Microservices Through APIs Will Fuel Growth and Innovation
Third Parties
APIsMobile & WebApplicationsMicroservices

Customer Experience
Jim KesslerChief Operating Officer
• Buyer / Seller Journey• Deconstructing Sales Day

Customer Experience Initiative
• Continued evolution of how we interact with our customers• Ritchie Bros Auctioneers built over the last 60 years with a live event as the focus• Iron Planet built for an online/digital experience over the last 20 years
• Bringing together live and online operations while viewing it through the lens of our customers• Started with MARS which is currently in process of building a singular back end
support system regardless of marketplace• Adding a detail customer journey map so we understand every touchpoint from a
seller and buyer point of view• We will measure success with a new Customer Effort Score
Our goal is to be the easiest to interact with
Ritchie Bros. Auctioneers60+ years of live auction operation experience
Iron Planet20+ years of online auction experience
combining operations through a
customer lens
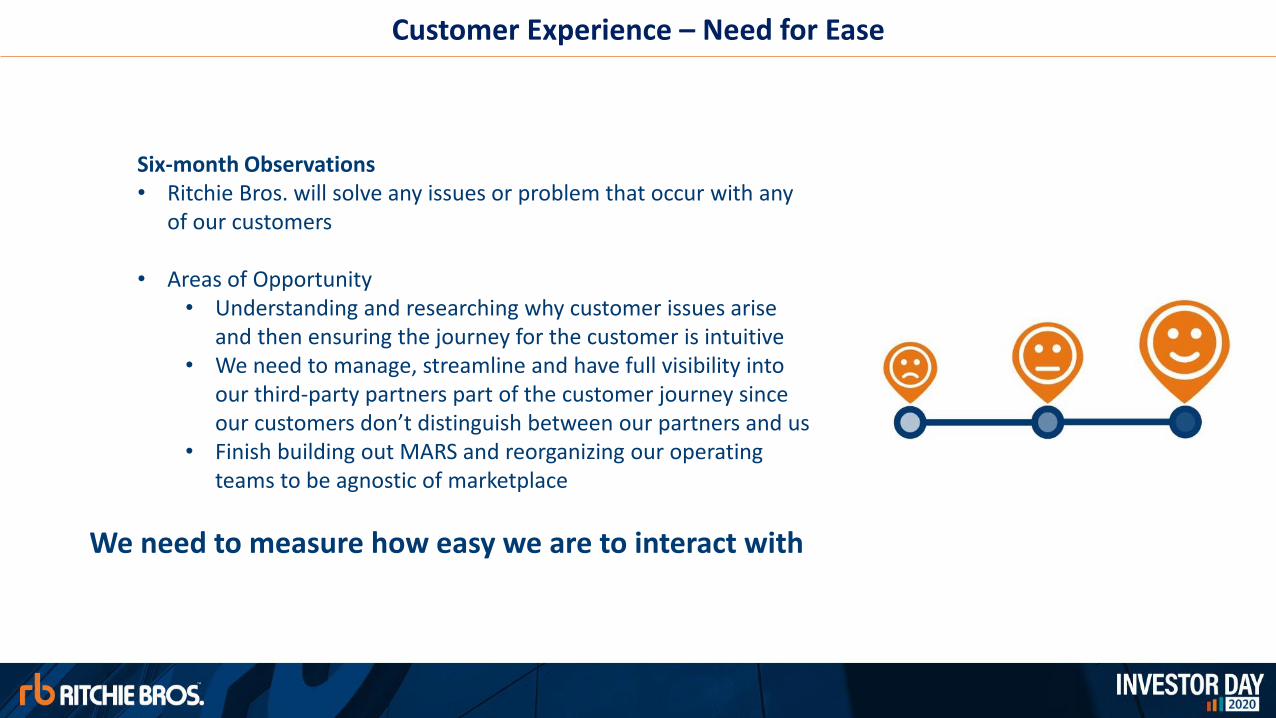
Customer Experience – Need for Ease
Six-month Observations• Ritchie Bros. will solve any issues or problem that occur with any
of our customers
• Areas of Opportunity• Understanding and researching why customer issues arise
and then ensuring the journey for the customer is intuitive• We need to manage, streamline and have full visibility into
our third-party partners part of the customer journey since our customers don’t distinguish between our partners and us
• Finish building out MARS and reorganizing our operating teams to be agnostic of marketplace
We need to measure how easy we are to interact with
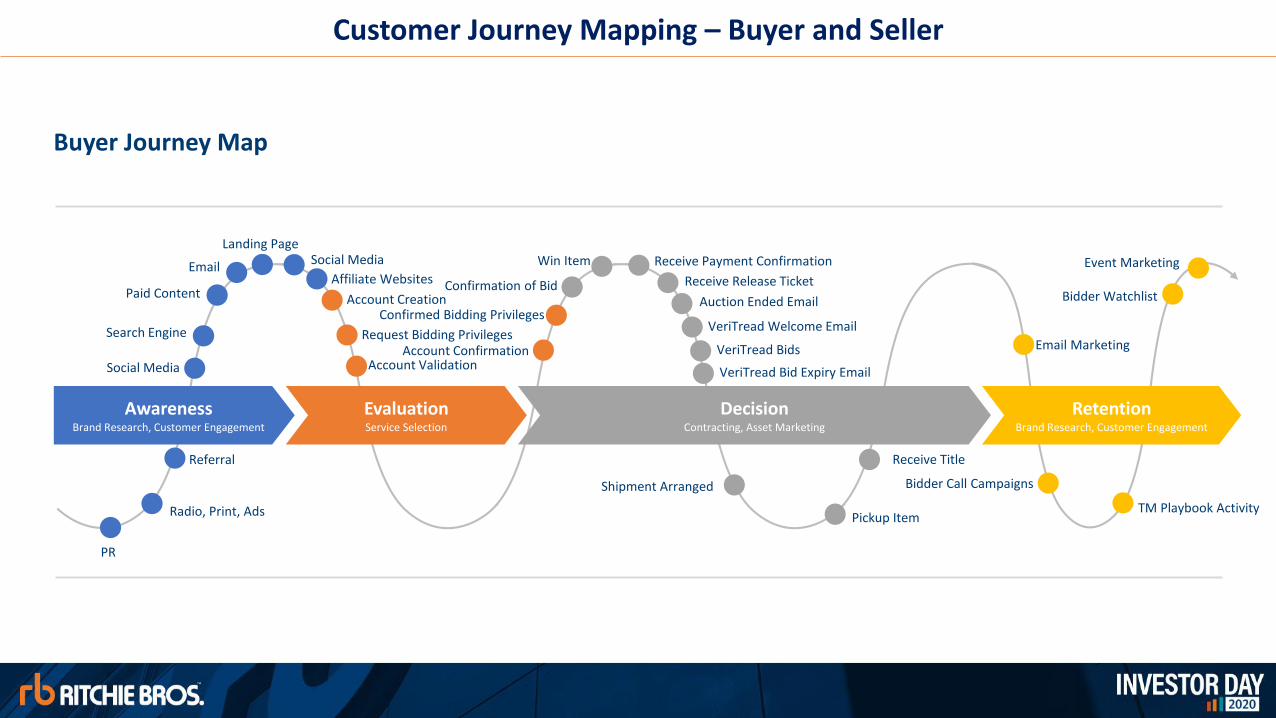
Customer Journey Mapping – Buyer and Seller
Radio, Print, Ads
Referral
PR
Social Media
Search Engine
Paid Content
Landing PageSocial Media
Affiliate Websites
Account CreationConfirmed Bidding Privileges
Confirmation of Bid
Shipment Arranged
TM Playbook Activity
Email Marketing
Win Item
Auction Ended Email
VeriTread Welcome Email
Receive Release Ticket
Request Bidding Privileges
Account Validation
Bidder Call Campaigns
Event Marketing
Bidder Watchlist
Buyer Journey Map
Receive Payment Confirmation
VeriTread Bids
Pickup Item
Receive Title
Account Confirmation
VeriTread Bid Expiry Email
AwarenessBrand Research, Customer Engagement
EvaluationService Selection
DecisionContracting, Asset Marketing
RetentionBrand Research, Customer Engagement

Customer Journey Mapping – Buyer and Seller
Radio, Print, Ads
Referral
PR
Social Media
Search Engine
Paid Content
Landing Page
Social Media
Affiliate Websites
LGG Call Center
TM Introduction
Inspection Fee Invoice
Obtain Asset Lists
Negotiations
Inspector Confirms
Obtain Title
Sold
Return Asset
Payment Info Requested
Inspection Report Complete
Pick-up Pending
AwarenessBrand Research, Customer Engagement
EvaluationService Selection
DecisionContracting, Asset Marketing
RetentionBrand Research, Customer Engagement
TM Introduction
Identify Opportunity Cross Sell VAS
Contract Emailed
Relist
Abandonment
Marketing
Item Payout
Analyze Customer Needs
Obtain POC Info
Inspection Scheduled
Buyer Invoiced
TM Relationship Management
Seller Journey Map
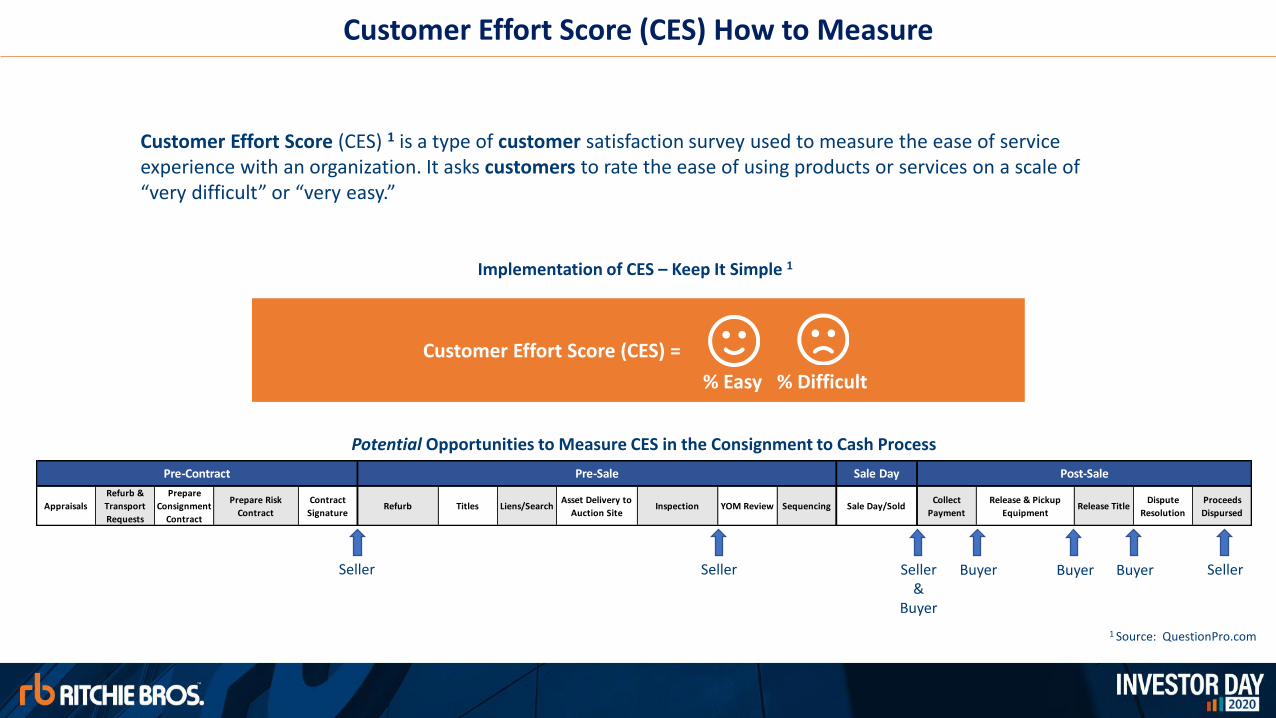
Customer Effort Score (CES) How to Measure
Customer Effort Score (CES) 1 is a type of customer satisfaction survey used to measure the ease of service experience with an organization. It asks customers to rate the ease of using products or services on a scale of “very difficult” or “very easy.”
1 Source: QuestionPro.com
Implementation of CES – Keep It Simple 1
Appraisals
Refurb &
Transport
Requests
Prepare
Consignment
Contract
Prepare Risk
Contract
Contract
SignatureRefurb Titles Liens/Search
Asset Delivery to
Auction SiteInspection YOM Review Sequencing Sale Day/Sold
Collect
Payment
Release & Pickup
EquipmentRelease Title
Dispute
Resolution
Proceeds
Dispursed
Post-SaleSale DayPre-Contract Pre-Sale
Potential Opportunities to Measure CES in the Consignment to Cash Process
Seller Seller Seller &
Buyer
SellerBuyer Buyer Buyer
Customer Effort Score (CES) =
% Easy % Difficult

Deconstructing Sales Day
Ramping
Equipment Evaluation
Customer Celebration/ Appreciation
In-person Registration
Networking/Industry Events
Catalog/Brochure

Finance Review
Sharon DriscollChief Financial Officer
• Review of Financial Performance• Refreshing Evergreen Metrics • Capital Allocation Strategy

History of Delivering Results for All Stakeholders
• Initial period of transforming into technology enabled company• Prepared to enable seamless transition into 100% online bidding
Strong share price outperformance
Measure Metric Measure Metric2015 - LTM
3Q 2020
Gross transaction ValueHigh Single Digits to Low Double Digits
CAGR: 4.2%
Agency ProceedsMid Single Digits to High Single Digits
Service revenue growth(1) High single digit to low teens
CAGR: ~11%
Adjust EPS GrowthHigh Single Digits to low double digits
Adjusted EPS GrowthLow double digits to mid teens
CAGR: ~10%
OFCF as a % of Net Income(2) Greater than 100%
OFCF as a % of Net Income(2) Greater than 100% ~131%
Dividend Payout(2) 55%-60% Dividend Payout Ratio(2) 55% - 60% ~58%
Net Debt to Adjusted EBITDA
Less than 2.5xAdjusted Net Debt to Adjusted EBITDA
Less than 2.5xCurrent:
0.5x
ROIC Increase 50 bps+ ROIC 15% by 2021Current:
12%Source: Bloomberg; dividends reinvested in index or equity; daily returns
2014/12/31 to 2020/12/031. Due to 606 accounting changes, we now use service revenue growth instead of total revenue 2. Period Average : 2015 to 2019, and LTM 3Q 2020 3. Compounded average growth rate used 2014 as base year
2015 Investor Day Current
Evergreen Model Score CardIntroduced in 2015 Average Annual expectation over a 5-7-year period
-20%
30%
80%
130%
180%
230%
20
14
-12
-31
20
15
-12
-31
20
16
-12
-31
20
17
-12
-31
20
18
-12
-31
20
19
-12
-31
RBA S&P 500 TSX
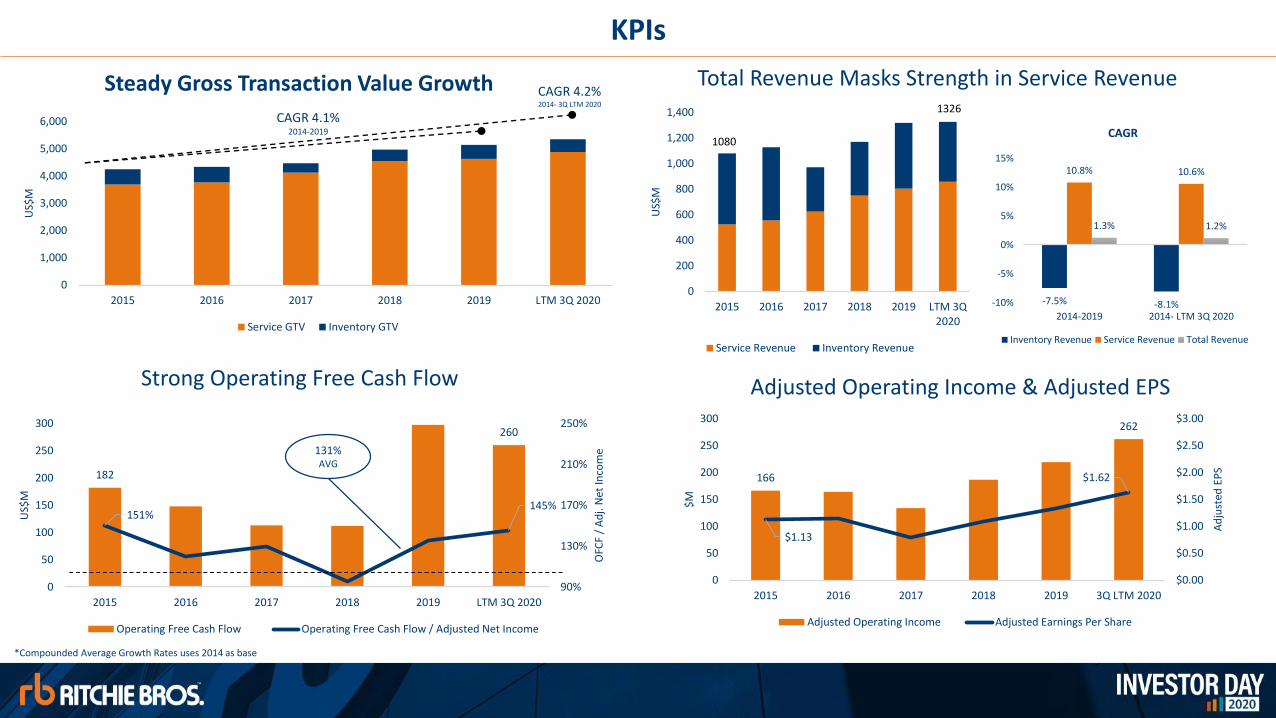
Total Revenue Masks Strength in Service Revenue
Strong Operating Free Cash Flow
182
260
151%145%
90%
130%
170%
210%
250%
0
50
100
150
200
250
300
2015 2016 2017 2018 2019 LTM 3Q 2020O
FCF
/ A
dj.
Net
Inco
me
US$
M
Operating Free Cash Flow Operating Free Cash Flow / Adjusted Net Income
Adjusted Operating Income & Adjusted EPS
*Compounded Average Growth Rates uses 2014 as base
-7.5% -8.1%
10.8% 10.6%
1.3% 1.2%
-10%
-5%
0%
5%
10%
15%
2014-2019 2014- LTM 3Q 2020
CAGR
Inventory Revenue Service Revenue Total Revenue
0
1,000
2,000
3,000
4,000
5,000
6,000
2015 2016 2017 2018 2019 LTM 3Q 2020
US$
M
Service GTV Inventory GTV
CAGR 4.1%2014-2019
CAGR 4.2%2014- 3Q LTM 2020
Steady Gross Transaction Value Growth
131%AVG
0
200
400
600
800
1,000
1,200
1,400
2015 2016 2017 2018 2019 LTM 3Q2020
US$
M
Service Revenue Inventory Revenue
166
262
$1.13
$1.62
$0.00
$0.50
$1.00
$1.50
$2.00
$2.50
$3.00
0
50
100
150
200
250
300
2015 2016 2017 2018 2019 3Q LTM 2020
Ad
just
ed E
PS
$M
Adjusted Operating Income Adjusted Earnings Per Share
KPIs
1326
1080

Cumulative OFCF and Cash Returned to Shareholders
64135
208283
366433
84
84
84
126
179
2015 2016 2017 2018 2019 Q3 2020
Cumulative Dividends Paid Cumulative Shares Repurchased
182330
443555
853
1,106
2015 2016 2017 2018 2019 Q3 2020
Cumulative Operating Free Cash Flow ($m)2015 – Q3 2020
Cumulative Cash Returned to Shareholders2015 – Q3 2020
Over $1.1 billion cumulative OFCF generated since 2015 with > 55% returned to shareholders

Transitioning Post Pandemic to Refreshed Evergreen Metrics
Evergreen Metrics*
Gross TransactionValue Growth
Service Revenue Growth
Operating Income Growth
Operating Free Cash Flow
High single digits to low teens
Low double digits to high teens
Greater than Service Revenue Growth
Greater than 100% of Adjusted Net Income
• North America Growth Strategy• International Growth Strategy• Satellite yard expansion
• IMS gateway to services• RBAS platform adoption• Data Monetization• New Services Offerings
• Enhanced Customer Experience• Modern architecture to scale and
grow profitably• Enhanced sales and operations
productivity
• Effective Working Capital management
* Targeted average annual performance level over a 5-to-7-year period

Capital Allocation Priorities: Flexibility
Debt Flexibility
Strong Operating Cash Flow Generation
Dividend Growth
Share Repurchase
Debt Repayment
Capex, Acquisitions, Partnerships to Fuel Growth
Source of Capital Stakeholder Returns
OFCF > 100% of Adjusted Net Income
Guiding Principles
ROIC > WACC Grow dividend as we grow
The trusted global marketplace
for insights, services, and transaction
solutions for commercial assets.

Closing remarks
Ann FandozziChief Executive Officer
Excited about the future
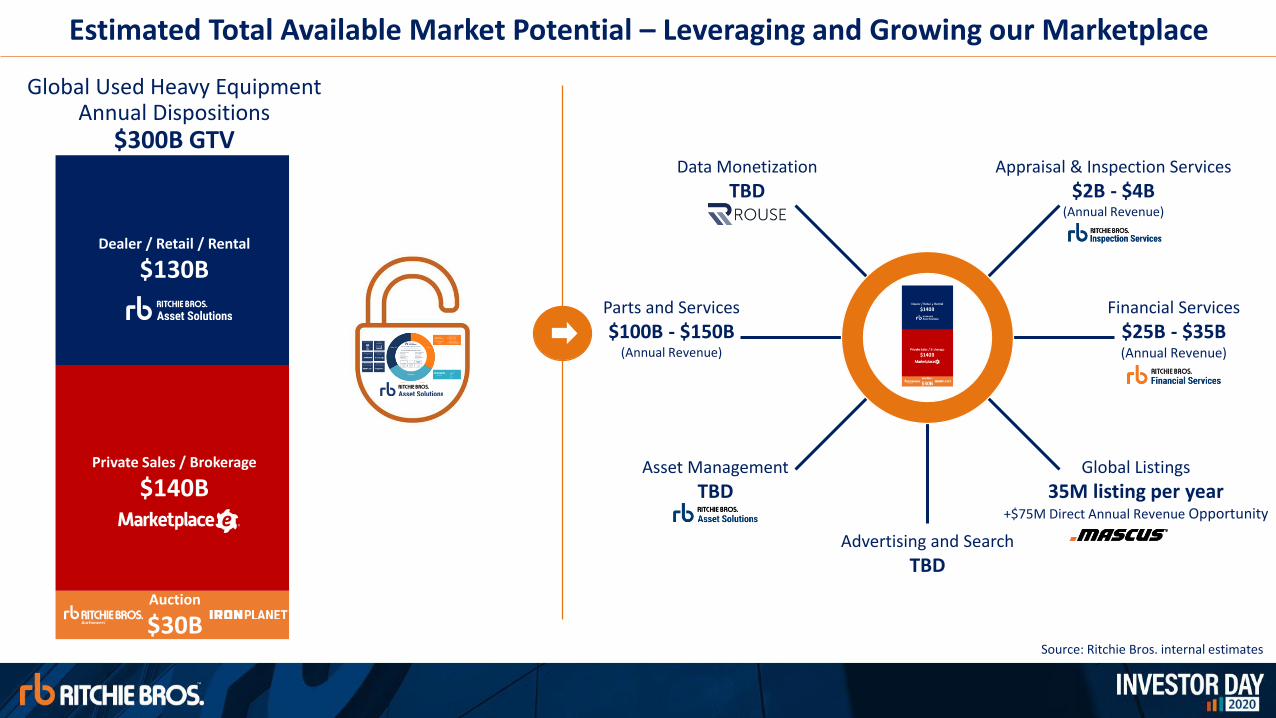
Estimated Total Available Market Potential – Leveraging and Growing our Marketplace
Source: Ritchie Bros. internal estimates
Auction
$30B
Private Sales / Brokerage
$140B
Dealer / Retail / Rental
$130B
Global Used Heavy Equipment Annual Dispositions
$300B GTV
Financial Services
$25B - $35B(Annual Revenue)
Appraisal & Inspection Services
$2B - $4B(Annual Revenue)
Parts and Services
$100B - $150B(Annual Revenue)
Global Listings
35M listing per year +$75M Direct Annual Revenue Opportunity
Data Monetization
TBD
Asset Management
TBD
Advertising and Search
TBD

• Omni channel marketplace positioned for growth
• Market leader with brand, data and scale advantage
• Providing liquidity for used commercial assets through global reach
• Growth agenda supported by strong cashflow profile and balance sheet flexibility
• Learning organization unlocking growth through a test / learn / scale approach
• Experienced leadership team with a history of innovation and success
Ritchie Bros. Investment Highlights
Sharon Driscoll
Chief Financial Officer
Jim Kessler
Chief Operating Officer
Karl Werner
President, International
Kari Taylor
President, North America Sales
Jeff Jeter
President, Global Strategic Accounts
Kieran Holm
President, RB Services
Carmen Thiede
Chief Human Resources Officer
Baron Concors
Chief Information Officer
Matt Ackley
Chief Marketing Officer
Kevin Geisner
Chief Strategy Officer
Darren Watt
Senior Vice President & General Counsel
Question & Answer
Ann. Fandozzi
Chief Executive Officer

Join us on ZOOM
(link no longer valid)
Appendix
US GAAP
Reconciliation of Non-GAAP measures
The following tables reconcile non-GAAP measures referred to in this presentation to the most directly comparable GAAP measure reflected in the Company’s financial statements.

Reconciliation of non-GAAP measures

Reconciliation of non-GAAP measures

Reconciliation of non-GAAP measures

Reconciliation of non-GAAP measures

Reconciliation of non-GAAP measures

Reconciliation of non-GAAP measures