Embed Size (px)
Citation preview

© 2009 The Conference Board, Inc.1 www.conference-board.org
Ken GoldsteinThe Conference Board
Trusted Insights for Business Worldwide
LONG SLOW SLOG
© 2009 The Conference Board, Inc.2 www.conference-board.org
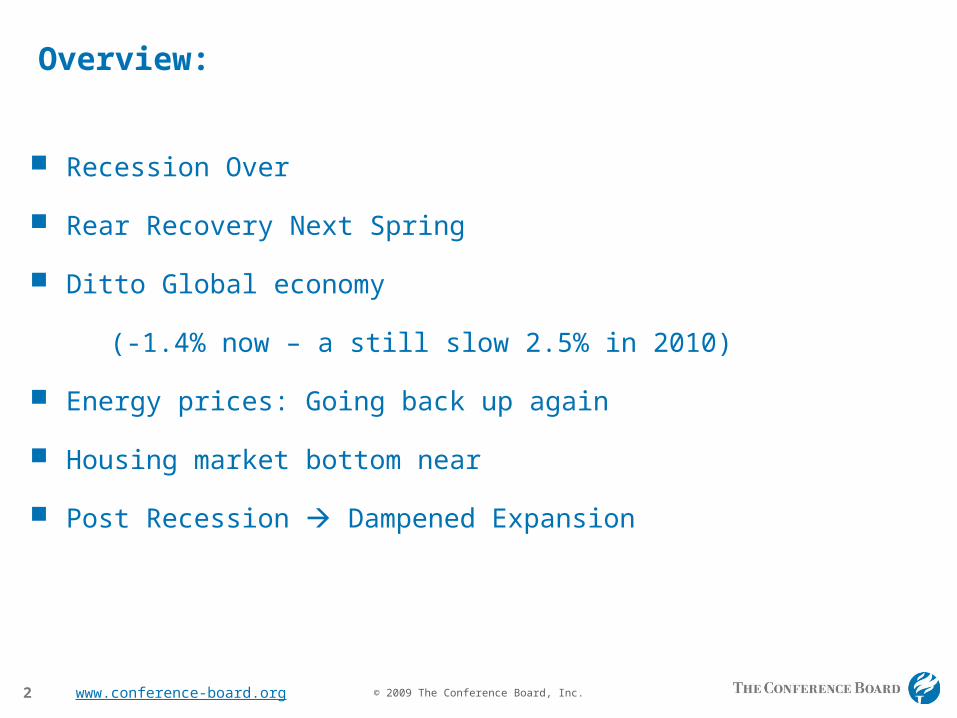
Overview:
Recession Over
Rear Recovery Next Spring
Ditto Global economy
(-1.4% now – a still slow 2.5% in 2010)
Energy prices: Going back up again
Housing market bottom near
Post Recession Dampened Expansion

© 2009 The Conference Board, Inc.3 www.conference-board.org
WHAT IS NOT CHANGING
1) DEMOGRAPHICS
2) PRODUCTIVITY
3) PRICE/COST
4) INTERNATIONALIZATION
© 2009 The Conference Board, Inc.4 www.conference-board.org
WHAT IS CHANGING
1) LOWER MPC
2) CAPITAL AVAILABILITY & COST
3) MORE REGULATION
4) HIGHER TAXES

© 2009 The Conference Board, Inc.5 www.conference-board.org
All Regions Are Slowly Turning
Notes: Shaded areas represent U.S. recessionsSource: The Conference Board
-30
-25
-20
-15
-10
-5
0
5
10
15
1990 1992 1994 1996 1998 2000 2002 2004 2006 2008
U.S. LEI (Jul '09)
Euro Area LEI (Jul '09)
Asia LEI (Jun '09)
6-month annualized percent change
© 2009 The Conference Board, Inc.6 www.conference-board.org
-3.0
-2.0
-1.0
0.0
1.0
2.0
3.0
4.0
5.0
6.0
1999 2000 '01 '02 '03 '04 '05 '06 '07 '08
(%, 3 MOS AVERAGE Y-O-Y)
DPI
PCE
ADJUSTED FORINFLATION Jul. '09
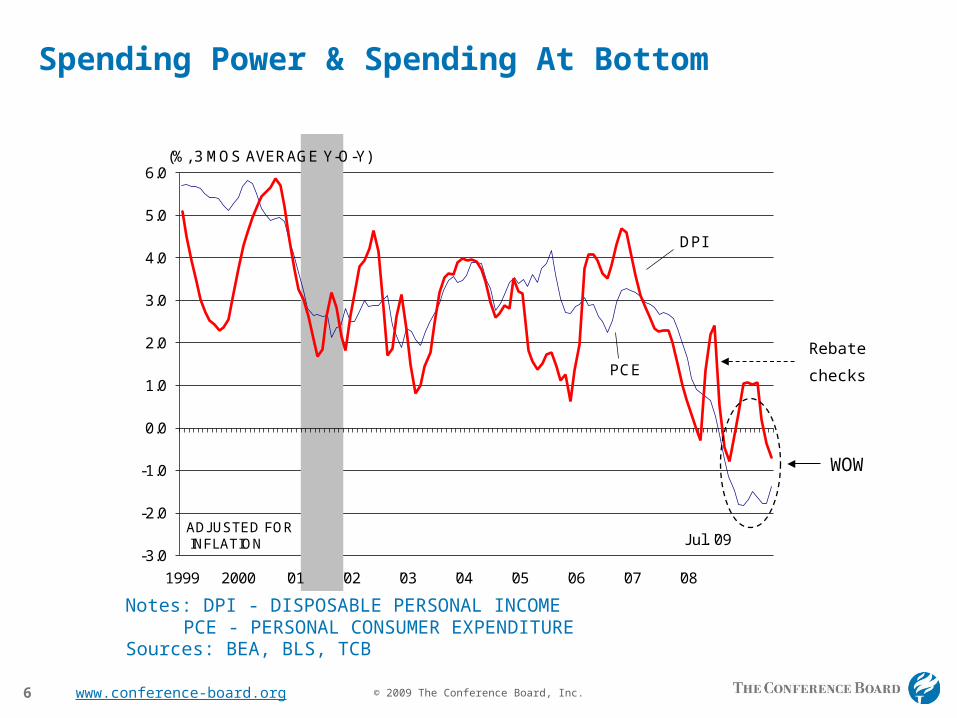
Spending Power & Spending At Bottom
Sources: BEA, BLS, TCBPCE - PERSONAL CONSUMER EXPENDITURE
Notes: DPI - DISPOSABLE PERSONAL INCOME
Rebate
checks
WOW

© 2009 The Conference Board, Inc.7 www.conference-board.org
SPENDING POWER WILL CONSISTENTLY RISE FASTER THAN SPENDING
1.1 1.2 0.5 1.8
2.2 2.1 2.1
1.8 2.6 2.8
2.4
2.3 2.1
-2.2
0.6
-1.2
2.1
1.9 1.2
-2.0
1.9
2.7 3.0
1.0
3.7 3.1
-4
-2
0
2
4
6
3Q-09 4Q-09 1Q-10 2Q-10 3Q-10 4Q-10 1Q-11 2Q-11 3Q-11 4Q-11 1Q-12 2Q-12 3Q-12
Sources:TCB
(% Change, Seasonally Adjusted Annual Rates) FORECAST
DISPOSABLE PERS INCOME
PERS CONSUMPTION EXP.

© 2009 The Conference Board, Inc.8 www.conference-board.org
HIGHER GAS PRICES DRIVE DEMAND FOR FUEL EFFICIENCY
1.1 1.2
0.5
1.8
2.2 2.1 2.1 1.8
2.6 2.8
2.4 2.3 2.1
11.9
10.4 10.0
10.3 11.2
12.0 12.8 13.4 14.0
14.5 15.1 15.3 15.6
0
4
8
12
16
20
0
1
2
3
4
5
3Q-09 4Q-09 1Q-10 2Q-10 3Q-10 4Q-10 1Q-11 2Q-11 3Q-11 4Q-11 1Q-12 2Q-12 3Q-12
Sources:TCB
(% Change, Seasonally Adjusted Annual Rates) FORECAST
LIGHT VEHICLE SALES ()
PERS CONSUMPTION EXP. ()
(Mil. Units)
© 2009 The Conference Board, Inc.9 www.conference-board.org
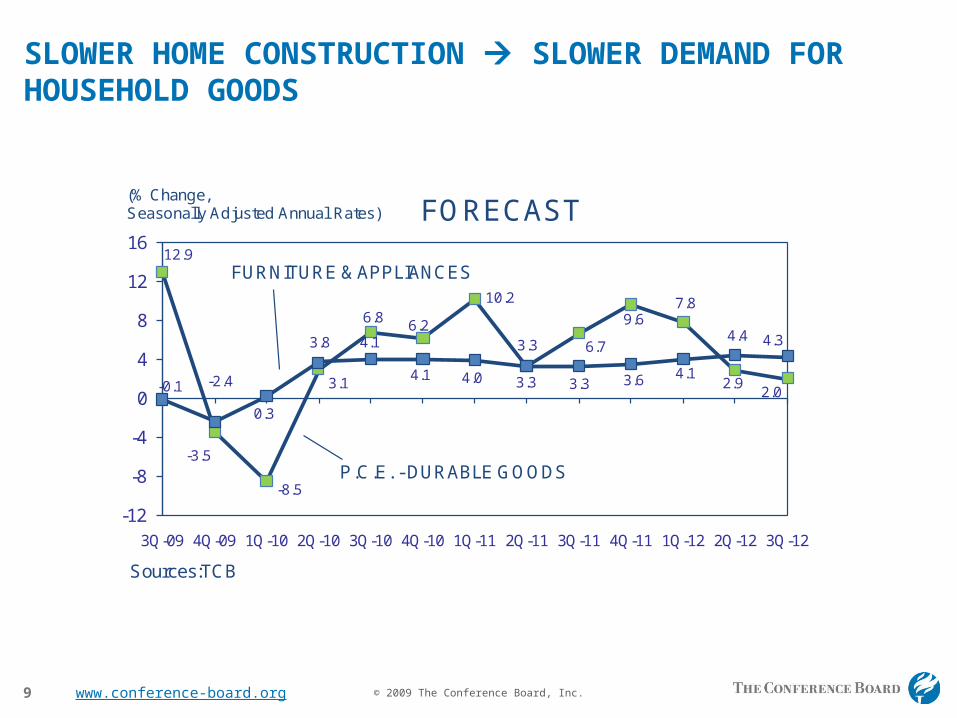
SLOWER HOME CONSTRUCTION SLOWER DEMAND FOR HOUSEHOLD GOODS
12.9
-3.5
-8.5
3.1
6.8 6.2
10.2
3.3 6.7
9.6 7.8
2.9 2.0 -0.1 -2.4
0.3
3.8 4.1
4.1 4.0 3.3 3.3 3.6 4.1
4.4 4.3
-12
-8
-4
0
4
8
12
16
3Q-09 4Q-09 1Q-10 2Q-10 3Q-10 4Q-10 1Q-11 2Q-11 3Q-11 4Q-11 1Q-12 2Q-12 3Q-12
Sources:TCB
(% Change, Seasonally Adjusted Annual Rates) FORECAST
P.C.E. - DURABLE GOODS
FURNITURE & APPLIANCES
© 2009 The Conference Board, Inc.10 www.conference-board.org
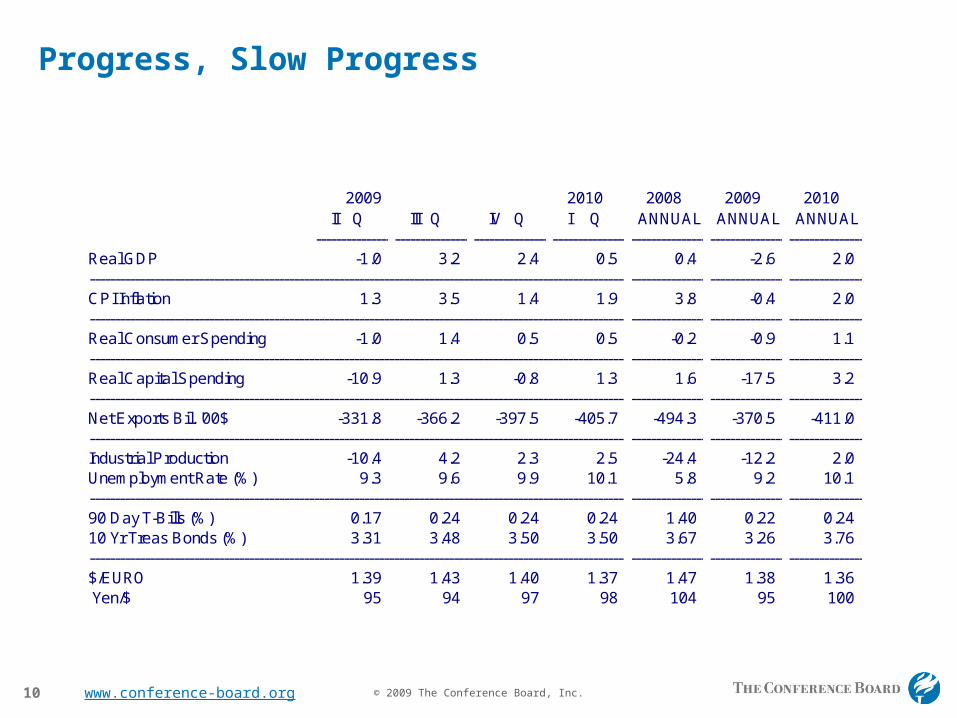
Progress, Slow Progress
2009 2010 2008 2009 2010 II Q III Q IV Q I Q ANNUAL ANNUAL ANNUAL---------------------------------------------------------------------------------------------------------------------------------------------------
Real GDP -1.0 3.2 2.4 0.5 0.4 -2.6 2.0--------------------------------------------------------------------------------------------------------------------------------------------------------------------------------------------------------------------------------------------------------------------------------------------------------------CPI Inflation 1.3 3.5 1.4 1.9 3.8 -0.4 2.0--------------------------------------------------------------------------------------------------------------------------------------------------------------------------------------------------------------------------------------------------------------------------------------------------------------Real Consumer Spending -1.0 1.4 0.5 0.5 -0.2 -0.9 1.1--------------------------------------------------------------------------------------------------------------------------------------------------------------------------------------------------------------------------------------------------------------------------------------------------------------Real Capital Spending -10.9 1.3 -0.8 1.3 1.6 -17.5 3.2--------------------------------------------------------------------------------------------------------------------------------------------------------------------------------------------------------------------------------------------------------------------------------------------------------------Net Exports Bil. '00$ -331.8 -366.2 -397.5 -405.7 -494.3 -370.5 -411.0--------------------------------------------------------------------------------------------------------------------------------------------------------------------------------------------------------------------------------------------------------------------------------------------------------------Industrial Production -10.4 4.2 2.3 2.5 -24.4 -12.2 2.0Unemployment Rate (%) 9.3 9.6 9.9 10.1 5.8 9.2 10.1--------------------------------------------------------------------------------------------------------------------------------------------------------------------------------------------------------------------------------------------------------------------------------------------------------------90 Day T-Bills (%) 0.17 0.24 0.24 0.24 1.40 0.22 0.2410 Yr Treas Bonds (%) 3.31 3.48 3.50 3.50 3.67 3.26 3.76--------------------------------------------------------------------------------------------------------------------------------------------------------------------------------------------------------------------------------------------------------------------------------------------------------------$/EURO 1.39 1.43 1.40 1.37 1.47 1.38 1.36 Yen/$ 95 94 97 98 104 95 100
© 2009 The Conference Board, Inc.11 www.conference-board.org
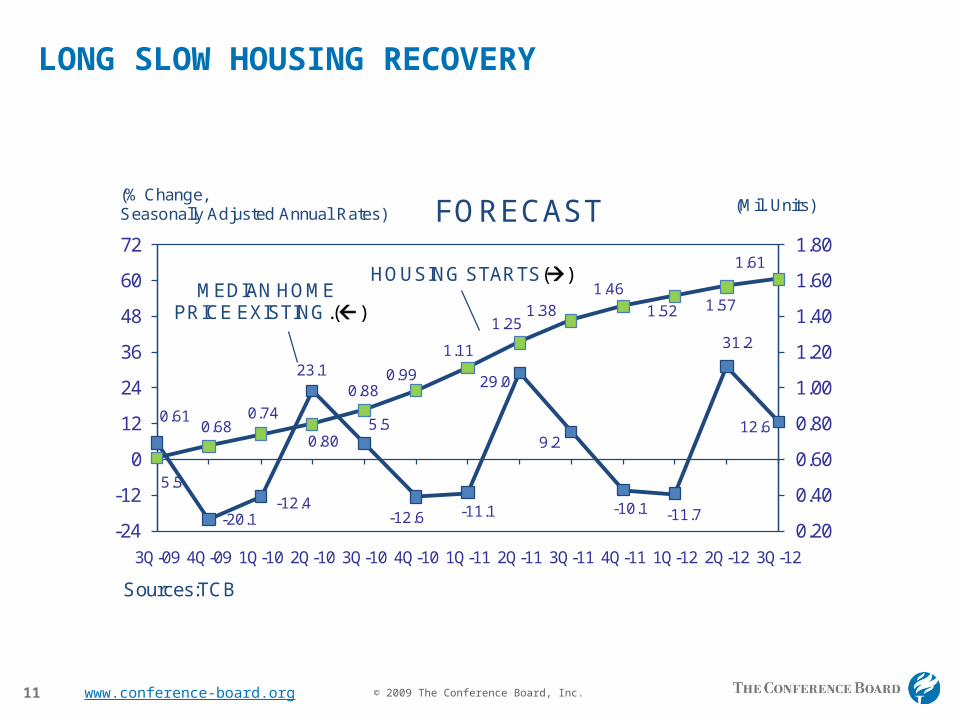
LONG SLOW HOUSING RECOVERY
5.5
-20.1 -12.4
23.1
5.5
-12.6 -11.1
29.0
9.2
-10.1 -11.7
31.2
12.6 0.61
0.68 0.74
0.80
0.88 0.99
1.11
1.25 1.38
1.46
1.52 1.57
1.61
0.20
0.40
0.60
0.80
1.00
1.20
1.40
1.60
1.80
-24
-12
0
12
24
36
48
60
72
3Q-09 4Q-09 1Q-10 2Q-10 3Q-10 4Q-10 1Q-11 2Q-11 3Q-11 4Q-11 1Q-12 2Q-12 3Q-12
Sources:TCB
(% Change, Seasonally Adjusted Annual Rates) FORECAST
MEDIAN HOMEPRICE EXISTING.()
HOUSING STARTS()
(Mil. Units)

© 2009 The Conference Board, Inc.12 www.conference-board.org
MATERIAL COST NOT A PROBLEM POST-RECESSION
-6
-4
-2
0
2
4
6
8
3Q-09 4Q-09 1Q-10 2Q-10 3Q-10 4Q-10 1Q-11 2Q-11 3Q-11 4Q-11 1Q-12 2Q-12 3Q-12
Sources:TCB
MATERIAL COST NOT A PROBLEM POST-RECESSION
CORE CPI
PPI finished goods
FORECAST(% Change, Seasonally Adjusted Annual Rates)

© 2009 The Conference Board, Inc.13 www.conference-board.org
Source: TCB, Freddie Mac “Conventional Mortgage Home Price Index”
South Atlantic
POST HURRICANE CONTRACTION
-40
-35
-30
-25
-20
-15
-10
-5
0
5
10
May
-06
Jul-
06
Sep
-06
No
v-06
Jan
-07
Mar
-07
May
-07
Jul-
07
Sep
-07
No
v-07
Jan
-08
Mar
-08
May
-08
Jul-
08
Sep
-08
No
v-08
Jan
-09
Mar
-09
May
-09
%(% change y-o-y) (monthly)Employment Trends Index
Rest of U.S.
South Atlantic
-40
-30
-20
-10
0
10
20
30
40
May
-06
Jul-
06
Sep
-06
No
v-06
Jan
-07
Mar
-07
May
-07
Jul-
07
Sep
-07
No
v-07
Jan
-08
Mar
-08
May
-08
Jul-
08
Sep
-08
No
v-08
Jan
-09
Mar
-09
May
-09
Jul-
09
% (% change y-o-y) (monthly)HWI Online
Rest of U.S.
South Atlantic
-80
-70
-60
-50
-40
-30
-20
-10
0
10
20
30
40
May
-06
Jul-
06
Sep
-06
No
v-06
Jan
-07
Mar
-07
May
-07
Jul-
07
Sep
-07
No
v-07
Jan
-08
Mar
-08
May
-08
Jul-
08
Sep
-08
No
v-08
Jan
-09
Mar
-09
May
-09
Jul-
09
% (% change y-o-y) (monthly)Consumer Confidence Index
Rest of U.S.
South Atlantic
-10
-5
0
5
10
15
2Q-0
6
3Q-0
6
4Q-0
6
1Q-0
7
2Q-0
7
3Q-0
7
4Q-0
7
1Q-0
8
2Q-0
8
3Q-0
8
4Q-0
8
1Q-0
9
2Q-0
9
% (% change y-o-y) Home Price (quarterly)
Rest of U.S.
South Atlantic

© 2009 The Conference Board, Inc.14 www.conference-board.org
Source: TCB, Freddie Mac “Conventional Mortgage Home Price Index”
Mountain
SOFTENED CONFIDENCE / JOB DECLINE
-40
-35
-30
-25
-20
-15
-10
-5
0
5
10
May
-06
Jul-
06
Sep
-06
No
v-06
Jan
-07
Mar
-07
May
-07
Jul-
07
Sep
-07
No
v-07
Jan
-08
Mar
-08
May
-08
Jul-
08
Sep
-08
No
v-08
Jan
-09
Mar
-09
May
-09
%(% change y-o-y) (monthly)Employment Trends IndexRest of U.S.
Mountain
-50
-40
-30
-20
-10
0
10
20
30
40
50
May
-06
Jul-
06
Sep
-06
No
v-06
Jan
-07
Mar
-07
May
-07
Jul-
07
Sep
-07
No
v-07
Jan
-08
Mar
-08
May
-08
Jul-
08
Sep
-08
No
v-08
Jan
-09
Mar
-09
May
-09
Jul-
09
% (% change y-o-y) (monthly)HWI Online
Rest of U.S.
Mountain
-80
-70
-60
-50
-40
-30
-20
-10
0
10
20
30
40
May
-06
Jul-
06
Sep
-06
No
v-06
Jan
-07
Mar
-07
May
-07
Jul-
07
Sep
-07
No
v-07
Jan
-08
Mar
-08
May
-08
Jul-
08
Sep
-08
No
v-08
Jan
-09
Mar
-09
May
-09
Jul-
09
% (% change y-o-y) (monthly)Consumer Confidence Index
Rest of U.S.
Mountain
-10
-5
0
5
10
15
2Q-0
6
3Q-0
6
4Q-0
6
1Q-0
7
2Q-0
7
3Q-0
7
4Q-0
7
1Q-0
8
2Q-0
8
3Q-0
8
4Q-0
8
1Q-0
9
2Q-0
9
% (% change y-o-y) Home Price (quarterly)
Rest of U.S.
Mountain

© 2009 The Conference Board, Inc.15 www.conference-board.org
Losers and winners in manufacturing and services often the same
-1.2
-0.8
-0.4
0.0
0.4
0.8
1.2
1.6
GoodsCore services excludes health, education and government
Growth in jobs (2008-2015)
PercentD
etro
itLo
s A
ngel
esA
tlant
aB
irmin
gham
Min
neap
olis
Bos
ton
Phi
lade
lphi
aB
altim
ore
Chi
cago
Nas
hvill
eP
hoen
ixK
ansa
s C
ityS
t. Lo
uis
San
Die
goM
iam
iD
enve
rS
eattl
eS
an F
ranc
isco
New
Yor
k C
ityD
alla
sH
oust
on
Sources:
BLS, The Conference Board

© 2009 The Conference Board, Inc.16 www.conference-board.org
Service jobs decline less percentage-wise, but recovery may take longer
-2.0
-1.5
-1.0
-0.5
0.0
0.5
1.0
1.5
2.0
2.5
3.0
3.5
1980-20082008-2015
Average annual change
Employment by industry
Adm
inis
trativ
e
ser
vice
sR
ecre
atio
nP
rofe
ssio
nal
serv
ices
Con
stru
ctio
nA
ccom
mo-
datio
nsO
ther
ser
vice
sM
anag
emen
t se
rvic
esFi
nanc
ial
serv
ices
Min
ing
Ret
ail t
rade
Who
lesa
le tr
ade
Util
ities
Man
ufac
turin
g
Sources:
BLS, The Conference Board

© 2009 The Conference Board, Inc.17 www.conference-board.org
-1
0
1
2
3
4
5
88 90 92 94 96 98 00 02 04 06 08
October1987Crash
JunkBondCrashandFridaythe 13thmini crash
AsianCrisis
Long TermCapital
CorporateAccountingScandals
Burstingof EquityBubble
Credit CrunchFinancial Instability Index
8/3/2009
Bear SternsCollapse
Lehman BrothersCollapse
Wealth destruction phase Cresting?
Note: Shaded areas represent U.S. recessions.
Sources: FRB, The Conference Board
© 2009 The Conference Board, Inc.18 www.conference-board.org
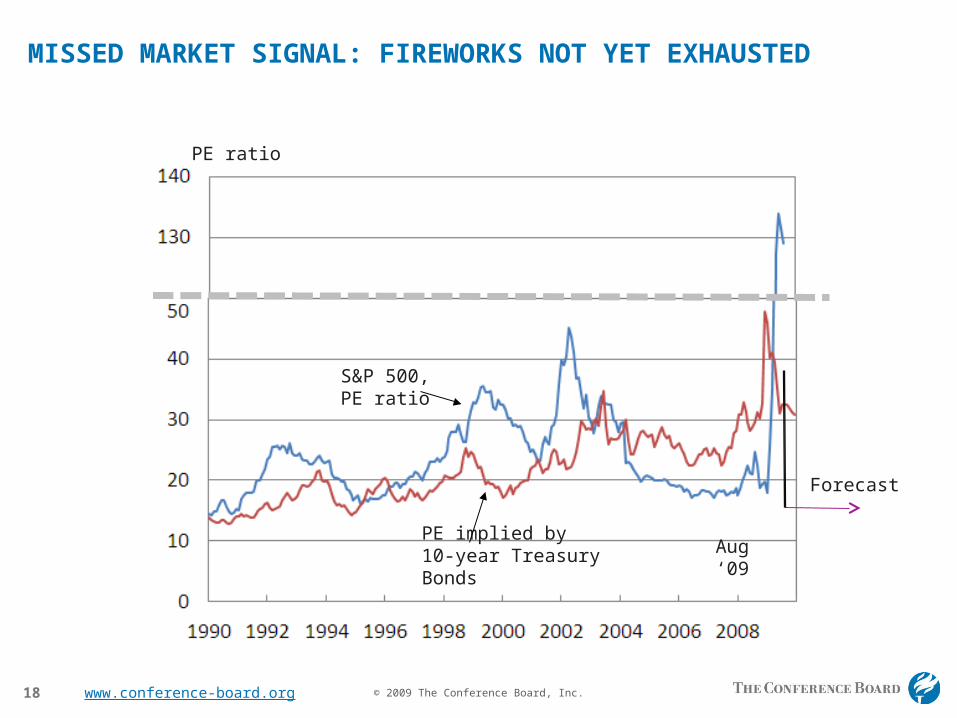
MISSED MARKET SIGNAL: FIREWORKS NOT YET EXHAUSTED
Aug ‘09
Forecast
S&P 500,PE ratio
PE implied by10-year Treasury Bonds
PE ratio

© 2009 The Conference Board, Inc.19 www.conference-board.org
Financing Gap: Danger Signal
-400
-300
-200
-100
0
100
200
300
400
80 85 90 95 00 05
(Bil $)
4Q '08
Note: Proxy for external funding of investmentSource: FRB, The Conference Board

www.conference-board.org
The US Consumer
Lynn Franco
Director, Consumer Research Center
September 2009

© 2009 The Conference Board, Inc.21 www.conference-board.org
Rapid consumer recovery remains an unlikely scenario as demand constraints persist
Supply constraints are improving as inventories, production, trade and employment numbers are coming in better
… but demand side remains constrained as discrepancy between willingness and ability to spend persists
Most channels for rapid recovery of consumer demand are clogged as rise in compensation and income and access to credit remain weak
Holiday season likely to be a challenging one for retailers

© 2009 The Conference Board, Inc.22 www.conference-board.org
Present Situation and Expectations Indexes suggest the worst is behind us
0
20
40
60
80
100
120
140
160
180
200
19
67
19
68
19
69
19
70
19
71
19
72
19
73
19
74
19
75
19
76
19
77
19
78
19
79
19
80
19
81
19
82
19
83
19
84
19
85
19
86
19
87
19
88
19
89
19
90
19
91
19
92
19
93
19
94
19
95
19
96
19
97
19
98
19
99
20
00
20
01
20
02
20
03
20
04
20
05
20
06
20
07
20
08
20
09
Index, 1985 = 100
Present Situation Expectations
Sources: NBER; TNS; The Conference Board

© 2009 The Conference Board, Inc.23 www.conference-board.org
Income expectations remain quite negative
0
5
10
15
20
25
30
35
40
1967
1968
1969
1970
1971
1972
1973
1974
1975
1976
1977
1978
1979
1980
1981
1982
1983
1984
1985
1986
1987
1988
1989
1990
1991
1992
1993
1994
1995
1996
1997
1998
1999
2000
2001
2002
2003
2004
2005
2006
2007
2008
2009
Percent Expectations for Six Months Hence: Income
Income Increase Income Decrease
Sources: NBER; TNS; The Conference Board

© 2009 The Conference Board, Inc.24 www.conference-board.org
Household net worth has declined dramatically
30
40
50
60
70
1998 1999 2000 2001 2002 2003 2004 2005 2006 2007 2008 2009
Trillions of U.S. dollars, NSA
Sources: FRB; The Conference Board
Households and non profit organizationsNet worth = assets (tangible plus financial) minus liabilities
Q3 2007$65.3 trillion
Q1 2009$51.1 trillion

© 2009 The Conference Board, Inc.25 www.conference-board.org
Consumers saving more, but for how long?
0%
2%
4%
6%
8%
10%
12%
14%
1970 1973 1976 1979 1982 1985 1988 1991 1994 1997 2000 2003 2006 2009
Percent
Sources: BEA; The Conference Board
Personal saving as a percentage of disposable personal income - quarterly

© 2009 The Conference Board, Inc.26 www.conference-board.org
The era of rapid home equity extraction has ended
-800
-600
-400
-200
0
200
400
600
1998 1999 2000 2001 2002 2003 2004 2005 2006 2007 2008 2009
Billions of US dollars
Sources: FRB; The Conference Board
Net equity extraction: Flow of home mortgages minus residential investment

© 2009 The Conference Board, Inc.27 www.conference-board.org
-20
-10
0
10
20
30
40
50
60
70
80
1998 1999 2000 2001 2002 2003 2004 2005 2006 2007 2008 2009
*Selected domestic banks in the United States
Sources: FRB; The Conference Board
Net percentage (tightened minus eased)
Percent
"Over the past three months, how have your bank's* credit standards for approving applications changed?"
Credit conditions have eased, but remain tight
Credit Cards
OtherConsumer
Loans

© 2009 The Conference Board, Inc.28 www.conference-board.org
The Conference Board Employment Trends Index™ signals end of massive job cuts
104
108
112
116
120
124
128
132
136
140
72
76
80
84
88
92
96
100
104
108
112
116
120
124
128MillionsIndex, 1996 = 100 Employment Trends Index (ETI) Total Employed
Sources: BLS; The Conference Board

© 2009 The Conference Board, Inc.29 www.conference-board.org
Compensation is expected to grow very slowly
0
4
8
12
16
20
24
28
32
Percent
Sources: NFIB; The Conference Board
Net percent (“increase” minus “decrease”) of firms planning to raise worker compensation

© 2009 The Conference Board, Inc.30 www.conference-board.org
Recovery in consumer spending is slow compared to previous recoveries
-10
-8
-6
-4
-2
0
2
4
6
8
10
Q1 '80
Q3 '80
Q1 '81
Q3 '81
Q1 '82
Q3 '82
Q1 '83
Q3 '83
Q1 '90
Q3 '90
Q1 '91
Q3 '91
Q1 '92
Q3 '92
Q1 '00
Q3 '00
Q1 '01
Q3 '01
Q1 '02
Q3 '02
Q1 '08
Q3 '08
Q1 '09
Q3 '09
Q1 '10
Q3 '10
1980-1983 1990-1992 2000-2002 2008-2010
ForecastReal personal consumption expenditures
Quarter to quarter annual percentage change

© 2009 The Conference Board, Inc.31 www.conference-board.org
No clear leaders in pickup on consumer spending
Volatility of spending will remain with consumers' low ability to spend
Bargain-hunting mode will prevail for remainder of 2009, and especially for holiday season
As economy improves, spending on “affordable” discretionary items will likely lead the way
But large ticket items will remain slow as long as personal balance sheets remain weak – exception “cash for clunkers”
Rise in gas and commodity prices can hold consumers back further