Embed Size (px)
Citation preview

100%
95%
90%
85%
Large BOEur
Large BOUS
MMBOEUR
MM BOUS
VentureCapital
Early Secondaries
95%96%
92%93%
89%
95%
80%
2009 2010 2011e
20%
10%
0%
-10%
-20%
5.3%
14%
2%6.3%
11.5%
9%
STRATEGY Q1 10 Q2 10 Q3 10 Q4 10 FY 10
Large BO +4.4 % +2.8% +7.2% +10.4% +27.0%
Special Sit.
MM BO
Energy
VC
+2.1 %
+3.1 %
+1.9 %
+2.8 %
+4.6%
+4.4%
+1.8%
+0.4%
+4.4%
+4.7%
+3.6%
+2.5%
+9.0%
+7.0%
+7.8%
+4.2%
+21.5%
+20.6%
+15.9%
+10.2%
100
90
80
70
60
50
40Jun SepSep DecDec MarMar Jun DecJun Sep Mar
NAV IndexSecondary Pricings
-5% -5%
-35%
2009 2010 2011
TH
E T
RIA
GO
QU
AR
TE
RL
Y -
JU
NE
20
11
-
THE TRIAGO QUARTERLYJune 2011
Dear Reader,
A growing number of limited partners are receiving net cash from investments, after years of net outflow. At the same time, general partners are locking in significant carried interest through trade sales and IPOs. And often these same general partners are using record low interest rates, easier credit terms, and higher debt levels to make clever deals. But it’s a market of “haves” and “have-nots.”
Overall, private equity remains burdened by poorly performing investments made at the height of the credit bubble from 2005 to 2008. These vintages hold the bulk of private equity’s dry powder and most of its unrealized investments. The impact these overhangs have on investors raise questions about everything from fundraising to investment processes and fund strategy. All of the above are issues we address in The Triago Quarterly.
As always, we hope the information found here will help you make informed decisions.
Sincerely,
Antoine DréanTriago Founder and Chief Exectutive
Analysis: Rocky Road Ahead
INSIDE
...AS SECONDARY PRICING ANTICIPATES MORE MARKUPS...
...AND CALL ESTIMATE SPELLS FUNDRAISING TROUBLE.
Calls
Distributions
NAV Evolution
Average Top Pricing January - June
Dry powder, portfolio inventory and lack of carry imply difficult times
Exaggerated exits, debt cost, falling equity, sub-par managers, troubled vintages, China versus the U.S.
Are investors radically changing habits?Strategy Shift Roundtable
Private Equity Blog
1
Source: Trago’s proprietary data.
ISS
UE
4
NET ASSET VALUES NEAR PRE-CRISIS LEVELS...
SNAPSHOT

TH
E T
RIA
GO
QU
AR
TE
RL
Y -
JU
NE
20
11
-
2
MA
RK
ET
SH
AP
SH
OT
AN
ALY
SIS
Market Snapshot Analysis:Rocky Road AheadNet asset values and secondary prices advance; falling deal multiples help purchasers, but not distributions; dry powder, portfolio inventory and lack of carry imply difficult times.
Driven in part by strong gains in productivity in the United States, Europe and Asia, net asset value across all categories of private equity funds soared 7 percent in the three months between October and December 2010. The latest gain marks a cumulative 40.1 percent increase over seven consecutive quarters, and puts private equity portfolio value nearly on par with the pre-financial crisis peak, achieved in December 2007.
An eighth consecutive rise for net asset value looks likely, based on initial reports of private equity fund valuations for the first quarter of 2011, as well as first quarter earnings increases for listed comparables of underlying assets. But despite the positive net asset value trend, funds from 2005 to 2008 - when record sums were both raised and invested - remain far from the hurdle rates that will trigger carried interest for general partners. This spells trouble for exit volume, cash distributions and fundraising in the second half of this year.
One surprise: buyout purchase price multiples have declined over the past two quarters. The average multiple for large corporate buyouts, according to Standard & Poor’s Leveraged Commentary and Data, was 8.4 times EBITDA in the first quarter of this year. This follows a post-financial crisis high of 9.1 times EBITDA in the third quarter of 2010 - a level surpassed only at the height of the credit bubble in 2007 and 2008.
While dropping purchase price multiples are welcome relief for fund managers looking to invest the industry’s still huge amount of unspent dry powder - estimated at $400 billion for buyout funds as of June - the lower deal multiple will almost certainly make it harder to unload the industry’s record number of unrealized investments. This inventory is estimated at more than 6,000 companies and is concentrated in buyout funds from the troubled 2005 to 2008 credit bubble vintages, when deal multiples were, for the most part, considerably higher than today’s averages.
With little prospect of carried interest in the near term, many general partners managing private equity funds from the hardest hit vintages are likely to hold on to unrealized investments, focusing instead on deploying dry powder. The bulk of the industry’s dry powder, also from the credit bubble years, is fast approaching investment period deadlines, after which fees can generally no longer be collected on un-invested capital.
Triago estimates 2011 will be the fourth cash-negative year in a row for most limited partners.
In many cases, the revival of exit markets in the fourth quarter of 2010 and the first five months of this year meant that private equity funds returned net cash to limited partners for the first time in three years. But if the call/distribution ratio resulted in net cash for limited partners, it was often because their private equity investments were less concentrated in credit bubble vintages.
Triago estimates cash distributions to limited partners this year will amount to 9 percent of total capital commitments - two-fifths more than last year’s level - while cash calls will rise a fifth to 14 percent of total capital commitments. This would make 2011 the fourth cash-negative year in a row for most limited partners.
While fundraising volume in 2011 will probably register only a modest improvement over last year’s six-year low of $200 billion, the secondary market is likely to hit record volume of $25 billion or more, as the number of active participants grows. The lack of net cash being returned to limited partners is one factor that has been driving this growth, with LPs - notably a growing number of U.S. public pension funds - choosing to actively manage their portfolios and raise funds for private equity reinvestment through secondary sales. On the buy side, some $15 billion has been raised for secondary funds so far this year with the total in 2011 expected to exceed $22 billion, the double of last year’s level and 13 percent more than the record in 2007.
Reflecting both strong demand and an expectation that private equity portfolio mark-ups will continue, the average top bid in the secondary market is now at a 5 percent discount to December net asset values, versus a 6 percent discount to September values at the start of this year. Some funds have even recently sold at single-digit premiums to December net asset values.

TH
E T
RIA
GO
QU
AR
TE
RL
Y -
JU
NE
20
11
-
3
RO
UN
DTA
BL
E
RoundtableChanging Private EquityPost-financial crisis, has there been a shift in the funds LPs choose and in the way LPs approach investing?
TRIAGO: There are a lot of disappointed LPs today, but to what extent are LPs fundamentally re-examining their buyout-anchored portfolios?
Tom Keck, Chief Investment Officer of StepStone Group: Overall, the likelihood of seeing major change to the traditional leveraged buyout model has receded significantly in the past year. Both pre-crisis and today, a large investor would typically hold 150 to 250 funds. Historically, roughly 60 to 70 percent of value
would be in mega and large funds. It is remarkable, post-financial crisis, the degree to which the value of the typical portfolio has bounced back. With the run-up in valuations in the second half of 2010, a lot of bubble-era funds are now valued around cost. GPs have restructured debt maturities to the point where there is likely to be some equity value, and many deals done since the fall of Lehman Brothers are performing well. Comparing this situation with the disaster many expected, private equity is actually breathing a sigh of relief.
Jan Faber, Managing Director of Bregal Investments: When it comes to funds that appeal to LPs, and LP investment processes, we don’t expect big change either. But certainly LPs are forcing a significant shakeout among funds. At Bregal, we are doing a thorough review to determine which GP groups we will continue investing with and where
we will end relationships. The most significant financial crisis related development here are the three filters we are using to make decisions. We look at whether GPs maintained investment discipline in the tricky couple of years leading up to financial meltdown; how GPs restructured troubled deals post-crisis; and finally, to what extent GPs did - or did not - take advantage of the buying opportunities in 2008 and 2009, when multiples were low and dry powder plentiful.
Adalbjörn Stefansson, Head of Buyout Fund Investments at Skandia Life: The basic modus operandi for LPs is pretty much the same, but there are a couple of areas where we can see clear signs of change today compared to pre-crisis private equity strategy. The most noteworthy trend driving new investment by
LPs is the belief that emerging markets will offer the best returns going forward. Another clear trend is mega fund skepticism.
TRIAGO: Jan and Tom, would you agree that investor desire to capture emerging market growth and a distrust of mega funds are the two biggest trends influencing private equity portfolio construction today?
JF: I would agree. But we believe the fall from grace of large and mega funds could be just a short term fad. We actually see excellent opportunities for these funds. The emphasis on emerging markets is a real long term change. We certainly expect much slower growth going forward in the West’s developed economies than we did pre-financial crisis, and we plan to invest significantly more in emerging markets.
TK: The key trend which I see becoming increasingly entrenched globally, and which encompasses Adalbjörn’s points, is greater specialization. We are seeing growing numbers of GPs with focused expertise in sectors from retail to energy and even in specialized geographies. LPs
Here’s an interesting statistic: last year, buyout fundraising in the U.S. - the largest private equity market in the world - fell below 50 percent of the total raised for the asset class for the first time in a decade. This one-third drop in buyout market share, to 49 percent of annual capital raised, according to data provider Pitchbook, could be an early sign that the domination of the buyout model - at least the plain vanilla variety - is ending. Certainly, the growing popularity of specialized funds, emerging markets, direct investment and co-investment is an indication that less standard strategies are coming to the fore after the financial crisis decimated the returns of many traditional private equity funds.
Triago invited three high-profile limited partners to discuss the degree to which LPs are tempted by new types of private equity funds and investment processes post-financial crisis. From their observations it is clear that while private equity investment trends are shifting direction, investor perceptions and expectations remain surprisingly the same.
TH
E T
RIA
GO
QU
AR
TE
RL
Y -
JU
NE
20
11
-
4
RO
UN
DTA
BL
E
correctly regard hard-to-come-by expertise as evidence that a GP can replicate outperformance in an environment where it is likely to be harder to make money than it was in the past.
AS: : I’ll just interject here. Regarding the appeal of GP specialization - it is worth highlighting a counter-trend that also has potential to gain traction with LPs. For lack of a better term, I’ll call it the “breakaway” GP strategy. There are about 10 GPs in this category globally, including those that recently listed in the US. These GPs are increasing the breadth of their offerings, if not the size of their individual funds. They are breaking away from competitors - and in the process trying to offer LPs something unique - by building sectoral and geographic coverage and overall scale to such a degree that it is difficult for others to follow them down this path and compete successfully.
TK: I completely agree. Blackstone, Carlyle, TPG, Providence, Ares and Oaktree are a few of the GPs developing the breakaway strategy to one degree or another. Ideally, what they offer is a global brand that brings in one-of-a-kind transactions, with specialized teams able to execute and add value to companies across a broad range of private equity strategies. In theory, this story hangs together. But whether having such a wide array of strategies and expertise under one roof results in a lack of focus, a lack of alignment and a
corresponding inability to produce attractive returns is what concerns LPs today.
AS: Yes, the jury is still out on the breakaway strategy.
AS: There is more scrutiny and thoughtfulness in terms of analyzing the use of debt. But the bottom line is that there is no substitute for old-fashioned thoroughness and skepticism, with the latter perhaps more important today than ever before. There isn’t a private placement memorandum out there that does not talk about “operational value creation.” This clearly begs the question of how real such expertise is.
JF: People are always talking about sector expertise and operational value-add, but when evaluating ability to produce outperformance, we are putting a particular focus on two areas we spent less time looking at in the past - deal origination and manager creativity. We want GPs to perfect their origination model, whether they are generalists or sector specialists. The logic is simple - if
TRIAGO: Inability to distinguish between GP teams with real operational expertise and those that simply surfed on easy credit has been blamed for many of the poorer LP investment decisions in recent years. Are LPs changing evaluation practices to avoid funds that rely too heavily on financial engineering?
Mar
c Ty
ler
Nob
lmea
n

TH
E T
RIA
GO
QU
AR
TE
RL
Y -
JU
NE
20
11
-
5
RO
UN
DTA
BL
E
“Limited partner direct investment programs will end in tears.”
Adalbjörn Stefansson, Skandia Life
TRIAGO: What is the most important thing to say about how LP priorities are changing when it comes to how funds are structured?
you buy well, it is easier to sell well. Manager creativity is an ability to find value where others don’t see it. For example, we are an investor in a small Nordic fund that bought four aviation ground handling businesses at the same time, creating the regional market leader. Individually, each of these purchases would have offered little to no incremental value at sale. But by combining all four at the same time and overlaying that with competent management, the GP created new synergies. This is an example of prowess in deal origination, creativity and operational value-add.
TK: Innovation is what successful private equity investing has always been about. LPs get in trouble when they forget that.
JF: Clearly, LPs are much more focused on making sure GPs’ interests are aligned with investors. We’ve learned that the best protection against losses, particularly in difficult markets, is making sure a GP has enough of his own capital invested in his fund so that a loss hurts. Skin in the game is often the difference that tips an investment decision one way or the other for us.
TK: We have exactly the same priority. We want any GP we invest with to make investments in their own fund equal to 5 to 15 percent of committed capital. We also go back to past funds and see how much the GP has pulled out in terms of carry, and how much of that they are investing in their latest fund. If a team has accumulated $500 million in carry, it is not enough if they then invest $50 million of that in their next fund. We want enough invested so that it has a significant impact on GP net worth. Today, the old industry standard of a GP putting up 1 percent of committed capital is unacceptable.
AS: Skin in the game is one practice where negotiating power has shifted to LPs as a result of the financial crisis. Sadly, I think this is likely to prove cyclical, with power shifting back to GPs as private equity returns and fundraising recover.
AS: The necessary expertise is not always there - in particular in direct investment. While some organizations might succeed with direct investment programs, broadly speaking, I think this trend will end in tears. Experienced
TRIAGO: Post-financial crisis, LPs have increasingly been drawn to co-investment and direct investment as a means of boosting returns and avoiding fees. Do LPs have the expertise to make the right decisions in these areas?
LPs know how hard it is to be a good PE fund manager. Yet they often seem to be ignoring lessons learned about the science and art of manager selection by subscribing to the idea that anyone can do buyouts, as long as they hire a bunch of people and give them a pot of money to invest. At least with co-investment you are relying in part on LP strengths in GP selection and assessment.
JF: We’ve set up a direct investment business…
AS: There are exceptions to all rules!
JF: Well, I agree with Adalbjörn when he says that many LPs going into direct investment will fail. But when the programs are set up with care, direct investment works. For example, our direct business staffs exactly like an external manager. We have big, fully-resourced teams; all members have extensive track records in direct investments; and we manage and incentivize the operation in line with industry best practice. Success in either direct or co-investment may really depend on whether the owner of the LP is prepared to invest in a sizable set-up.
TK: To successfully co-invest, LPs certainly need to employ a different investment process than in a traditional allocation strategy. For co-investing, you could invest alongside five GPs whenever they bring you a deal, justifying this based on having vetted the GPs as private equity managers. But the danger is that you will only wind up doing deals where the GP wants to sell down risk. LPs looking to do co-investments must be able to identify the transactions where the GP has a real edge.
AS: I would say that outperformance versus public markets is not going to widen, even if private equity fund selection and investment processes are changing at the edges. At the same time, I think that private equity returns and outperformance will stay attractive for those LPs that do their homework.
JF: In the emerging markets, provided you partner with the right people, it will be easier for LPs to make money than it was in the past. In the developed markets, as long as you are very aware of the tougher overall economic outlook and its implications, I think there will be terrific strategies for investment. LPs who keep these two things in mind should be able to achieve even better outperformance than previously. TK: There will always be LPs who are more careful and more sophisticated than their peers. But I think there are a number of factors at work - notably extremely low interest rates in the U.S. and Europe - that will cause a financial bubble to re-inflate and burst at some point. Cyclical swings are ingrained in financial markets. As in the past, I suspect that many private equity investors are not taking proper account of that risk and are merely calculating their potential returns.
TRIAGO: Now the $100 million question: Can the evolution of fund selection and investment processes lead to higher returns and less risk for LPs going forward?
TH
E T
RIA
GO
QU
AR
TE
RL
Y -
JU
NE
20
11
-
6
PR
IVA
TE
EQ
UIT
Y B
LO
G
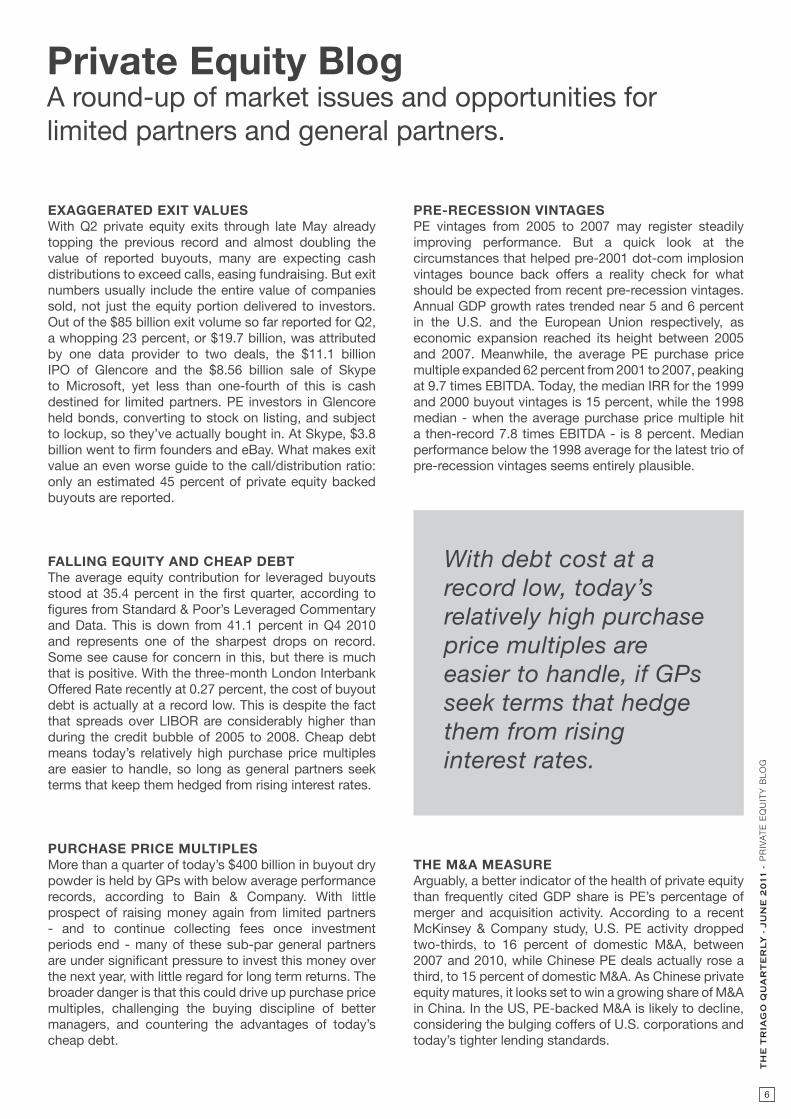
EXAGGERATED EXIT VALUESWith Q2 private equity exits through late May already topping the previous record and almost doubling the value of reported buyouts, many are expecting cash distributions to exceed calls, easing fundraising. But exit numbers usually include the entire value of companies sold, not just the equity portion delivered to investors. Out of the $85 billion exit volume so far reported for Q2, a whopping 23 percent, or $19.7 billion, was attributed by one data provider to two deals, the $11.1 billion IPO of Glencore and the $8.56 billion sale of Skype to Microsoft, yet less than one-fourth of this is cash destined for limited partners. PE investors in Glencore held bonds, converting to stock on listing, and subject to lockup, so they’ve actually bought in. At Skype, $3.8 billion went to firm founders and eBay. What makes exit value an even worse guide to the call/distribution ratio: only an estimated 45 percent of private equity backed buyouts are reported.
FALLING EQUITY AND CHEAP DEBT The average equity contribution for leveraged buyouts stood at 35.4 percent in the first quarter, according to figures from Standard & Poor’s Leveraged Commentary and Data. This is down from 41.1 percent in Q4 2010 and represents one of the sharpest drops on record. Some see cause for concern in this, but there is much that is positive. With the three-month London Interbank Offered Rate recently at 0.27 percent, the cost of buyout debt is actually at a record low. This is despite the fact that spreads over LIBOR are considerably higher than during the credit bubble of 2005 to 2008. Cheap debt means today’s relatively high purchase price multiples are easier to handle, so long as general partners seek terms that keep them hedged from rising interest rates.
PURCHASE PRICE MULTIPLESMore than a quarter of today’s $400 billion in buyout dry powder is held by GPs with below average performance records, according to Bain & Company. With little prospect of raising money again from limited partners - and to continue collecting fees once investment periods end - many of these sub-par general partners are under significant pressure to invest this money over the next year, with little regard for long term returns. The broader danger is that this could drive up purchase price multiples, challenging the buying discipline of better managers, and countering the advantages of today’s cheap debt.
With debt cost at a record low, today’s relatively high purchase price multiples are easier to handle, if GPs seek terms that hedge them from rising interest rates.
PRE-RECESSION VINTAGESPE vintages from 2005 to 2007 may register steadily improving performance. But a quick look at the circumstances that helped pre-2001 dot-com implosion vintages bounce back offers a reality check for what should be expected from recent pre-recession vintages. Annual GDP growth rates trended near 5 and 6 percent in the U.S. and the European Union respectively, as economic expansion reached its height between 2005 and 2007. Meanwhile, the average PE purchase price multiple expanded 62 percent from 2001 to 2007, peaking at 9.7 times EBITDA. Today, the median IRR for the 1999 and 2000 buyout vintages is 15 percent, while the 1998 median - when the average purchase price multiple hit a then-record 7.8 times EBITDA - is 8 percent. Median performance below the 1998 average for the latest trio of pre-recession vintages seems entirely plausible.
THE M&A MEASUREArguably, a better indicator of the health of private equity than frequently cited GDP share is PE’s percentage of merger and acquisition activity. According to a recent McKinsey & Company study, U.S. PE activity dropped two-thirds, to 16 percent of domestic M&A, between 2007 and 2010, while Chinese PE deals actually rose a third, to 15 percent of domestic M&A. As Chinese private equity matures, it looks set to win a growing share of M&A in China. In the US, PE-backed M&A is likely to decline, considering the bulging coffers of U.S. corporations and today’s tighter lending standards.
Private Equity BlogA round-up of market issues and opportunities for limited partners and general partners.

TH
E T
RIA
GO
QU
AR
TE
RL
Y -
JU
NE
20
11
-
The information contained in this presentation shall not be reproduced in whole or in part without prior written consent of Triago. The opinions, estimates, charts and/or projections contained herein are as of the date of this presentation/material(s) and may be subject to change without notice. Triago endeavors to ensure that the contents have been compiled or derived from sources that we believe are reliable and contain information and opinions that we believe are accurate and complete. However, Triago makes no representation or warranty, expressed or implied, in respect thereof, takes no responsibility for any errors and omissions contained therein and accepts no liability whatsoever for any loss arising from any use of, or reliance on, this presentation/material(s) or its contents. Information may be available to Triago or its affiliates that are not reflected in our presentation/material(s). Nothing contained in this presentation constitutes a solicitation, recommendation, endorsement, or offer to buy or sell any investment product.
Triago Americas Inc. is a member NASD/SIPC. Triago Europe is a member of EVCA.Triago MEA LTD is a DIFC registered company, regulated by the Dubai Financial Services Authority.
Contact
www.triago.com
AMERICAS499 Park Avenue, 20th Fl.New York, NY 10022, USATel.: +1 (212) 593-4994
MIDDLE EAST & ASIADIFC, The Gate, Level 15PO Box 50 6681, Dubai, UAETel.: +971 4401 9525
EUROPE1 boulevard de la Madeleine75001 Paris, FranceTel.: +33 (0)1 47 03 01 10
Th
e T
ria
go
Qu
ar
te
rl
y -
Fe
br
ua
ry
20
11
- C
ON
TAC
T
7
7
CO
NTA
CT