Embed Size (px)
Citation preview
The Annals of “Dunarea de Jos” University of Galati Fascicle I – 2010. Economics and Applied Informatics. Years XVI – no 1 - ISSN 1584-0409
257
The Statistical Analysis of the Factoryal Influences
Concerning the Dynamic of the Average Level for the Social Productivity of the Work in Romania
Gabriela OPAIŢ
[email protected] Dunărea de Jos University of Galaţi
Abstract We can to analyse the dynamic of the average level for the social productivity of the work in Romania, by means of the statistical methods with view of the factorial influences on the base of indexes numbers.
Key words: statistical methods; dynamical; influences; factors.
JEL Code: C1, C12, C2.
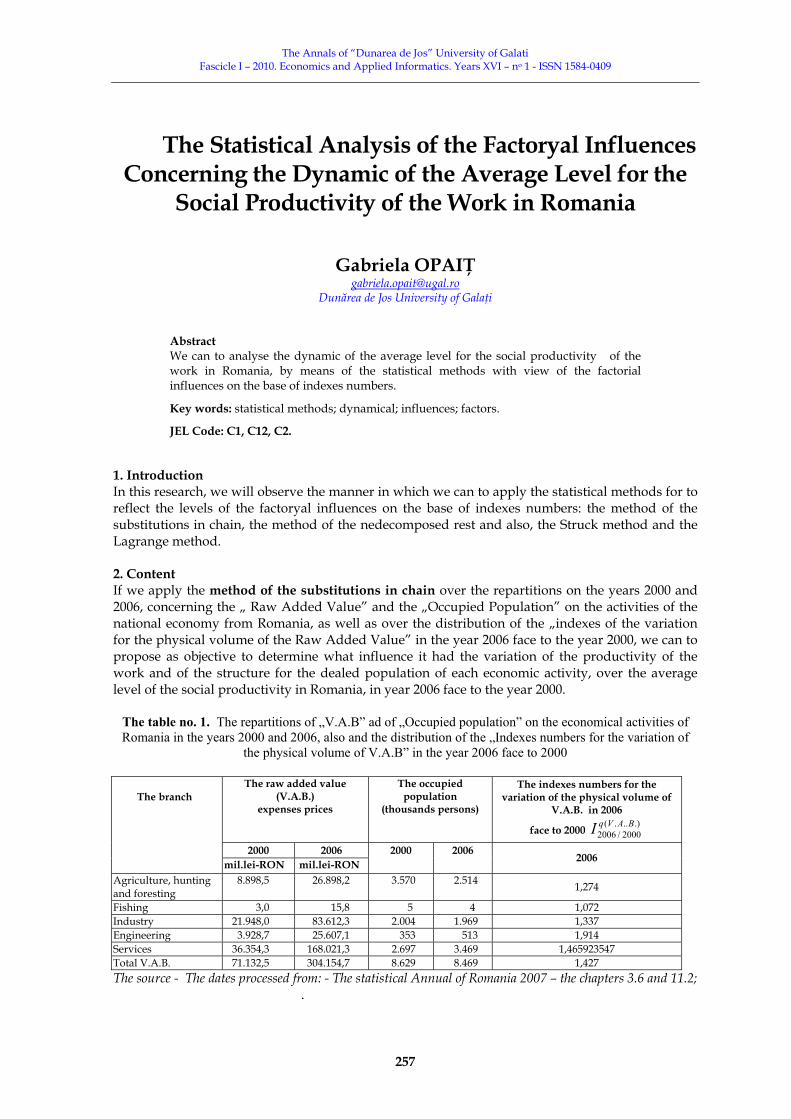
1. Introduction In this research, we will observe the manner in which we can to apply the statistical methods for to reflect the levels of the factoryal influences on the base of indexes numbers: the method of the substitutions in chain, the method of the nedecomposed rest and also, the Struck method and the Lagrange method. 2. Content If we apply the method of the substitutions in chain over the repartitions on the years 2000 and 2006, concerning the „ Raw Added Value” and the „Occupied Population” on the activities of the national economy from Romania, as well as over the distribution of the „indexes of the variation for the physical volume of the Raw Added Value” in the year 2006 face to the year 2000, we can to propose as objective to determine what influence it had the variation of the productivity of the work and of the structure for the dealed population of each economic activity, over the average level of the social productivity in Romania, in year 2006 face to the year 2000.
The table no. 1. The repartitions of „V.A.B” ad of „Occupied population” on the economical activities of Romania in the years 2000 and 2006, also and the distribution of the „Indexes numbers for the variation of
the physical volume of V.A.B” in the year 2006 face to 2000
The raw added value (V.A.B.)
expenses prices
The occupied population
(thousands persons)
The indexes numbers for the variation of the physical volume of
V.A.B. in 2006
face to 2000 .)...(2000/2006
BAVqI
2000 2006 2000 2006
The branch
mil.lei-RON mil.lei-RON 2006
Agriculture, hunting and foresting
8.898,5 26.898,2 3.570 2.514 1,274
Fishing 3,0 15,8 5 4 1,072 Industry 21.948,0 83.612,3 2.004 1.969 1,337 Engineering 3.928,7 25.607,1 353 513 1,914 Services 36.354,3 168.021,3 2.697 3.469 1,465923547 Total V.A.B. 71.132,5 304.154,7 8.629 8.469 1,427 The source - The dates processed from: - The statistical Annual of Romania 2007 – the chapters 3.6 and 11.2;
.
The Annals of “Dunarea de Jos” University of Galati Fascicle I – 2010. Economics and Applied Informatics. Years XVI – no 1 - ISSN 1584-0409
258
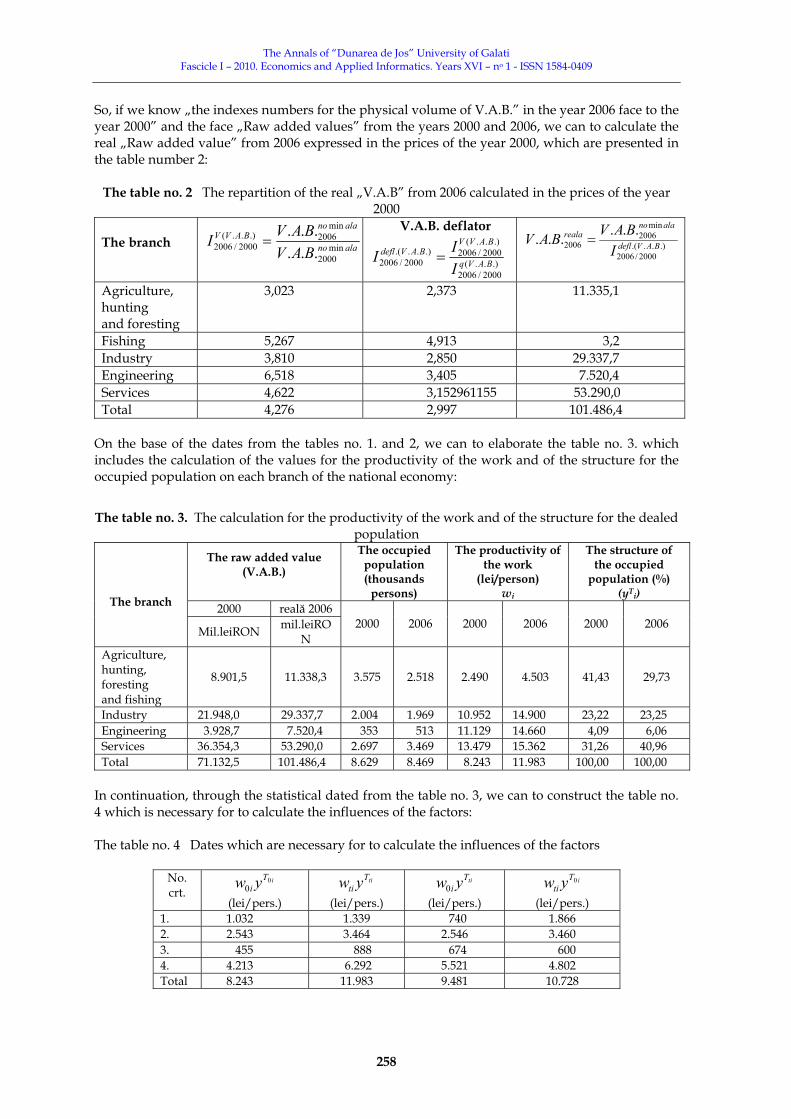
So, if we know „the indexes numbers for the physical volume of V.A.B.” in the year 2006 face to the year 2000” and the face „Raw added values” from the years 2000 and 2006, we can to calculate the real „Raw added value” from 2006 expressed in the prices of the year 2000, which are presented in the table number 2:
The table no. 2 The repartition of the real „V.A.B” from 2006 calculated in the prices of the year 2000
The branch alano
alanoBAVV
BAVBAVI min
2000
min2006.)..(
2000/2006 ......
=
V.A.B. deflator
.)..(2000/2006
.)..(2000/2006.)...(
2000/2006 BAVq
BAVVBAVdefl
III =
.)...(2000/2006
min2006
2006...... BAVdefl
alanoreala
IBAVBAV =
Agriculture, hunting and foresting
3,023 2,373 11.335,1
Fishing 5,267 4,913 3,2 Industry 3,810 2,850 29.337,7 Engineering 6,518 3,405 7.520,4 Services 4,622 3,152961155 53.290,0 Total 4,276 2,997 101.486,4
On the base of the dates from the tables no. 1. and 2, we can to elaborate the table no. 3. which includes the calculation of the values for the productivity of the work and of the structure for the occupied population on each branch of the national economy:
The table no. 3. The calculation for the productivity of the work and of the structure for the dealed
population
The raw added value (V.A.B.)
The occupied population (thousands
persons)
The productivity of the work
(lei/person) wi
The structure of the occupied
population (%) (yTi)
2000 reală 2006
The branch
Mil.leiRON mil.leiRON
2000 2006 2000 2006 2000 2006
Agriculture, hunting, foresting and fishing
8.901,5 11.338,3 3.575 2.518 2.490 4.503 41,43 29,73
Industry 21.948,0 29.337,7 2.004 1.969 10.952 14.900 23,22 23,25 Engineering 3.928,7 7.520,4 353 513 11.129 14.660 4,09 6,06 Services 36.354,3 53.290,0 2.697 3.469 13.479 15.362 31,26 40,96 Total 71.132,5 101.486,4 8.629 8.469 8.243 11.983 100,00 100,00
In continuation, through the statistical dated from the table no. 3, we can to construct the table no. 4 which is necessary for to calculate the influences of the factors: The table no. 4 Dates which are necessary for to calculate the influences of the factors
No. crt.
iTi yw 0
0 (lei/pers.)
tiTti yw
(lei/pers.)
tiTi yw0
(lei/pers.)
iTti yw 0
(lei/pers.) 1. 1.032 1.339 740 1.866 2. 2.543 3.464 2.546 3.460 3. 455 888 674 600 4. 4.213 6.292 5.521 4.802 Total 8.243 11.983 9.481 10.728
The Annals of “Dunarea de Jos” University of Galati Fascicle I – 2010. Economics and Applied Informatics. Years XVI – no 1 - ISSN 1584-0409
259
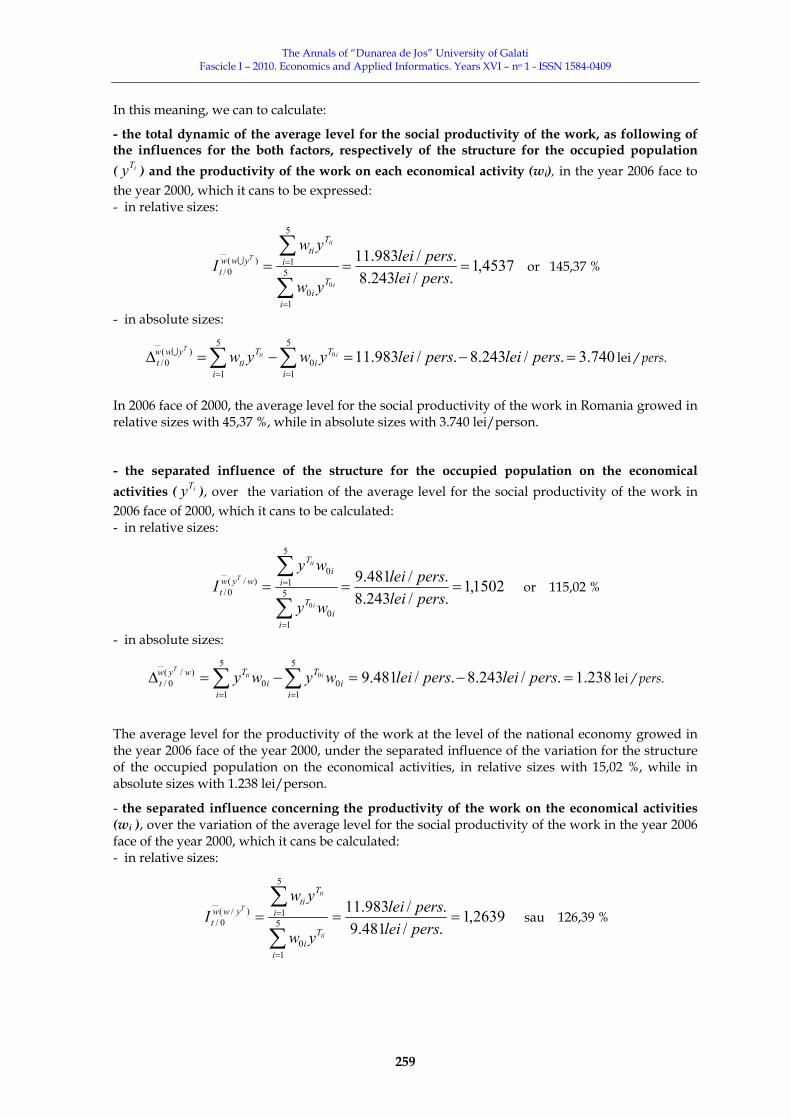
In this meaning, we can to calculate:
- the total dynamic of the average level for the social productivity of the work, as following of the influences for the both factors, respectively of the structure for the occupied population ( iTy ) and the productivity of the work on each economical activity (wi), in the year 2006 face to the year 2000, which it cans to be expressed: - in relative sizes:
4537,1./243.8./983.11
5
10
5
1)(0/
0
===
∑
∑
=
=
persleiperslei
yw
ywI
i
Ti
i
Tti
ywwt
i
ti
TU or 145,37 %
- in absolute sizes:
740.3./243.8./983.115
10
5
1
)(0/
0 =−=−=Δ ∑∑==
persleipersleiywywi
Ti
i
Tti
ywwt
itiTU lei / pers.
In 2006 face of 2000, the average level for the social productivity of the work in Romania growed in relative sizes with 45,37 %, while in absolute sizes with 3.740 lei/person.
- the separated influence of the structure for the occupied population on the economical activities ( iTy ), over the variation of the average level for the social productivity of the work in 2006 face of 2000, which it cans to be calculated: - in relative sizes:
1502,1./243.8./481.9
5
10
5
10
)/(0/
0
===
∑
∑
=
=
persleiperslei
wy
wyI
ii
T
ii
T
wywt
i
ti
T
or 115,02 %
- in absolute sizes:
238.1./243.8./481.95
10
5
10
)/(0/
0 =−=−=Δ ∑∑==
persleipersleiwywyi
iT
ii
Twywt
itiT
lei / pers.
The average level for the productivity of the work at the level of the national economy growed in the year 2006 face of the year 2000, under the separated influence of the variation for the structure of the occupied population on the economical activities, in relative sizes with 15,02 %, while in absolute sizes with 1.238 lei/person.
- the separated influence concerning the productivity of the work on the economical activities (wi ), over the variation of the average level for the social productivity of the work in the year 2006 face of the year 2000, which it cans be calculated: - in relative sizes:
2639,1./481.9./983.11
5
10
5
1)/(0/ ===
∑
∑
=
=
persleiperslei
yw
ywI
i
Ti
i
Tti
ywwt
ti
ti
T
sau 126,39 %
The Annals of “Dunarea de Jos” University of Galati Fascicle I – 2010. Economics and Applied Informatics. Years XVI – no 1 - ISSN 1584-0409
260
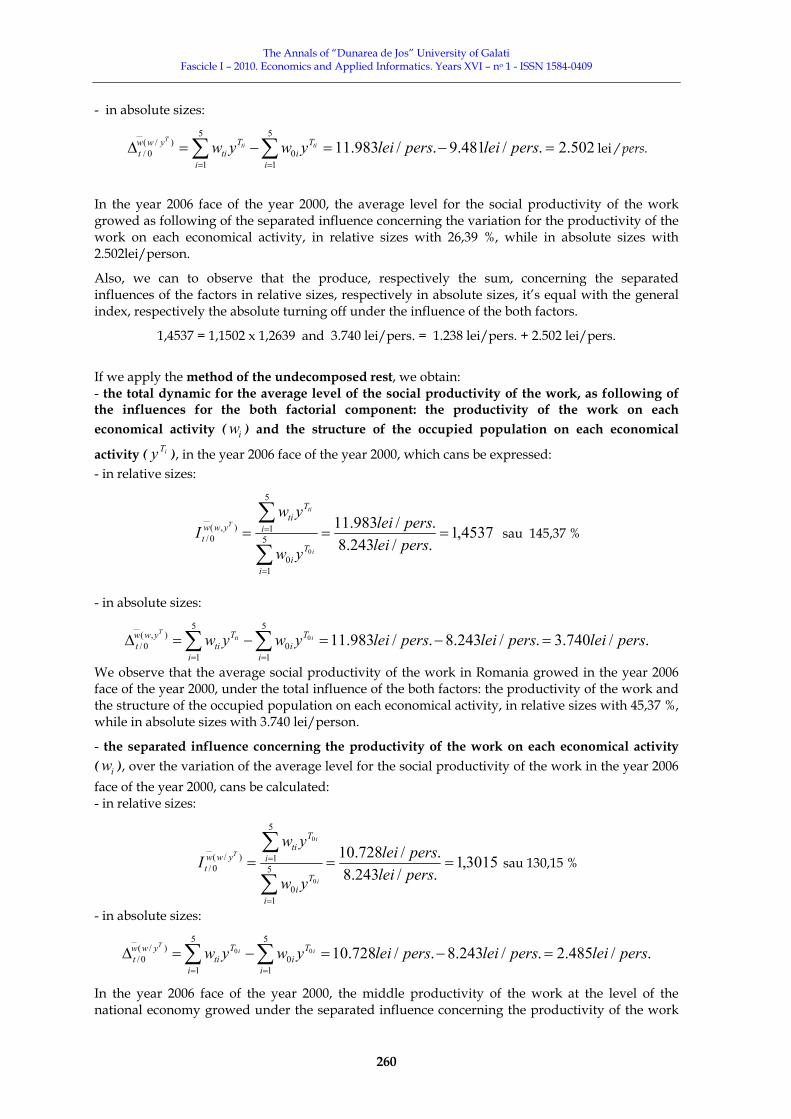
- in absolute sizes:
502.2./481.9./983.115
10
5
1
)/(0/ =−=−=Δ ∑∑
==
persleipersleiywywi
Ti
i
Tti
ywwt
titiT
lei / pers.
In the year 2006 face of the year 2000, the average level for the social productivity of the work growed as following of the separated influence concerning the variation for the productivity of the work on each economical activity, in relative sizes with 26,39 %, while in absolute sizes with 2.502lei/person.
Also, we can to observe that the produce, respectively the sum, concerning the separated influences of the factors in relative sizes, respectively in absolute sizes, it’s equal with the general index, respectively the absolute turning off under the influence of the both factors.
1,4537 = 1,1502 x 1,2639 and 3.740 lei/pers. = 1.238 lei/pers. + 2.502 lei/pers.
If we apply the method of the undecomposed rest, we obtain: - the total dynamic for the average level of the social productivity of the work, as following of the influences for the both factorial component: the productivity of the work on each economical activity ( iw ) and the structure of the occupied population on each economical
activity ( iTy ), in the year 2006 face of the year 2000, which cans be expressed: - in relative sizes:
4537,1./243.8./983.11
5
10
5
1),(0/
0
===
∑
∑
=
=
persleiperslei
yw
ywI
i
Ti
i
Tti
ywwt
i
ti
T
sau 145,37 %
- in absolute sizes:
./740.3./243.8./983.115
10
5
1
),(0/
0 persleipersleipersleiywywi
Ti
i
Tti
ywwt
itiT
=−=−=Δ ∑∑==
We observe that the average social productivity of the work in Romania growed in the year 2006 face of the year 2000, under the total influence of the both factors: the productivity of the work and the structure of the occupied population on each economical activity, in relative sizes with 45,37 %, while in absolute sizes with 3.740 lei/person.
- the separated influence concerning the productivity of the work on each economical activity ( iw ), over the variation of the average level for the social productivity of the work in the year 2006 face of the year 2000, cans be calculated: - in relative sizes:
3015,1./243.8./728.10
5
10
5
1)/(0/
0
0
===
∑
∑
=
=
persleiperslei
yw
ywI
i
Ti
i
Tti
ywwt
i
i
T
sau 130,15 %
- in absolute sizes:
./485.2./243.8./728.105
10
5
1
)/(0/
00 persleipersleipersleiywywi
Ti
i
Tti
ywwt
iiT
=−=−=Δ ∑∑==
In the year 2006 face of the year 2000, the middle productivity of the work at the level of the national economy growed under the separated influence concerning the productivity of the work
The Annals of “Dunarea de Jos” University of Galati Fascicle I – 2010. Economics and Applied Informatics. Years XVI – no 1 - ISSN 1584-0409
261
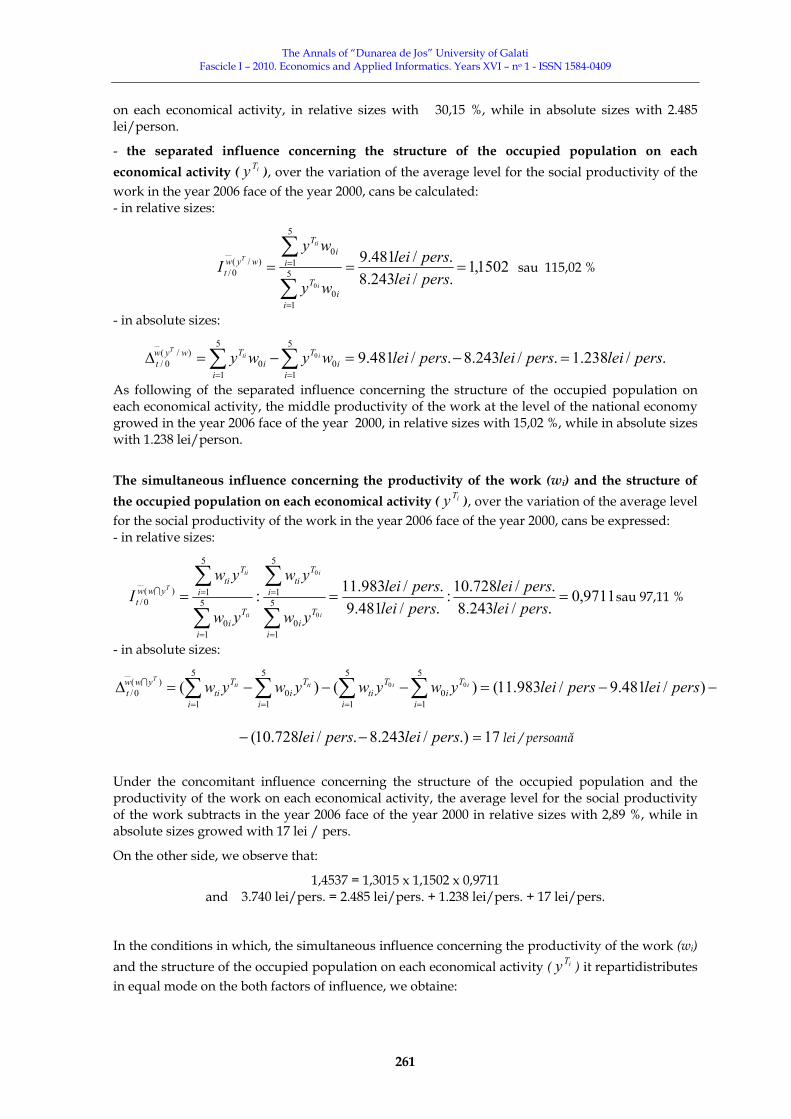
on each economical activity, in relative sizes with 30,15 %, while in absolute sizes with 2.485 lei/person.
- the separated influence concerning the structure of the occupied population on each economical activity ( iTy ), over the variation of the average level for the social productivity of the work in the year 2006 face of the year 2000, cans be calculated: - in relative sizes:
1502,1./243.8./481.9
5
10
5
10
)/(0/
0
===
∑
∑
=
=
persleiperslei
wy
wyI
ii
T
ii
T
wywt
i
ti
T
sau 115,02 %
- in absolute sizes:
./238.1./243.8./481.95
10
5
10
)/(0/
0 persleipersleipersleiwywyi
iT
ii
Twywt
itiT
=−=−=Δ ∑∑==
As following of the separated influence concerning the structure of the occupied population on each economical activity, the middle productivity of the work at the level of the national economy growed in the year 2006 face of the year 2000, in relative sizes with 15,02 %, while in absolute sizes with 1.238 lei/person.
The simultaneous influence concerning the productivity of the work (wi) and the structure of the occupied population on each economical activity ( iTy ), over the variation of the average level for the social productivity of the work in the year 2006 face of the year 2000, cans be expressed: - in relative sizes:
9711,0./243.8./728.10:
./481.9./983.11: 5
10
5
15
10
5
1)(0/
0
0
===
∑
∑
∑
∑
=
=
=
=
persleiperslei
persleiperslei
yw
yw
yw
ywI
i
Ti
i
Tti
i
Ti
i
Tti
ywwt
i
i
ti
ti
TI sau 97,11 %
- in absolute sizes:
−−=−−−=Δ ∑ ∑ ∑∑= = ==
)/481.9/983.11()()(5
1
5
1
5
100
5
1
)(0/
00 persleipersleiywywywywi i i
Ti
Tti
Ti
i
Tti
ywwt
iititiTI
17.)/243.8./728.10( =−− persleiperslei lei / persoană
Under the concomitant influence concerning the structure of the occupied population and the productivity of the work on each economical activity, the average level for the social productivity of the work subtracts in the year 2006 face of the year 2000 in relative sizes with 2,89 %, while in absolute sizes growed with 17 lei / pers.
On the other side, we observe that:
1,4537 = 1,3015 x 1,1502 x 0,9711 and 3.740 lei/pers. = 2.485 lei/pers. + 1.238 lei/pers. + 17 lei/pers.
In the conditions in which, the simultaneous influence concerning the productivity of the work (wi) and the structure of the occupied population on each economical activity ( iTy ) it repartidistributes in equal mode on the both factors of influence, we obtaine:

The Annals of “Dunarea de Jos” University of Galati Fascicle I – 2010. Economics and Applied Informatics. Years XVI – no 1 - ISSN 1584-0409
262
- the total influence concerning the productivity of the work on each economical activity (wi), over the variation of the average level for the social productivity of the work in the year 2006 face of the year 2000, which it’s: - in relative sizes:
∑
∑
∑
∑
∑
∑
=
=
=
=
=
= ⋅= 5
10
5
15
10
5
15
10
5
1)/(0/
0
0
0
0
:
i
Ti
i
Tti
i
Ti
i
Tti
i
Ti
i
Tti
ywwt
i
i
ti
ti
i
i
T
yw
yw
yw
yw
yw
ywI
or 2825,19711,03015,1)(0/
)/(0/
)/(0/
0=⋅=⋅=
TTT ywwt
ywwt
ywwt III I or 128,25 %
- in absolute sizes:
2
5
10/0/5
10/
)/(0/
0
∑∑ =
=
ΔΔ+Δ⋅=Δ i
yt
wt
i
wt
Tywwt
T
T
y
or leipersleipersleiT
TTyww
tywwt
ywwt 5,493.2
2./17./485.2
2
)(0/)/(
0/)/(
0/0
=+=Δ
+Δ=ΔI
/pers.
The middle productivity of the work at the level of the national economye growed in the year 2006 face of the year 2000, under the total influence concerning the productivity of the work on each economical activity, in relative sizes with 28,25 %, while in absolute sizes with 2.493,5 lei/person, in the conditions of the division in equal mode on the both factors of influence: qualitative (wi) and quantitative ( iTy ), of the simultaneous influence of these. - the total influence concerning the structure of the occupied population on each economical activity ( iTy ) over the variation of the average level for the social productivity of the work in the year 2006 face of the year 2000, which it’s: - in relative sizes:
or 1335,19711,01502,1)(0/
)/(0/
)/(0/
0 =⋅=⋅=TTT yww
twyw
twyw
t III I or 113,35 % - in absolute sizes:
2
5
10/0/5
10/0
)/(0/
∑∑ =
=
ΔΔ+Δ⋅=Δ i
yt
wt
i
yti
wywt
iTi
iTT
w
or
leipersleipersleiT
TTyww
twywt
wywt 5,246.1
2./17./238.1
2
)(0/)/(
0/)/(
0/0 =+=
Δ+Δ=Δ
I
/person
The middle productivity of the work at the level of the romanian economy growed in the year 2006 face of the year 2000, as effect of the total influence concerning the structura of the occupied population on the economical activities, in relative sizes with 13,35 %, while in absolute sizes with 1.246,5 lei/person, in the situation of the division in equal mode on the both factors of influence: qualitative (wi) and quantitativ ( iTy ), of the concomitant influence of these.
∑
∑
∑
∑
∑
∑
=
=
=
=
=
= ⋅=5
1i
Ti0
5
1i
Tti
5
1i
Ti0
5
1i
Tti
5
1ii0
T
5
1ii0
T
)w/y(w0/t
i0
i0
ti
ti
i0
ti
T
yw
yw:
yw
yw
wy
wyI
The Annals of “Dunarea de Jos” University of Galati Fascicle I – 2010. Economics and Applied Informatics. Years XVI – no 1 - ISSN 1584-0409
263
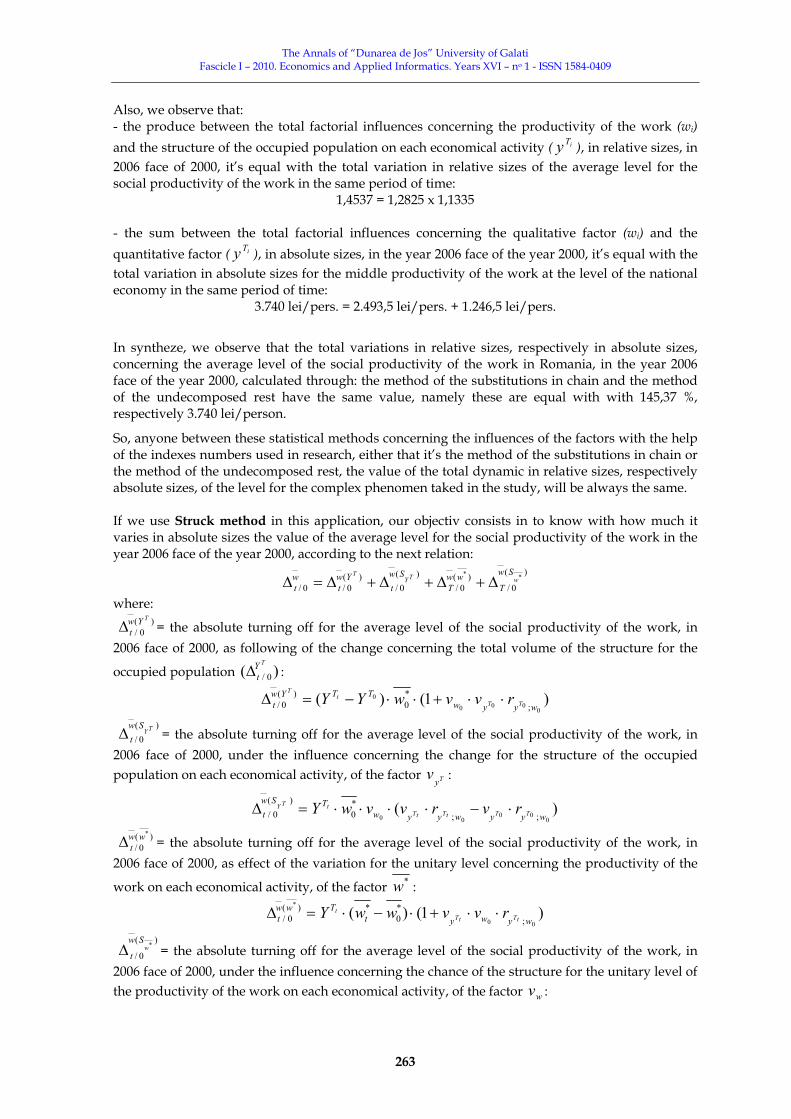
Also, we observe that: - the produce between the total factorial influences concerning the productivity of the work (wi) and the structure of the occupied population on each economical activity ( iTy ), in relative sizes, in 2006 face of 2000, it’s equal with the total variation in relative sizes of the average level for the social productivity of the work in the same period of time:
1,4537 = 1,2825 x 1,1335 - the sum between the total factorial influences concerning the qualitative factor (wi) and the quantitative factor ( iTy ), in absolute sizes, in the year 2006 face of the year 2000, it’s equal with the total variation in absolute sizes for the middle productivity of the work at the level of the national economy in the same period of time:
3.740 lei/pers. = 2.493,5 lei/pers. + 1.246,5 lei/pers.
In syntheze, we observe that the total variations in relative sizes, respectively in absolute sizes, concerning the average level of the social productivity of the work in Romania, in the year 2006 face of the year 2000, calculated through: the method of the substitutions in chain and the method of the undecomposed rest have the same value, namely these are equal with with 145,37 %, respectively 3.740 lei/person.
So, anyone between these statistical methods concerning the influences of the factors with the help of the indexes numbers used in research, either that it’s the method of the substitutions in chain or the method of the undecomposed rest, the value of the total dynamic in relative sizes, respectively absolute sizes, of the level for the complex phenomen taked in the study, will be always the same. If we use Struck method in this application, our objectiv consists in to know with how much it varies in absolute sizes the value of the average level for the social productivity of the work in the year 2006 face of the year 2000, according to the next relation:
)(
0/)(
0/)(
0/)(
0/0/**
wTYT Sw
Tww
TSw
tYw
twt Δ+Δ+Δ+Δ=Δ
where:
)(0/
TYwtΔ = the absolute turning off for the average level of the social productivity of the work, in
2006 face of 2000, as following of the change concerning the total volume of the structure for the
occupied population )( 0/
TYtΔ :
)1()(0
000
0
;*0
)(0/ wyyw
TTYwt TT
tT
rvvwYY ⋅⋅+⋅⋅−=Δ
)(
0/TY
SwtΔ = the absolute turning off for the average level of the social productivity of the work, in
2006 face of 2000, under the influence concerning the change for the structure of the occupied population on each economical activity, of the factor Ty
v :
)(0
0000 ;;
*0
)(0/ wyywyyw
TSwt TTtTtT
tTY rvrvvwY ⋅−⋅⋅⋅⋅=Δ
)(0/
*wwtΔ = the absolute turning off for the average level of the social productivity of the work, in
2006 face of 2000, as effect of the variation for the unitary level concerning the productivity of the
work on each economical activity, of the factor *w :
)1()(00
*
;*0
*)(0/ wywyt
Twwt tTtT
t rvvwwY ⋅⋅+⋅−⋅=Δ
)(
0/*w
Sw
tΔ = the absolute turning off for the average level of the social productivity of the work, in 2006 face of 2000, under the influence concerning the chance of the structure for the unitary level of the productivity of the work on each economical activity, of the factor wv :
The Annals of “Dunarea de Jos” University of Galati Fascicle I – 2010. Economics and Applied Informatics. Years XVI – no 1 - ISSN 1584-0409
264
)(00
*
;;*)(
0/ wywwywytTSw
t tTt
tTttT
tw rvrvvwY ⋅−⋅⋅⋅⋅=Δ
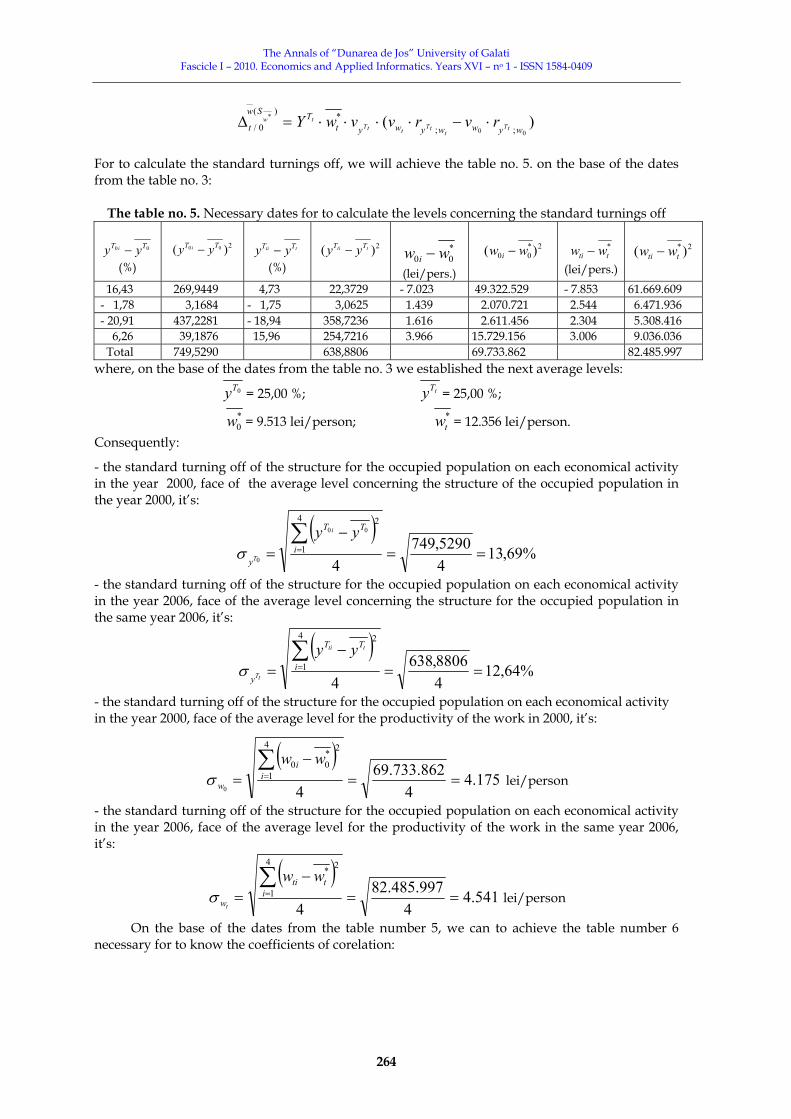
For to calculate the standard turnings off, we will achieve the table no. 5. on the base of the dates from the table no. 3:
The table no. 5. Necessary dates for to calculate the levels concerning the standard turnings off
00 TT yy i − (%)
2)( 00 TT yy i −
tti TT yy −
(%)
2)( tti TT yy −
*00 ww i −
(lei/pers.)
2*
00 )( ww i −
*tti ww −
(lei/pers.)
2*)( tti ww −
16,43 269,9449 4,73 22,3729 - 7.023 49.322.529 - 7.853 61.669.609 - 1,78 3,1684 - 1,75 3,0625 1.439 2.070.721 2.544 6.471.936 - 20,91 437,2281 - 18,94 358,7236 1.616 2.611.456 2.304 5.308.416 6,26 39,1876 15,96 254,7216 3.966 15.729.156 3.006 9.036.036 Total 749,5290 638,8806 69.733.862 82.485.997 where, on the base of the dates from the table no. 3 we established the next average levels:
0Ty = 25,00 %; tTy = 25,00 %;
*0w = 9.513 lei/person; *
tw = 12.356 lei/person. Consequently:
- the standard turning off of the structure for the occupied population on each economical activity in the year 2000, face of the average level concerning the structure of the occupied population in the year 2000, it’s:
( )%69,13
45290,749
4
4
1
200
0 ==−
=∑
=i
TT
y
yy i
Tσ
- the standard turning off of the structure for the occupied population on each economical activity in the year 2006, face of the average level concerning the structure for the occupied population in the same year 2006, it’s:
( )%64,12
48806,638
4
4
1
2
==−
=∑
=i
TT
y
tti
tT
yyσ
- the standard turning off of the structure for the occupied population on each economical activity in the year 2000, face of the average level for the productivity of the work in 2000, it’s:
( )175.4
4862.733.69
4
4
1
2*00
0==
−=
∑=i
i
w
wwσ lei/person
- the standard turning off of the structure for the occupied population on each economical activity in the year 2006, face of the average level for the productivity of the work in the same year 2006, it’s:
( )541.4
4997.485.82
4
4
1
2*
==−
=∑
=itti
w
ww
tσ lei/person
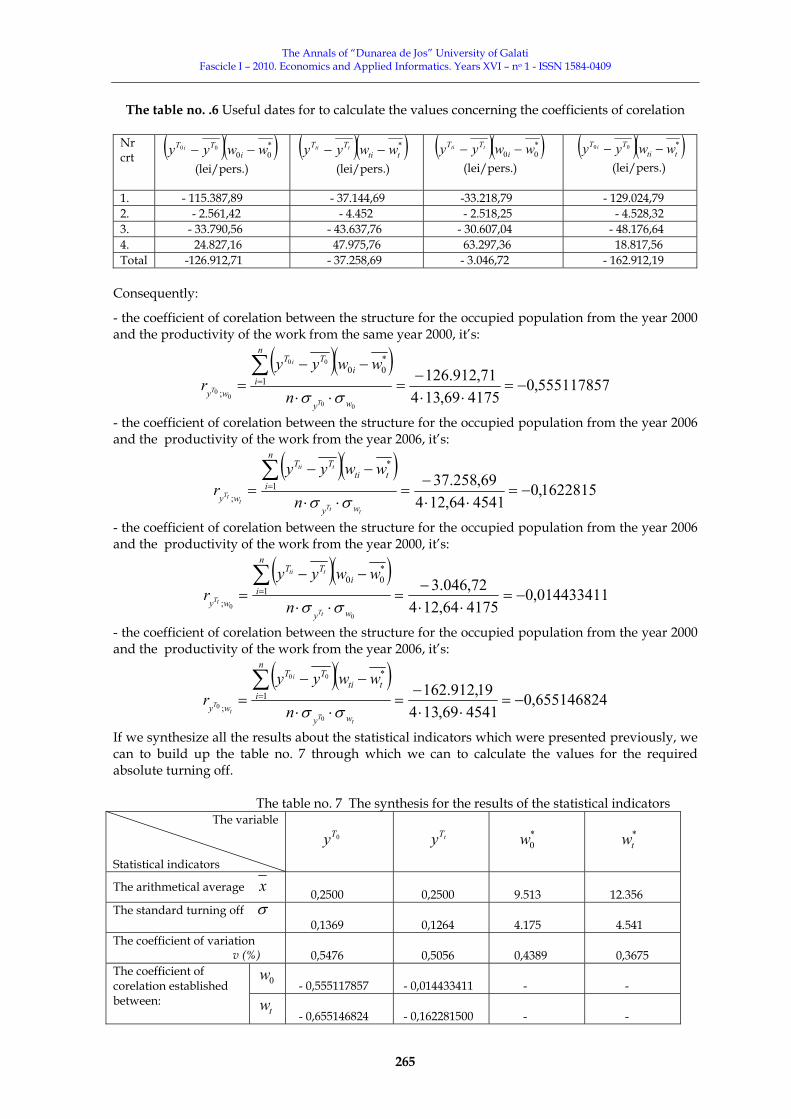
On the base of the dates from the table number 5, we can to achieve the table number 6 necessary for to know the coefficients of corelation:
The Annals of “Dunarea de Jos” University of Galati Fascicle I – 2010. Economics and Applied Informatics. Years XVI – no 1 - ISSN 1584-0409
265
The table no. .6 Useful dates for to calculate the values concerning the coefficients of corelation
Nr crt
( )( )*00
00 wwyy iTT i −−
(lei/pers.)
( )( )*tti
TT wwyy tti −− (lei/pers.)
( )( )*00 wwyy i
TT tti −− (lei/pers.)
( )( )*00tti
TT wwyy i −− (lei/pers.)
1. - 115.387,89 - 37.144,69 -33.218,79 - 129.024,79 2. - 2.561,42 - 4.452 - 2.518,25 - 4.528,32 3. - 33.790,56 - 43.637,76 - 30.607,04 - 48.176,64 4. 24.827,16 47.975,76 63.297,36 18.817,56 Total -126.912,71 - 37.258,69 - 3.046,72 - 162.912,19
Consequently:
- the coefficient of corelation between the structure for the occupied population from the year 2000 and the productivity of the work from the same year 2000, it’s:
( )( )555117857,0
417569,13471,912.126
00
00
00
1
*00
;−=
⋅⋅−
=⋅⋅
−−=
∑=
wy
n
ii
TT
wyT
i
T n
wwyyr
σσ
- the coefficient of corelation between the structure for the occupied population from the year 2006 and the productivity of the work from the year 2006, it’s:
( )( )1622815,0
454164,12469,258.371
*
;−=
⋅⋅−
=⋅⋅
−−=
∑=
ttT
tti
ttT
wy
n
itti
TT
wy n
wwyyr
σσ
- the coefficient of corelation between the structure for the occupied population from the year 2006 and the productivity of the work from the year 2000, it’s:
( )( )014433411,0
417564,12472,046.3
00
1
*00
;−=
⋅⋅−
=⋅⋅
−−=
∑=
wy
n
ii
TT
wytT
tti
tT n
wwyyr
σσ
- the coefficient of corelation between the structure for the occupied population from the year 2000 and the productivity of the work from the year 2006, it’s:
( )( )655146824,0
454169,13419,912.162
0
00
01
*
;−=
⋅⋅−
=⋅⋅
−−=
∑=
tT
i
tT
wy
n
itti
TT
wy n
wwyyr
σσ
If we synthesize all the results about the statistical indicators which were presented previously, we can to build up the table no. 7 through which we can to calculate the values for the required absolute turning off. The table no. 7 The synthesis for the results of the statistical indicators
The variable Statistical indicators
0Ty
tTy
*0w
*tw
The arithmetical average x 0,2500
0,2500
9.513
12.356
The standard turning off σ 0,1369
0,1264
4.175
4.541
The coefficient of variation v (%)
0,5476
0,5056
0,4389
0,3675
0w - 0,555117857
- 0,014433411
-
-
The coefficient of corelation established between: tw
- 0,655146824 - 0,162281500
-
-

The Annals of “Dunarea de Jos” University of Galati Fascicle I – 2010. Economics and Applied Informatics. Years XVI – no 1 - ISSN 1584-0409
266
Thus:
- the absolute turning off for the average level of the social productivity of the work as effect of the change concerning the total volume for the structure of the occupied population, in the year 2006 face of the year 2000, it’s:
=⋅⋅+⋅⋅−=Δ )1()( 00
00
0
;*0
)(0/ TT
tT
ywywTTYw
t rvvwYY
0)]555117857,0(5476,04389,01[513.9)00,100,1( =−⋅⋅+⋅⋅−= lei/pers.
- the absolute turning off for the average level of the social productivity of the work under the influence of the change concerning the variation for the structure of the occupied population on each economical branch, in the year 2006 face of 2000, it’s:
=⋅−⋅⋅⋅⋅=Δ )(0
0000 ;;
*0
)(
0/ wyywyywTSw
t TTtTtTtTy rvrvvwY
735762,238.1)555117857,0(5476,0)014433411,0(5056,0[4389,0513.900,1 =−⋅−−⋅⋅⋅⋅= lei/pers.
- the absolute turning off for the average level of the social productivity of the work as effect of the change concerning the unitar level for the productivity of the work on each economical activity, in 2006 face of 2000, it’s:
=⋅⋅+⋅−⋅=Δ )1()(00
*
;*0
*)(0/ wywyt
Twwt tTtT
t rvvwwY
894189,833.2)]014433411,0(4389,05056,01[)513.9356.12(00,1 =−⋅⋅+⋅−⋅= lei/pers. - the absolute turning off for the average level of the social productivity of the work under the influence of the variation for the structure concerning the unitar level of the productivity of the work on each economical branch, in the year 2006 face of the year 2000, it’s:
=⋅−⋅⋅⋅⋅=Δ )(00
*
;;*)(
0/ wywwywytTSw
t tTt
tTttT
tw rvrvvwY
9980775,332]014433411,0(4389,0)1622815,0(3675,0[5056,0356.1200,1 −=−⋅−−⋅⋅⋅⋅= lei/pers.
So: - the growth concerning the average level for the social productivity of the work on all the national economy, in 2006 face of 2000, it’s represented by the next relation:
)(
0/)(
0/)(
0/)(
0/0/**
wTYT Sw
Tww
TSw
tYw
twt Δ+Δ+Δ+Δ=Δ
or =Δwt 0/ 0 lei/pers+1.238,735762 lei/pers + 2.833,894189 lei/pers + (-332,9980775 lei/pers)
Therefore:
740.3631874,739.30/ ≅=Δwt lei/person
Consequently, the growth concerning the average level for the social productivity of the work in the year 2006 face of the year 2000, in absolute sizes with 3.740 lei/person, it owes the following influences:
- the variation of the structure for the occupied population on each economical branch, which created a growth with 1.238,735762 lei/person;
- the change of the unitar level for the productivity of the work on each economical activity, which determined a growth with 2.833,894189 lei/person;
- the variation of the structure which belongs to the unitar level concerning the productivity of the work on each economical branch, which had as effect a subtraction with – 332,9980775 lei/person.

The Annals of “Dunarea de Jos” University of Galati Fascicle I – 2010. Economics and Applied Informatics. Years XVI – no 1 - ISSN 1584-0409
267
On the other side, because the total volume of the structure for the occupied population is constant in time at 100 %, he don’t had a influence over the growth concerning the average level for the productivity of the work at the level of the national economy in the year 2006 face of the year 2000.
Also, we observe that the total absolute turning off concerning the average level for the social productivity of the work in 2006 face of 2000, calculated through the classical methods: the method of the substitution in chain and the methid of the undecomposed rest, it’s approximately equal with the the value calculated through Struck method, because the estimations calculated from Struck method influence the little difference:
- classical methods: 740.30/ =Δwt lei/person;
- Struck method: 740.30/ ≅Δwt lei/person.
Only through the method elaborated by R. Struck we can to reflect in absolute sizes the influence concerning the structure of the qualitative factor, namely the structure for the unitar level about the productivity of the work on each economical activity, over the growth of the social average productivity of the work at the level of the national economy, in the year 2006 face of the year 2000. So, we separate the influence in absolute sizes for the structure of the unitar level concerning the
productivity of the work calculated on each economical activity, 9980775,332)(
0/* −=Δ w
Sw
t lei/pers., face of the influence in absolute sizes for the unitar level concerning the productivity of
the work determinated in the frame of the same economical activities, 894189,833.2)(0/
*
=Δ wwt
lei/pers., over the growth for the average level concerning the social productivity of the work in 2006 face of 2000, technique which it can not apply by the statistical methods for the analysis concerning the influences of the factors on the base on the indexes numbers previously mentioned. In continuation, we use the statistical dates from the frame of the table no. 3, in the view of the achievement of the table no. 8. neccesary for to calculate the levels for the factorial influnces which are separated, in absolute sizes, over the dinamyc concerning the average level for the social productivity of the work in Romania, in 2006 face of 2000, with the help of the method about the finite growths elaborated by Lagrange:
Table no. 8. Necessary dates for to calculate the factorial influences through Lagrange method
Hence: - the absolute turning off concerning the average level for the social productivity of the work in the year 2006 face of the year 2000, as effect of the separated influence for the productivity of the work on each economical activity (wi), will be:
./492.2498521))((
21
10
)/( 0 persleiyywwn
i
TTiti
yww tiiT
≅⋅=+−=Δ ∑=
- the absolute turning off concerning the average level for the social productivity of the work in the year 2006 face of the year 2000, under the separated influence for the structure of the occupied population on each economical activity ( iTy ), will be:
./248.1249621))((
21
10
)/( 0 persleiwwyyn
itii
TTwyw itiT
≅⋅=+−=Δ ∑=
No. crt. iti ww 0−
(lei/pers.) iti ww 0+
(lei/pers.)
iti TT yy 0− (%)
iti TT yy 0+ (%)
))(( 00
tii TTiti yyww +−
(lei/pers.) )ww()yy(
tii0
TT i0ti
+−
(lei/pers.)
1. 2.013 6.993 - 11,70 71,16 1.432 - 818 2. 3.948 25.852 - 0,03 46,47 1.835 8 3. 3.531 25.789 1,97 10,15 358 508 4. 1.883 28.841 9,70 72,22 1.360 2.798 Total 4.985 2.496
The Annals of “Dunarea de Jos” University of Galati Fascicle I – 2010. Economics and Applied Informatics. Years XVI – no 1 - ISSN 1584-0409
268
Consequently, it checks up the relation according to, the total absolute turning off concerning the average level for the social productivity of the work at the level of the national economy, under the influence of the both factors (wi ) and ( iTy ), in the year 2006 face of the year 2000, it’s equal with the sum of the separated influences in absolute sizes, of the productivity of the work (wi ) and of the structure with view at the occupied population on each economical activity ( iTy ), in 2006 face of 2000:
)/(0/
)/(0/
)(0/
wywt
ywwt
ywwt
TTY
Δ+Δ=Δ U
3.740 lei/pers. = 2.492 lei/pers. + 1.248 lei/pers.
3. Conclusions:
We observe tht the growth concerning the productivity of the work in all the economical spheres: agriculture, forestculture, hunting, fishing, industry, engineerings and other branchs, had as effect the growth of the average level for the social productivity of the work on all the national economy with 45,37 % or with 3.740 lei/person, in the year 2006 face of the year 2000.
The growth concerning the productivity of the work in all the economical branchs in 2006 face of 2000 had place especially through the increase of the Raw Added Value, while in agriculture, forestculture, hunting, fishing and industriy had plac and as following of the subtraction about the structure of the occupied population in these spheres. Thus, these are the principal ways of growth of the average level for the social productivity of the work and in future, join of the achivement of the conditions of development for the activities from the national economy, of the retechnologisation concerning the processes of production and of the utility at maximum of the information which is one of the most important factor of production.
Also, we observe that the total absolute turning off concerning the average social productivity of the work in Romania, in the year 2006 face of the year 2000, expressed through Struck method, and which it manifests as effect of the variations about the following factorial components: the total volume of the structure for the occupied population (YT), the structure of the occupied population
( TYS ), the unitar level concerning the productivity of the work on each economical activity ( *w )
and the structure concerning the unitar level about the productivity of the work refers to each economical branch ( *w
S ), on of a side, and the total absolute changes concerning the average level of the social productivity of the work from Romania, under the influencs in the same period of time of the both factors: the productivity of the work (wi) and the structure of the occupied population on each economical activity ( iTy ), calculated through: the method of the substitution in chain, the method of the undecomposed rest and Lagrange method concerning the finite growths, on of other side, reflect the same value, namely these are equal with 3.740 lei/person.
Thus, anyone from these statistical methods of factorial analysis point the vector concerning the decomposition of the influences over the complex phenomen which enters in the sphere of the incidence for the programme of researche, the absolute turning off concerning the level of the total dynamic of the respective phenomen will be always the same.
References: 1. Capéraà Ph., Van Cutsem B. – „Méthodes et modéles en statistique”, Dunod, Paris, 1988 2. Clements K.W., Izan H.I. – „Stochastic Index Numbers: A Review”, International Statistical Review, vol. 74, no. 2, International Statistical Institute, 2006. 3. Diewert W.E. – „ Exact and superlative index number”, Journal of Econometrics, vol. 4, 1976. 4. Drăgan A. – „Abordări interdisciplinare”, Ed. Academica, Galaţi, 2007. 5. Selvanathan E.A., Prasada Rao D.S. – „Index Numbers: A Stochastic Approach”, Macmillan Publishing Co., London, 1994.