Embed Size (px)
Citation preview

Emily Gustafsson-WrightIzzy Boggild-JonesSophie Gardiner
The Standardized Early Childhood Development Costing Tool (SECT) A Global Good to Increase and Improve Investments in Young Children
September 2017

Emily Gustafsson-Wright
Izzy Boggild-Jones
Sophie Gardiner
Acknowledgements The authors would like to thank many individuals for their contributions to this report. First, the partnership with the World Bank Strategic Impact Evaluation Fund (SIEF) has been crucial to the development and testing of the costing tool, and we would like to thank Julieta M. Trias and Joost de Laat for their input and guidance during the development of the tool. We would also like to recognize the contributions of Conrad Barberton and Jonathan Carter of Cornerstone Economic Research in the development and piloting of the costing tool.
We would also like to thank our colleague Jacques van der Gaag of the Center for Universal Education (CUE) at The Brookings Institution for his helpful feedback and recommendations on the report. In addition, we would like to thank the members of the Costing Working Group, listed below, who provided early feedback and support on the design of the costing template.
Collaboration from early childhood development (ECD) practitioners in each of the pilot countries was crucial to the suc-cess of the pilot studies, and to the preparation of this report. For Bangladesh, we would like to thank Marjorie Chinen and Matthew Murray (formerly American Institutes for Research) for their inputs and comments. For Malawi, we would like to thank Christin McConnell from the World Bank. For Mali, we are grateful to Hamidou Niangaly from the Malaria Research and Training Center in Mali, Josselin Thuilliez from Centre national de la recherche scientifique, or National Center for Scientific Research (CNRS); Centre d’Economie de la Sorbonne, or Center of Economy at the Sorbonne (CES); Sian Clarke from the London School of Hygiene and Tropical Medicine; and Natalie Roschnik, Philippe Thera and Niele Hawa Diarra from Save the Children. For Mexico, we would like to thank Janet Samara Venancio Rodríguez, as well as her colleagues Adalberto Moreno Castillo, Brenda Castro Espinosa, Gabriela Sánchez Vázquez, Marisol Rivera Ruíz, and Olaya Hetzel Hernández Lugo of the Consejo Nacional de Fomento Educativo, or National Council for Educational Development (CONAFE) at the Secretariat of Public Education. In addition, we are grateful to Alonso Sánchez and Ciro Avitabile from the World Bank for providing extremely helpful input and support for the costing exercise. For Mozam-bique we would like to thank Gina Guibunda, as well as her colleagues Sergio Caetano, Teles de Jesus, Elina Dava, Inês Magode, and Maria Bras of the Ministry of Education. We also are grateful to Usman Iftikhar and Romao Xavier from the Aga Khan Foundation Mozambique; Suzana Duarte and Anne Fisker from ADPP Mozambique; and Change Briggs, Mo-ses Kasajja, Katy Anis, Phipps Campira, Nacima Figia, Kashif Hayat, Agy Herminio, Abilio Cossa, Argentino Muelo, Jose Viriato, Diamantino Faustino, and Stephen Njoroge from Save the Children. In addition, we received extremely helpful input and support from Fadila Caillaud and Jem Heinzel Nelson of the World Bank.
The Brookings Institution is a nonprofit organization devoted to independent research and policy solutions. Its mission is to conduct high-quality, independent research and, based on that research, to provide innovative, practical recommen-dations for policymakers and the public. The conclusions and recommendations of any Brookings publication are solely those of its author(s), and do not necessarily reflect the views of the Institution, its management, its other scholars, or donors.
Brookings gratefully acknowledges the program support provided to CUE by Omidyar Network.
Brookings recognizes that the value it provides is in its absolute commitment to quality, independence, and impact. Activities supported by its donors reflect this commitment.
Costing Working GroupHarold Alderman, senior research fellow, International Food Policy Research Institute (IFPRI)Florencia Lopez-Boo, senior social protection economist, Inter-American Development Bank (IDB)Maria Caridad Araujo, lead economist in social protection, IDBKyle Murphy, policy manager, Abdul Latif Jameel Poverty Action Lab (J-PAL)Jacques van der Gaag, The Brookings InstitutionTamar Manuelyan Atinc, The Brookings InstitutionEmily Gustafsson-Wright, The Brookings InstitutionElinor Bajraktari, UNICEFAna Nieto, UNICEFIvelina Borisova, education specialist, UNICEFPia Britto, early childhood development senior advisor, UNICEFMariavittoria Ballotta, early childhood development specialist, UNICEF
Photo Credits Cover: ADPP, Page 4: CONAFE, Page 8: Christin McConnell, Page 9: Christin McConnell, Page 10: Christin McConnell, Page 14: ADPP, Page 20: CONAFE, Page 28: ADPP, Page 36: ADPP, Page 53: Ricci Coughlan/DFID, Page 54: Christin McConnell, Page 62: EC/ECHO/Anouk Delafortrie, Page 70: CONAFE, Page 78: ADPP

3
Contents
Executive Summary 5The Need for Cost Data 5Challenges to Capturing Accurate Data and Earlier Efforts 5The Standardized ECD Costing Tool (SECT) 6Lessons and Results from the Pilot Costings 6Policy Recommendations 7
1. Introduction 11
2. Background 15Characteristics of ECD Costs 15
3. The Standardized ECD Costing Tool (SECT) 21Developing SECT 21Tool Design Lessons 23Challenges for Comparability 24Methodological Discussions 25Key Lessons 26
4. Piloting SECT 29Steps for Using the Tool to Conduct Costing 29Five Country Case Studies: Data and Applications 29When Could the Tool be Used? 34
5. Conclusions and Policy Recommendations 37References 41Annex A: Country Case Studies 46Bangladesh Case Study 47Malawi Case Study 55Mali Case Study 63Mexico Case Study 71Mozambique Case Study 79Annex B: Previous Costing Efforts 88


EXECUTIVE SUMMARY
5
Executive Summary
The Need for Cost DataThere is an urgent need for accurate cost data in early childhood development (ECD) services. In particular, a standardized costing tool that can support a range of interventions, cost-benefit analysis, budgeting, and scale-up is necessary. The utility of existing cost data on early childhood programs is limited by low comparability, and the availability of data varies by type of intervention.
After completing substantial research on existing cost data and costing tools starting in 2014, (Atinc, 2014 and van der Gaag & Putcha, 2015) the Center for Universal Education (CUE) at The Brookings Institution began an effort in 2015 to develop a costing tool for ECD interventions. This tool was intended to be made available for use by funders, governments, program implementers, and researchers to improve access to and the quality of ECD programs. CUE partnered with the World Bank’s Strategic Impact Evaluation Fund (SIEF) to develop and pilot the Standardized ECD Costing Tool (SECT) in countries where SIEF impact evaluations were being conducted. This allowed the partners to test the tool with variations by region, intervention type, and the capacity of implementing agencies and partners to gather
data and conduct the costing exercise. This report reviews previous efforts to cost ECD, describes the gaps that this tool fills, explains the utility and components of the tool, summarizes the lessons and results of five pilot costing exercises, and discusses next steps to roll out the tool to users across the globe.
Challenges to Capturing Accurate Data and Earlier EffortsTo date, efforts to collect cost data for ECD range from the collection of costs at the program level, to estimates based on key program costs or on key variables in a program area, to estimates at the national level. While some of these cost estimates included specific costing models, others were simple back-of-the-envelope calculations. Despite these efforts, comparability is low and risks of inaccuracy are high for much of the existing data. Our research shows that availability of data ranges widely between types of intervention: while regional data estimates are available for unit costs of micronutrient supplementation, antenatal care, and skilled attendance at delivery, only limited or context-specific data is available for the unit costs of parent-education and child-
6
protection services, for instance. The paucity of accurate and comparable data is likely the result of the complexity and challenges related to ECD programming. ECD programs have different structures and systems, include a variety of activities, use varied inputs, and serve different numbers of beneficiaries for varying lengths of time. Furthermore, ECD costs are often complex, since programs for the early years can include interventions across a range of sectors, from nutrition, health, and sanitation, to education and social protection. Other challenges associated with costing ECD include the fact that services are often provided by a range of actors, and may include volunteer labor.
The Standardized ECD Costing Tool (SECT)SECT attempts to address some of the challenges described above by providing a single tool that offers methodological consistency to costing ECD programs, which can be used across the full range of interventions, balancing flexibility and rigor. The utility of SECT is twofold. On the one hand, standardized and accurate cost data can strengthen the case for investment by enabling more precise cost-benefit and cost-effectiveness analysis. On the other hand, such data can lead to more informed or better investments by improving the efficiency of administration, so that actual and expected expenditures are better aligned, investments are made in the most cost-effective interventions, and cost and quality trade-offs can be analyzed. In addition to an existing list of common ECD interventions, users can edit the tool to suit their individual needs. The tool can be used to analyze data as ECD line items across different interventions (for example, to track personnel costs), or can be broken down by activity. Unit costs can be calculated by entering beneficiary numbers, and scale-up costs can be estimated as well.
ECD costs can be broadly divided into the following three main categories: 1. overhead costs (upper-level management in government, plus design, start-up, and evaluation costs); 2. direct costs (infrastructure construction, teacher salaries, training, food and supplements, uniforms, cash
transfers, equipment, direct administration, and monitoring); and 3. imputed costs (volunteer time and opportunity costs of buildings used). (Cornerstone Economic Research, and Myers, 2008a). The most important components to consider when costing are:
• Services provided• Program frequency and duration• Staff-to-student ratios and staff remuneration• Staff supervision and professional
development• Geography• Delivery setting• Program scale
Lessons and Results from the Pilot CostingsThe pilot costings, carried out in Bangladesh, Mali, Malawi, Mexico, and Mozambique, captured programs varying in complexity and providing a wide range of early childhood services. These include the relatively straightforward program in Bangladesh, which provided parenting education on child stimulation on top of an existing nutrition program, and also the complex case of building and operating preschools in Mozambique, where three providers were contracted to carry out the work in five provinces.
It is important to highlight that the five costing exercises conducted were pilot exercises with the purpose of capturing lessons learned so that the tool and the process of data collection and analysis could be improved for future utilization of the tool.
Key learnings from the pilot exercises included lessons about the design of the tool itself, as well as lessons from its use. Design lessons included the risks associated with having an open design or modifiable tool, in contrast with automation, which may be in tension with accuracy. It was also noted that, while measuring and comparing intensity and quality between different interventions is crucial to determine the cost effectiveness of programs, this is a challenging task. Finally, the piloting process made it clear that the tool would have much greater utility and quality control if it could be made

EXECUTIVE SUMMARY
7
available online, which would also facilitate the centralization of the cost data.
Data limitations were a challenge in some of the pilots: in some cases, costs were not available for all components. For example, in Malawi, data was only available for one activity, representing 34 percent of the overall program costs, while in Mali, data for the two components implemented by the government was unavailable. Several of the programs also experienced gaps between planning and intervention. This emphasized the importance of tracking accurate beneficiary numbers and also ensuring that actual expenditures, rather than budgets, are entered into the costing tool. Limitations were also introduced as the result of an inability to separate fixed from ongoing costs in one case.
All costs reported in Table 1 are actual costs provided from each program based on available data with the exception of Mozambique where due to timing of program delivery, the only option was to use budgets for 6 months of implementation. Table 1 is provided as a summary and not for the purpose of direct cost comparisons across programs given the heterogeneity of the programs.
Country Type of Program Number of Beneficiaries Total Cost (2015 $)
Bangladesh Education for parents/caregivers
18,644 $133,548
Malawi ECD materials 11,144 $400,188
Mali Micronutrients
Early childhood education
40,474
9,012
$322,925
$857,375
Mexico (average for two states)
Education for parents/caregivers
3,050 $564,345
Mozambique (Costs through end of 2017 – expenditure and budget)
Building and operating preschools
24,500
Number of places in ECD centers created by end
of 2017. These places will continue to be used over
multiple cohorts of children.
$14,638,280
TABLE 1: SUMMARY OF PILOT COSTING FOR DIFFERENT PROGRAMS ACROSS FIVE COUNTRIES
Source: Authors’ research using SECT.

THE STANDARDIZED EARLY CHILDHOOD DEVELOPMENT COSTING TOOL (SECT)
8
Policy RecommendationsSECT provides a long-needed concrete tool to help make a case for ECD investments, choose investments that are more informed, and improve efficiency in planning and budgeting. The following actions would help to ensure wide dissemination and use of SECT in the coming years:
1. Support Data Collection, Management, and AccountabilityDonors are encouraged to support and help build the capacity of governments and non-state providers in expenditure data collection and management. Comparable and methodologically sound ECD cost analyses using SECT depend on the collection of timely and accurate expenditure data that is easily retrieved. Widening data accessibility would help hold organizations accountable for the services that they fund and provide.
2. Disseminate SECTBroad dissemination of SECT would support the development of a rich database of ECD costs across regions, intervention type, and program funding and delivery models. Dissemination efforts would have to encompass a range of strategies, targeting governments and policymakers, multilateral institutions and private donors, service providers and program evaluators. The tool could also be disseminated through academic organizations and through courses that train ECD leaders and practitioners.
3. Create a Knowledge Hub for ECD CostingCreating a knowledge hub for the use of SECT would involve a number of distinct actions:
Management of the tool: The knowledge hub would manage use of the tool and support early users in the application of the tool, as well as supporting the translation of the tool and accompanying documents into other languages.
Data centralization: The knowledge hub would establish a global database on ECD costs, and
manage the collection of the results of costing exercises.
Data analysis: The knowledge hub would work with partners engaged in costing exercises to perform analyses on the collected data, including costed implementation plans at scale, simulations of the effects of quality variation on cost, linkages between cost and evaluation data, and cost-benefit analyses.
Creation of an online platform: The knowledge hub would provide an internet-based platform in which SECT and the resulting data could be housed. This would entail negotiating between the competing priorities of flexibility and standardization, to ensure consistency in costing methodology.
4. Develop a Training Module for SECTThe development of a standard training module for SECT would ensure broad and correct use of the tool. Capacity could be expanded across geographical regions and user types through a training-of-trainers model. The aim of such training would be to promote methodological consistency in the costing, increase understanding of the functions that have been automated, and strengthen understanding of unit costs.

EXECUTIVE SUMMARY
9

THE STANDARDIZED EARLY CHILDHOOD DEVELOPMENT COSTING TOOL (SECT)
10

1. INTRODUCTION
11
1. Introduction
1. http://www.un.org/sustainabledevelopment/sustainable-development-goals/
Providing quality early childhood development (ECD) services at scale will be critical to achieving the Sustainable Development Goals1 for health, education, and employment. With an estimated 250 million children under age 5 in low- and middle-income countries at risk of poor developmental outcomes (Black et al., 2016), the need for effective early childhood interventions is particularly urgent. This report documents the results of an effort by the Center for Universal Education (CUE) at The Brookings Institution to develop a tool to collect standardized costs of ECD programs, broadly defined, in low- and middle-income countries. Standardized and accurate cost data is critical for the provision of quality ECD services at scale, for two central reasons:
1. To make the case for investment. Standardized and accurate cost data allows for more precise cost-benefit and cost-effectiveness analysis, which can strengthen the case for investment (Dhaliwal et al., 2012).
2. To make more informed/better investments. Standardized and accurate cost data can support more efficient administration by helping funders
and program managers align their actual and expected expenditures and monitor their use of funds (Myers, 2008b), facilitate investment in the most cost-effective interventions, and allow for sensitivity analyses of cost and quality trade-offs.
Costing is distinguished from financing, where the latter focuses on how money reaches ECD service providers, while costing focuses on the inputs necessary to deliver the services. In determining how much governments, foundations, corporations, and parents should pay for these ECD services, stakeholders analyze both financing and cost information. Financing information describes the myriad flows of funding that are used to deliver a given service, while cost information summarizes the costs of each component of the service (figure 1). For example, an international nongovernmental organization may provide the financing to a nongovernmental service provider for a deworming program, the costs of which may include training for health workers, salaries of health workers, and transportation. Financing should equal costs, unless the program is operating with a profit margin. Consequently, the cost of the program could be calculated by totaling the financing for a program

THE STANDARDIZED EARLY CHILDHOOD DEVELOPMENT COSTING TOOL (SECT)
12
FIGURE 1: EARLY CHILDHOOD DEVELOPMENT FINANCING VERSUS COSTS
International Actors
Domestic Actors
Households
Costs
ECD Service Providers(Public, private for-profit, private non-profit)
International aid
Corporations
Governments
Parents
Philanthropic, religious orgs
Expenditure Expenditure Expenditure
DONATIONS
DEVELOPMENT ASSISTANCE
DONATIONS
DEMAND-SIDE SUBSIDY
FEES, TRANSPORT, VOLUNTEER
HOURS
DEMAND-SIDE SUBSIDY
CASH OR IN-KIND
DONATIONS
BLOCK GRANTS OR
PERFORMANCE-BASED
CONTACTS
Source: Authors’ elaboration

1. INTRODUCTION
13
or totaling the cost of the required inputs and activities.
There has been extensive research on the financing of ECD services. Experts estimate that a minimum public investment of 1 percent of gross domestic product (GDP) is required for the provision of quality early childhood care and education (Neuman & Devercelli, 2013). Combining the public investments required for the education, health, and protection interventions within ECD, it is estimated that between 2 percent and 2.5 percent of GDP should be invested in ECD (Vargas-Barón, 2008). Despite these estimates, domestic governments are only spending an average of 0.1 percent of GDP on ECD (“Financing early childhood development,” 2016). Other sources of financing, both international and domestic, have helped fill this gap. Within the category of international aid, multilateral aid is the greatest source of financing, and has been larger than bilateral aid since 2012. International aid for ECD represents only 2 percent of aid allocated to basic education. Foundations are also playing an increasing role in the financing of ECD (“Financing early childhood development,” 2016). Relative to other social services, parent contributions, both in terms of fees and volunteer time, are significant for ECD services. Data on public per-pupil expenditure for preprimary exists (UNESCO, 2016—especially table 14); however, these expenditures alone are not accurate representations of the costs of services, because they do not capture nongovernment spending.
The last decade has seen progress in developing costing methodologies and collecting cost data on ECD programs (tables B.1–B.4 in Annex B). However, until now, no tool has been available that is flexible enough to cost the range of ECD interventions, sufficiently sensitive to capture the variables critical to high quality ECD, and has the mechanisms to produce internationally comparable outputs. Leaders of the ECD community and researchers have called for the “establishment of a set of standards and guidelines that countries could use to produce cost information that would be comparable across countries,” (Levin & Schwartz, 2012) and “national and regional studies on ECD costs and financing” (Vargas-Barón, 2008).
In response to this need, Brookings convened an ECD Costing Working Group in 2014, including representatives of the World Bank, IDB, UNICEF, International Food Policy Research Institute (IFPRI), and Abdul Latif Jameel Poverty Action Lab (J-PAL). As background for the Working Group, Brookings conducted an initial review of cost-collection efforts and published a policy brief (Atinc et al., 2014) and report (Putcha & van der Gaag, 2015) summarizing the current state of research in the sector. When the group reached a consensus that a costing tool was needed, CUE and the Strategic Impact Evaluation Fund (SIEF) at the World Bank established a partnership to develop and pilot such a tool. CUE and SIEF contracted Cornerstone Economic Research to design the tool with them in early 2015, and piloting began in mid-2016.
Interest from potential early users of the tool has been registered across the globe, from funders, governments, and nongovernmental organizations that provide ECD services. In early 2017, SECT was endorsed by the Early Childhood Development Action Network (ECDAN), a partnership between UNICEF and the World Bank, for use by its member organizations. In coming years, the institutionalization of SECT, including the establishment of a central point of supervision and support for tool users, will allow for its widespread utilization and further research.
This report proceeds as follows: section 2 provides background on the ECD sector and previous efforts to collect cost data, section 3 details the process of developing the costing tool, section 4 provides the data and lessons learned in the piloting of the costing tool, section 5 concludes, and Annex A includes summaries of the five pilot exercisizes.

THE STANDARDIZED EARLY CHILDHOOD DEVELOPMENT COSTING TOOL (SECT)
14

2. BACKGROUND
15
2. Background
Characteristics of ECD Costs
The Interventions: From Conception up to Primary SchoolECD interventions include a broad range of programs that target children and their families from conception to entry into primary school, in the sectors of nutrition, health, water and sanitation, education, social protection, and governance (table 2).
What Goes into a Costing Model?There are several strategies for estimating the costs of programs. Myers (2008b) points out that in costing exercises, “the word ‘estimate’” is used … because the process involves a variety of assumptions and choices about how to value resources that make it difficult to say with finality that the cost of Program X is a certain amount, let alone compare directly the costs of Program X with those of Program Y” (Myers, 2008b). The methods for constructing costs based on resources used in operations was first described in the context of education interventions in Levin (1975). Levin & McEwan (2001) provided an updated methodology of steps for cost analysis: first, identify programs,
then find out what resources are used and how much they cost; next, work out overall costs and unit costs per child; and finally, determine who bears these costs. This has been used to collect cost data on programs such as the well-known Perry Preschool program in the United States (Belfield et al., 2006).
ECD costs can be broadly divided into the following three main categories: 1. overhead costs (upper-level management in government, plus design, start-up, and evaluation costs); 2. direct costs (infrastructure construction, teacher salaries, training, food and supplements, uniforms, cash transfers, equipment, direct administration, and monitoring); and 3. imputed costs (volunteer time and opportunity costs of buildings used) (Cornerstone Economic Research, and Myers, 2008a).
The most important variables affecting costs are:
Services provided. ECD services are often provided in combination; for example, food supplements may be distributed in some preschool programs and not in others (Levin & Schwartz, 2012). The effect of bundling services on costs depends on the potential synergies

THE STANDARDIZED EARLY CHILDHOOD DEVELOPMENT COSTING TOOL (SECT)
16
TABLE 2: BASIC BENEFIT PACKAGE (PREGNANCY -60+ MONTHS)
Source: Denboba et al., 2014.
Pregnancy Birth 12 months
24 months
36 months
48 months
60 months
Nutri
tion
Counseling on ad-equate diet during
pregnancy
Exclusive breastfeeding
promotion
Complementary feeding Supplemental feeding
Counseling on optimal feeding practices and nutrition
Iron-folic acid for pregnent women
Therapeutic zinc supplementation for diarrhea
Growth monitoring promotion (prevention and treatment for acute malnutrition)
Micronutrients & fortification
Heal
th
Antenatal visit Immunizations
Attended delivery Deworming
Disease prevention (malaria, mother-to-child transmission of HIV, and other diseases)
Planning for family size and spacing
Access to health care (including well-child visits, screening for delays and disabilities, injury and disease treatment)
Prevention and treatment of meternal depression
Wat
er a
nd
Sani
tatio
n Access to safe water
Hygiene or hand washing
Adequate sanitation
Educ
atio
n
Patent support or training (early stimulation, growth, and development)
Stimulation
Quality early childhood and pre-primary programs
Transition to quality prima-
ry school
Soci
al P
rote
ctio
n
Birth registration
Patrental leave and adequate child care or day care
Social assistance transfer programs (targeted income support, child grant or allowance, conditional or unconditional cash transfers)
Child protection interventions (prevention and response to child abuse or special protection to orphans)
Gove
rnan
ce Goverenance reflecting ECD interests
Policy or regulation in nutrition, health, education, and social protection (child protection regulation

2. BACKGROUND
17
between programs. If the program is less labor intensive, such as deworming, it may not add much marginal labor to another program, and the cost of administering programs jointly could be lower. On the contrary, adding a labor-intensive service such as preprimary education may not result in efficiencies. Further, coordination costs between ministries could arise in bundled programs (Alderman, 2015).
Program frequency and duration. ECD programs, particularly child care, parenting programs, and preschool, vary dramatically in terms of program frequency and duration, from one hour per week to 10 hours per day, five days a week. More vulnerable children may also require more extensive, and often expensive, services (Araujo et al., 2013).
Staff-to-student ratios and staff remuneration. Staff salaries depend greatly on the level of education of the instructors, which can vary greatly. In addition, as mentioned above, volunteers often play a significant role in providing ECD services.
Staff supervision and professional development. ECD programs vary greatly in the degree to which process quality, which has been proven critical to program impact, is supported. Expenditure in this area is often inadequate, because it is more difficult to measure than elements of structural quality (Myers, 2008a and Atinc, 2015).
Geography. Rural programs may have higher unit costs for several reasons: providers may serve fewer children, there may be higher transportation costs, and costs of transporting building or learning materials to remote locations could be higher. On the other hand, wage standards in urban areas may make programs more expensive (Putcha & van der Gaag, 2015).
Delivery setting. ECD interventions delivered in beneficiaries’ homes, rather than purpose-specific centers, require lower infrastructure costs, but could require more transportation expenses.
Program scale. Small-scale programs may have higher unit costs than large-scale programs, as overhead costs are generally higher to cover fixed start-up costs (Putcha & van der Gaag, 2015). However, programs beginning the process of
scaling up or at scale may have higher unit costs because of the up-front investments required for system building, and additional costs of extending services to harder-to-reach populations (Bernal et al., 2015 and Atinc, 2015).
Given this variation, it is critical to collect descriptive information on the program, and to collect disaggregated cost information to understand the context and quality of the service provided (Caronongan et al., 2016 and Glassman, 2015). Previous costing efforts have collected cost data on low-quality programs, which has created challenges in terms of policy recommendations (Charles & Williams, 2008). Sustainably high process quality often requires a systemic view rather than a programmatic view, which may add to costs (Araujo, 2015). Overall, limited data exists on the trade-offs between costs and process quality (Atinc, 2015). In addition, the cost of scaling existing programs is complicated by the fact that marginal costs may be less than average costs, if key infrastructure is already in place (Glassman, 2015).
There are a number of challenges associated with collecting cost data on ECD programs:
• There are often many actors involved in providing one service, which means it can be difficult to capture the full picture, and to avoid double counting of beneficiaries.
• ECD services more frequently rely on volunteer labor than in other areas of education. Volunteer labor is a form of imputed cost, and despite their importance, imputed costs are often omitted from costing analyses (Myers, 2008b).
• Accounting systems often count expenditures rather than costs, and separate capital costs from operating costs (Levin & Schwartz, 2012). Consequently, capital expenditures are often poorly accounted for; for example, counted only in the year of initial expenditure (Myers, 2008a).
• Estimating unit costs, rather than overall program costs, introduces the challenge of measuring the number of beneficiaries of a given program. In particular, ECD programs may have spillover benefits to other children in the family; for example, to all siblings born after a parenting education intervention.
THE STANDARDIZED EARLY CHILDHOOD DEVELOPMENT COSTING TOOL (SECT)
18
Despite these challenges, Atinc et al. (2014) note that “many of the challenges related to spending and costing information are not unique to ECD services. But the knowledge base for the costs of these services seems particularly poor, in part reflecting the wide range of services provided, the multiplicity of government agencies involved, and the heterogeneity in the modalities and quality of service delivery” (Atinc et al., 2014). Once costs have been collected, there are multiple ways to analyze them, including by source of financing, by center, by region, by program setting, by activities, by project stages, capital versus recurrent costs, direct versus indirect costs, fixed versus variable costs, or total costs versus yearly/daily/hourly costs (Myers, 2008a).
Earlier Costing Efforts Overall, a significant amount of cost data has been collected, particularly in high-income countries; however, risks of inaccuracy are high and comparability is low. Collection efforts for cost data range from the collection of costs at the program level, to estimates based on key program costs, to estimates based on key variables in a program area, to estimates at the global level. In particular, the availability of unit-cost data varies widely between types of intervention: while regional data estimates are available for unit costs of micronutrient supplementation, antenatal care, and skilled attendance at delivery, only limited or context-specific data is available on the unit costs of services for maternal education and child protection (for more detail, see table B.1 in Appendix B). Specific estimates of preprimary costs are also available for a number of countries, ranging (in 2006) from a low of $168 in Zanzibar to $8,867 in the United States (table B.2 in Annex B). These cost estimates are meant to be illustrative, and should be viewed in light of challenges and risks of inaccuracies above. The respective programs differ greatly in the type of services they provide, the duration of services, the qualifications of teachers, and other variables. For example, across 32 child care programs in Latin America and the Caribbean, the average staff salary was $578.8 per month in 2010 with a standard deviation of 380.6. Younger children also require higher ratios of staff to children, which increase salary
costs (Myers, 2008a). Overall, there is significant variation in the availability of cost data across ECD interventions, and tremendous variation within the costs of preprimary education. Data is more prevalent for preschool interventions, while it is lacking for parenting/home-visiting interventions.
Given the variation in cost data across countries, it could be useful when looking at existing cost estimates to compare costs as a percentage of per-capita GDP, to take into account variation in wages, and the fact that a range of models were used for estimating those costs. Van Ravens & Aggio (2008) estimate preprimary costs as a function of per-capita GNP, making the assumption that teacher salary will be three times the per-capita gross national product (GNP), 800 hours of instruction for a child per year, two classes per day for each teacher, 20 students per teacher, and salary comprising 60 percent of total costs. Given these parameters, they estimate the cost of preschool per child to be 12.5 percent of per-capita GNP, or 12.5 percent of an average annual salary to provide a year of preschool. Table 3 provides an illustrative example of costs of a range of ECD services as a percentage of per-capita GDP, and a comparison to the cost of primary education. The cost of preschool ranges from 8 percent to 61 percent, with an average of 14.7 percent of per-capita GDP if Niger, an outlier within the existing data, is excluded. Parent education home visiting programs are approximately half the cost of preschool, and childcare programs are approximately 150 percent greater. Data from four countries in Africa indicates that primary education is slightly less expensive than preschool costs per child.
Some efforts have been made to estimate the projected cost of providing preprimary education in all low- and middle-income countries. Wils (2015) developed an exponential cost-modeling function for education services, including preprimary education, based on pupil-teacher ratio, salaries, and GDP per capita. The model includes recurrent and infrastructure costs, with the assumption that salaries account for 75 percent of recurrent costs, and that the cost of reaching marginalized children is 20 percent higher than the non-marginalized. The model sets the pupil-teacher ratio to 15 and sets salaries to be 4.4 percent of GDP per capita. The

2. BACKGROUND
19
cost-per-child estimates under these assumptions are displayed in table B.2, and the total annual cost of reaching 100 percent preprimary enrollment by 2030 was calculated to be $31.2 billion (UNESCO, 2015). As a note, the recent report by the International Commission on Financing Global Education Opportunity updates these universal preprimary costs cost estimates to approximately $10 billion per year in low-income countries and $200 billion per year in low- and middle-income countries (The International Commission on Financing Global Education Opportunity, 2016).
A number of costing tools have been developed (see table B.3 in Annex B for the full comparison table). These tools include the UNICEF regional prototype, which estimates the cost of scaling up preprimary and parenting programs, and the Van Ravens and Aggio interactive cost estimation model (Van Ravens & Aggio, 2008) which estimates the cost of early childhood services based on assumptions about the cost of early childhood
teachers, the duration of the program and the group size. In addition to these tools, various costing initiatives (summarized in table B.4 in Annex B) have analyzed data on ECD without sharing the tool used to collect the data, such as the IDB’s cost-benefit sensitivity analysis on the costs of ECD interventions of different qualities.
While this is a thorough review, we cannot guarantee that it is comprehensive, but rather it is intended to capture key resources and the breadth of tools available. As is evident from table B.3, no costing tool developed to date has the capabilities of SECT.
Home Visits Daycare Preschool Primary School
Chilei 4% 12% 8% -
Colombiaii 6% 18% 12% -
Guatemalaiii 7% 23% 16% -
Beniniv - - 15% 12%
Cameroonv - - 14% 7%
Cote d’Ivoirevi - - 22% 11%
Nigervii - - 61% 35%
TABLE 3: ESTIMATED COST OF EARLY CHILDHOOD DEVELOPMENT SERVICES (AS PERCENTAGE OF GDP PER CAPITA)
i Berlinsky & Schady, 2015 and World Bank, 2016. Cost for enhanced structural quality and enhanced process quality assumed to be between 2010 and 2015, GDP per capita in 2011 U.S. dollars.ii Berlinsky & Schady, 2015 and World Bank, 2016. Cost for enhanced structural quality and enhanced process quality assumed to be between 2010 and 2015, GDP per capita in 2011 U.S. dollars.iii Berlinsky &Schady, 2015 and World Bank, 2016. Cost for enhanced structural quality and enhanced process quality assumed to be between 2010 and 2015, GDP per capita in 2011 U.S. dollars.iv Data for 1998, Jaramillo & Mingat, 2008. v Data for 1998, Jaramillo & Mingat, 2008. vi Data for 2000, Jaramillo & Mingat, 2008. vii Data for 1998, Jaramillo & Mingat, 2008.

THE STANDARDIZED EARLY CHILDHOOD DEVELOPMENT COSTING TOOL (SECT)
20

3. THE STANDARDIZED ECD COSTING TOOL (SECT)
21
3. The Standardized ECD Costing Tool (SECT)
2. Pia Britto, Mariavittoria Ballotta, Elinor Bajraktari, Ivelina Borisova, & Ana Nieto (UNICEF); Julieta Trias, Sophie Naudeau & Amanda Devercelli (World Bank); Harold Alderman (IFPRI); Florencia Lopez-Boo, Caridad Araujo & Julian Cristia (IDB); Kyle Murphy (J-PAL)
Developing SECTCUE work on costing ECD interventions began in 2014 with comprehensive desk research identifying available cost data and costing tools for ECD (described in Section 2). A multi-agency working group was also established on costing ECD,2 followed by an expert workshop on costing ECD in collaboration with UNICEF, the World Bank, IFPRI, and the Inter-American Development Bank (IDB). CUE published a policy brief (Atinc et al., 2014) and a working paper (Putcha & van der Gaag, 2015) on the topic. After this research and collaboration, experts agreed on the need for a standardized costing tool.
The development of SECT (figure 2) comprised two main phases: the development of the tool, and the piloting and refining of the tool in conjunction with SIEF and Cornerstone Research. In phase 1, a first draft of the tool was submitted in early June 2015.
A number of further drafts were developed after discussions with the SIEF and CUE scholars about a range of methodological issues.
In phase 2, the tool was piloted for ECD programs in Bangladesh, Malawi, Mali, Mexico, and Mozambique. As part of phase 2, a “lessons learned” form was developed, to support the collection of data regarding the use of the tool. Further details of the pilot programs, and lessons learned, can be found in section 4 and Annex A.
Use and CapabilitiesThe initial goal with the development of SECT was to provide methodological consistency to costing early childhood programs in order to support comparability across countries and interventions so that more and better investments could be made in young children. The pilot costing exercises

THE STANDARDIZED EARLY CHILDHOOD DEVELOPMENT COSTING TOOL (SECT)
22
2014
2015
2016
2017
FIGURE 2: DEVELOPMENT OF SECT
Source: Authors’ elaboration
MARCH 2014
Costing working group established
NOVEMBER 2014–FEBRUARY` 2015
Brookings Policy Brief and Working Paper on Costing
ECD published
AUGUST–DECEMBER 2015
Tool revised in collaboration with Working Group
MAY–AUGUST 2016
–Bangladesh pilot costing–Mali pilot costing
–Malawi pilot costing
DECEMBER 2016–MAY 2017
Final revisions to tool and manual based on pilots
JANUARY–APRIL 2016
SIEF evaluation programs selected for costing
OCTOBER–NOVEMBER 2016
–Mozambique pilot costing–Mexico pilot costing
JUNE–SEPTEMBER 2017
Report of lessons learned and three regional launch events
DECEMBER 2014
Costing workshop held at Brookings
JULY 2015
First version of tool presented at UNICEF workshop in Rwanda
3. THE STANDARDIZED ECD COSTING TOOL (SECT)
23
revealed two central findings with respect to the use of the tool. First that, while such cross-program and cross-country comparisons are possible with the tool, they must be done with great care to ensure that similar programs are being compared. Second, the pilot costing exercises revealed an enormous demand for this type of a tool at the local and programmatic level for both budgeting and planning and for advocacy purposes. As the tool is designed, it can be used both at the global level and at the local level. It can also be used by a wide variety of organizations, from governments to investors to service providers, and is flexible enough to capture the full variety of interventions aimed at early childhood.
The tool can be used to encourage more investment in ECD interventions by using the cost data in cost-benefit analyses to demonstrate to policymakers the value of investing in young children, as well as to carry-out cost-effectiveness analyses of specific programs to demonstrate the cost of achieving stated impact measures. Second, the tool can be used to support more informed investments. More accurate and consistent cost data supports more efficient administration, by helping funders and program managers align their actual and expected expenditures and monitor use of funds (Myers, 2008b). This data also facilitates estimation of the cost of scaling up programs and the analysis of cost and quality trade-offs, as well as helping to ensure investment in the most cost-effective interventions. This is useful for planning future interventions, and can support accurate budgeting for ECD programming. The tool can also be used to support results-based financing: understanding the precise costs of an intervention allows governments and funders to accurately price results-based financing contracts, ensuring efficiency in government or donor spending.
Specifically, the tool provides users with a set list of ECD activities, which include exclusive breastfeeding, parental education, and preprimary education. However, users can rename these activities to more accurately capture their program’s interventions, or can use one of the blank tool sheets for this purpose. This flexibility means that the tool can be applied across all ECD sectors, and
can also capture a range of interventions across integrated programs.
SECT also allows for data to be entered and analyzed in a range of ways. Data can be analyzed as ECD-specific line items, allowing the user to track types of spending across a range of programs, including personnel, training, and equipment costs. Costs can also be analyzed in terms of the main activity subcomponents of an integrated program: for example, users could enter data onto two different sheets for a program with a micronutrient supplementation and an early learning component, and compare the costs of these programs. This flexibility also means that data can be entered into the same tool for multiple service providers, and for programs that incorporate both publicly and privately funded components.
Various elements within the tool are automatically incorporated, including exchange rates, inflation rates, and purchasing power parity. This means that if the user enters the currency and years of the costing exercise into the “model setup” sheet, then the amounts will be automatically converted into U.S. dollars, and adjusted for inflation. Moreover, the model also allows for the entry of imputed costs, or the invisible costs that are not incurred directly by the program—for example, the cost of volunteers. This component could prove helpful for budgeting for scaled-up versions of programs that include such imputed costs, to provide an indication of how much it would truly cost to implement the program at scale. In addition to this, the tool allows the users to capture the longevity of different ECD inputs, by providing a calculation to amortize the costs over a specific time period. Users can indicate this period in the main activity sheets of the tool, and thus spread the costs of inputs over their “useful life.”
Tool Design Lessons
GoalsEnsuring that the tool would be accessible to a wide range of users was an important goal when designing SECT. First, every attempt was made to keep things simple and transparent in the design.

THE STANDARDIZED EARLY CHILDHOOD DEVELOPMENT COSTING TOOL (SECT)
24
This is reflected in the final version of the Excel version of the tool: a standard sheet structure and standard headings across sheets; the use of distinct colors to indicate where users are expected to enter descriptions or data, or not do anything because the cells contain formulas; and finally, the use of dropdown menus wherever possible. In terms of transparency, there are no hidden sheets or formulas in the tool. This means the expert user can easily review the methodology and check the math, while the less experienced user can also see how the model works.
Tensions between different goalsThe design of the tool brought to light tensions between different aims. The first tension was between standardization and flexibility: to promote a uniform costing approach and comparability, the tool standardizes many things—the way amortization is calculated; the year for calculating real values, the currency-conversion calculations and the number of main activities and item categories. However, this limits flexibility and the possibility that different users may need or want to use the tool in different ways. For instance, some users may need to specify different main activities or different item categories, or they may need more space to specify inputs. We have sought to maintain the maximum level of flexibility by allowing the user to change certain things, such as the names of main activities and item categories.
Another tension emerged between automation and technical accuracy. Wherever possible and practical, formulas are used to automate the tool. For instance, the year settings, the currency-conversion calculations, and the real-value calculations are all driven by information the user enters on the “model setup” sheet. However, in some instances, there is a tension between automating certain functionalities and maintaining technical accuracy. For example, calculating unit costs correctly must take into consideration the nature of the inputs and outputs and the link to beneficiaries (the theory of change). These considerations require a deeper understanding of the program in order to calculate them correctly. Therefore, while certain aspects of the unit-cost analysis have been automated, there are concerns
about its technical legitimacy when used in different circumstances.
LayoutDeciding on the layout of the tool was challenging. Data is entered into the tool across a number of different worksheets: start-up and management costs each have their own sheet, and data can then be added separately for each component of a program. Costs per beneficiary can be viewed on a separate “beneficiaries” tab, where these costs are also broken down by the individual program components. In the case of a one-component intervention, this division is less important.
Challenges for Comparability Ensuring costing results are comparable across programs is complex, due to differences in program design, program components, program inputs, beneficiaries, timing, and currency.
Program designThere is very little standardization in the design of ECD programs. Programs may have many different structures and systems, which means it is crucial to describe the program in detail within the costing tool. For this reason, the costing tool requires the user to provide key information on the “model setup” sheet about the design of the program and the context in which it is being implemented; and draw a diagram on the “program diagram” sheet showing the program structure.
Main activitiesECD programs encompass a wide range of sectors and interventions. SECT suggests a standard set of activity names based on the basic package of ECD interventions defined in the World Bank’s Stepping Up Early Childhood Development publication (Denboba et al., 2014). Users are encouraged to use these activity names to facilitate the collection of consistent cost data across programs. However, it is recognized that a program may not fit within the categories provided, in which case there is flexibility to change the main activity names on the “model setup” sheet, as well as the tab names of the main activity sheets.
3. THE STANDARDIZED ECD COSTING TOOL (SECT)
25
Program inputsAs with main activities, different programs will use different inputs. To facilitate comparability, SECT asks users to classify inputs into a standard set of item categories, which are defined in the tool. This list also provides three “own item” placeholders, where the user can add program-specific item categories, and the user may also rename the existing item categories. The tool also allows users to differentiate between Direct Costs and Imputed Costs. Finally, the tool allows the user to capture differences in the longevity of the usefulness of different inputs, by spreading costs over the expected “useful life” of the specific input. The ECD tool requires the user to indicate the amortization period for each input, and then uses this information to calculate nominal estimated amortized costs for the period covered by the costing.
Program beneficiariesECD programs are intended to benefit young children, but how they do so and exactly which groups of children are targeted differs across programs. There are programs that target caregivers in order to reach children, while others target ECD practitioners. Some provide materials to ECD centers for use by children, others provide materials to families. SECT provides space for information on beneficiaries to be captured on the main activity sheets. This information is summed and used in the automated unit-cost analysis set out in the “beneficiaries” sheet.
Implementation periodsECD programs will be implemented across different time periods and for different lengths of time. SECT requires users to enter the year covered by the costing, and this date is used to set the years for the costing and the years for the real-cost and
3. World Bank Databank: Inflation, consumer prices (annual %), http://data.worldbank.org/indicator/FP.CPI.TOTL.ZG. The 2014 data was updated in January 2017 from http://databank.worldbank.org/data/reports.aspx?source=2&series=FP.CPI.TOTL.ZG&country=#4. World Bank Databank: Official exchange rate (LCU per U.S. $, period average), http://data.worldbank.org/indicator/PA.NUS.FCRF?page=15. World Bank Databank: purchasing power parity conversion factor, GDP (LCU per international $), http://http://data.worldbank.org/indicator/PA.NUS.PPP/countries?display=default. 2015 data updated in January 2017 from http://databank.worldbank.org/data/reports.aspx?source=2&series=PA.NUS.PPP&country=#
currency-conversation calculations. To facilitate comparisons of program costs across years, it is necessary to adjust nominal cost information into real costs that account for the impact of inflation. SECT is set up to calculate real values for 2015, so that all programs costed using it will show real costs for the same year. The tool contains inflation data from 2005 to 2015, drawn from the World Bank databank.3
Different currencies. ECD programs are implemented across countries with different currencies. SECT uses exchange rate4 and purchasing power parity5 information from the World Bank databank to convert local currencies into U.S. dollars. The tool contains official exchange rate and purchasing power parity data from 2005 to 2015.
Methodological DiscussionsExtensive discussions on a range of methodological issues took place during the design of SECT. This section summarizes the main methodological issues discussed and how they are dealt with in the design of SECT.
Beneficiary information and average unit costsEstablishing the average cost per child of a particular program is of great interest to ECD stakeholders. Average unit cost analysis is simply total cost divided by the total number of children served. Calculating average unit cost is straightforward for very simple ECD programs where the direct beneficiaries are children, and the costs of the program are self-contained and known. However, very often, the average unit cost analysis is complicated by the design of ECD programs: first,

THE STANDARDIZED EARLY CHILDHOOD DEVELOPMENT COSTING TOOL (SECT)
26
many ECD programs focus on providing training to parents or ECD practitioners. While the intention is that children aged 0–6 should by the ultimate beneficiaries, usually the output information counts the number of parents/practitioners trained with little or no information on the number of children aged 0–6 linked to those parents/practitioners. Therefore, one can calculate the cost per person trained, but to arrive at a unit cost per child would require further information.
• In addition to this, many ECD programs have different components, with groups of children receiving different services, and in some instances, children receive more than one of the services. In these circumstances, there is the possibility of double counting children and thus calculating a lower unit cost than actually applies. It may be the case that the program does not intend all children to receive the same benefit, in which case a single unit cost per child would be misleading. Developing unit costs based on the different services and groups of children served would be the way to go, however, automating this is simply not possible.
• There are also ECD programs that focus on the provision of materials or the building of infrastructure (ECD centers). In both instances, these inputs are intended to serve children for a number of years, which makes it difficult to establish the cost per child served.
• Finally, the cost per child will also depend on how long the children are in the program: for example, if the dosage is one year, then the total cost divided by total beneficiaries gives you the cost per child per year. However, if the dosage is two years and the children overlap during a three-year program period, the total cost divided by the total beneficiaries gives you the cost of the two-year intervention per child. That is the unit cost of the intervention, but not in per-year, per-child units (to calculate this, you would need to divide by 2).
Costing programs that build on pre-existing programsMany ECD programs are deliberately designed to support pre-existing ECD services, usually with a view to improving the quality of such services. One
of the key questions for this type of costing will be about whether to cost only the additional program, or both the existing services and the add-on program. Another consideration will be whether to evaluate the impact of the add-on program alone, or in conjunction with the pre-existing program, and how to understand attribution of outcomes in this scenario.
Marginal costsThe cost of reaching one more child through an existing program is known as the marginal cost. Understanding the marginal cost of a program helps one estimate the cost of expanding a program. The marginal cost can vary significantly as a program expands. Initially, marginal costs are likely to decrease as economies of scale are realized. But at some point, the marginal cost will increase as certain fixed costs need to be incurred (for example, expanding the workforce to work with more children, or building new buildings). Understanding these changes to the marginal cost helps in planning the optimum expansion of a program.
Imputed costs. These are costs invisible in the expenditure of a program, such as the cost of volunteer labor, but nevertheless may be important to performing a cost-benefit analysis. Whether imputed costs are appropriate to include in the costing template will depend on the purpose the exercise is intending to serve. For a cost-benefit analysis, they are appropriate, because they capture the actual costs of providing a service. It could be argued that they are less appropriate in a budgeting exercise, since governments or other implementing organizations will want to know about the actual expenditures on the program, and not the invisible imputed costs.
Developing standardized charts/figures. In the context of the ECD costing model, a range of charts could potentially be created to illustrate the different types of information. The tool includes six charts that are generated automatically, which show the total real cost by item and the total real cost by main activity.

3. THE STANDARDIZED ECD COSTING TOOL (SECT)
27
Key LessonsSeveral key lessons emerged from the design of the costing tool:
Standardizing is difficult. First, the diversity of ECD programs means that it is difficult to create a standardized approach to costing ECD. For this reason, the tool tries to strike a balance between providing a standard list of main activities, at the same time as providing users with the option of changing and adapting these.
Open design has risks. The tool also takes an open-design approach, meaning that users can edit and adapt the tool to their needs. The risk of this is that the formulas in the spreadsheet can be easily overtyped or deleted, which may cause other parts of the sheet to malfunction.
Some things are better not automated. While several elements in the tool are fully automated, such as the summing of main activity costs and the exchange rates, there are some elements that would be challenging to automate and still maintain methodological correctness.
Maintaining control of the tool. Since the tool is an Excel workbook, it will be difficult to control its distribution in its current format, as users can simply email the tool to each other. Although this ease of transmission is desirable, it will be difficult to ensure that users are working with the most up-to-date version, and also challenging to collect the data from completed costing exercises.
Measuring intensity and quality is a challenge. Finally, there is no easy way to factor in the intensity or quality of interventions. While the tool asks users to enter information on these aspects, given the diversity of programs within the ECD sector, it is difficult to set a standard for measuring the quality of delivery that can form the basis for a simple measure of cost effectiveness. Consequently, the cost information gathered with SECT must be combined with evaluative studies to explore whether interventions are cost effective.

THE STANDARDIZED EARLY CHILDHOOD DEVELOPMENT COSTING TOOL (SECT)
28

4. PILOTING SECT
29
4. Piloting SECT
Steps for Using the Tool to Conduct Costing
1. Develop an understanding of the key features of the program.
2. Before data is entered into the costing tool, it is essential to begin with an overall outline (for example, using the questions in box 1).
3. It will also be helpful to draw a diagram of the different actors and institutions involved in program delivery and management.
4. Complete the “model setup” questions in the tool, especially number of beneficiaries, years of program intervention, and currency of costing.
5. Break down the program into its major components (for example, start-up, management, delivery of parenting education). In the tool, each separate activity receives its own Excel worksheet.
6. For each major component, identify all item costs (for example, personnel, training, materials) and enter these into the tool.
7. Find the cost per unit for each item, and the quantity used in each year.
8. Calculate the total cost of the program, as well as the unit cost per beneficiary. (These functions are automated by the tool, but caution is needed if different components have different numbers of beneficiaries).
Five Country Case Studies: Data and Applications
Variation in Interventions and Use of the Tool across CasesThe case studies used for the pilot phase of the interventions varied in terms of their components and complexity, and therefore in terms of the requirements they have of the tool. Details on the costing pilots of Bangladesh, Malawi, Mali, Mexico and Mozambique can be found in Annex A.
Lessons from Data Collection and Tool Use Testing the tool in pilot countries provided opportunities to observe how the tool could actually be put to use by ECD providers, and
THE STANDARDIZED EARLY CHILDHOOD DEVELOPMENT COSTING TOOL (SECT)
30
generated a range of lessons, as well as several key pieces of feedback. Practitioners had several hopes of using the tool, including the desire to compare expenditures within programs, as well as spending between programs. Practitioners also expressed an interest in calculating the unit cost of current programs.
HighlightsExcel knowledge. Piloting the tool revealed that those with good Excel knowledge found using the tool easy, and that if data is already in Excel, it can be easily copied across into the tool.
Capturing expenditure data. The tool is designed around the formula: cost = No. of inputs X price. However, in most instances, the finance data simply reflects expenditures against a list of item accounts. To accommodate this, the total expenditure for each of the years is entered on the main activity
sheets in the unit price columns, and “1” is entered as the number of units. This enables the capturing of the expenditure information, while keeping the math of the costing formula in the tool intact.
Ease of tool modification. The tool can be modified by users in a variety of ways, from adding lines and renaming main activities, to adding data sheets and links to the main activity sheets.
ChallengesPiloting the tool revealed a range of practical and methodological challenges that needed to be resolved (table 4).
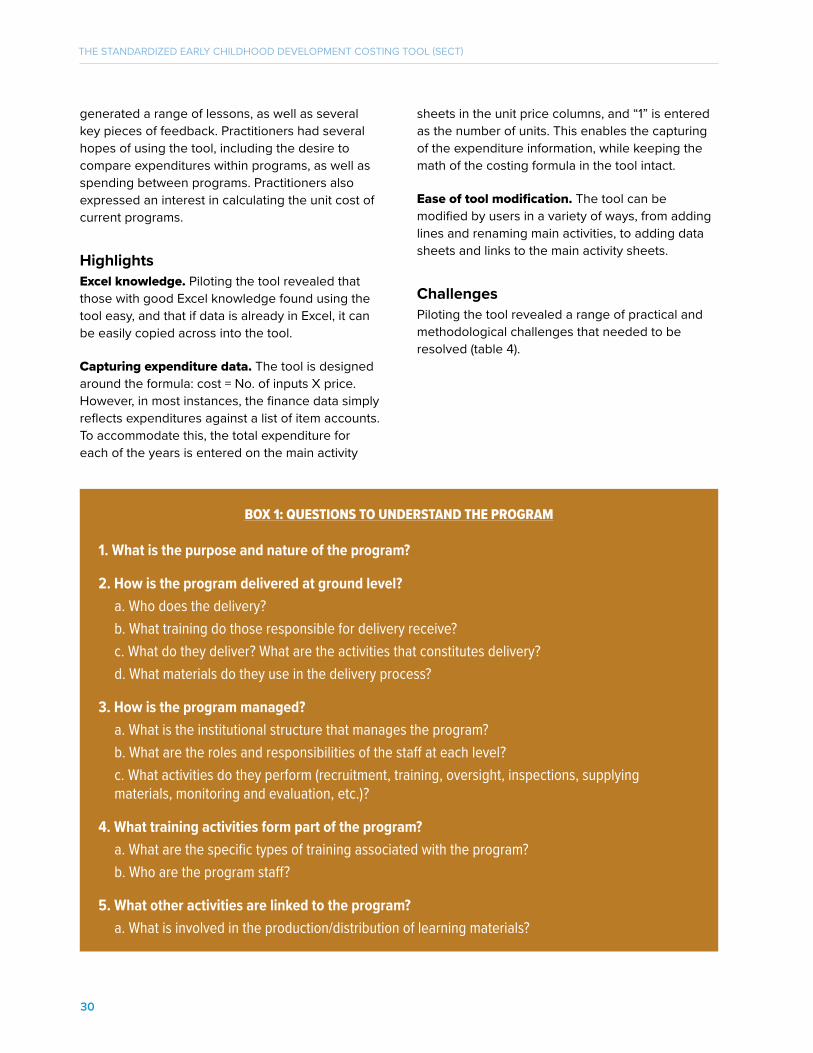
BOX 1: QUESTIONS TO UNDERSTAND THE PROGRAM
1. What is the purpose and nature of the program?
2. How is the program delivered at ground level?a. Who does the delivery?b. What training do those responsible for delivery receive?c. What do they deliver? What are the activities that constitutes delivery?d. What materials do they use in the delivery process?
3. How is the program managed?a. What is the institutional structure that manages the program?b. What are the roles and responsibilities of the staff at each level?c. What activities do they perform (recruitment, training, oversight, inspections, supplying materials, monitoring and evaluation, etc.)?
4. What training activities form part of the program?a. What are the specific types of training associated with the program?b. Who are the program staff?
5. What other activities are linked to the program?a. What is involved in the production/distribution of learning materials?

4. PILOTING SECT
31
Challenge Proposed Solution
Staff capacity. (a) Using the tool: Not all people responsible for managing the delivery of ECD programs will have strong Excel capabilities, and some may be intimidated by the amount of information in the tool.
(b) Understanding the costing process: Lack of understanding about costing exercises leads some people to focus only on the delivery aspect of programs. In order to fully cost a program, tool users must have information about design, setup, management, and monitoring and evaluation.
Offer training to people who will be using the costing tool.
Data Access. Accessing data can be a challenge, even within large organizations, since it is not always clear who has the data, and there may be restrictions on publication of the data.
Identify data needed at the beginning of the exercise, as well as who has the data.
Variety of actors. Most programs involve a number of organizations that play different roles. All role-player costs should be included in a costing. However, this greatly complicates the costing exercise, because it means engaging with multiple actors.
Identify one actor who will take the lead in the costing exercise and who also agrees to coordinate communication with other actors.
Data accuracy. One key concern here is capturing precise expenditures. It may not always be clear from the tool whether expenditures are planned or actual. Caution needs to be exercised in avoiding double counting of costs and beneficiaries. Furthermore, data on fixed costs vs. recurrent costs are necessary for unit cost and scale-up cost analysis.
Ensure that the training highlights the issues of capturing precise expenditures.
Selection of unit. One key challenge related to the choice of the unit when conducting the unit cost analysis. For example, when conducting the unit cost of a parenting program, one must choose between the unit be the family, the target child identified based on age or all children in the household.
Select the unit based on the intended outcome of the program and potentially a related evaluation of the program.
TABLE 4: CHALLENGES AND POTENTIAL SOLUTIONS FOR SECT
Source: Authors’ elaborations

THE STANDARDIZED EARLY CHILDHOOD DEVELOPMENT COSTING TOOL (SECT)
32
RisksNumber of beneficiaries and unit costs. Of the five pilot programs, only one was simple enough in design for the unit-cost function in the tool to produce a methodologically sound result. This function could not be applied to the other four programs, which had multiple components with different beneficiary groups. Calculating a single unit-cost number for them would have produced a misleading/wrong number.
Consistency of what is included/excluded in costing exercises. Each person responsible for conducting a costing exercise has a different perspective of what costs should be included and excluded. For instance, should the overhead costs of the organization responsible for implementing the program be included? What about the cost of evaluative studies? These differences affect the comparability of costing results, and if they are significant, may lead to wrong conclusions being drawn from such comparisons.
Costing versus actual expenditures. Activity-based costing is designed to calculate costs based on demand, input, and price information. This facilitates a discussion around the design and technical efficiency of the program. This information can be used for scaling up programs and for compiling budgets. However, in most instances, the people involved in the pilots were not in a position to provide detailed demand, input, and price information. They had actual expenditure information by item, but were unable to break it down into input units and prices. In these instances, SECT simply became an alternate tool for presenting and classifying this expenditure information. Given the lack of unit input and price information, these “costing results” are less useful when it comes to planning the scale-up for programs and for compiling budgets.
Pilot CostingThe programs implemented in the five pilot countries differ in terms of intervention type, scale, and complexity, from a parenting education program run by just one provider in Bangladesh,
6. Mozambique parental education was intended to reach children 0-8.
to a preschool building program implemented by three different institutions in Mozambique. The number of beneficiaries served ranged from approximately 11,144 in Malawi, to 40,474 receiving the micronutrient intervention in Mali. All interventions served children aged 0–6 years6, although the specific age ranges depended on the intervention, with Mozambique and Bangladesh targeting children aged 0–3 years, and Mali targeting ages 0–6.
Data AvailabilityLimited data was available for some of the pilots. In Malawi, the overall donor allocation of the project is available, totaling $1.1 million, but the information in the costing exercise covers only the play and learning materials from UNICEF, which made up 34 percent of the overall project costs. Separate data for each of the four components of the intervention is not available. In Mali, expenditure data for the parts of the program implemented by Save the Children was available, but not the costs for the parts implemented by the government. Since the government interventions were provided to all groups, it is not possible to break down the costs by intervention component.
In contrast, for Bangladesh, a program with only one component, the costing captures the overall cost broken down into categories. The program is costed based on the number of units and unit price. In Mexico, data was provided by the National Council for Educational Development (CONAFE) for two states, Nayarit and Aguascalientes. The costing captures training and management costs, as well as the delivery costs in these states, but only for 2016.
The Mozambique costing pilot was considerably more complex: funding for the program was provided by the World Bank to the Ministry of Education, which then contracted services out to three third-party providers in five provinces. Expenditure data was provided by the World Bank and the Ministry of Education, as well as data from three service providers, resulting in three separate costing exercises. All third-party providers provided expenditure data up to the end of 2016, and

4. PILOTING SECT
33
budgets for 2017 since the year was incomplete at the time of the exercise. Availability of data broken down by upfront costs (primarily related to the infrastructure component of the program) introduced limitations in the ability to analyze unit and scaling costs.
ImplementationGaps between planning and implementation have important consequences for the results of costing exercises. In Bangladesh, where it was hoped that the parenting-education package would be rolled out for all children aged 0–3 years in the intervention areas, the impact evaluation (Chinen & Bos, 2016) found that only 53 percent of families had received at least one of the intended materials. While the program was intended to reach more than 18,000 children, the actual number is therefore likely to be much lower. This creates challenges for estimating a unit cost per child.
Other challenges included delays in payments from the ministry to service providers in Mozambique which is reflected in the ministry’s expenditure data. An impact evaluation of the program in Mexico (Cardenas et al., 2017) found low parental take-up of the program: of a total of 65 possible sessions, the average number attended by caregivers in the first year was only 11 sessions (the median was 4).
Costs by Main ActivityProgram costs for each case study can be broken down by the main activities of the program.7 While these breakdowns depend on how data is entered into the tool, they do offer insight into the relative weight of each part. In Bangladesh, program management makes up more than half (52 percent) of the program, meaning that for each $7 spent per child, nearly $4 of this will go toward management costs, which include staff salaries and operational costs. In Mali, the Early Childhood Care and Development (ECCD) component made up the largest proportion of costs. However, while the overall proportion of costs dedicated to program management was only 32 percent, this varied greatly between the components. While the management of ECCD
7. In Malawi, data is only available on one program activity.
made up 11 percent of overall costs and 15 percent of the total ECCD costs, the management of the micronutrient component was 21 percent of the overall costs, but 76 percent of the total cost of the nutrition component. Within the management of the micronutrient component, the largest item cost was for administration, which includes the costs of security, housing, and electricity. In both Mexican states, the most expensive main activity was the delivery of ECD services, at an average of 44 percent of total costs, which included the salaries of frontline personnel and the cost of program resources. Nayarit spent a higher proportion of its expenditure on training compared to Aguascalientes, which spent a larger portion on management costs.
Item CostsPersonnel was a large component of spending for all the case studies. In a review of childcare and parenting programs across Latin American and the Caribbean, the percentage of program expenditure used to cover staff wages ranges from 0 to 96.8, with an average of 51.8 percent for the 26 programs in 17 countries for which data was available (Araujo et al., 2013). In the costing pilot for Bangladesh, personnel costs were the largest item cost, at 35 percent of overall spending for frontline/direct-delivery staff; while in Mali, the combined costs of frontline and other personnel accounted for 26 percent of overall costs. In Mexico, the highest cost in both states was for personnel, making up an average of 67 percent of expenditures. Of this, direct-delivery personnel averaged 18 percent of expenditures. Resources for the program, including paper and books, came to an average of 6 percent across the two states.
Unit Costs and Costed Scale-UpsGiven the heterogeneity across the five programs costed in the pilot exercises, chosen intentionally to provide variety in program type and geography, neither unit costs nor scale-up costs should be compared directly across programs. Even for similarly named programs, differences in methodology including frequency and dosage of

THE STANDARDIZED EARLY CHILDHOOD DEVELOPMENT COSTING TOOL (SECT)
34
the intervention could lead to significant differences in cost. The data below are therefore provided as a summary of the pilot costing exercises rather than for comparative purposes.
The cost per child for parenting education in Bangladesh was an estimated $7–$14 per child (2015 U.S. dollars). Micronutrient fortification in Mali was estimated at $8 per child. The cost of the early childhood care and parenting intervention in Mali was $96 per child. The cost of providing ECD materials in Malawi was approximately $36 per child, or $2,011 per ECD center, but since these materials will presumably be used over the course of several years, the cost per child is lower—$12 if it is assumed that the materials last for three years, and $7 if they are usable for five. The cost per child of the parenting-education program in Mexico was $174 in Nayarit and $202 in Aguascalientes, for a unit cost per child of $185 if the costs of both states are combined.
In Mozambique, an analysis of unit costs using existing data revealed some important lessons. Since the program is comprised of three components: the building of preschools, preschool education and parenting training, a separation of the fixed or one-time costs associated with infrastructure from the ongoing costs of service provision is critical to providing accurate unit cost estimates. However, the current expenditure tracking by service providers does not separate out the management and personnel costs for the infrastructure component from those for the other two components. Since upfront costs cannot be estimated accurately with the data breakdown available currently, using existing data would inaccurately portray unit costs as quite high.
Costed scale-up analyses were performed for the programs in Mali, Mexico, and Mozambique, estimating the total cost of providing a similar program nationwide. In Mali, providing the program to the total population of children aged 0–68 would cost $416 million, or $32 million for the nutrition component and $384 million for the ECCD and parenting component.
8. Population data from 2009.
In Mexico, the population for the scale-up of the program are the children aged 0–4 in rural and marginalized communities nationally, for a total of 4.4 million children. To roll out this program to all eligible children, the model uses the average unit cost per child of $185, which comes to $8.1 million Since the costs were slightly different in the two states, the cost of the scale-up differs depending on which figure is chosen: if the unit cost for Nayarit is used to estimate the cost of the rollout, the total is $764 million; while if the Aguascalientes figure is used, it would be $883 million.
A scaling exercise was conducted with the partners in the Mozambique program to demonstrate the importance of an accurate breakdown of expenditure data however, to avoid misconceptions, those data are not included in the study.
When Could the Tool be Used?
Example A: Cost-Benefit AnalysisThe Ministry of Education in Bangladesh would like to make a case to the Treasury that funding should be increased for early childhood programs. Cost data would be compared to the financial benefit of early childhood programming such as lower crime rates, reduced dependence on social welfare, increased employment rates. The tool could then lay the foundations for an evidence-based proposal for increased funding for early childhood programs.
Example B: Comparison between Two ProgramsA state government in the United States would like to know which of two similar early childhood programs should receive funding. The tool could be used by policymakers in a cost-effectiveness analysis of each of the programs to decide between these two programs, to evaluate which achieves the outcomes at the lowest price.

4. PILOTING SECT
35
Example C: Scale-Up and BudgetingThe government of Uganda would like to know the cost of expanding preschool access using a public-private partnership, which combines public funding with private services. The tool could be used to estimate the unit and scale up costs of providing the program, to help the government and potential donors with budgeting and planning.
Example D: Adding Components to an Existing ProgramA government in the Caribbean wants to improve the quality of an existing home-visiting program by adding parental stimulation. The costing tool could be used to estimate the marginal cost of adding additional components to the program.

THE STANDARDIZED EARLY CHILDHOOD DEVELOPMENT COSTING TOOL (SECT)
36

5. CONCLUSIONS AND POLICY RECOMMENDATIONS
37
5. Conclusions and Policy Recommendations
Collecting standardized and accurate cost data on early childhood interventions will provide oppor-tunities for a variety of actors to make the case for increased investment, as well as making more and better investments in the most cost-effective programs. ECD programs can span a range of activities across the nutrition, health, water and sanitation, education, social protection, and gov-ernance sectors. In addition to this, the costs of these programs will fall into several categories (overhead, direct, and imputed), and will depend on a range of variables, according to the types of services provided, program frequency and duration, and program scale.
The availability of data from earlier costing efforts varies by sector: while regional data estimates are available for unit costs of micronutrient supplementation, antenatal care, and skilled attendance at delivery, only limited or context-specific data is available for the unit costs of maternal education and child-protection services. While a variety of costing tools have been developed to date, none has the flexibility or capabilities of SECT.
SECT provides methodological consistency to costing ECD programs, to ensure comparability across programs and countries, while accommodating the full range of potential interventions, to capture the broad field of ECD interventions. The tool can be used to conduct cost-effectiveness analysis of programs to demonstrate the benefits of supporting quality ECD, and to encourage increased investment. It can also be used to promote more informed investments, allowing funders and program managers to monitor use of funds and align actual and expected expenditures.
In the process of designing the tool, lessons were learned and improvements made to ensure it would be as effective as possible. A key priority was making the tool simple and user friendly, which is why so many calculations are automated. However, this can at times be in tension with ensuring technical accuracy: for example, in a case where there are multiple sets of beneficiaries and no

THE STANDARDIZED EARLY CHILDHOOD DEVELOPMENT COSTING TOOL (SECT)
38
clear unit cost. The complexity and variety of ECD programs was also a challenge in the develop-ment of the tool, which emphasized the need to make the tool as flexible as possible, while at the same time maintaining comparability.
Piloting the costing tool generated a further set of lessons and improvements. Each of the five pilot countries had different types of interventions and activities, as well as costing structures of various degrees of complexity. Using the costing tool in practice was challenging for those without expe-rience in Excel, which spurred the creation of more simplified models. The process of piloting also revealed the importance of gathering clear information about the nature of the intervention, the roles of the different actors, and how the different parts fit together—before any data was collected or entered into the tool.
Data availability was a key challenge in some of the pilots, which constrained the ability of the costing tool to create a full picture of each program. In addition to this, gaps between plans and implementation emphasized the need to accurately track expenditures rather than budgets, and the number of children actually served. The unit-cost analysis revealed a wide range of costs per child between the different programs, which is unsurprising given the variation in program types and populations served. Personnel costs tended to account for the largest proportion of item costs across the programs and countries.
SECT provides a long-needed concrete tool to facilitate making a case for ECD investments, making investments that are more informed, and improving efficiency in planning and budgeting. The ac-tions described below would help ensure wide dissemination and use of SECT in the coming years.
1. Support Data Collection, Management, and AccountabilityDonors are encouraged to support and help build the capacity of governments and non-state pro-viders in the collection and management of expenditure data. Comparable and methodologically sound ECD cost analyses rely on the quality and availability of program data. Improved and more efficient administration of ECD programs via SECT depend on the management of data. In order to take SECT forward, and to ensure that it can be used by the widest possible audience, improve-ments in how data is collected and managed will be critical for many stakeholders. Organizations funding or operating ECD services are encouraged to take responsibility for collecting timely and accurate expenditure data on their programs and ensuring that the data is easily retrieved. Widen-ing data accessibility would help hold organizations accountable for the services that they fund and provide.
2. Disseminate The Standardized ECD Costing ToolBroad dissemination of the tool would support the development of a rich database of ECD costs across regions, intervention types, and program funding and delivery models. Dissemination efforts must encompass a range of strategies, targeting governments and policymakers, multilaterals and private donors, service providers and program evaluators. Opportunities include dissemination

5. CONCLUSIONS AND POLICY RECOMMENDATIONS
39
through regional networks and through the work of donors and service providers. The ECD Action Network (ECDAN), a partnership between the World Bank and UNICEF, which includes several of the key organizations active in early childhood issues, would be a crucial partner in sharing the tool. The tool could also be disseminated through academic organizations and through courses that train ECD leaders and practitioners.
3. CreateA Knowledge Hub for ECD CostingCreating a knowledge hub for the use of SECT would involve a number of distinct actions:
Management of the toolThe knowledge hub would manage use of the tool and support early users in the application of the tool, as well as manage the translation of the tool and accompanying documents into other languag-es.
Data centralizationThe knowledge hub would establish a global database on ECD costs, as well as manage the collec-tion of costing exercise results.
Data analysisThe knowledge hub could work with partners engaged in costing exercises to perform analyses on the collected data, including costed implementation plans at scale, simulations of the effects of quality variation on cost, linkages between cost and evaluation data, and cost-benefit analyses.
Creation of an online platformThe knowledge hub would provide an internet-based platform on which SECT and the resulting data could be housed. This would mean negotiating between the competing priorities of flexibility and standardization, to ensure consistency in costing methodology.
4. DevelopA Training Module for SECTThe development of a standard training module for SECT would ensure broad and correct use of the tool. Capacity could be expanded across geographical regions and user types through a train-ing-of-trainers model. The aim of such training would be to promote methodological consistency in the costing, increase understanding of the functions that have been automated, and strengthen understanding of unit costs.

THE STANDARDIZED EARLY CHILDHOOD DEVELOPMENT COSTING TOOL (SECT)
40
References

5. CONCLUSIONS AND POLICY RECOMMENDATIONS
41
AbouZahr, C., Cleland, J., Coullare, F., Macfarlane, S., Notzon, F., Setel, P., & Szreter, S. on behalf of Monitoring of Vital Events Writing Group. (2007). The way forward. The Lancet, 370(9601), 1791-99. doi: http://dx.doi.org/10.1016/S0140-6736(07)61310-5
Adriana, J. & Mingat, A. (2008). Can early childhood programs be financially sustainable in Africa? In M. Garcia, A. Pence, & J. L. Evans (Eds.), Africa’s Future, Africa’s Challenge: Early childhood care and development in sub-Saharan Africa (pp. 459-486). The World Bank. Retrieved from: https://openknowledge.worldbank.org/bitstream/andle/10986/6365/427000PUB0Afri1sclosed-0Feb025020081.pdf?sequence=1
Alejandro, A. (2008). A national experience in ECCD costing, financing, and resource mobilization: The Colombian case. In E. Vargas-Barón & S. Williams (Eds.), Coordinators’ Notebook, 30, 33-36. Retrieved from: http://www.ecdgroup.com/cg2/wp-content/uploads/2016/12/ECD-CoNo30.pdf
Alderman, H. (2015). Early childhood development: Does bundling services for young children and their families reduce costs? Education Plus Development. The Brookings Institution. https://www.brookings.edu/blog/education-plus-develop-ment/2015/01/27/early-childhood-development-does-bundling-services-for-young-children-and-their-families-reduce-costs/
Araujo, M.C. (2015). Early childhood development: Three things experts agree on about outcomes, quality, and costs. The Brookings Institution. Retrieved from: https://www.brookings.edu/blog/education-plus-development/2015/02/02/early-childhood-development-three-things-experts-agree-on-about-outcomes-quality-and-costs/
Araujo, M.C., Lopez-Boo, F., & Puyana, J.M. (2013). Overview of early childhood development services in Latin America and the Caribbean. Inter-Amer-ican Development Bank. Retrieved from: https://publications.iadb.org/bitstream/handle/11319/3617/BID_Panorama_ENG%20%28Web%29.pdf?se-quence=2
Atinc, T. M. (2015). Early childhood development: We know the benefits, but what are the costs? The Brookings Institution. Retrieved from: https://www.brookings.edu/blog/education-plus-develop-ment/2015/01/13/early-childhood-development-we-know-the-benefits-but-what-are-the-costs/
Atinc, T. M., Putcha, V., & van der Gaag, J. (2014). Costing early childhood development services: The need to do better. Global Economy and Development Policy Paper 2014-04. The Brookings Institution. Retrieved from: https://www.brookings.edu/wp-content/uploads/2016/06/ECD-Poli-cy-Brief_final.pdf
Belfield, C., Nores, M., Barnett, S., & Schweinhart, L. (2006). The High/Scope Perry Preschool Program: Cost-benefit analysis using data from the age-40 follow up. The Journal of Human Resources, 41(1), 162-190. doi: 10.3368/jhr.XLI.1.162
Berlinsky, S. & Schady, N. (2015). The early years: Child well-being and the role of public policy. Inter-American Development Bank. Retrieved from: http://www.iadb.org/en/research-and-data/dia-2015-the-early-years-child-well-being-and-the-role-of-public-policy,18093.html
Bernal, R. (2013). Costos de la política de atención a la primera infancia en Colombia. Washington, D.C.: Inter-American Development Bank.

THE STANDARDIZED EARLY CHILDHOOD DEVELOPMENT COSTING TOOL (SECT)
42
Bernal, R., Sirali, Y., & Naudeau, S. (2015). Early childhood development: What does it cost to provide it at scale? The Brookings Institution. Retrieved from: https://www.brookings.edu/blog/education-plus-development/2015/01/20/early-childhood-development-what-does-it-cost-to-provide-it-at-scale/
Biersteker, L., Streak, J., & Gwele, M. (2008). Toward an adequate ECD centre subsidy for children under 5 in South Africa: A costing of centre delivery. In E. Vargas-Barón & S. Williams (Eds.), Coordinators’ Notebook, 30, 37-40. Retrieved from: http://www.ecdgroup.com/cg2/wp-content/uploads/2016/12/ECD-CoNo30.pdf
Bhutta, Z., Das, J., & Rizvi, A. (2013). Evidence-based interventions for improvement of maternal and child nutrition: What can be done and at what cost? London: The Lancet Nutrition Interventions Review Group and Maternal and Child Nutrition Study Group.
Black, M.M., Walker, S.P, Fernald, L.C.H., Andersen, C.T., DiGirolamo, A.M., Lu, C., McCoy, D., Fink, G., Shawar, Y.R., Shiffman, J., Devercelli, A.E., Wodon, Q.T., Vargas-Baron, E. & Grantham-McGregor, S. (2016). Early childhood development coming of age: Science through the life course. The Lancet, 389(10064), 77-90. Retrieved from: http://dx.doi.org/10.1016/S0140-6736(16)31389-7
Brandon, R. (2008). Policy and finance simulations for designing access to high-quality ECD experienc-es: Lessons learned from applications in the U.S. In E. Vargas-Barón & S. Williams (Eds.), Coordinators’ Notebook, 30, 47-51. Retrieved from: http://www.ecdgroup.com/cg2/wp-content/uploads/2016/12/ECD-CoNo30.pdf
Cardenas, S., Evans, D., & Holland, P. (2017). Esti-mating the effects of a low-cost early stimulation and parenting education programme in Mexico: 3ie Impact Evaluation Report 57. New Delhi: Interna-tional Initiative for Impact Evaluation (3ie).
Caronongan, P., Kirby, G., Boller, K., Modlin, M., & Lyskawa, J. (2016). Assessing the implementation and cost of high quality early care and education: A review of literature. OPRE Report 2016-31. Wash-ington, DC: U.S. Department of Health and Human Services, Administration for Children and Families, Office of Planning, Research, and Evaluation.
Charles, L. & Williams, S. (2008). A model to support ECD decision-making: Caribbean regional experiences with costs and simulations. Coordi-nators’ Notebook, 30. Retrieved from: http://www.ecdgroup.com/cg2/wp-content/uploads/2016/12/ECD-CoNo30.pdf
Chinen, M. & Bos, J. (2016). Impact evaluation of the Save the Children early childhood stimulation program in Bangladesh: Final report. Wash-ington, D.C.: American Institutes for Research. Retrieved from: http://pubdocs.worldbank.org/en/163331484753270396/SIEF-Bangladesh-End-line-Report-Nov2016FINAL.pdf
Denboba, A., Sayre, R., Wodon, Q. T., Elder, L.K., Rawlings, L.B., & Lombardi, J. (2014). Stepping up early childhood development: Investing in Young Children for High Returns. World Bank Group. Re-trieved from: https://olc.worldbank.org/sites/default/files/Stepping%20up%20Early%20Childhood%20Development_ENG_0_0.pdf
Dhaliwal, I., Duflo, E., Glennerster, R., & Tulloch, C. (2012). Comparative Cost-Effectiveness Analysis to Inform Policy in Developing Countries: A General Framework with Applications for Education. Abdul Latif Jameel Poverty Action Lab (J-PAL), MIT. Retrieved from: https://www.povertyactionlab.org/sites/default/files/publications/CEA%20in%20Education%202013.01.29_0.pdf
Evans, B., Hutton, G., & Haller, L. (2004). Closing the sanitation gap: The case for better public funding of sanitation and hygiene. Paper prepared for OECD Roundtable on Sustainable Development. Retrieved from: http://www.ircwash.org/sites/default/files/Evans-2004-Closing.pdf

43
Glassman, A. (2015). Early childhood development: Four lessons from health for costing ECD programs. The Brookings Institution. Retrieved from: https://www.brookings.edu/blog/education-plus-develop-ment/2015/02/09/early-childhood-development-four-lessons-from-health-for-costing-ecd-programs/
Global Partnership for Education. (2017). Education costs per child. Retrieved from: http://www.global-partnership.org/funding/education-costs-per-child.
Horton, S., Alderman, H., & Rivera, J. (2008). The challenge of hunger and malnutrition: Copenhagen Consensus Challenge Paper. Copenhagen: Copen-hagen Consensus Center.
Issa, S.S. & Evans, J.L. (2008). Going to scale with effective ECD interventions: What is involved? A costing model of the Madrasa ECD Programme in East Africa. In E. Vargas-Barón & S. Williams (Eds.), Coordinators’ Notebook, 30, 41-45. Retrieved from: http://www.ecdgroup.com/cg2/wp-content/uploads/2016/12/ECD-CoNo30.pdf
Jaramillo, A. & Mingat, A. (2008). Early childhood care and education in sub-Saharan Africa: What would it take to meet the Millennium Development Goals? In M. Garcia, A. Pence & J.L Evans (Eds.) Africa’s future, Africa’s challenge: Early childhood care and development in sub-Saharan Africa (pp. 51-70). Washington, DC: World Bank. Retrieved from https://openknowledge.worldbank.org/bitstream/handle/10986/6365/427000PUB0Afri1sclosed-0Feb025020081.pdf?sequence=1
J-PAL. (2015). Detailed J-PAL costing template. Retrieved from: https://www.povertyactionlab.org/research-resources/cost-effectiveness
Kakabadze, Natalia. (2016). Early Childhood Inter-vention Costing. Tbilisi.
Levin, H. M. (1975). Cost-effectiveness analysis in evaluation research. In M. Guttentag & E. Struening (Eds.), Handbook of Evaluation Research, 2, 89-122. Beverly Hills, CA: Sage Publications.
Levin, H. M., & McEwan, P. (2001). Cost-effective-ness analysis: Methods and applications. Thousand Oaks, CA: Sage Publications.
Levin, H. & Schwartz, H. (2006). Costs of early childhood care and education programmes. Background paper prepared for the Education for All Global Monitoring Report 2007: Strong foundations: Early childhood care and education. Retrieved from: http://unesdoc.unesco.org/imag-es/0014/001474/147471e.pdf
Levin, H. & Schwartz, H. (2012). Comparing costs of early childhood care and education programs: An international perspective. Hacienda Pública Española Review of Public Economics, 201 (2/2012), 39-65.
Martinez, S., Naudeau, S., & Pereira, V. (2012). The promise of preschool in Africa: A ran-domized impact evaluation of early childhood development in rural Mozambique. Retrieved from: http://www.savethechildren.org/atf/cf/%7B-9def2ebe-10ae-432c-9bd0-df91d2eba74a%7D/MARTINEZ_NAUDEAU_PEREIRA.MOZ_ECD_RE-PORT-FEB_7_2012.PDF
Mason, J., Hunt, J., Parker, D., & Jonsson, U. (1999). Investing in child nutrition in Asia. Asian Develop-ment Review 17, 1, 1-32. Retrieved from: https://www.adb.org/publications/investing-child-nutrition-asia
Meyers, C. (1998). The case for preprimary edu-cation: The cost effectiveness of Shishu Kaksha Centres in Nepal. Early Childhood Counts. Re-trieved from http://www.ecdgroup.com/download/sc1cppeo.pdf
Myers, R. (1998). Financing early childhood care and education services. A discussion paper prepared for the Organization for Economic Coop-eration and Development: Education and Training Division.
Myers, R. (2008a). Costing early childhood care and development programmes. Online Outreach Paper 5. The Hague, The Netherlands: Bernard van Leer Foundation. Retrieved from: http://www.bibalex.org/Search4Dev/files/284527/116788.pdf

THE STANDARDIZED EARLY CHILDHOOD DEVELOPMENT COSTING TOOL (SECT)
44
Myers, R. (2008b). A note on costs and costing of early childhood care and development pro-grammes. In E. Vargas-Barón & S. Williams (Eds.), Coordinators’ Notebook, 30, 29-32. Retrieved from: http://www.ecdgroup.com/cg2/wp-content/uploads/2016/12/ECD-CoNo30.pdf
Myers, R. & Valle, E. (2008). Costs of preschool education in Mexico, constructing cost estimates at the center level: An experiment. Hacia una Cultura Democrática, A.C. Retrieved from: http://acude.org.mx/biblioteca/calidad/costs-of-preschool-educa-tion-in-mexico.pdf
Neuman, M.J. & Devercelli, A. E. (2013). What matters most for early childhood development: A framework paper. Systems Approach for Better Education Results (SABER) working paper series; No. 5. Washington, DC: World Bank Group. Retrieved from: https://openknowledge.worldbank.org/handle/10986/20174
Ogunyinka, E.K. (2013). Analysis on cost and financing of pre-school education in Nigeria. International Journal of Innovative Education Research 1(2), 55-63. Retrieved from: http://www.academia.edu/4658845/Analysis_on_Cost_and_Fi-nancing_of_Pre-school_Education_in_Nigeria
Ozler, B., Fernald, L.C.H., Kariger, P., McConnell, C., Neuman, M., & Fraga, E. (2016). Combining pre-school teacher training with parenting education. A cluster-randomized controlled trial. Policy Research Working Paper 7817. Washington, D.C.: World Bank Group.
Putcha, V., & van der Gaag, J. (2015). Investing in early childhood development: What is being spent, and what does it cost? The Brookings Institution. Retrieved from: https://www.brookings.edu/research/investing-in-early-childhood-development-what-is-being-spent-and-what-does-it-cost/
van Ravens, J. & Aggio, C. (2008). Expanding early childhood care and education: How much does it cost? Working papers in early childhood develop-ment, 46. Retrieved from: http://files.eric.ed.gov/fulltext/ED522696.pdf
Results for Development. (2016). Financing early childhood development: An analysis of internation-al and domestic sources in low- and middle-income countries, Volume I. Background paper for the International Commission on Financing Global Education Opportunity. Retrieved from: http://www.r4d.org/knowledge-center/financing-early-child-hood-development-analysis
Rickus, G., Barnett, W.S., & Nores, M. (2016). Cost of Preschool Quality (CPQ). New Brunswick, NJ: Center on Enhancing Early Learning Outcomes. Retrieved from http://nieer.org/research/re-search-instruments#cpq
Singh, S., Darroch, J., & Ashford, L. (2013). Adding it up: The need for and cost of maternal and newborn care. New York: Guttmacher Institute.
van Spijk, J., Groot Bruinderink, M., Janssens, W., & van der Gaag, J. (2010). Cost-benefit analysis of the Roving Caregivers Programme: A study on the costs and benefits of RCP in Dominica, Grenada, Jamaica, St. Lucia, and St. Vincent and the Grena-dines. Amsterdam: AIID.
The International Commission on Financing Global Education Opportunity. (2016). The Learning Gener-ation: Investing in Education for a Changing World. Retrieved from: http://report.educationcommission.org/report/
Waiser, M. (1999). Early childhood care and devel-opment programs in Latin America: How much do they cost? The World Bank: Washington, D.C.
WHO, UNICEF, and World Bank. (2009). State of the world’s vaccines and immunization. (3rd ed.) Geneva: World Health Organization. Retrieved from: http://apps.who.int/iris/bitstream/10665/44169/1/9789241563864_eng.pdf
Whittington, D., Hanemann, W.M., Sadoff, C., & Jeuland, M. (2008). The challenge of water and sanitation: Copenhagen Consensus Challenge Paper. Copenhagen: Copenhagen Consensus Center.

45
Wils, A. (2015). Reaching education targets in low and lower-middle income countries: Costs and finance gaps to 2030. Background paper prepared for the Education for All Global Monitoring Report 2015. UNESCO. Retrieved from: http://unesdoc.unesco.org/images/0023/002325/232560e.pdf
UN (n.d.). Sustainable Development Goals. Retrieved from: http://www.un.org/sustainabledevel-opment/sustainable-development-goals/
UNESCO. (2015). Pricing the right to education: The cost of reaching new targets by 2030. Education for All Global Monitoring Report. Policy Paper 18. Retrieved from: http://unesdoc.unesco.org/imag-es/0023/002321/232197E.pdf
UNESCO. (2016). Education for people and planet: Creating sustainable futures for all. Retrieved from: http://unesdoc.unesco.org/imag-es/0024/002457/245752e.pdf
Vargas-Barón, E. (2008). Toward establishing national and international investment targets to expand early childhood services. In E. Vargas-Barón & S. Williams (Eds.), Coordinators’ Notebook, 30, 17-21. Retrieved from: http://www.ecdgroup.com/cg2/wp-content/uploads/2016/12/ECD-CoNo30.pdf
World Bank. (2012). Project paper on a proposed additional credit in the amount of SDR 25.8 million to the Republic of Mozambique for an Education Sector Support Project. The World Bank. Retrieved from: http://documents.worldbank.org/curated/en/935541468057844869/pdf/659680PJPR-0P120Official0Use0Only090.pdf
World Bank. (2016). Effects of quality improvement strategies on early childhood development in community-based childcare centers in Malawi: A randomized trial. Retrieved from: http://www.worldbank.org/en/programs/sief-trust-fund/brief/effects-of-quality-improvement-strate-gies-on-early-childhood-development-in-communi-ty-based-childcare-centers-in-malawi

THE STANDARDIZED EARLY CHILDHOOD DEVELOPMENT COSTING TOOL (SECT)
46
Annex A: Country Case Studies

BANGLADESH CASE STUDY
47
Bangladesh Case Study
Population (2015) 161,000,000
GDP per Capita (2015) (purchasing power parity 2011)
$3,137
Income Level Lower-middle income
Poverty Rate (national poverty line 2010)
31.5
Early Childhood Education Enrollment (gross enrollment ratio 2010–15)
32%
Under–5 Mortality (per 1,000 live births 2015)
37.6
Maternal Mortality Ratio (per 100,000 live births 2015)
176
Sources: World Bank, United Nations Development Programme
BackgroundThe government of Bangladesh has recognized the importance of early childhood, with a range of policies in place to guide the implementation of ECD programs. Government ministries with ECD-relevant policies include the Ministry of Women and Children’s Affairs, which launched The Comprehensive Early Childhood Care and Development Policy in 2013, and the Ministry of Primary and Mass Education, which launched the National Education Policy in 2010, which emphasizes the role of preprimary education (World Bank, 2017). The implementation of ECD programs in Bangladesh is highly fragmented, with programs spread across 18 different government ministries (Chinen & Bos, 2016).
ECD indicators have seen considerable improvement in Bangladesh, with mortality rates for children under age 5 dropping from 198 in 1980, to 37.6 in 2015 (United Nations Development Programme (UNDP)). Inequality between urban and rural areas is evident in child health indicators: in 2012, 27 percent of urban children were underweight, compared with 33 percent in rural areas (BBS & UNICEF, 2014).
Enrollment in preprimary education has risen in recent years, from 895,000 children in 2010, to 2.9 million in 2015 (World Bank, 2017). However, child

THE STANDARDIZED EARLY CHILDHOOD DEVELOPMENT COSTING TOOL (SECT)
48
development indicators are poor in Bangladesh, with only 21 percent of children ages 36-59 months on track in literacy/numeracy. For rural children, this percentage is even lower, at 18 percent, and for children whose mothers have no education, only 1 in 10 children is on track in this domain (BBS & UNICEF, 2014).
Project DescriptionSave the Children’s Early Childhood Stimulation (ECS) program trains providers of services in community health care and family planning to encourage early stimulation and maternal responsiveness for caregivers of children under 3 years (Chinen & Bos, 2016). The intervention in Bangladesh is built on the existing structures of the National Nutrition Services (NNS), which trains service providers to deliver nutrition support to families with young children. Save the Children added additional elements to the NNS training of service providers to promote early stimulation: the program provided households with materials along with early-stimulation counseling. As part of the intervention, caregivers received the following materials:
• Child development card• Key messages booklet• Book with words and images relating to
household objects• Book with words and images relating to
objects in nature
The program intended to deliver these resources, and the accompanying counseling, during routine home visits, or trips to a community clinic. The aim was for pregnant women to receive a minimum of fifteen visits, and mothers of older children to receive at least three visits.
Costing ExerciseThe costing exercise captures the following:
• Start-up costs: the program launch, as well as administration and travel costs
• Management costs: Save the Children personnel, and the operational costs of running head and district Offices
• Provision of parental education: the cost of program materials, and training associated with the distribution of these materials
The ECS program builds on the existing NNS structures—additional training is provided to the health workers, but the program does not pay their salaries. Therefore, the costing captures only the additional training costs, and not the cost of the underlying structure, so the costs of this program need to be considered within this context. The costing exercise took place in July 2016; design and start-up costs are captured for 2014, while management and activity costs are captured for 2014 and 2015. Personnel costs are calculated from annual salaries.
Project Details
Name of project Save the Children Early Childhood Stimulation Program in Bangladesh
Country Bangladesh
Region(s) Kulaura, Muladi, and Satkania Upazilas (Counties)
Primary delivery region category All types
Primary target group (mothers, children, etc.) Mothers of children under age 3

BANGLADESH CASE STUDY
49
Child beneficiary age Children aged 0–3
Total child beneficiaries 18,644 children (number of children in delivery areas)
National income quintile of majority of beneficiaries
Lowest
Type of intervention (breastfeeding promotion, preschool, etc.)
Parent education (counseling and program materials such as child development card, two picture books, and a booklet for parents)
Location(s) of intervention (health center, home, etc.)
Community clinic, immunization events (EPI centers), limited home visits (intervention integrated into existing services)
Duration of overall intervention per beneficiary (from first interaction to end of activities)
Average level of exposure to program materials 12.3 months (The range was 0–18 months.)
Frequency of activities On average, two counseling sessions per family,
Dosage of activities (duration of each interaction with beneficiary)
5–8 minutes during routine visit
Direct delivery personnel minimum level of education (years schooling + other training)
Class 8 or above
Child-to-delivery personnel ratio Not relevant
Implementing agent Save the children
Implementing agency category Nongovernmental organization
Current program funders Save the Children
Primary current program funder category Nongovernmental organizations
Out-of-pocket fees for participation None
Dates of program implementation 2014–2015
Date of costing exercise July 2016
Total program cost (2015 U.S. $) $133, 548
Unit cost per child (2015 U.S. $) $7–$14 (see cost analysis below)

THE STANDARDIZED EARLY CHILDHOOD DEVELOPMENT COSTING TOOL (SECT)
50
Cost Summary
3%Travel & Accommodation
2% Program Resources
FIGURE A.1: REAL DIRECT COSTS, BY ITEM (2015 U.S. $)
35%Personnel (other)
26% Administration
(indirect overheads)
19% Training (other)
15% Knowledge
Sharing
8% Design, Start-Up, and Evaluation of
Program
FIGURE A.2: DIRECT COSTS, BY MAIN ACTIVITY
52%Program Management
40%Parent Education about Child
Development
Cost AnalysisThe total program cost was $133,548 (2015 U.S. dollars), with a unit cost of $7 per child. This is calculated using the total number of children under age 3 in treatment areas. However, as discussed above, only half of the households in the sample reported receiving any materials at all, so the $7 per-child figure should be interpreted with caution. In the sample population in the impact evaluation, only 53 percent of households reported receiving
any of the four materials. If we assume that only 53 percent of children in the intervention areas received the intervention materials, then this means the total number of beneficiaries would be 9,881. In this case, the program cost per child in 2015 U.S. dollars was $14.
The costliest part of the program was the management, which totaled $69,437 in 2015 U.S. dollars, or 52 percent of program costs. This amount included the salaries of Save the Children

BANGLADESH CASE STUDY
51
staff and the administration of head and district offices. Parent education accounted for 40 percent of overall costs, which included the packs of household program materials and training. Start-up costs, including the cost of launching the program, and administration costs made up 8 percent of total spending. When analyzed by item, the bulk of spending (61 percent) went to administration and personnel costs. Training accounted for 19 percent of overall costs, while knowledge sharing and program resources together account for only 17 percent.
Impact EvaluationThe program was evaluated with funding from the SIEF using a randomized control trial: 78 community clinics were assigned to treatment or control groups. The control clinics received only NNS programs, while the treatment groups received NNS and the ECS program. A sample of families was surveyed at baseline from November 2013 through January 2014, and at the end September–December 2015 (Chinen & Bos, 2016).
Several implementation issues faced the ECS program: delays meant mothers had 4–6 months less exposure to the implementation period than planned. The survey also found that many parents in the treatment areas did not receive the materials (only 53 percent of households reported receiving any materials). Of those who received the materials, 51 percent of them received these in the community clinic, while only 17 percent received them in their homes. On average, households reported receiving 1.7 sessions relating to early childhood stimulation, when it was intended that the minimum number of sessions would be three.
The evaluation concluded: “The program did not meaningfully change the parenting knowledge or overall home environment outcomes we measured.” However, positive effects in a range of child outcomes were observed, including measures of cognitive and language skills, as well as improved anthropometric measures such as weight for age. Since the program had no detectable effects on parenting, the evaluation authors suggest that effects on child outcomes could be
due to the program increasing the effectiveness of the NNS.
ConclusionsBangladesh faces many challenges in the area of early childhood, with nearly 80 percent of children aged 3–5 falling behind on literacy and numeracy milestones. The ECS program builds on the existing NNS program to train healthcare workers to provide stimulation counseling to parents of young children. The costing exercise captures the start-up, management, and delivery costs of the program—but does not include the costs of the existing NNS program. The largest item-expenditure category was personnel, at 35 percent of overall costs. While the total population of children in the delivery areas was 18,644, the impact evaluation found that only 53 percent of households reported receiving any program materials, so the unit cost of the intervention is estimated to be between $7 and $14 per child. The impact evaluation found that while parenting knowledge was not affected by the intervention, there were a range of positive effects on child outcomes, perhaps due to the program reinforcing the NNS. In Bangladesh, SECT could be used to analyze the cost of the NNS in combination with the add-on stimulation program, to help policymakers budget for a wider rollout of the program.

THE STANDARDIZED EARLY CHILDHOOD DEVELOPMENT COSTING TOOL (SECT)
52
References
World Bank. (2017). Bangladesh: Building the human capital of tomorrow: An impact evaluation of the early childhood stimulation program. World Bank: Washington, D.C.
Bangladesh Bureau of Statistics (BBS) and UNICEF Bangladesh. (2014). Bangladesh Multiple Indicator Cluster Survey 2012-2013: Progotir Pathey: Final report. Dhaka, Bangladesh. Retrieved from: https://mics-surveys-prod.s3.amazonaws.com/MICS5/South%20Asia/Bangladesh/2012-2013/Final/Ban-gladesh%202012-13%20MICS_English.pdf
Chinen, M. & Bos, J. (2016). Impact evaluation of the Save the Children early childhood stimulation program in Bangladesh: Final report. Wash-ington, D.C.: American Institutes for Research. Retrieved from: http://pubdocs.worldbank.org/en/163331484753270396/SIEF-Bangladesh-End-line-Report-Nov2016FINAL.pdf

BANGLADESH CASE STUDY
53

THE STANDARDIZED EARLY CHILDHOOD DEVELOPMENT COSTING TOOL (SECT)
54

MALAWI CASE STUDY
55
Malawi Case Study
BackgroundWhile under-5 mortality dropped considerably in the last two decades, Malawi has high rates of malnutrition and HIV/AIDS, and literacy rates below regional averages. (World Bank, 2010). The most recent UNICEF Multiple Indicator Cluster Surveys (MICS) found that 42 percent of children under age 5 were moderately or severely stunted (National Statistics Office of Malawi, 2014), which is similar to the 48.3 percent recorded in the 1995 survey (Ministry of Economic Planning and Development, 1995).
In 2014, nearly 40 percent of children aged 36–59 months were enrolled in an early childhood education program. Free primary education was introduced in 1994, resulting in high levels of enrollment in the following years, apart from a drop in 2002-03 due to famine (World Bank, 2010). The percentage of the primary-school-age population enrolled in primary school between 2010 and 2015 was 147 percent, indicating high rates of repetition (UNDP, 2016).
There is a history of support for early childhood interventions in Malawi: the Community-Based Childcare Center (CBCC) program was launched
Sources: World Bank, United Nations Development Programme, UNICEF Multiple Indicator Cluster Surveys.
Population (2015) 17,200,000
GDP per Capita (2015) (purchasing power parity 2011)
$1,113
Income Level Low income
Poverty Rate (2010) 50.7
Early Childhood Education Enrollment (2014)
39.2
Under–5 Mortality (per 100,000 live births 2015)
64
Maternal Mortality Ratio (per 100,000 live births 2015)
634

THE STANDARDIZED EARLY CHILDHOOD DEVELOPMENT COSTING TOOL (SECT)
56
as a pilot in 1989, and by 2007, there were 5,665 operating across the country (Munlathi et al., 2014). The CBBCs, supported by the Ministry of Gender, Children and Social Welfare, provide a wide range of services, including health services, nutrition, stimulation, and play.
Project DescriptionThe Protecting Early Childhood Development project was funded by a loan from the Rapid Social Response (RSP) Multi-Donor Trust Fund through the World Bank, and implemented between 2011 and 2012 by the government in partnership with Save the Children and UNICEF (Ozler et al., 2016). The Ministry of Gender, Children, Disability, and Social Welfare codesigned the intervention with the World Bank and the University of California, Berkeley. The program aimed to improve the supply of play and learning materials, and to strengthen teacher and parent capacity.
The program was designed with three implementation components and a control group: all centers involved in the study received basic play and learning materials from UNICEF. Then, 199 CBCCs in the four study districts selected by the ministry were randomly assigned to each of the treatment groups below:
Group 1 (control): Play and learning materials
Group 2: Play and learning materials + teacher training
Group 3: Play and learning materials + teacher training + teacher incentives
Group 4: Play and learning materials + teacher training + parenting education
The teacher training for groups 1–3 comprised five weeks of residential training, in three parts.
This project enhanced a pre-existing model, and therefore the overall costs do not incorporate the operational costs of the CBCCs, but only the four-component intervention. Separate cost data was only available for the play and learning materials and the teacher incentives, so it is not possible to calculate overall costs for each component, or unit costs per child in each component.
Costing ExerciseThe costing exercise captures the following:
• ECD materials: cost of items and handling fees
• Administration: distribution costs and insurance
The costing includes figures for the overall World Bank disbursements, as well as for the monthly teacher incentives, but these are not incorporated into the analysis, due to uncertainty about their place in the program overall. No data is available for the training of ECD practitioners or the parent education. The costs for the ECD materials are from 2012.

MALAWI CASE STUDY
57
Project Details
Name of project Protecting Early Childhood Development in Malawi—Rapid Social Response (RSP) Project
Country Malawi
Region(s) Balaka, Dedza, Nhkata Bay, Thyolo
Primary delivery region category Rural
Primary target group (mothers, children, etc.) Vulnerable young children served by Community-Based Childcare Centers (CBCCs)
Child beneficiary age Children at baseline of study were 36–61 months
Total child beneficiaries Estimated starting number of 11 144 children
National income quintile of majority of beneficiaries
Lowest
Type of intervention (breastfeeding promotion, preschool, etc.)
Provision of ECD materials, training of ECD practitioners and parents, and a small program of cash transfers. Note: costing exercise only conducted for ECD materials, as other data was unavailable.
Location(s) of intervention (health center, home, etc.)
CBCCs
Duration of overall intervention per beneficiary (from first interaction to end of activities)
Materials were provided to CBCC, which provided services to children for three years until they entered primary schools. The parenting program ran for 12 sessions. The ECD training for CBCC caregivers was a 5-week program. The cash transfers were provided every month for 7 months.
Direct delivery personnel minimum level of education (years schooling + other training)
8
Child-to-delivery personnel ratio 19–1 in the CBCCs
Implementing agent The government of Malawi, Save the Children, UNICEF
Implementing agency category Government, nongovernmental organizations
Current program funders World Bank and the Rapid Social Response Multi-Donor Trust Fund

THE STANDARDIZED EARLY CHILDHOOD DEVELOPMENT COSTING TOOL (SECT)
58
Primary current program funder category Multiple Sources
Dates of program implementation March 22, 2011 to May 31, 2013
Date of costing exercise November 2016
Total program cost (2015 U.S. $) $400,188
Unit cost for ECD materials per child (2015 U.S. $) $36
Cost per center for ECD materials (2015 U.S. $) $2,011
94%Program Resources
6%Administration (direct costs)
FIGURE A.3: REAL DIRECT COSTS, BY ITEM
Cost Summary

MALAWI CASE STUDY
59
Cost Analysis9
The total cost of providing ECD materials to all centers in the study (covering approximately 11,114 children) was $400,188 (2015 U.S. dollars). Unfortunately, separate cost data is not available for the teacher training or parenting education components, thus it is not possible to analyze costs separately for each component of the intervention.
It is not possible to calculate a unit cost per child for the overall program, since there are four different components, including different beneficiaries and different interventions. It is also not possible to calculate a unit cost per component, since data is unavailable for the cost of training ECD practitioners or of parent education. The cost of providing ECD materials to 11,144 children (the approximate number of children in all components) was $36 per child (in 2015 U.S. dollars). However, it would be more appropriate to consider the cost per ECD center, since the play materials were distributed by center. In this case, it cost $2,011 to provide ECD materials to each of 199 centers.
Moreover, we can assume that the ECD materials in each center will be usable past the first year, meaning that the beneficiaries will include multiple years of children. If we assume that the play materials will last three years before being replaced, tripling the number of beneficiaries to 33,432, the unit cost per child is just $12 in 2015 U.S. dollars. If we assume the materials last even longer, for five years, the unit cost will be just $7.
Impact Evaluation The program was evaluated with funding from the SIEF, using a randomized controlled trial. The interventions were measured at 18 months and 36 months after the baseline. At the 18-month follow-up, children in group 4 showed statistically significant improvements in language skills and social behaviors relative to the control group. Group 4 also experienced improvements in parenting quality, as measured by survey interviews
9. The program was funded by two World Bank disbursements, of $515,025 in 2011 and $604,975 in 2012. In addition to this, teachers received cash transfers of MWK 2,000 per month for 7 months ($89 at 2011 exchange rate). These costs were not incorporated into the costing analysis.
with primary caregivers. At the 36-month follow-up, there were no effects at the child level in any of the domains assessed, which suggests a fade-out of the effects of group 4’s treatment. However, the quality of parenting is still higher in group 4 than in the control group or group 2. The impact evaluation found approximately 1.5 trained teachers were present in each school at the 18-month follow-up, which suggests that approximately 25 percent of the trained teachers were no longer teaching. The incentives offered to teachers did not improve their retention. By 36 months, there were only 1.25 teachers trained by the program in each school.
ConclusionsThe Protecting Early Childhood Development project provided learning materials to, and also worked to improve teacher and parent capacity in, 199 communities in rural Malawi. The program and impact evaluation were structured around three intervention components and a control group, which received only the play and learning materials, while the study groups received teacher training, parent training, or teacher incentives. This costing exercise covers only the play and learning materials, and does not include data for the individual components of the intervention. The average cost per child of providing these learning materials was $36, or $2,011 per ECD center. Since it is likely that the ECD centers will reuse the materials, the cost per child is likely to decrease over time. This case study emphasizes the importance of collecting detailed program data: for this complex intervention, the lack of information on some of the components means that it is not possible to compare across the different components of the study, which restricts the possibility of performing cost-effectiveness analysis when comparing the different interventions. With increased data availability, SECT could be used to cost each intervention separately, and therefore to provide more granular information about the cost of providing, or scaling-up, the different interventions.

THE STANDARDIZED EARLY CHILDHOOD DEVELOPMENT COSTING TOOL (SECT)
60
References
Ministry of Economic Planning and Development, National Statistical Office, and the Centre for Social Research. (1996). Malawi social indicators survey 1995. Retrieved from: https://mics-surveys-prod.s3.amazonaws.com/MICS1/Eastern%20and%20Southern%20Africa/Malawi/1995/Final/Malawi%201995%20MICS_English.pdf
Munlathi, A.C., Mvula, P.M., & Silo, L. (2014). Early childhood development: the role of community based childcare centers in Malawi. SpringerPlus 3:305. Retrieved from https://www.ncbi.nlm.nih.gov/pmc/articles/PMC4078044/pdf/40064_2014_Arti-cle_1016.pdf
National Statistical Office of Malawi. (2014). MDG endline survey 2014: Key findings. Retrieved from: https://mics-surveys-prod.s3.amazonaws.com/MICS5/Eastern%20and%20Southern%20Africa/Malawi/2013-2014/Key%20findings/Malawi%202013-14%20MICS%20%28MDG%20Endline%20Survey%29%20KFR_English.pdf
Ozler, B., Fernald, C.H., Kariger, P., McConnell, C., Neuman, M., & Fraga, E. (2016). Combining pre-school teacher training with parenting education: A cluster-randomized controlled trial.
UNDP (2016). Human development report 2016. Retrieved from http://hdr.undp.org/sites/default/files/2016_human_development_report.pdf
World Bank. (2010). The education system in Malawi: World Bank working paper No. 182. World Bank: Washington D.C. Retrieved from: https://issuu.com/world.bank.publications/docs/9780821381984
World Bank. (2017). Malawi: Data. Retrieved from http://data.worldbank.org/country/malawi

MALAWI CASE STUDY
61

THE STANDARDIZED EARLY CHILDHOOD DEVELOPMENT COSTING TOOL (SECT)
62

MALI CASE STUDY
63
Mali Case Study
10. World Health Organization, UNICEF, United Nations Population Fund, World Bank Group, and United Nations Popula-tion Division (Maternal Mortality Estimation Inter-Agency Group), November 2015.
BackgroundIn Mali, the government has a strong strategy on nutrition, and validated a national ECD policy in 2011 (Project Concept Note, 2014). However, only 5 percent of children aged 36–59 months attended preschool in Mali in 2015. The same year, 62 percent of children 36–59 months were developmentally on track for at least three of four categories—literacy/numeracy; physical development; social development and learning—compared with 36 percent in 2010 (Institut National de la Statistique, 2016).
The program interventions are in the Sikasso and Yorosso cercles (geographical administrative units), in the Sikasso region in the south of Mali. The region has high levels of malnutrition and malaria: while the national level of malaria prevalence in 2010 among children 6–59 months was 38 percent, in the Sikasso region, it was 60 percent (PNLP, 2010). Under-5 mortality has declined in recent decades, from 254 deaths per 1,000 live births in 1990, to 114.7 deaths in 2015. Maternal mortality has nearly halved in the same time period, from 1,010
deaths per 100,000 live births in 1990, but remains high at 587 deaths, in 2015.10
Sources: World Bank, United Nations Development Programme, UNICEF Multiple Indicator Cluster Surveys.
Population (2015) 17,600,000
GDP per Capita (2015) (purchasing power parity 2011)
$2,285
Income Level Low income
Poverty Rate (national poverty line 2009)
43.6
Early Childhood Education Enrollment (ages 36–59 months)
5.3%
Under-5 Mortality (per 1,000 live births 2015)
114.7
Maternal Mortality Ratio (per 100,000 live births 2015)
587

THE STANDARDIZED EARLY CHILDHOOD DEVELOPMENT COSTING TOOL (SECT)
64
Project DescriptionThe program is part of an impact evaluation funded by SIEF, including 90 communities across three components (30 per component). Components 2 and 3 are randomly assigned from a sample frame of 60 countries, while component 1 communities are a matched, nonexperimental sample. All three groups receive Seasonal Malaria Chemoprevention (SMC), deworming, and vitamin A supplementation, while only the second and third groups receive Early Childhood Care and Development (ECCD). Only the final group receives micronutrient fortification (Project Concept Note, 2014).
The program’s three components are:
1. SMC, Deworming, and Vitamin A [Control Group]2. SMC, Deworming, and Vitamin A + ECCD and
parenting education [Control Group]3. SMC, Deworming, and Vitamin A + ECCD and
parenting education + Home fortification with micronutrient powders
The intervention planned to provide SMC to all children aged 3 months to 5 years on a monthly basis between August and November each year. SMC treatments were to be administered by community health representatives and ECCD center facilitators. The deworming and vitamin A treatments were for children aged 0–5 years, and delivered by local health centers using health workers and community health development agents.
Both the SMC and home fortification (described below) were provided through the existing ECCD program initiated by Save the Children. The ECCD program (for children aged 3 months to 3 years) uses activities designed to improve a range of skills, including language, communication, and socialization. The parenting program, developed by the Ministry of Education along with Save the Children and other partners, targets different members of the community for learning about a wide range of topics, including child stimulation and development, nutrition, water, sanitation, and child protection.
The home fortification with micronutrient powders intervention in component 3 was intented to
provide one sachet of micronutrient powder per day to every child ages 6 months to 5 years, for a period of 4 months (January–April 2016). The planned project intervention involved distributing powders through mothers’ groups in the community, along with nutrition education and meal demonstrations. Communities were also to receive a guidance document on treatment delivery and training. Training was provided to Village Nutrition Committees about basic community health care; and further training was planned on nutrition, hygiene, cooking, and home fortification. These committees planned to offer monthly cooking demonstrations and educational sessions about nutrition and hygiene at the ECCD center.
Costing ExerciseThe costing exercise captures the following:
• Management of Fortification: personnel salaries and a range of administrative costs, such as building, electricity, security, water, and internet
• Fortification: personnel costs of the project coordinator, training, equipment, and micronutrient powder
• Management of ECCD: office costs such as rent, internet, telephone, electricity, and air conditioning; and travel
• ECCD and parenting: training; personnel costs, such as salary, insurance, and payroll tax for frontline service providers and Save the Children staff; and project-delivery costs, including supplies for the ECCD centers, medical visits for children in the centers, and a prize for the best-performing center
The exercise does not cost the parts of the intervention for which the government was responsible: malaria prevention, deworming, and Vitamin A supplementation. The costing exercise captures 2015 and 2016.

MALI CASE STUDY
65
Project Details
Name of project Integrated parenting, nutrition, and malaria prevention package: A randomized controlled trial in southern Mali
Country Mali
Region(s) Sikasso
Primary delivery region category Rural
Primary target group (mothers, children, etc.) Mothers of young children
Child beneficiary age Children aged 0–6
Total child beneficiaries 40,474 (Micronutrients) 9,012 (ECD)
National income quintile of majority of beneficiaries Lowest
Type of intervention (breastfeeding promotion, preschool, etc.)
Fortification and ECCD, substantial training of family welfare assistants.
Location(s) of intervention (health center, home, etc.) Health center and home
Duration of overall intervention per beneficiary (from first interaction to end of activities)
One year
Frequency of activities Once a month
Dosage of activities (duration of each interaction with beneficiary)
15 minutes for home visits to verify micronutrient powder intake and give advice to parents
Direct delivery personnel minimum level of education (years schooling + other training)
0
Child-to-delivery personnel ratio 225 ECCD instructors (1 instructor–45 children overall, or 1–20 in 2015 and 1–25 in 2016)
Implementing agent Save the Children and Mali government
Implementing agency category Nongovernmental organization and government
Current program funders Save the Children
Primary current program funder category Nongovernmental organization
Out-of-pocket fees for participation None
Dates of program implementation 2015–2016

THE STANDARDIZED EARLY CHILDHOOD DEVELOPMENT COSTING TOOL (SECT)
66
Date of costing exercise March 2017
Total Program Cost (2015 U.S. $) $1,180,300
Unit Cost per child (2015 U.S. $)
Management of Nutrition Component $6
Micronutrient fortification $2
Management of ECCD component $15
ECCD and parenting $81
Cost by Item Total Real Cost (2015 U.S. $) Percentage
Personnel—Frontline/Direct Delivery $145,959 12%
Personnel—Other $169,092 14%
Administration—Direct Costs $2,634 0.2%
Administration—Indirect Overhead $263,510 22%
Contracted Supplier Services $31,791 3%
Equipment (excluding vehicles) $61,946 5%
Food and Supplements $21,384 2%
Knowledge Sharing $59,145 5%
Monitoring and In-Service Training $15,713 1%
Program Resources $12,144 1%
Training—Frontline/Direct Delivery $249,078 21%
Training—Other $33,207 3%
Travel and Accommodation $14,736 1%
Program Building $3,674 0.3%
Unallocated $96,286 8%
Total $1,180,300 100%
Cost Summary TABLE A.1

MALI CASE STUDY
67
Cost AnalysisThe total program cost (based on average West African CFA Franc to U.S. dollars exchange rate) was $1.2 million (in 2015 U.S. dollars). Of the individual components, the ECCD and parenting component was the most costly, at $726,679 (2015 U.S. dollars), or 62 percent of the overall cost. In both 2015 and 2016, the costliest element of this component was the training of frontline service providers. Overall, the largest contributor to item costs was administration (indirect overhead) at 22 percent, which includes water, electricity, internet, and security.
Since different groups of beneficiaries received different treatments, it does not make sense to calculate an overall unit cost, but rather a unit cost per activity. 40,474 children received the nutrition component, meaning that the overall cost per child of this component was $8 in 2015 U.S. dollars: $6 for management costs and $2 for micronutrient fortification. For the ECC and parenting component, the overall cost per child was $96: $15 for management and $81 for the program itself.
Scale-Up CostsThe scale-up cost in Mali was estimated by using the unit cost per child for the nutrition and the ECCD and parenting components, and calculating the total cost for expanding these services for all children aged 0-6, or 4,038,079 children
(population data from 2009). To roll out the nutrition component to all children in the age group, which has a unit cost of $8 per child, would cost an estimated $32 million (2015 USD), while to roll out the ECCD and parenting component, with a unit cost of $96, to the same group, would cost an estimated $384 million (USD 2015). In total, scaling-up these two components to the total population of children under 6 in Mali would cost an estimated $416 million.
ConclusionsMali is a low-income country with high rates of maternal and child mortality, despite rapid improvements in recent years. The program targeted two areas within the Sikasso region, an area of the country with above-average levels of malaria and malnutrition, providing health, nutrition, and education interventions in different combinations as part of a randomized controlled trial. The costing exercise captures the management and delivery inputs of two components: the micronutrient fortification, and the early childhood care and development. The average cost per child was $8 for providing the micronutrient fortification, and $96 for the ECCD. Providing these two components to all children under 6 would cost an estimated $416 million. Personnel costs accounted for 26 percent of the total expenditures. An impact evaluation into the program, funded by SIEF, is expected to conclude this year.
62%Early Childhood Care and Development and Parenting
21%Management of
Nutrition Component
11% Management of ECCD
Component6%
Micronutrient Fortification
FIGURE A.4: REAL DIRECT COSTS, BY MAIN ACTIVITY

THE STANDARDIZED EARLY CHILDHOOD DEVELOPMENT COSTING TOOL (SECT)
68
References
Cellule de Planification et de Statistique du secteur santé, développement social et la promotion de la famille (CPS/SSDSPF), Institut National de la Statistique (INSTAT). (2011). Enquête par Grappes à Indicateurs Multiples 2009-2010: Rapport final. Bamako, Mali. Retrieved from: https://mics-surveys-prod.s3.amazonaws.com/MICS4/West%20and%20Central%20Africa/Mali/2009-2010/Final/Mali%202009-10%20MICS_English.pdf
Institut National de la Statistique. (2016). Enquête par Grappes à Indicateurs Multiples au Mali (MICS-Mali) 2015: Résultats clés. Bamako, Mali: INSTAT. Retrieved from: https://mics-surveys-prod.s3.amazonaws.com/MICS5/West%20and%20Central%20Africa/Mali/2015/Key%20findings/Mali%202015%20MICS%20Key%20Findings%20Report_French.pdf
Programme National de Lutte contre le Paludisme (PNLP), INFO-STAT et ICF Macro. (2010). Enquête sur la prévalence de l’Anémie et de la Parasitémie palustre chez les enfants (EA&P) au Mali 2010. Calverton, Maryland: CPS/DNSI et ICF Macro. Retrieved from: http://www.dhsprogram.com/pubs/pdf/FR245/FR245.pdf
UNDP. (2016). Human development report 2016. New York: United Nations Development Program. Retrieved from: http://hdr.undp.org/sites/default/files/2016_human_development_report.pdf
Project Concept Note. (2014). Impact and cost-ef-fectiveness of an integrated parenting, nutrition and malaria prevention package to improve nutrition and early child development in infants and pre-school children (aged 0-6 years): A randomized controlled trial in southern Mali.
World Bank. (n.d.). Mali Data. Retrieved from: http://data.worldbank.org/country/mali

MALI CASE STUDY
69

THE STANDARDIZED EARLY CHILDHOOD DEVELOPMENT COSTING TOOL (SECT)
70

MEXICO CASE STUDY
71
Mexico Case Study
BackgroundA range of programs and interventions for the early years exist in Mexico, across the health, education, and social development sectors. As in most countries, these programs are managed and financed by different bodies, often leading to fragmentation in service provision. Services range from Prospera (formerly known as Progresa and Oportunidades), a cash-transfer program providing basic health services and nutrition to poor families, to the preschool education program for all children aged 3–5, provided by the Secretariat of Public Education (Myers et al., 2013).
Progress has been made on many fronts; for example, mortality rates for children under age 5 dropped by 63 percent between 1990 and 2014 (UNICEF, n.d.). Nevertheless, rates of chronic malnutrition in the early years remain high, particularly for the indigenous population, (33 percent malnutrition, compared with 12 percent for non-indigenous households). While nearly 90 percent of children aged 4 were enrolled in early childhood education in 2014, the rate was only 43 percent for children aged 3.
Sources: Instituto Nacional de Estadística y Geografía, Consejo Nacional de Evaluación de la Política de Desarrollo Social, Or-ganisation for Economic Co-operation and Development, United Nations Development Programme.
Population (2016) 122,273,473
GDP per Capita (2016) $18,583
Income Level Upper-middle income
Poverty Rate (2014) 45.2%
Early Childhood Education Enrollment (2014)
43% (3 year olds) 89% (4
year olds)
Under–5 Mortality (per 1,000 live births 2015)
13.2
Maternal Mortality Ratio (per 100,000 live births 2015)
38

THE STANDARDIZED EARLY CHILDHOOD DEVELOPMENT COSTING TOOL (SECT)
72
Inequality in educational outcomes exists between states and between the indigenous and non-indigenous populations: while 6.3 percent of the population above the age of 15 was illiterate in 2014, this proportion was 19.2 percent for the indigenous population (UNICEF, 2015). Historically, early childhood services in rural areas have been of a lower quality, and parents in indigenous communities often lack the information or resources to engage in ECD activities with their children (World Bank, 2014).
Project Description11
The Consejo Nacional de Fomento Educativo (CONAFE), or National Council for Educational Development, has an early education program that provides parenting education to the caregivers and families of children under age 4 in rural and indigenous communities in Mexico. The program focuses on areas with fewer than 2,500 inhabitants, particularly those with high levels of marginalization and social deprivation. The program is active in all 31 states, with an organizational structure that comprises state and regional coordinators, who develop trainings and manage monitoring and evaluation; area coordinators, who manage the activities of the module supervisors and education promoters; and the educational promoters themselves, volunteers who directly deliver the program activities. The program runs for nine months between October and June, for two sessions of two hours per week, in a local community space. The CONAFE program reaches an estimated 450,000 children per year, and represents about half of all ECD services provided in the country (World Bank, 2014).
The program supports the practice of community parenting, providing caregivers and families with information about their children’s development, and specific lessons shaped around the needs of the locality. The curriculum centers around four areas: childcare and protection; individual and social development; language and communication; and
11. Information provided by CONAFE.
exploration of personal environment (Cardenas et al., 2017). CONAFE provides several trainings for direct delivery staff, as well as trainings for coordinators and managers. In addition, the program provides teaching materials and aids, and covers the travel, food and accommodation of those attending trainings. The World Bank initiated a project to support the existing program in 2014, with the support focusing on capacity building for parents and program personnel.
Costing ExerciseThe costing exercise captures the early education program’s costs in two states: Nayarit and Aguascalientes. For both of these states, data was available on:
• Personnel: management and direct delivery staff
• Training costs: food and travel expenditures• Delivery costs: program materials
The costing includes personnel costs from the national level all the way down to the education promoters, who directly deliver services.
Cost AnalysisThe total costs of Nayarit, at $651,385, are more expensive than Aguascalientes, at $477,304. Spending between the two states differed mainly in the costs of personnel, as well as spending on workshop food and accommodation. These additional costs reflect the fact that the program employed considerably more staff in Nayarit than in Aguascalientes. As table A.1 shows, in Nayarit, there are nearly double the number of zone coordinators and module supervisors than in Aguascalientes. There are also more than 30 additional education promoters. The higher number of personnel employed in Nayarit also means that there are more individuals attending trainings, and therefore higher costs for travel, food, and accommodation for their workshops.
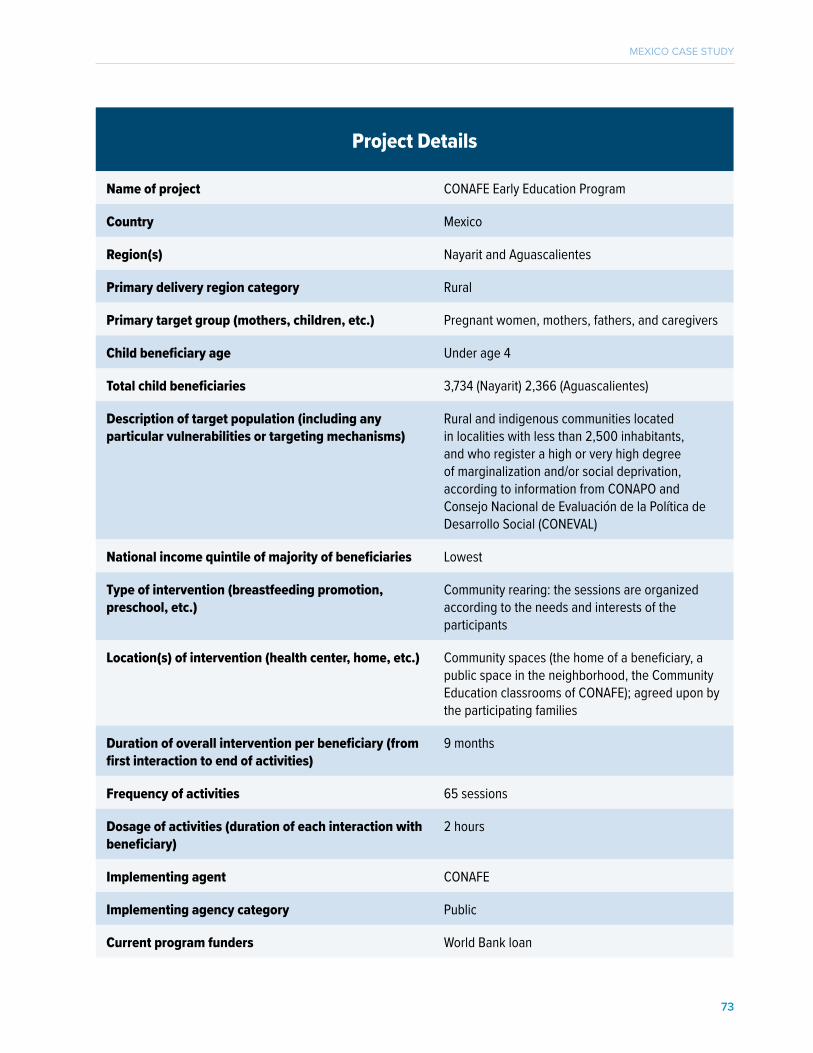
MEXICO CASE STUDY
73
Project Details
Name of project CONAFE Early Education Program
Country Mexico
Region(s) Nayarit and Aguascalientes
Primary delivery region category Rural
Primary target group (mothers, children, etc.) Pregnant women, mothers, fathers, and caregivers
Child beneficiary age Under age 4
Total child beneficiaries 3,734 (Nayarit) 2,366 (Aguascalientes)
Description of target population (including any particular vulnerabilities or targeting mechanisms)
Rural and indigenous communities located in localities with less than 2,500 inhabitants, and who register a high or very high degree of marginalization and/or social deprivation, according to information from CONAPO and Consejo Nacional de Evaluación de la Política de Desarrollo Social (CONEVAL)
National income quintile of majority of beneficiaries Lowest
Type of intervention (breastfeeding promotion, preschool, etc.)
Community rearing: the sessions are organized according to the needs and interests of the participants
Location(s) of intervention (health center, home, etc.) Community spaces (the home of a beneficiary, a public space in the neighborhood, the Community Education classrooms of CONAFE); agreed upon by the participating families
Duration of overall intervention per beneficiary (from first interaction to end of activities)
9 months
Frequency of activities 65 sessions
Dosage of activities (duration of each interaction with beneficiary)
2 hours
Implementing agent CONAFE
Implementing agency category Public
Current program funders World Bank loan

THE STANDARDIZED EARLY CHILDHOOD DEVELOPMENT COSTING TOOL (SECT)
74
DIRECT COSTS, BY ITEM
DIRECT COSTS, BY MAIN ACTIVITY
FIGURE A.6: AGUASCALIENTES
FIGURE A.8: AGUASCALIENTES
47%Personnel (other)
19% Workshop Food & Accommodation
19% Direct Delivery
Personnel
8%Workshop Travel
7% Program Resources
FIGURE A.5: NAYARIT
FIGURE A.7: NAYARIT
51%Personnel (other)
21% Workshop Food & Accommodation
16% Direct Delivery
Personnel
8%Workshop Travel
4% Program Resources
45%ECD Delivery
29%Training
26% Program Management
42.5%ECD Delivery
27%Training
30.5% Program Management
Dates of program implementation Since 1992
Currency of the costing Mexican peso
Total program Cost (2015 U.S. $) $651,385 (Nayarit)$477,304 (Aguascalientes)
Unit cost per child (2015 U.S. $) $174 (Nayarit)$202 (Aguascalientes)

MEXICO CASE STUDY
75
TABLE A.2: STAFF COMPARISON: NAYARIT AND AGUASCALIENTES
However, the program in Nayarit also served over a thousand more children, or 3,734 total, than the 2,366 child beneficiaries in Aguascalientes. With this higher number of beneficiaries in Nayarit, the program costs were only $174 a child, compared with $202 in Aguascalientes. This suggests that the investments in personnel in Nayarit led to economies of scale, allowing the program to serve more children at a lower cost.
For both states, the highest item costs were for “other” personnel, which include all personnel except for the promoters, with an average of 49 percent of costs spent on this category (51 percent In Nayarit and 47 percent in Aguascalientes). For both states, the combined costs of direct delivery and other staff made up more than half of the program costs, with an average of 67 percent spent on personnel. The second-highest item cost for both states was food and accommodation at the training workshops, which accounted for an average of 20 percent of program costs. Resources for the program, including paper and books, came to an average of 5 percent for the two states.
Scale-Up CostsThe scale-up costing uses the figure of unit cost per child derived from the state-level costing, and estimates the costs of providing the intervention at a national level. In this case, the total potential
12. Cardenas et al., 2017.
population for the scale-up is the children aged 0–4 in rural and marginalized communities across Mexico, or 4.4 million children. To roll out this program to all eligible children, the model uses the average unit cost per child of $185, for a total of $810 million. Since the costs were slightly different in the two states, the cost of the scale-up differs depending on which figure is chosen: if the unit cost for Nayarit is used to estimate the cost of the rollout, the total is $764 million, while if the Aguascalientes figure is used, it would be $883 million. However, these two states use the simplest model of the program (scenario A), where the administration of the program is organized centrally. Seven states are in scenario A, while the other 24 states are in Scenario B, where responsibility for the program is shared between CONAFE and the State Ministries of Education.
Impact Evaluation12
An impact evaluation, funded by the International Initiative for Impact Evaluation (3ie), gathered data from nearly 1,000 households between 2012 and 2014. The evaluation found that treatment households were attending very few of the meetings: the median number attended in the first year was 4, and dropped to 3 in the second year, of a possible 65 meetings. According the researchers, potential explanations include poor coordination between the early education and PROSPERA cash-transfer program in the same communities, low expectations for the program, lack of empathy with the promoter, and lack of understanding about the program’s purpose. However, despite the low take-up rate, the evaluation found small improvements in parental behavior for children aged 0–3, both behavior observed by interviewers, and behavior described in caregiver reports. Small improvements in child development were also reported, again for the younger group of children. The impact evaluation estimated the cost of the program in 2015 to be $69 per child, per year.
Nayarit Aguascalientes
Zone Coordinator
22 10
Module Supervisor
48 25
Education Promoter
266 234

THE STANDARDIZED EARLY CHILDHOOD DEVELOPMENT COSTING TOOL (SECT)
76
ConclusionsThe CONAFE early education program provides parenting education to households across all states in Mexico, using local volunteers to teach parents and caregivers about child protection, development, and communication. This costing study captured the overall costs of running the program in two states, Aguascalientes and Nayarit. Both states are examples of the scenario A structure, where all administration and costs are centralized. In these two states, the average cost per child of providing the program in 2016 was $185, which includes the personnel costs of local and national staff, plus training and program materials. This is higher than the estimated costs in the impact evaluation, $69 per year, and in the World Bank’s proposal, which estimated $112 per year. Using this average to scale-up the program nationally leads to a total of $810 million for the 4.4 million children who live in rural and highly marginalized communities. The cost per beneficiary should be interpreted with caution in light of the impact evaluation findings, which indicated low levels of program take-up. These findings suggest that increasing participation will likely require the program to more effectively communicate its purpose to families and communities, and to market the successes of the program more widely. Improving the program delivery based on best practices will also be critical to improve early childhood outcomes. Such quality improvements will need to take into consideration cost trade-offs. SECT could provide a platform of analysis for these policy discussions. Investments in early childhood programming at both the federal and the state levels will be imperative to the healthy development of Mexico’s young children and the future of the country.

MEXICO CASE STUDY
77
References
Cardenas, S., Evans, D., & Holland, P. (2017). Esti-mating the effects of a low-cost early stimulation and parenting education programme in Mexico: 3ie Impact Evaluation Report 57. New Delhi: Interna-tional Initiative for Impact Evaluation (3ie).
Consejo Nacional de Evaluación de la Política de Desarrollo Social. (2014). Medición de la pobreza. Retrieved from: http://www.coneval.org.mx/Medi-cion/Paginas/PobrezaInicio.aspx
INEGI. (2016). Anuario estadístico y geográfico por entidad federativa. Retrieved from: http://internet.contenidos.inegi.org.mx/contenidos/Productos/prod_serv/contenidos/espanol/bvinegi/productos/nueva_estruc/AEGPEF_2016/702825087357.pdf
Myers, R., Martinez, A., Delgado, M.A., Fernández, J.L., & Martinez, A. (2013). Desarrollo infantil tem-prano en México: diagnóstico y recomendaciones. Inter-American Development Bank, Division of Social Protection and Health.
OECD. (2016). Education at a glance 2016: OECD indicators. Paris: OECD Publishing. Retrieved from: http://www.oecd-ilibrary.org/docserver/download/9616041e.pdf?expires=1489177753&id=id&accname=guest&checksum=AFAA14D319868AA-188F0AEADB557C365
OECD. (2016). Gross domestic product (GDP). Retrieved from: https://data.oecd.org/gdp/gross-do-mestic-product-gdp.htm
UNDP. (2016). Human development report 2016. Retrieved from: http://hdr.undp.org/sites/default/files/2016_human_development_report.pdf
UNICEF. (2015). Panorama educativo de la población indígena. Retrieved from: https://www.unicef.org/mexico/spanish/PEPI_web.pdf
UNICEF. (n.d.). Los primeros años. Retrieved from: https://www.unicef.org/mexico/spanish/ninos_6901.html
World Bank. (2014). Project Appraisal Document: Reducing inequality of educational opportunity project. Washington, D.C.: World Bank.

THE STANDARDIZED EARLY CHILDHOOD DEVELOPMENT COSTING TOOL (SECT)
78

MOZAMBIQUE CASE STUDY
79
Mozambique Case Study
BackgroundThe importance of early childhood has been recognized by the Government of Mozambique: the Minister of Education established an ECD Secretariat in 2011 and appointed an ECD commission to draft a national ECD strategy. This strategy links together actions across sectors and emphasizes the importance of holistic development in the early years (World Bank, 2012).
The under-5 mortality rate in 2015 was 79 per 1,000 (UNDP, 2016), down from 141 per 1,000 in 2008 (National Statistics Institute, 2009). In 1995, 60 percent of children under-5 were moderately or severely stunted, a figure that dropped by nearly a third by 2011, but remains high at 43 percent (UNICEF, WHO and World Bank, 2017). However, only 4 percent of Mozambique’s under-5s are enrolled in early childhood development programs, and most of these are concentrated in urban areas, where families are wealthier (World Bank, 2012).
A randomized evaluation in 2012 (Martinez et al.) tested the effectiveness of a rural community-based preschool model in the Gaza province, implemented by Save the Children. The evaluation found that participation in the preschool program
improved a range of developmental outcomes, including cognitive abilities and fine motor-skills,
Sources: World Bank, United Nations Development Programme
Population (2016) 28,829,476
GDP per Capita (2015) (purchasing power parity 2011)
$1,116
Income Level Low income
Poverty Rate (national poverty line 2009)
52%
Early Childhood Education Enrollment
4%
Under-5 Mortality (per 1,000 live births 2015)
78.5
Maternal Mortality Ratio (per 100,000 live births2015)
489

THE STANDARDIZED EARLY CHILDHOOD DEVELOPMENT COSTING TOOL (SECT)
80
and estimated the program cost to be $30 per child over a period of 12 months.13 This ECD program and evaluation informed the development, and provided the foundation for, the expanded program in the five provinces that is the subject of this costing analysis.
Project DescriptionThe Development of Pre-School Aged Children (DICIPE- Desenvolvimento Integral da Criança em Idade Pré-Escolar) program combines a preschool component for children 3-5 years old, and parental education meetings to reach children 0-8 years old. Third party providers (TPPs) were contracted by the government to provide services in five provinces (Save the Children in Nampula, Tete, and Gaza Provinces, the Aga Khan Foundation (AFK) in Cabo Delgado Province, and ADPP in Maputo Province). Each contract provided for the building of 70 ECD centers per province, for a total of 350 across two phases14 and the running of the completed centers for four months, with 80 percent of enrolled children attending, before handing them over to the community/Ministry of Education (Gustafsson-Wright, Gardiner, and Boggild-Jones, forthcoming). In addition to these third-party providers, three Independent Verification Agents (IVAs) were contracted to verify deliverables for the results-based delivery framework.
The Ministry of Education and Human Development (MINEDH) and the World Bank chose the communities for the TPPs to work in based on the following eligibility criteria: (i) communities located in rural settings; (ii) the lack of existing ECD services; and (iii) vulnerability and potential impact . The contract requires that the TPPs establish an ECD Community Committee in each community, which will be responsible for selecting the site of the preschool, selecting ECD facilitators, and overseeing the preschool. The TPPs must
13. The large difference between this estimate and the one using SECT highlights the importance of a thorough and de-scriptive costing exercise. The main difference between SECT costing and the evaluation’s program cost is that the latter includes very low labor and material costs for the buildings since most of these were donated. There were also differenc-es in the management structure of the program and the estimates project the costs over 30 years (Martinez et al, 2012, p.38).14. 150 preschools in phase one, starting in 2014, and 200 preschools in phase two, for which implementation com-menced in 2016 (World Bank, 2017b)15. From interviews with TPP and the World Bank
then build, in collaboration with the community, preschools with two classrooms, with capacity for 35 children in each classroom (70 total). TPPs are responsible for maintaining the preschool and for providing learning materials. Four facilitators are hired per preschool and the third-party providers are responsible for providing them with 40 hours of pre-service training and 5 days per year of in-service training. Classes must be held at least 3 hours a day Monday through Friday and parent education meetings must be held at least once a month. The ECD facilitators are paid a 650 Meticais (approximately $14 (January 1, 2016 exchange rate)) salary per month by the MINED.
The program was funded by a $40 million loan from the World Bank, of which approximately $20 million was specifically for this program, with the other $20 million allocated to government capacity and knowledge building, including an impact evaluation of the project’s ECD activities. The Ministry of Education is budgeted to spend $ 28.3 million on the overall implementation of the project. The total Ministry of Education expenditure/budget for contracts with providers (i.e., the TPP’s) is $23.2 million. Each of the third-party providers where allocated contracts to the values in the table below, for a total of $23.1 million. The contract for Save the Children was the largest, for three provinces, at an average of $5 million each.15
The impact evaluation of this project, supported by SIEF at the World Bank, is due to finish in 2019, and will follow both the children from the original Save the Children pilot, as well as conducting an evaluation of the success of the scale-up to the five provinces (World Bank, 2016b).

MOZAMBIQUE CASE STUDY
81
Project Details
Name of project component Development of Pre-School Aged Children (DICIPE- Desenvolvimento Integral da Criança em Idade Pré-Escolar)
Country Mozambique
Region(s) Gaza, Tete & Nampula (Save the Children) Cabo Delgado (AKF) Maputo Province (ADPP)
Primary delivery region category Rural
Primary target group (mothers, children, etc.) Children, caregivers and communities
Child beneficiary age 3-5 preschool component, 0-5 parent meetings component
Total child beneficiaries 20, 978 by end of 2016
National income quintile of majority of beneficiaries Lowest
Type of intervention (breastfeeding promotion, preschool, etc.)
Building preschools, running preschools and parenting meetings.
Location(s) of intervention (health center, home, etc.) Community-based. From the preschools constructed during the program.
Duration of overall intervention per beneficiary (from first interaction to end of activities)
Depends on attendance at the preschool and parenting meetings.
Frequency of activities TPPs are responsible for 40 hours of pre-service training and 5 days per year of in-service training for ECD facilitators. Classes must be held at least 3 hours a day Monday through Friday and parent education meetings must be held at least at least once a month.
Dosage of activities (duration of each interaction with beneficiary)
Varies according to the nature of the activity.
Direct delivery personnel minimum level of education (years schooling + other training)
7
Child: delivery personnel ratio At the preschools there are 4 ECD practitioners to 70 children

THE STANDARDIZED EARLY CHILDHOOD DEVELOPMENT COSTING TOOL (SECT)
82
Implementing agent Save the Children, Mozambique Aga Khan Foundation, Mozambique ADPP, Mozambique
Implementing agency category NGO
Current program funders World Bank, Ministry of Education and Human Development - Mozambique
Primary current program funder category Multilateral
Dates of program implementation 2014 –2019
Total Program Cost (2015 USD) Expenditures & Budget 2017: $14,638,280
TABLE A.3: CONTRACTS FOR THE THIRD-PARTY PROVIDERS
Source: Interviews with TPPs and the World Bank
Costing ExerciseThe costing exercise captures the cost of the preschool program for three service providers across five provinces: Cabo Delgado, Gaza, Maputo, Nampula, and Tete. Table A.4 summarizes how each of the TPPs chose to categorize their expenditure information into different main activities. It is important to note that there are key limitations to how this data is currently classified: the management of the program also includes some personnel costs that should be allocated to the construction of the preschools. Until all fixed costs associated with construction are separated from the ongoing service provision costs, it will
not be possible to report accurate unit costs. The current expenditure tracking by service providers also includes costs in management which could be categorized across other categories (for example, personnel who perform both management and training roles). These are important lessons for the development of the tool, as well as the associated training package that will be needed to accompany it.
Cost SummaryTable A.5 below shows budgeted/actual expenditure between 2014 and 2017 of $14.6 million for all three service providers. These expenditures/budgets indicate that by the end of 2017, Save the Children will have spent just over half of their contracted amount, at $7.8 million. ADPP ($3.1 million) and AKF ($3.7 million) will both be much closer to spending their total contract budget. All TPPs provided expenditure information from 2014-December 2016, and budgeted expenditures for 2017. It is important to note that Save the Children serves more children than the other two TPPs when comparing budget and expenditure data.
Save the Children US$ 15 million for three provinces
Aga Khan Foundation US$ 4.2 million for one province
ADPP US$ 3.9 million for one province
Total US$ 23.1 million for five provinces

MOZAMBIQUE CASE STUDY
83
Cost AnalysisWhen aggregated across the three service providers, the largest expenditure item was building costs, followed by personnel, which totaled 36 and 32 percent respectively. The biggest expenditure item for Save is personnel, at 34 percent. Personnel together with Administrative expenses constitute
up to 46 per cent of AKF’s expenditure. ADPP and Save each spent 42 percent on these two items. Note that cost of the facilitators is not included in personnel costs since, as mentioned; they receive a minimal stipend directly from the Ministry of Education. In addition to Personnel and Administration, a significant proportion of the expenditure of the Save the Children (as well
Save the Children Aga Khan Foundation ADPP
Management of program Management of program Management of program
Community mobilization Operations set-up Community Connection
Training Training Training
Operating ECD Pre-Primary Education ECD Service Provision
Building project monitoring Sustainability and visibility
Buildings Buildings Construction
TABLE A.3: CATEGORIES OF EXPENDITURE DATA PROVIDED BY THE SERVICE PROVIDERS
Source: Data provided by TPPs
TABLE A.4: BUDGET / ACTUAL EXPENDITURE 2014–2017i, ii
ADPP 2014-2017 AKF 2014-2017 SAVE 2014-2017 Total (2015 USD)
Admin $521,295 $414,589 $622,383 $1,558,267
Personnel $779,991 $1,282,857 $2,676,823 $4,739,671
Training $59,802 $56,858 $590,543 $707,203
Other $387,093 $444,651 $1,501,658 $2,333,402
Bulding costs $1,385,518 $1,503,242 $2,410,977 $5,299,737
Total $3,133,699 $3,702,197 $7,802,384 $14,638,280
Source: Data provided by TPPsi. Other costs include travel and accommodation, equipment, program resources and vehiclesii. Personnel expenditures do not include the monthly stipend provided to the facilitators, as these payments were not made by the TPPs

THE STANDARDIZED EARLY CHILDHOOD DEVELOPMENT COSTING TOOL (SECT)
84
FIGURE A.9: EXPENDITURE BREAKDOWN FOR ALL TPPS
36%Building costs
32%Personnel
16%Other
11%Admin
5% Training
2% Training
44%Building costs
25%Personnel
12%Other
17%Admin
ADPP 2014–2017
1% Training
41%Building costs
35%Personnel
12%Other
11%Admin
AKF 2014–2017
31%Building costs
34%Personnel
19%Other
8%Admin
8%Training
SAVE 2014–2017
FIGURE A.10: EXPENDITURE BREAKDOWN FOR EACH TPP
Source: Data provided by TPPs

MOZAMBIQUE CASE STUDY
85
as AKF) goes toward travel and accommodation, which is under “other” costs. This is mainly due to the remoteness and rural nature of the communities serviced by these implementing partners.
ImplementationThere were several challenges faced in implementation, which meant the program as delivered differed to original plans. The TPPs have been running the ECD centers for longer than the four months intended in the design of the program. In addition to this, completion of the ECD centers has differed between providers: by the end of 2016, ADPP built 24 ECD centers, AKF 46, and Save 90.
The following table shows what the Ministry of Education budgeted to spend in the period 2013 to 2015, and its actual expenditure over this period. This shows that at the end of 2015 only 15% of the funds budgeted to pay the contracts of the TPPs had been disbursed. The explanation for this low disbursement number is that payments from the Ministry are made contingent upon achievement of certain indicators and these indicators were not met. All three of the TPPs noted the challenge of having to cash-flow finance the projects. While the topic of performance or results-based financing is beyond the scope of this report, this raises
important questions around the extent to which providers (in particular small ones) are able to acquire the upfront funding needed to deliver their programs. It also highlights an important policy issue under much discussion currently about how to hold service providers accountable to achieving program results.
ConclusionsThe DICIPE program in Mozambique combines a program of preschool building and operation with a parenting program across five provinces, funded by the Ministry of Education, and delivered by Save the Children, AKF and ADPP. The costing exercise captures the management, training, service delivery and building costs of the service providers, tracking their expenditures from 2014-2016, as well as their budgets for 2017. By the end of 2016, the service providers had spent $10.8 million, and were operating 160 preschools. By the end of 2017, they are expected to complete 350 preschools, for a total cost of $14.6 million, considerably less than the $23.1 million of the combined contracts that the service providers bid for at the beginning of the program.
It is important to note that this exercise, meant to be a pilot for learning purposes, was limited by the way
Type of expenditure Budget for 2013-2015 (MZN 000’s)
Expenditure in 2013-2015 (MZN 000’s) % of budget spent
Contracts with provider 527,794.5 78,932.0 15%
Contracts with Independent Verification Agents
79,517.2 25,621.8 32%
Management activities, monitoring and institutional development
134,590.6 53,719.5 40%
Knowledge creation activities 39,511.3 0.0 0
Stipends for ECD facilitators 0.0 0.0 0%
Total 781,413.6 158,273.4 20%
Source: Data provided by Ministry of Education
TABLE A.6: MINISTRY OF EDUCATION BUDGET AND EXPENDITURE FOR 2013 TO 2015
THE STANDARDIZED EARLY CHILDHOOD DEVELOPMENT COSTING TOOL (SECT)
86
that each of the service providers reported their expenditures, provided the data for the estimation and the timing of program rollout. Particularly, the fact that the fixed construction costs can not be separated from ongoing service provider costs, as the data is currently provided, means that it is not possible to report the unit or scale-up costs for this program. Reporting unit costs without separating these fixed costs would inaccurately portray these costs as quite high.
SECT seeks to present expenditure data using standardized classifications. In the case of Mozambique, this highlights differences between service providers. The tool has the flexibility to simulate costs for program expansions in different areas of the country, and for different providers, providing policymakers in Mozambique with the tools to estimate the budget implications of a further scale-up, or to conduct cost-effectiveness analysis in light of the findings of the upcoming evaluation supported by the World Bank SIEF.

MOZAMBIQUE CASE STUDY
87
References
Gustafsson-Wright, E., Gardiner, S & Boggild-Jones, I. (2017, forthcoming). Publicly Funded Privately Provided Early Childhood Development Interven-tions: Mozambique Case Study. Washington, DC: Brookings Institution.
Martinez, S., Naudeau, S. & Pereira,V. (2012). The promise of preschool in Africa: A randomized impact evaluation of early childhood devel-opment in rural Mozambique. The World Bank Group & Save the Children. Retrieved from: http://www.savethechildren.org/atf/cf/%7B-9def2ebe-10ae-432c-9bd0-df91d2eba74a%7D/MARTINEZ_NAUDEAU_PEREIRA.MOZ_ECD_RE-PORT-FEB_7_2012.PDF
National Statistics Institute. (2009). Mozambique: Final report of the multiple indicator cluster survey, 2008. National Statistics Institute. Retrieved from: https://mics-surveys-prod.s3.amazonaws.com/MICS3/Eastern%20and%20Southern%20Africa/Mo-zambique/2008/Final/Mozambique%202008%20MICS_English.pdf
UNDP. (2016). Human development report 2016. Retrieved from: http://hdr.undp.org/sites/default/files/2016_human_development_report.pdf
UNICEF, WHO and World Bank Group. (2017). Joint malnutrition country dataset. Retrieved from: https://data.unicef.org/topic/nutrition/malnutrition/
World Bank, (2012). Project Paper on a proposed additional credit to the Republic of Mozambique for an education sector support project. Retrieved from: http://documents.worldbank.org/curated/en/935541468057844869/pdf/659680PJPR-0P120Official0Use0Only090.pdf
World Bank. (2016a). Accelerating Poverty Reduction in Mozambique: Challenges and Oppor-tunities. World Bank: Washington, D.C. Retrieved from: http://documents.worldbank.org/curated/en/383501481706241435/Accelerating-poverty-re-duction-in-Mozambique-challenges-and-opportuni-ties
World Bank. (2016b). Scaling Up the Provision of Early Childhood Development and Early Nutrition Services in Mozambique. Retrieved from: http://www.worldbank.org/en/programs/sief-trust-fund/brief/scaling-up-the-provision-of-ecd-and-early-nutrition-services-in-mozambique
World Bank. (2017a). Mozambique Data. Retrieved from: http://data.worldbank.org/country/mozam-bique
World Bank (2017b). Impact evaluation of scaled-up early childhood development activities in rural Mozambique. Baseline report. World Bank: Wash-ington D.C.

THE STANDARDIZED EARLY CHILDHOOD DEVELOPMENT COSTING TOOL (SECT)
88
Annex B: Previous Costing Efforts

MOZAMBIQUE CASE STUDY
89
Basic Service Availability of Unit Cost Data
Unit Cost Estimates Source
Access to health care Low
Maternal education Low
Planning for family size and spacing
Low
Social assistance transfer programs
Low
Prevention and treatment of parental depression
Low
Parental leave and adequate childcare
Low
Child protection services Low
Continuity to primary Low
Adequate, nutritious and safe diet
Medium $5–15 per child per year (not including food)
Mason et al., 1999
Access to safe water Medium $2.26 per month per household for rural water supply intervention
Whittington et al., 2008
Birth registration Medium $0.23–$0.83 per event of civil registration
AbouZahr et al., 2007
Deworming Medium $0.5 for preschoolers Horton et al., 2008
Education about early stimulation, growth, and development
Medium $58–900 per child for parenting program in Caribbean countries
van Spijk et al., 2010
Immunizations Medium > than $30 per live birth; includes cost of scaling up vaccine coverage
WHO et al., 2009
Adequate sanitation High $26–60 per capita for pit latrine (for rural areas); $52–160 per capita for septic tanks or similar
Evans et al., 2004
TABLE B.1: AVAILABILITY OF ECD COST DATA

THE STANDARDIZED EARLY CHILDHOOD DEVELOPMENT COSTING TOOL (SECT)
90
Basic Service Availability of Unit Cost Data
Unit Cost Estimates Source
Antenatal care High $19 for developing countries (Africa, $23; Asia, $17; Latin America and the Caribbean, $22)
Singh et al., 2013
Exclusive breastfeeding High $3.52–16.65, depending on WHO subregion
Bhutta et al., 2013
Iron and folic acid supplementation for pregnant mothers
High $4.91–6.41, depending on WHO subregion
Bhutta et al., 2013
Micronutrient supplementation and fortification
High $0.06 for salt iodization for all WHO subregions; $0.52–2.85 for vitamin A supplementation for all WHO subregions
Bhutta et al., 2013
Prevention and treatment of acute malnutrition
High $138.72–250.85 for management of severe acute malnutrition
Bhutta et al., 2013
Skilled attendance at delivery High $47 for developing countries (Africa, $41; Asia, $41; Latin America and the Caribbean, $87)
Singh et al., 2013
Therapreutic zinc supplements for diarrhea
High $3.57–5.9, depending on WHO subregion
Bhutta et al., 2013
Preprimary education High See table B.2 See table B.2
Counseling on adequate diet for pregnant mothers
See column 3
Cost may be included in cost of antenatal visits
None
Handwashing See column 3
Cost may be included in cost of Parenting and social support networks and community education about growth and development
None
Various Varies Bernal, 2013, Acosta, 2008, Waiser, 1999, Kakabadze, 2016
Low=Limited systematic or context-specific data available or efforts under wayMedium=Some cost estimates availableHigh=Regional estimates availableSource: Putcha & van der Gaag, 2015.

MOZAMBIQUE CASE STUDY
91
TABLE B.2: PREPRIMARY COST DATA
Country Cost U.S. dollars (Year)*? if estimation Source
Program Cost Data
Benin 45 (1998) approximation from Jaramillo & Mingat, 2008
Brazil 1315 (2006) Levin & Schwartz, 2012
Cameroon 68 (1998) approximation from Jaramillo & Mingat, 2008
Cote d'Ivoire 145 (2000) approximation from Jaramillo & Mingat, 2008
Egypt 871 (2001 est, 2007 dollars) Levin & Schwartz, 2012
France 4995 (2006) Levin & Schwartz, 2012
Germany 5683 (2006) Levin & Schwartz, 2012
India 761 (2003) Levin & Schwartz, 2012
Indonesia 1598 (2006) Levin & Schwartz, 2012
Kenya 264 (2006) Issa & Evans, 2008
Mexico 1978 (2006) Levin & Schwartz, 2012
Mexico 12189 (2008?) Myers & Valle, 2008
Mozambique 30 (2008?) Martinez et al., 2011
Nepal 15 (1998?) Meyers, 1998
New Zealand 5113 (2006) Levin & Schwartz, 2012
Niger 86 (1998) approximation from Jaramillo & Mingat, 2008
Nigeria 70–177 (2013) Ogunyinka, 2013
Poland 4545 (2006) Levin & Schwartz, 2012
Russia 3291 (2006) Levin & Schwartz, 2012
South Africa 16781 (2008?) Biersteker et al., 2008
South Korea 3393 (2006) Levin & Schwartz, 2012

THE STANDARDIZED EARLY CHILDHOOD DEVELOPMENT COSTING TOOL (SECT)
92
Country Cost U.S. dollars (Year)*? if estimation Source
Sweden 5475 (2006) Levin & Schwartz, 2012
Turkey 283 (2004) Levin & Schwartz, 2012
Uganda 264 (2006) Issa & Evans, 2008
USA 8867 (2006) Levin & Schwartz, 2012
Zanzibar 168 (2006) Issa & Evans, 2008
LAC 26–3264 (2013?) For an array of services, including preprimary. Araujo et al., 2013.
Modeling Estimates
Algeria, Bahrain, Djibuoti, Egypt, Jordan, Kuwait, Lenanon, Libyan Arab Jamahiriya, Mauritania, Morocco, Occupied Palestinian Territory, Oman, Qatar, Saudi Arabia, Sudan, Syrian Arab Republic, Tunisia, United Arab Emirates, Yemen
58–3482 (2003) Van Ravens & Aggio, 2008
Chile 977–1815 Berlinsky & Schady, 2015
Colombia 817–1572 Berlinsky & Schady, 2015
Guatemala 630–1103 Berlinsky & Schady, 2015
Global Estimate
Low and lower-middle income countries
337 (2016) Global Partnership for Education, 2016
Low income 123 (2012), 353 (2030) Wils, 2015
Lower-middle income 242 (2012), 842 (2030) Wils, 2015
Source: Authors’ research

MOZAMBIQUE CASE STUDY
93
TABLE B.4: COST DATA COLLECTION INITIATIVES
Source: Author’s research
Name Countries included Description
Jaramillo & Mingat (2008) cost paper
Benin, Cameroon, Cote d’Ivoire, Niger
Unit costs of public preschool in relation to per capita GDP.
Inter-American Development Bank (IDB) – Budget Analysis
12 countries in Latin America and the Caribbean
Analysis of central government budget allocations to ECD.
IDB’s cost-benefit sensitivity analysis
Chile, Colombia, Guatemala Analysis of costs of enhanced vs basic structural and process quality in home visiting, daycare, and preschool programs.
IDB’s Cost Data in Araujo et al. (2013)
Costs of 42 parenting and center-based (some including preschool) programs across LAC
Parenting and center-based programs.
The World Bank Africa Region – Health, Nutrition & Population Sector; Scaling Up Nutrition project
Nigeria, Togo, Zambia, Mali Costing evidence-based nutrition interventions and developing scale-up plans in conjunction with fiscal space analysis.
The World Bank Africa Region – Education Sector; Early Learning Partnership
Gambia, Sierra Leone, Sudan, Uganda, Kenya, Madagascar
Costing scale-up plans of ECD services already in place in countries
The World Bank Strategic Impact Evaluation Fund (SIEF)
Many Costing interventions for which an impact evaluation is underway in early childhood nutrition, health, and development

Nam
eSu
mm
ary o
f Wor
kCo
untri
es o
f app
licat
ion
to d
ate
Sect
or(s
) of
inte
nded
ap
plica
tion
Cost
-Ben
-efi
t an
alys
is
Budg
et-
ing
ECD-
spe-
cific
subc
ate-
gorie
s
Inte
grat
-ed
pro
-gr
ams
Exch
ange
ra
tes
Infla
tion
rate
s Im
pute
d co
sts
Build
-in
gsAm
orti-
zatio
n
Broo
king
s-Wor
ld
Bank
Sta
n-da
rdize
d EC
D Co
stin
g To
ol
(SEC
T)
ECD
costi
ng to
ol to
brin
g m
etho
dolo
gica
l con
siste
ncy t
o th
e co
sting
of E
CD
prog
ram
s, to
ens
ure
they
are
com
para
ble
acro
ss co
untri
es an
d in
terv
entio
ns.
The
tool
can
be u
sed
acro
ss al
l ECD
sect
ors a
nd in
terv
entio
ns, a
nd ca
n ca
ptur
e im
pute
d co
sts, in
flatio
n ra
tes a
nd ex
chan
ge ra
tes.
It is
inte
nded
to b
e us
ed fo
r cos
t ben
efit a
nalys
ts an
d bu
dget
ing/
plan
ning
pur
pose
s.
Rwan
da, B
angl
ades
h,
Mali
, Mala
wi, M
exico
, M
ozam
biqu
e
All s
ub-in
ter-
vent
ions
with
in
ECD
✓✓
✓✓
✓✓
✓✓
✓
UNIC
EF R
egio
n-al
Pro
toty
peCo
sting
of p
repr
imar
y edu
catio
n an
d pa
rent
ing
prog
ram
s in
vario
us sc
ale-u
p sc
enar
ios t
akin
g in
to ac
coun
t fac
tors
relat
ed to
qua
lity o
f inp
uts a
s wel
l as
amou
nt o
f fina
ncin
g av
ailab
le fo
r pro
gram
s.
Mau
ritan
ia, C
ape
Verd
e,
Sao
Tom
e &
Prin
cipe,
Con
go
Braz
zavil
le, To
go, S
ierra
Le
one,
Gui
neau
Biss
au,
Nige
r, Sen
egal,
Gui
nea
Pres
choo
l✓
✓?
??
??
?
J-PA
L Cos
ting
tem
plat
ei“T
he g
oal o
f thi
s too
l is to
colle
ct co
sts fo
r all i
ngre
dien
ts ne
eded
to im
ple-
men
t a p
rogr
am o
r int
erve
ntio
n, ex
cludi
ng th
e co
sts o
f eva
luat
ing
the
impa
ct
of th
at p
rogr
am”.
Glob
alAl
l sec
tors
✓✓
CARI
COM
Cos
t-in
g M
odel
iiFir
st de
velo
ped
in 2
004,
the
mod
el is
a sp
read
shee
t tha
t “co
vere
d th
e es
sen-
tial s
uppo
rts in
four
type
s of E
CD se
rvice
del
ivery
mod
els t
o be
pro
vided
at a
min
imum
stan
dard
of e
duca
tion,
care
, and
dev
elop
men
t: pr
esch
ools/
nur
sery
sc
hool
s and
pre
scho
ol cl
asse
s; da
y car
e ce
ntre
s; sp
ecial
edu
catio
n se
rvice
s in
cent
res/s
choo
ls; an
d ho
me
visiti
ng p
rogr
amm
es. T
he st
anda
rdize
d in
dustr
y co
sts (b
oth
per u
nit a
nd p
er u
nit o
f tim
e) w
ere
deta
iled
and
loan
shee
ts wi
th
coun
try su
mm
ary s
heet
s wer
e pr
epar
ed fo
r use
.” Th
e m
odel
was
late
r refi
ned
to in
clude
vario
us sc
enar
ios o
f pub
lic an
d pr
ivate
fund
ing
in 2
007.
Jam
aica,
Sur
inam
e, G
uyan
a,
Angu
illa, B
elize
Pres
choo
ls,
day c
are
cen-
ters
, spe
cial
educ
atio
n se
rvice
s, an
d ho
me
visiti
ng
prog
ram
s
✓✓
??
??
??
Van
Rave
ns
and
Aggi
o in
tera
ctiv
e co
st e
stim
atio
n m
odel
iii
An in
tera
ctive
mod
el to
esti
mat
e th
e co
st of
ear
ly ch
ildho
od ca
re an
d ed
u-ca
tion
serv
ices b
ased
on
the
salar
ies o
f tea
cher
s and
care
give
rs re
lative
to
prim
ary t
each
ers,
the
dura
tion
of th
e pr
ogra
m, t
he n
umbe
r of h
ours
of w
ork
per t
each
er o
r car
egive
r per
year
, the
gro
up si
ze, a
nd an
assu
mpt
ion
of w
hat
perc
enta
ge o
f cos
ts sa
larie
s rep
rese
nt.
Alge
ria, B
ahra
in, D
jibuo
ti,
Egyp
t, Jo
rdan
, Kuw
ait,
Lena
non,
Liby
an A
rab
Jam
ahiri
ya, M
aurit
ania,
Mo-
rocc
o, O
ccup
ied
Pale
stini
an
Terri
tory,
Om
an, Q
atar
, Sau
di
Arab
ia, S
udan
, Syr
ian A
rab
Repu
blic,
Tuni
sia, U
nite
d Ar
ab E
mira
tes,
Yem
en
Early
child
-ho
od ca
re an
d ed
ucat
ion
✓✓
??
CEEL
O Co
st
of P
resc
hool
Qu
ality
(CPQ
) To
oliv
“CEE
LO h
as d
evel
oped
an E
xcel
bas
ed m
odel
that
can
be u
sed
at th
e sta
te
or d
istric
t lev
el to
esti
mat
e th
e co
st of
expa
ndin
g hi
gh q
ualit
y pre
scho
ol fo
r 3
and
4 ye
ar o
lds.
The
mod
el in
clude
s set
tings
for “
best
prac
tice”
bas
ed o
n th
e 10
NIE
ER q
ualit
y ben
chm
arks
and
fede
ral P
resc
hool
Dev
elop
men
t Gra
nt
(PDG
) req
uire
men
ts, b
ut al
so al
low
for c
hang
es o
n th
ese
setti
ng so
that
St
ates
can
unde
rsta
nd im
plica
tions
for c
ost o
f var
ious
alte
rnat
e m
odes
of
deliv
ery.”
U.S.
Pres
choo
l✓
✓?
??
??
?
Prof
essio
nal
Deve
lopm
ent
Syst
em C
ost
Anal
ysis
Tool
(A
dmin
istra
tion
for C
hild
ren
and
Fam
ilies
, Hea
lth
and
Hum
an
Serv
ices)
“Thi
s too
l is d
esig
ned
to h
elp
Stat
es an
d Te
rrito
ries u
nder
stand
curre
nt
inve
stmen
ts an
d ta
rget
reso
urce
s for
pro
fess
iona
l dev
elop
men
t sys
tem
s an
d in
itiat
ives t
hat r
esul
t in
a wel
l-qua
lified
ear
ly ch
ildho
od an
d sc
hool
-age
wo
rkfo
rce.
It g
ener
ates
dat
a ana
lyses
relat
ed to
wor
kfor
ce q
ualifi
catio
ns an
d pr
ofes
siona
l dev
elop
men
t inv
estm
ents,
defi
nes a
nd ca
tego
rizes
wor
kfor
ce
inve
stmen
ts, an
d es
timat
es an
nual
costs
to ad
vanc
e th
e wo
rkfo
rce
from
one
le
vel o
f qua
lifica
tion
towa
rds t
he n
ext.”
U.S.
Early
child
-ho
od ca
re an
d ed
ucat
ion
✓✓
??
??
??
TABL
E B.
3: C
OSTI
NG T
OOLS
Capa
bilit
ies
Uses

Capa
bilit
ies
Uses
Nam
eSu
mm
ary o
f Wor
kCo
untri
es o
f app
licat
ion
to d
ate
Sect
or(s
) of
inte
nded
ap
plica
tion
Cost
-Ben
-efi
t an
alys
is
Budg
et-
ing
ECD-
spe-
cific
subc
ate-
gorie
s
Inte
grat
-ed
pro
-gr
ams
Exch
ange
ra
tes
Infla
tion
rate
s Im
pute
d co
sts
Build
-in
gsAm
orti-
zatio
n
Cent
er fo
r Be
nefit
-Cos
t St
udie
s of
Educ
atio
n (C
BCSE
) Cos
t To
ol K
itv
“The
Tool
Kit
inclu
des a
n “in
gred
ient
s” w
ork s
heet
that
lets
the
user
iden
tify
prog
ram
ingr
edie
nts a
nd as
sign
price
s for
eac
h. U
sers
may
look
up
price
s of
com
mon
ly us
ed re
sour
ces i
n ed
ucat
iona
l pro
gram
s thr
ough
the
“Dat
abas
e of
Ed
ucat
iona
l Res
ourc
e Pr
ices,”
whi
ch is
also
par
t of t
he To
ol K
it. Th
e To
ol K
it all
ows u
sers
to ca
lculat
e fu
ll cos
ts, p
er-p
artic
ipan
t cos
ts, an
d co
sts p
er u
nit
of an
out
com
e.”
U.S.
(and
pos
sibly
othe
rs)
Educ
atio
n✓
??
??
✓?
?
Prov
ider
Cos
t of
Qua
lity
Calcu
lato
r (N
atio
nal
Cent
er o
n Ch
ild
Care
Qua
lity
Impr
ovem
ent)vi
“A to
ol fo
r esti
mat
ing
costs
bas
ed o
n sp
ecific
inpu
ts id
entifi
ed b
y a p
rovid
er.
It in
clude
s tra
inin
g an
d pr
ofes
siona
l dev
elop
men
t cos
ts, as
wel
l as t
he
num
ber o
f add
ition
al ho
urs p
er w
eek a
pro
vider
spen
ds o
n qu
ality
-relat
ed
activ
ities
. The
PCQ
C all
ows u
sers
to d
eter
min
e th
e co
st of
pro
vidin
g se
rvice
s at
a pa
rticu
lar le
vel o
f qua
lity (
base
d on
licen
sing
or Q
RIS
stand
ards
) and
to
com
pare
esti
mat
ed co
sts w
ith e
stim
ated
reve
nues
to as
sess
susta
inab
ility.”
U.S.
(and
pos
sibly
othe
rs)
Child
Car
e✓
✓?
??
??
Evid
ence
-bas
ed
Hom
e Vi
sitin
g (E
BHV)
Cos
t Da
ta C
olle
ctio
n In
stru
men
tsvi
i
“(Bol
ler e
t al.,
2012
), us
ed to
calcu
late
costs
of e
arly
child
hood
hom
e vis
iting
pr
ogra
ms,
colle
ct in
form
atio
n on
staff
tim
e us
e an
d all
ow ca
lculat
ion
of th
e am
ount
of t
ime
staff
mem
bers
spen
d in
dire
ct co
ntac
t with
fam
ilies v
ersu
s tim
e sp
ent o
n tra
vel, w
ritin
g up
case
not
es, a
nd o
ther
task
s.”
U.S.
(and
pos
sibly
othe
rs)
Hom
e vis
iting
pr
ogra
ms
✓✓
Qual
ity
Ratin
g an
d Im
prov
emen
t St
anda
rds
(QRI
S) C
ost
Estim
atio
n To
olvi
ii
“Fou
nd o
n th
e Na
tiona
l Cen
ter o
n Ch
ild C
are
Quali
ty Im
prov
emen
t web
site,
es
timat
es th
e co
sts o
f im
plem
entin
g a Q
RIS
base
d on
use
r-ent
ered
as
sum
ptio
ns, in
cludi
ng th
e co
st of
qua
lity a
sses
smen
t, m
onito
ring,
and
adm
inist
ratio
n; p
rofe
ssio
nal d
evel
opm
ent;
tech
nica
l ass
istan
ce; fi
nanc
ial
ince
ntive
s; co
mm
unica
tion
for p
ublic
awar
enes
s; fa
cility
impr
ovem
ents;
sy
stem
eva
luat
ion;
and
data
syste
ms a
nd o
ther
adm
inist
ratio
n.”
U.S.
(and
pos
sibly
othe
rs)
Child
Car
e✓
✓?
??
??
?
Was
hing
ton
Stat
e Hu
man
Se
rvice
s Po
licy C
ente
r (H
SPC)
pol
icy
simul
atio
nix
A po
licy s
imul
atio
n m
odel
that
esti
mat
es th
e co
st of
ECD
, inclu
ding
varia
bles
su
ch as
the
utiliz
atio
n ra
te in
the
juris
dict
ion.
The
simul
atio
n pr
oces
s the
n all
ows s
take
hold
ers t
o ad
just
polic
y spe
cifica
tions
and
com
pare
fina
ncial
im
plica
tions
.
U.S.
ECD
✓✓
??
??
??
i J-
PAL,
201
5.
ii C
harle
s &
Will
iam
s, 2
008.
iii v
an R
aven
s &
Aggi
o, 2
008.
iv
Ric
kus
et a
l., 2
016.
v
Car
onon
gan
et a
l., 2
016.
vi
Car
onon
gan
et a
l., 2
016.
vi
i C
aron
onga
n et
al.,
201
6.
viii
Car
onon
gan
et a
l., 2
016.
ix
Bra
ndon
, 200
8.

1775 Massachusetts Ave., NW Washington, D.C. 20036 202.797.6000
www.brookings.edu/universal-education@BrookingsGlobal