Embed Size (px)
Citation preview
The Smart Grid ??AEE – National Capital ChapterAEE – National Capital ChapterKeith Dodrill US Dept of EnergyNational Energy Technology LaboratoryNational Energy Technology LaboratoryMay 25, 2010

Topics
• The "Case for Action”
• What is the Smart Grid?
K T h l A• Key Technology Areas
• The Smart Grid business case
• Challenges and Barriers
• Current Activities
• Summary2
• Summary

Case for Action
• Today’s grid is aging and outmodedU li bilit i ti billi f d ll• Unreliability is costing consumers billions of dollars
• Today’s grid is vulnerable to attack and natural disaster• An extended loss of today’s grid could be catastrophic to • An extended loss of today s grid could be catastrophic to
our security, economy and quality of life• Today’s grid does not address the 21st century power
supply challenges• Missed opportunity to enjoy the benefits of a Smart Grid
Di t bi t d i i li bilit k l d • Disturbing trends in prices, reliability, peak loads, transmission congestion, & asset utilizationBut is it worth it?
33
But is it worth it?

The “Market” will create new stresses
25 M residential solar
1 M PHEV/PEV
10 M PHEV/PEV50 M PHEV/PEV
Generation• 47%• 17,342 units
Transmission• 43%• 164,000 miles
Distribution• 34%• 3 million miles
Consumer Systems• <1%• 12.3 M DG
Demand ResponseConservation
2 M architectural wind5 M building solar
500 wind parks50 solar parks 5,000 distributed wind
5,000 utility solar100,000 Buildings as PP
4

What is the Smart Grid?
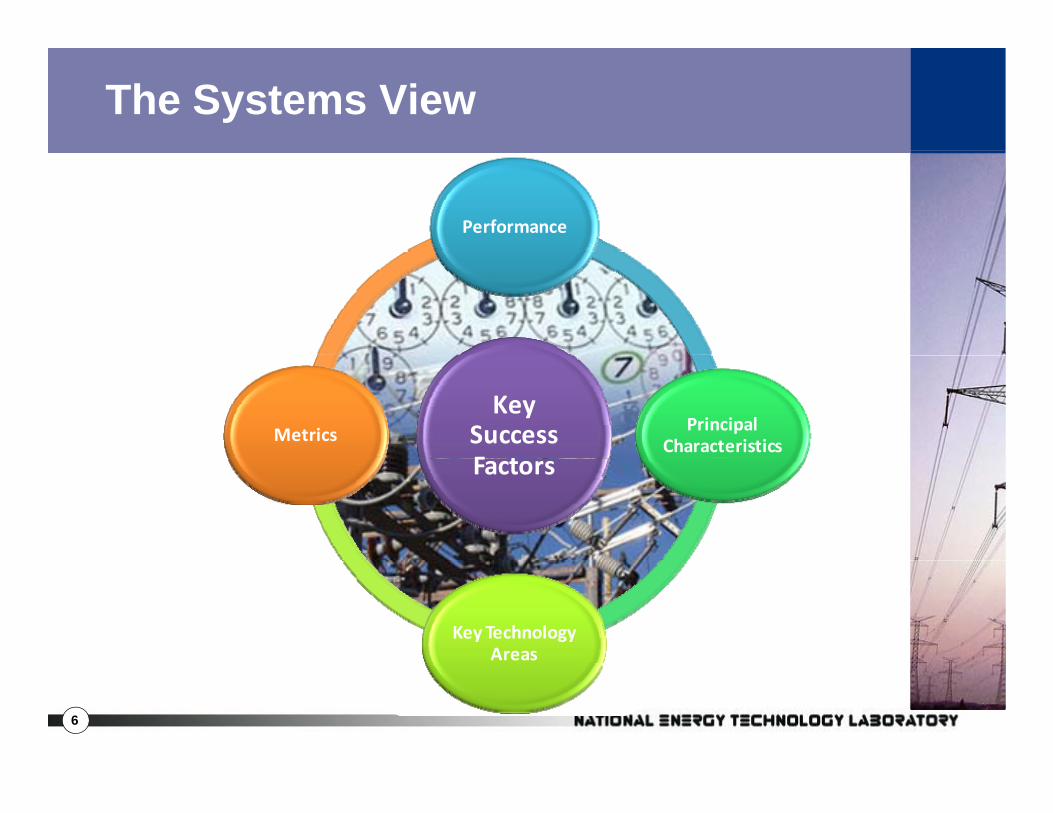
The Systems View
Performance
Key Success F t
Principal CharacteristicsMetrics
Factors
Key Technology Areas
6

What’s different with the Smart Grid?
• Decentralized supply and control• Two-way power flow• Two-way power flow• Two-way information flow
Creating the intelligence and capability toCreating the intelligence and capability to optimize:– Reliability
Security– Security– Economics– Efficiency
Environment
…for all stakeholders
– Environment– Safety
In order to succeed, we must view the Smart Grid as a
7
vision AND as a system…

Smart Grid Characteristics
The Smart Grid is “transactive” and will:
• Enable active participation by consumers• Accommodate all generation and storage options• Enable new products, services, and markets• Provide power quality for the digital economy• Optimize asset utilization and operate efficiently• Anticipate & respond to system disturbances (self-heal)
O t ili tl i t tt k d t l di t• Operate resiliently against attack and natural disaster
…the enabler8
…the enabler

Smart Grid Domains
Source: NIST
9Updated 02/25/2008

Smart Rates Can Work
Rate Peak Time Pricing Peak Time Rebate 8-Hour time of Use
Customers Rate Alone
Rate w/Controlling T h l
Rate Alone
Rate w/Controlling T h l
Rate Alone
Rate w/Controlling T h lTechnology Technology Technology
Residential -16.1% -23.3% -10.9% -17.8% 3.7%
Connecticut L&P Plan it Wise Results Reduction in Peak
Business -2.8% -7.2% 0.0% -4.1% 0.0%
Connecticut L&P Plan-it Wise Results—Reduction in Peak Load
10

Key Technology Areasy gy

Smart Grid Key Technology Areas
Advanced ControlControl Methods
Integrated Communications
Decision Support & Improved Interfaces
Sensors and Measurement
Interfaces
Advanced Components
The Smart Grid is a System.
12
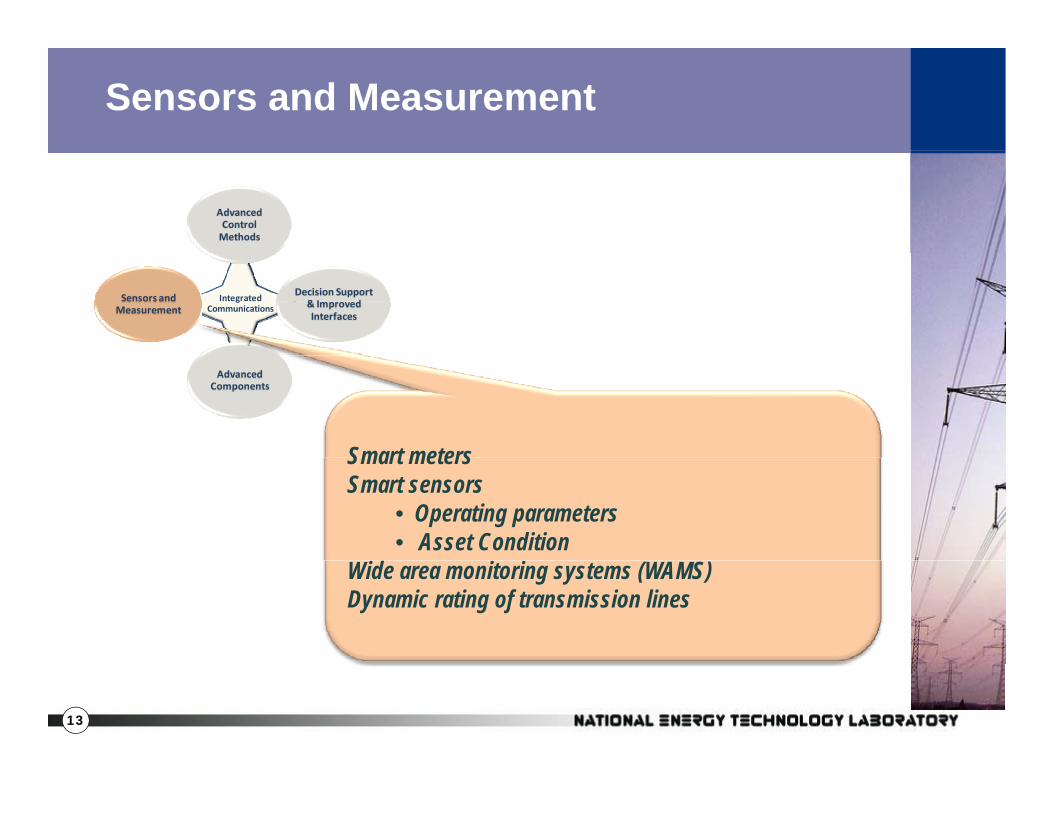
Sensors and Measurement
Advanced Control Methods
Integrated Communications
Decision Support & Improved Interfaces
Sensors and Measurement
Advanced Components
Smart metersSmart metersSmart sensors
• Operating parameters• Asset Condition
Wide area monitoring systems (WAMS)Dynamic rating of transmission lines
13
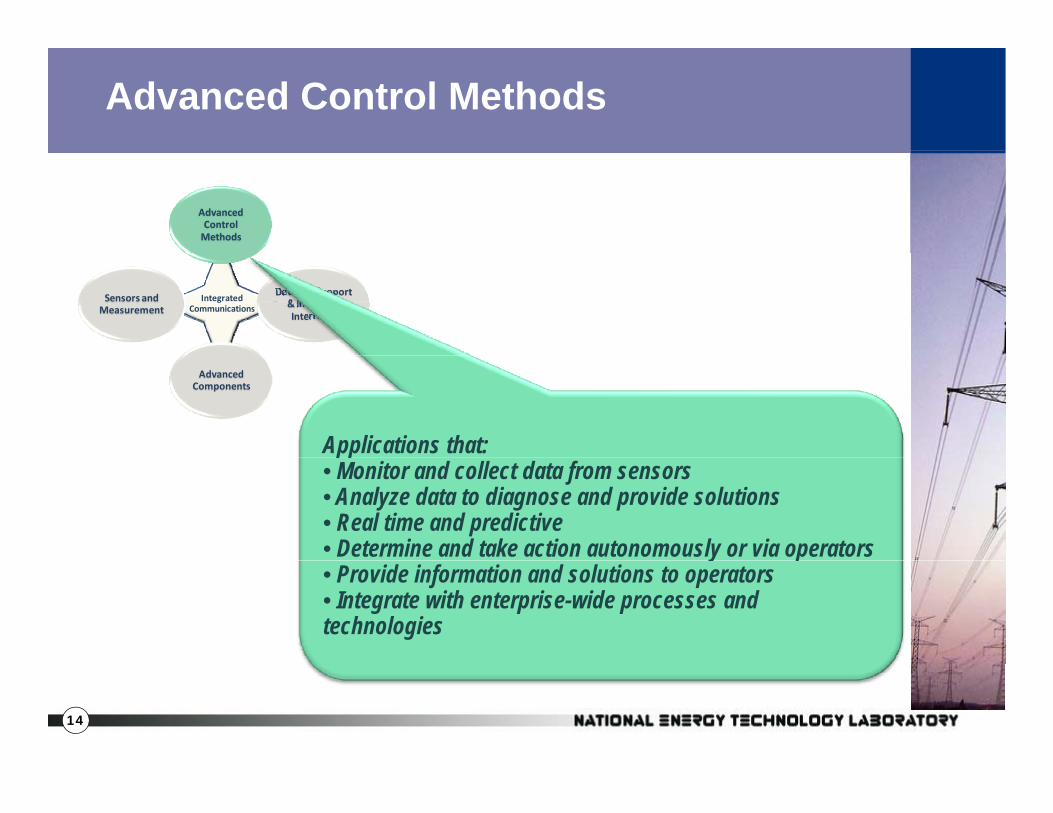
Advanced Control Methods
Advanced Control Methods
Integrated Communications
Decision Support & Improved Interfaces
Sensors and Measurement
Advanced Components
Applications that:• Monitor and collect data from sensors• Analyze data to diagnose and provide solutions• Real time and predictive• Determine and take action autonomously or via operatorsy p• Provide information and solutions to operators• Integrate with enterprise-wide processes and technologies
14
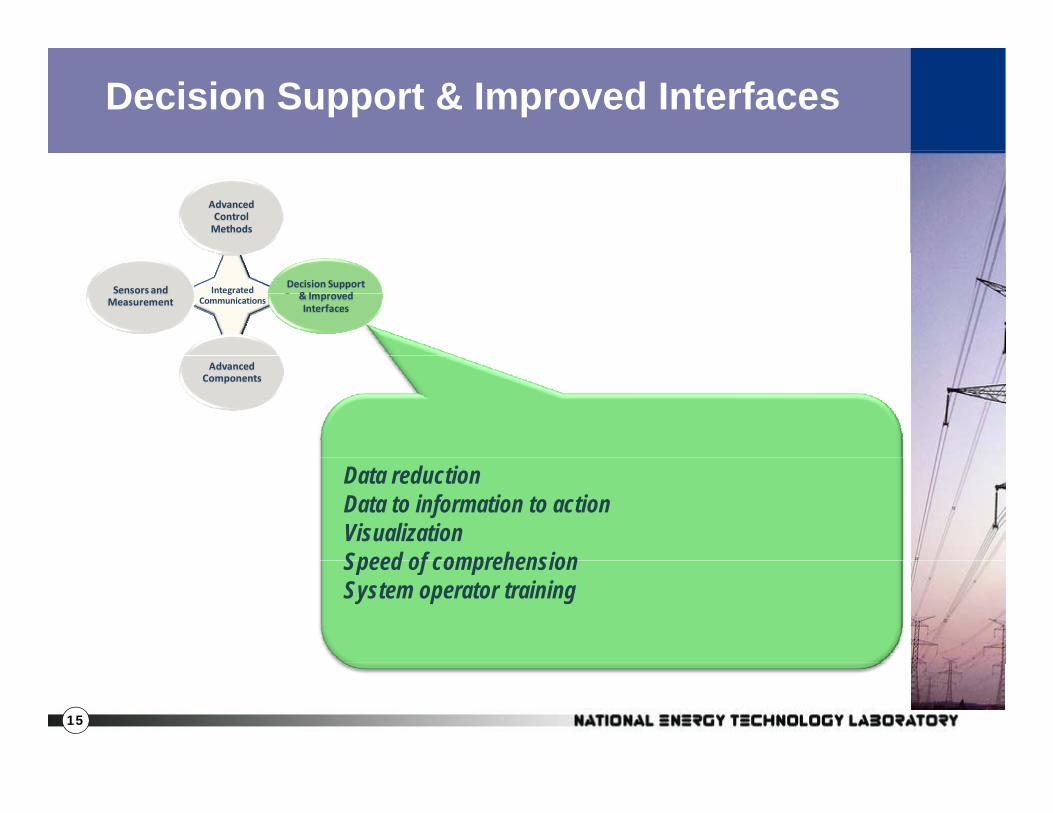
Decision Support & Improved Interfaces
Advanced Control Methods
Integrated Communications
Decision Support & Improved Interfaces
Sensors and Measurement
Advanced Components
Data reductionData to information to actionVisualizationSpeed of comprehensionSpeed of comprehensionSystem operator training
15

Advanced Components
Advanced Control Methods
Integrated Communications
Decision Support & Improved Interfaces
Sensors and Measurement
Advanced Components
Next generation FACTS/PQ devicesNext generation FACTS/PQ devicesAdvanced distributed generation and energy storagePHEV - V2G modeFault current limitersSuperconducting transmission cable & rotating machinesMicro-gridsAdvanced switches and conductors
16

Integrated Communications
Advanced Control Methods
Integrated Communications
Decision Support & Improved Interfaces
Advanced
Sensors and Measurement
Components
Consider all needs:• Smart meters• Smart sensors• Demand Response• DG dispatch• Distribution automation• Micro-grids• Markets• Work force management• Mobile premises (PHEV’s)
17
The SG Business Case

EPRI’s Perspective on the Value Proposition
Cost to Modernize$165B 20
Benefit of Modernization$638B $802B 20• $165B over 20 years
– $127B for Distribution– $38B for Transmission
• $638B - $802B over 20 years
• Overall benefit to cost • ~$8.3B per year
(incremental to business-as-usual)
ratio is 4:1 to 5:1
• Current annual investment - $18B
EPRI 2004EPRI 2004
Thus, based on the underlying assumptions, this comparison shows that the benefits of the envisioned Future Power Delivery System significantly outweigh the costs. (EPRI 2004)
19
outweigh the costs. (EPRI, 2004)
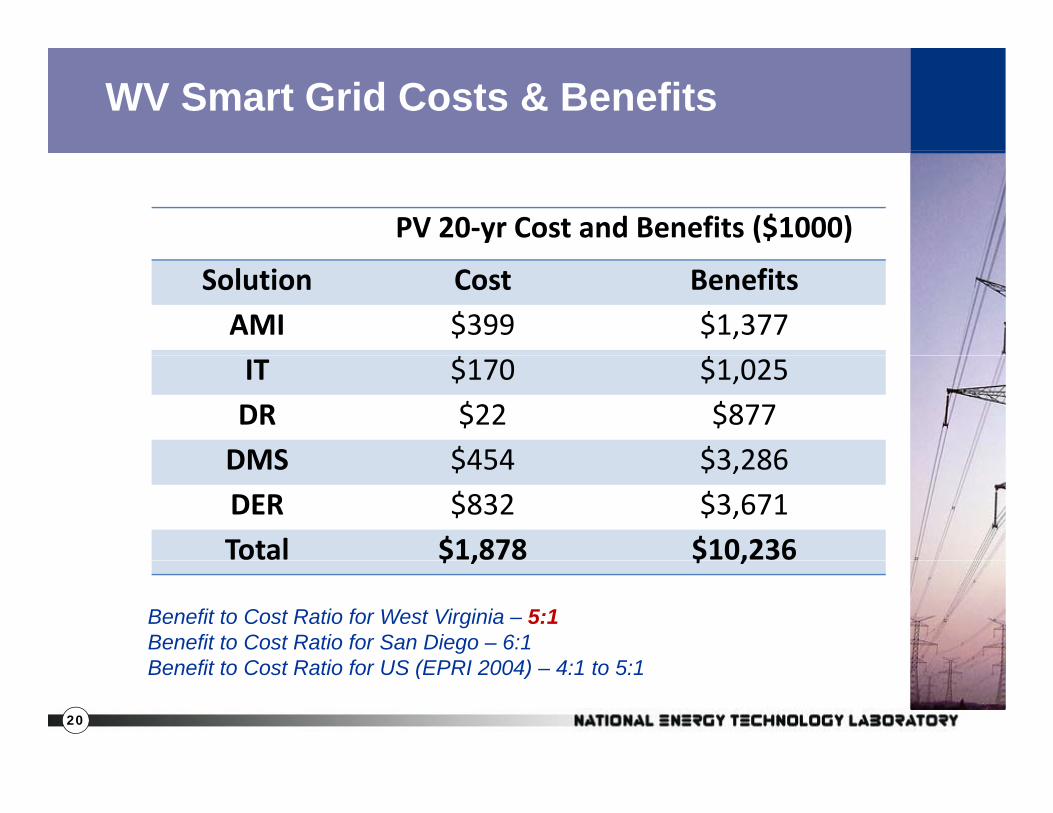
WV Smart Grid Costs & Benefits
PV 20‐yr Cost and Benefits ($1000)
Solution Cost BenefitsAMI $399 $1,377IT $170 $1,025DR $22 $877DMS $454 $3 286DMS $454 $3,286DER $832 $3,671Total $1,878 $10,236$ , $ ,
Benefit to Cost Ratio for West Virginia – 5:1Benefit to Cost Ratio for San Diego – 6:1B fit t C t R ti f US (EPRI 2004) 4 1 t 5 1
20
Benefit to Cost Ratio for US (EPRI 2004) – 4:1 to 5:1

WV Smart Grid Annual Benefits
Key Success Factors
Benefits Annual Benefits ($M) (All Beneficiaries)
Reliability Reduced Consumer Losses $898y Reduce Power Quality Events $131
Economic Reduce Price of Electricity $399 Job Creation $215 Consumer Sales of DER Resources $175 Increased Energy Sales as Exports $7 Reduced Transmission Congestion $1
d i l $ Increased Transportation Fuels Business
$5
Consumer Conservation $20 Operational Savings $194p g $
Environmental Reduced Emissions $7 Security Reduced Blackout Probability &
Dependence on Foreign Oil $13
21
Safety Reduce Hazard Exposure $1
Challenges and Barriersg
Many Challenges to Address
• Consumer acceptancep• Culture and education• Regulatory & policy• Technical• Engineering
S t l i• System planning• Operations• Workforce training and education• Workforce training and education
23

Many Stakeholders Involved
24

The Two Big Things…
• Defining and understanding the business case– Leads to logical implementation– Maximizes profitability– Minimizes impact to the consumerMinimizes impact to the consumer
• Consumer education– Needed understanding of the Smart Grid vision
• consumer benefits• societal benefits• costs of doing nothingg g• address their concerns and questions
Th ill f th S t G id
25
The consumer will pay for the Smart Grid…

Smart Grid Metric Map
Value Key TechnologyPrincipal
Areas TechnologyAreasCharacteristics
ImpactMetrics
ResearchMetrics
Build Metrics
If we do this right – we can all be winners– Suppliers– Consumers
26
– Society

Current Smart Grid Activities
• Smart Grid Investment Grants (100 projects)– $3 4 billion Federal; $4 7 billion private sector$3.4 billion Federal; $4.7 billion private sector– 850 PMUs covering 100% of transmission– 200,000 smart transformers– 700 automated substations– 40 million smart meters– 1 million in-home displays
• Smart Grid Demonstration Projects (32 projects)$620 illi F d l $1 billi i t t– $620 million Federal; $1 billion private sector
– 16 storage projects– 16 regional demonstrations
27
16 regional demonstrations

Summary
• Motivation to move toward national Smart Grid
• Common vision being established for Smart Grid
• Benefits accrue to utilities, consumers & society, y
• Business case shows 4:1 to 6:1 ROI
• Different approaches to implementing Smart Grid
• Technical, regulatory, consumer & cultural barriers
• DOE ARRA projects create momentum
28

For More Information
For additional Information:www.netl.doe.gov/smartgrid
Federal Smart Grid Websitewww.smartgrid.gov
Smart Grid Information Clearinghousewww.sgiclearinghouse.org
Steve BossartNational Energy Technology Lab
2929
29

It will “Enable active participation by consumers”
• Consumers have access to new information, control and options to engage in electricity markets– Reduce consumption and energy bill– Enable new technologies (PHEV, HAN, EMS, smart appliances,
etc.) – Sell resources for revenue or environmental stewardship– Incentives to participate (i.e. smart rates)
• Grid operators have new resource optionsp p– Reduce peak load and prices through demand response– Improve grid reliability– Ancillary servicesy
Today TomorrowLittle or no info, limited use of smart
pricing few choicesFull price info, choose from many
plans prices and options buy and sell
3030
pricing, few choices plans, prices and options, buy and sell, “E-Bay”

It will “Accommodate all generation and storage options”
• Seamlessly integrates all types and sizes of electrical generation and storage systemselectrical generation and storage systems
• “Plug-and-play” convenience– Simplified interconnection processes – Universal interoperability standards
• “Moves the needle”– shifts to a more decentralized modelmodel
• Large central power plants will continue to play a major role.
Today TomorrowDominated by central generation. Little
DG DR storage or renewablesMany “plug and play” distributed
energy resources complement central
3131
DG, DR, storage, or renewables energy resources complement central generation

It will “Enable new products, services and markets”
• Links buyers and sellers – consumer to RTOS f• Supports the creation of new electricity markets– Demand Response– Energy, Capacity, Ancillary Services– Brokers, integrators, aggregators, etc.– In-home devices and applications
• Provides for consistent market operation acrossProvides for consistent market operation across regions
Today Tomorrow
Near-zero market interaction at distribution level
Distribution assets and consumers act as resources for transmission, growth
3232
distribution level of new secondary markets

It will “Provide power quality for the digital economy”
• Monitors, diagnoses and responds to PQ issuesissues
• Supplies various grades of power quality at different pricing levelsp g
• Greatly reduces consumer losses due to PQ (~$25B/year)
• Quality Control for the grid
Today Tomorrow
Focus on outages not power quality PQ a priority with variety of
3333
Focus on outages not power quality price/quality options based on needs

It will “Optimize asset utilization and operate efficiently”
• Operational improvements– Improved load factors and lower system losses– Integrated outage management – Risk assessment
• Asset Management improvements• Asset Management improvements– The knowledge to build only what we need – Improved maintenance processes– Improved resource management processes– More power through existing assets
• Reduction in utility costs (O&M and Capital)educt o ut ty costs (O& a d Cap ta )
Today TomorrowLimited grid information & minimal Deep integration of grid intelligence
3434
gintegration with asset management
p g g genabling reduction in O&M and CapEx

It will “Anticipate & respond to system disturbances”
• Performs continuous self-assessmentsD t t l d t d t• Detects, analyzes, responds to, and restores grid components or network sections
• Handles problems too large or too fast-movingHandles problems too large or too fast moving for human intervention
• Self heals - acts as the grid’s “immune system”• Supports grid reliability, security, and power
quality
Today TomorrowProtects assets following disruption Prevents disruptions, minimizes
3535
g p(e.g., trip relay)
p ,impact, restores rapidly

It will “Operate resiliently against attack and natural disaster”
• System-wide solution to physical and cyber itsecurity
• Reduces threat, vulnerability, consequences
• Deters, detects, mitigates, responds, and restores
“• “Fort Knox” image
• Decentralization and self-healing enabled
Today TomorrowVulnerable to terrorists and natural Deters, detects, mitigates, and restores
3636
disasters, , g ,
rapidly and efficiently—“cyber proof”
Who are the Smart Grid Beneficiaries?
• Utilities• Consumers
S i t• Society
The value of Smart Grid depends on who you ask!
37

An Example
Potential Bill Savings
Estimated residential bill/year $1,200
Expected reduction from EE/DR 10% – 15%Expected reduction from EE/DR 10% 15%
Potential savings/year $120 –$180
Assumed bill increase to pay for smart grid/year $60– $120Assumed bill increase to pay for smart grid/year $60 $
Net consumer value/year $0 –$120
Positive value but not very compelling!
38

Another Example
Potential Fuel Cost Savings
Assumed miles driven/year 10,000
Fuel cost (gas)/mile $0.10 – 0.15
Fuel cost (PHEV)/mile $0.03 – 0.05
Annual fuel cost (gas) $1,000 – $1,500
A l f l t (PHEV) $300 $500Annual fuel cost (PHEV) $300 – $500
Potential fuel cost savings/year $500 – $1,200
Premium to purchase PHEV over gas $4,000 – $10,000p g $ , $ ,
More compelling but is it enough?
39
Societal Value Proposition
Benefits
Energy independence National security D d l t i it i Downward pressure on electricity prices Improved environmentGrowing U.S. economyG o g U S eco o y Improved reliability
40

Implementation sequence can vary
ConsumerEnablement
CE empowers the customer and enables id i t tiEnablement grid interaction
AD improves reliability and Advanced Distribution
AT addresses congestion
p yenables self healing
Advanced Distribution
AT addresses congestion and integrates with RTO’s
Advanced Transmission
AAM helps utilities reduce costs and operate
Advanced Asset Management
4141
p pmore efficiently
Current Smart Grid Activities (cont.)
• DOE Renewable & Distributed Systems Integration (9 projects)( p j )
• EPRI Smart Grid Demonstrations (6 projects)
• Excel’s Smart Grid City, Boulder, CO
• Smart Grid System Report to Congresshttp://www smartgrid gov/resources– http://www.smartgrid.gov/resources
42

![[Smart Grid Market Research] Brazil: The Smart Grid Network, Zpryme Smart Grid Insights, October 2011](https://img.dokumen.tips/doc/110x75/577d20871a28ab4e1e931ff6/smart-grid-market-research-brazil-the-smart-grid-network-zpryme-smart-grid.jpg)

![[Smart Grid Market Research] Smart Grid Index: November 2012 - Zpryme Smart Grid Insights](https://img.dokumen.tips/doc/110x75/541402018d7f728a698b47a5/smart-grid-market-research-smart-grid-index-november-2012-zpryme-smart-grid-insights.jpg)


![[Smart Grid Market Research] India: Smart Grid Legacy, Zpryme Smart Grid Insights, September 2011](https://img.dokumen.tips/doc/110x75/541402518d7f7294698b47d4/smart-grid-market-research-india-smart-grid-legacy-zpryme-smart-grid-insights-september-2011.jpg)


![[Smart Grid Market Research] The Optimized Grid - Zpryme Smart Grid Insights](https://img.dokumen.tips/doc/110x75/541402188d7f7294698b47d2/smart-grid-market-research-the-optimized-grid-zpryme-smart-grid-insights.jpg)