Embed Size (px)
Citation preview

Private Pension Markets in India
The Sleeping GiantPRIVATE PENSION MARKETS IN INDIA
An IIMS Dataworks Research Report
The Sleeping GiantPRIVATE PENSION MARKETS IN INDIA

Private Pension Markets in India
© 2008, Invest India Market Solutions Private Limited (IIMS Dataworks), New Delhi, India. All rights reserved. Developed and printed in India. The contents of this publication are for the exclusive use of IIMS Dataworks clients and subscribers and may not be duplicated or distributed. Reproduction or distribution in whole or in part in any media, including electronic media, is prohibited. No part of this publication may be reproduced, stored in a retrieval system, or transmitted in any form or by any means electronic, mechanical, photocopying, recording or otherwise without the prior written permission of Invest India Market Solutions Private Limited. Any unauthorised reproduction, distribution or translation of this publication is unlawful under Indian law and may result in either or both a civil claim for damages and criminal prosecution.
Disclaimer: This Report is published by IIMS Dataworks, a financial sector consulting and research firm based in India. The information in this Report is derived from IIMS Dataworks’ proprietary data collected under contract for IIMS Dataworks by ORG CSR Private Limited as part of the Invest India Incomes and Savings Survey 2007 and is subject to any limitations of those data. The information in this report although believed to be accurate, is not guaranteed and may be inaccurate. IIMS Dataworks states that IIMS Dataworks as a condition of sale of this publication has no financial liability whatsoever in connection with any decision, observation or conclusion that may be made by a subscriber or any other person or entity on the basis of the contents of this publication.

Private Pension Markets in India
FOREWORD
In 2004, Government of India took the first steps towards establishing a self sustaining and broad-based retirement pension system for the country when it moved away from unfunded defined benefit pensions for government employees in favour of a contributory system. Since then, most State Governments have seen the necessity and merit of following suit and 19 States have already adopted a similar approach. With the process of implementation of the new pension system for public servants (NPS) now well advanced, the focus of attention will turn increasingly to the next stage of the reform agenda – which is the old age income security needs of the wider workforce.
The Indian economy is growing rapidly. Increase in the level of income has brought with it many benefits for the Indian population. Job opportunities are expanding and with that household incomes are rising rapidly. As a result, everyday Indians are now enjoying the conveniences of life enjoyed elsewhere in the world. A problem for government and business alike however is that the pace of change has been rather rapid, and much of what needs to be understood clearly to guide good policy and business strategies in the transition from the old to the new Indian economy still lies largely out of view, or is seen only partially.
A case in point has been the debate surrounding the NPS which has lacked any empirical basis for testing the efficacy of the various viewpoints that exist on an optimum design for the NPS. Through this Report, IIMS Dataworks has focused on the task of providing us with that empirical basis. The evidence in this Report clearly demonstrates that there is a high level of anxiety among unorganised sector workers in India about their old age security by reason of increasing uncertainties that they will be supported by their children in old age, with as many as two thirds believing that support from children will not be forthcoming. Whether this proves to be the case of course still lies in the future but the rapid growth in nuclear families that are now the norm in India, an increasingly mobile workforce and expanding urbanisation of the population suggests that their assessment is in all probability accurate. Unlike in the past therefore, Indians increasingly will need to self-provide for their own retirement.
The issue of pension system design has been the subject of intensive research around the world for decades because of the significant social and financial imperatives it involves. In the process, best practice models and approaches have emerged that are now widely supported. The Indian Government’s approach to its own pension reform agenda has been to leverage international experience to avert falling into the problems other countries with

Private Pension Markets in India
more mature pension systems have experienced. How everyday Indians would respond to international best practice design however has remained an unanswered question until now. Encouragingly, the IIMS Dataworks research, based on a representative pan-Indian survey, shows an overwhelming level of support for the NPS design with eighty percent and more of Indian workers subscribing to the value of key design features. The IIMS Dataworks research also gives us a better insight into the issue of asset management norms that Indians would support and shows that there is at least willingness on the part of many potential pension contributors to place their savings in securities markets.
Equally encouraging is that the signs are positive on the all important questions of whether Indians would participate in voluntary pension savings in good numbers, and whether the country’s financial sector institutional frameworks are adequate for delivering a broad based pension scheme for low income as well as middle and high income individuals at an acceptable cost. The IIMS Dataworks research shows that as many as eighty million workers would be willing to participate in such a scheme. Of this large number, more than two thirds are already connected to the banking system while most of the remainder can be reached through other existing distribution channels such as India Post. Giving these understandings, wider currency should assist in achieving more considered public debate, as well as instilling the necessary level of confidence in the financial sector that there is a highly attractive business opportunity to pursue and that their existing infrastructure is adequate for delivering the necessary results.
Going forward, the importance of succeeding at establishing a vibrant pension sector in the country cannot be underestimated. Doing that, and doing it well, will be one of the determinants of the health and stability of the country’s capital markets because of the boost in long term savings that pension contributions bring, and even more importantly for the contribution it can make to reducing the level of old age poverty that continues to plague the country.
D SwarupChairmanPension Fund Regulatory and Development AuthorityApril 2008

Private Pension Markets in India
Overview
1. Retirement Savings Patterns in India 1
2. Pension Product Design 3
3. Profiling the Pension Ready Population 7
4. Kick Starting the Market 13
5. Marketing Strategies 23
6. The Wider Residual Market 25
Appendix A - NPS Corpus Projections 29
Appendix B - Synopsis of Existing Retirement Savings Schemes in India 31
Annexure tables 33
CONTENTS

Private Pension Markets in India
This page has been deliberately kept blank

Private Pension Markets in India
Overview
In January 2004 the Union Government took the first steps towards establishing a much overdue broad based retirement pensions system in India when it truncated unfunded pensions for the country’s civil servants in favour of a contributory scheme in the form of the New Pension System (NPS). In the wings were plans to quickly extend the arrangements on a voluntary basis to India’s wider workforce of over 400 million workers who, with few exceptions, have little to fall back on in old age apart from whatever savings they are able to marshal during their active working life and an increasingly fragile family support system.
Four years on in one of the sadder ironies of India’s commitment to democratic processes is that little progress has been made. At the heart of the inertia are the self-styled advocates of the people in the person of left leaning politicians still struggling to accept the country’s march to full market economy status with all the trappings that this involves. While the left inevitably will lose this debate, the damage being caused to the welfare of India’s future elderly is palpable for it is blocking interest in participating in a broad based retirement savings system among a significantly large number of Indian workers interested to save for their retirement. In the process domestic capital markets are suffering also as they still lack the mass of stable long term investment that a vibrant private pensions system offers.
In this Report we present evidence from the Invest India Dataworks Income and Saving Survey (IISS 2007) that sizes and segments latent demand for pensions as a guide for government and commercial interests alike in considering pension business opportunities in the country. What this reveals is that at the present time there are over eight crore workers who see the need for, and value of, a voluntary contributory retirement savings system. This compares with an estimated two crore persons only who are presently saving for their retirement in life insurance and other financial products. If latent demand for pensions from these groups were fully harnessed, Indian workers would contribute an estimated Rupees 57,000 crore to the NPS in the first full year of operations. Up to 20 percent of these workers (1.6 crore workers) we believe are prime prospects and likely to start saving for their retirement as soon as appropriate products are offered to them. Lying beyond are 3.7 crore government and private sector workers who are covered by the various long standing mandated pension schemes in the country. What is of interest in this group is that there is a significant number who obviously feel that there mandated entitlements are inadequate and who would be interested to participate in a voluntary retirement savings scheme as well to supplement their work-based pension entitlements.

Private Pension Markets in India
What is most encouraging about the composition of latent demand is that it is broad based with an even geographical spread, and it encompasses the full span of age, income and occupational cohorts. Just under 70 percent of the latent demand market has an existing bank account and a further 17 percent have savings with India Post. Half also are existing customers of life insurance companies. Sales and distribution indicators to bring a broad based voluntary pension scheme into being therefore are on the whole very positive as existing institutional infrastructure should be capable of being successfully leveraged without the need of significant new infrastructure investment. For the interest of subscribers to this Report we also present the particular bank and insurance brand affiliations of both the larger eight crore and smaller 1.6 crore latent demand groups.
Success with mobilising latent demand will depend on the strength of product design and marketing strategies and the Report presents an evidence based view from IISS 2007 results as a guide for this purpose. In the process of so doing the Report explodes certain myths in relation to the risk profile of Indian investors and the traditional cultural disposition of Indian households to resolve income support needs in retirement through familial networks that in the past have provided a substitute for formal retirement support systems. Like much of the country’s past, these cultural dispositions are rapidly receding leaving workers increasingly exposed to the prospect of old age poverty. In the case of the assumed risk appetites of potential pension subscribers, IISS data offers some insights into the actual rather than the assumed risk perceptions of the latent demand group demonstrating that the case made against offering subscribers securities investment options as part of a broad based pension system has been exaggerated.
IIMS Dataworks

Private Pension Markets in India
Retirement Savings Patterns in India
In 2007 the Indian adult workforce was more than 430 million strong, an estimated 321 million of whom were deriving direct personal incomes against their against their primary occupations. Of the latter number, some 22 million were in public sector employment by virtue of which fact they were covered by mandatory pension arrangements. In addition, there were an estimated 15 million private sector employees covered by the Employees Provident Fund arrangements. In total this meant that only one in nine members of the paid workforce had retirement income guarantees of one kind or another, leaving almost 90 percent, or 284 million workers uncovered.
As part of its pan–India Income and Savings Survey (IISS 2007), Dataworks sought information from respondents on their retirement intentions and expectations in the context of their existing savings preferences, the principal aim of which was to provide a basis for assessing potential demand for voluntary pension arrangements of the kind represented by the NPS. As part of this effort, the first ever information was collected to provide an understanding of who among those uncovered workers are making transparent savings for retirement through life insurance and other savings products. For this purpose respondents were asked to nominate whether building retirement savings was a primary savings objective. As the results in the table below demonstrate, fewer than one in fourteen uncovered workers presently are consciously saving for retirement and the amounts being saved in most cases are patently inadequate as they represent, in the average case, between only one and one and one half times their average annual earnings.
Total group Formal sector workers* Informal sector workers
Number saving privately for retirement (Million) 5.6 0.8 4.8
Estimated total savings of the group (Rs. Crore) 22,900 4,950 17,950
Average per capita retirment savings accumulations 1.0 0.4 1.3as a factor of average annual earnings of the group
Existing Private Savings for Retirement
* The formal sector employees are those in government salaried workers and those who are working in private sector �rms with more than 20 employees.
1

Private Pension Markets in India
Probable reasons for voluntary savings for retirement in India being at such low levels include:
• Earnings levels and with that savings capacities in the past have been low. However, this situation has changed dramatically in the past ten years and all but the lowest paid workers are now positioned to make savings, including long-term savings. In the past three years alone for example average annual earnings in India have grown by some 70 percent and further exponential growth in the future can be expected;
• Average life expectancy of earlier generations of workers was low with the result that financial needs in old age were not an issue for most as they did not survive beyond age sixty. IISS 2007 results show that this perception is still widespread with less than one in eight workers believing that they will survive into their seventies. However, demographic studies show that average life expectancy for those aged 60 years has already extended to nearly twenty years, and for the generation of workers now in middle age longevity can be expected to extend further. What this means is that the present generation of workers in India is the first for whom retirement and retirement needs generally will be an issue, and once this is recognised, interest in retirement savings can be expected to increase sharply;
• Traditional family support systems in India in the past have been strong with the result that for many, if not most, workers retirement needs were a non-issue. However, the once predominant extended family living arrangements are fast receding into history as over half of all households in India (56%) are now nuclear family households. This, together with the increasing urbanisation of the workforce means that more workers can be expected to accept the need for self-providing for their own retirement needs in the future. IISS 2007 shows that many workers already recognise that support from family in old age is a fragile proposition with nearly 60 percent expecting to receive little or no financial support from children in their old age;
• By reason of these and other factors financial product providers in India have not sought to market retirement savings schemes aggressively in the past in the belief that a mass market for such products was not present.
These paradigm shifts mean that the market for private pensions in India is poised to grow quickly if the correct savings products and marketing strategies are put in place. The IISS 2007 results show that if this is done the potential market for private, voluntary pensions is immediate with up to an estimated eight crore workers ready to participate in a retirement savings scheme with NPS-type features once it is offered to them.
2
Private Pension Markets in India
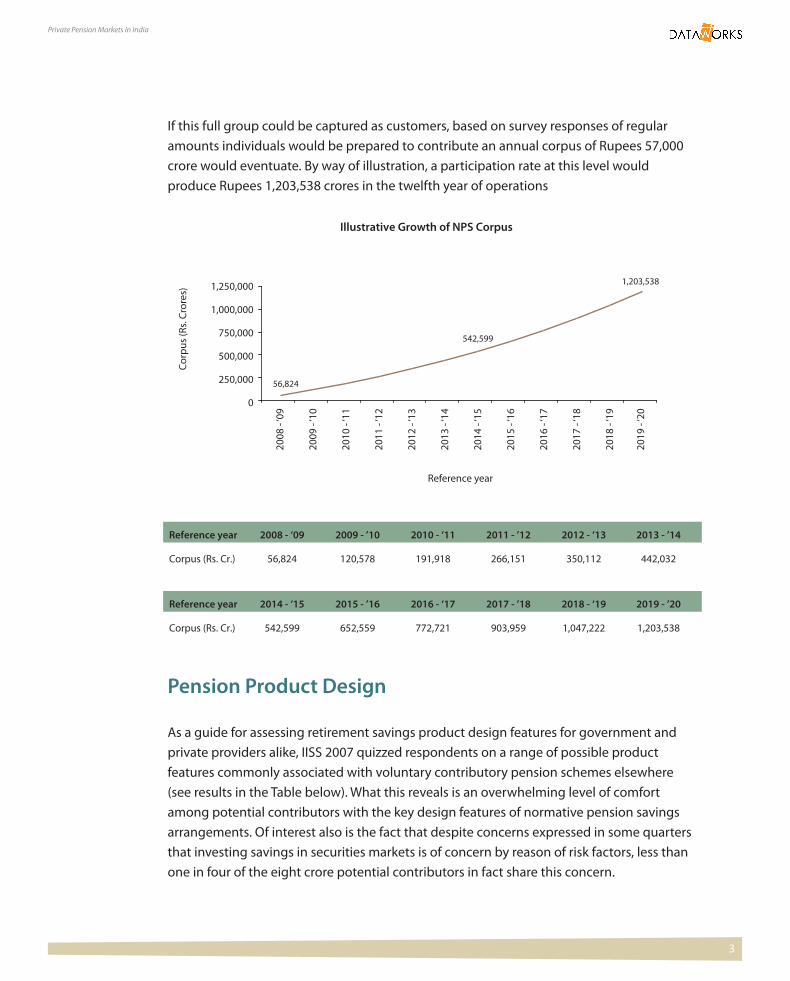
If this full group could be captured as customers, based on survey responses of regular amounts individuals would be prepared to contribute an annual corpus of Rupees 57,000 crore would eventuate. By way of illustration, a participation rate at this level would produce Rupees 1,203,538 crores in the twelfth year of operations
Pension Product Design
As a guide for assessing retirement savings product design features for government and private providers alike, IISS 2007 quizzed respondents on a range of possible product features commonly associated with voluntary contributory pension schemes elsewhere (see results in the Table below). What this reveals is an overwhelming level of comfort among potential contributors with the key design features of normative pension savings arrangements. Of interest also is the fact that despite concerns expressed in some quarters that investing savings in securities markets is of concern by reason of risk factors, less than one in four of the eight crore potential contributors in fact share this concern.
Illustrative Growth of NPS Corpus
1,250,000
1,000,000
750,000
500,000
250,000
Reference year
0
2008
- ‘0
9
2009
- ‘1
0
2010
- ‘1
1
2011
- ‘1
2
2012
- ‘1
3
2013
- ‘1
4
2014
- ‘1
5
2015
- ‘1
6
2016
- ‘1
7
2017
- ‘1
8
2018
- ‘1
9
2019
- ‘2
0
56,824
1,203,538
Corp
us (R
s. Cr
ores
)
Reference year 2008 - ‘09 2009 - ’10 2010 - ‘11 2011 - ’12 2012 - ‘13 2013 - ’14 Corpus (Rs. Cr.) 56,824 120,578 191,918 266,151 350,112 442,032
Reference year 2014 - ‘15 2015 - ’16 2016 - ‘17 2017 - ’18 2018 - ‘19 2019 - ’20 Corpus (Rs. Cr.) 542,599 652,559 772,721 903,959 1,047,222 1,203,538
542,599
3

Private Pension Markets in India
These understandings should provide policy makers with the necessary confidence in designing and launching the NPS along its intended lines for the wider workforce as well as providing guidance for commercial interests in and outside of India considering pension and superannuation product launches to capture market share of the emerging retirement savings market. Most encouraging for government and commercial interests alike is the high acceptance level of the need for a long-term savings ethic and locking in savings for the future. Of interest also is the degree of comfort with receiving a regular income stream in retirement rather than lump sum payments.
In order to assess which are the scheme features that are likely to influence acceptability of NPS among the India’s paid workforce, a step wise linear regression model was run using the 11 features as the independent variables and the level of interest in joining a regulated voluntary retirement scheme as the dependant variable. Naturally, this analysis was done for the entire respondent base, irrespective of their willingness or otherwise to join NPS. The findings assume critical importance for product manufacturers for it gives them clear insights as to what features will have to be emphasized while designing and offering for specific client segments, both in case of product architecture as well as headline propositions.
Features Accepting Not accepting No opinion Make regular savings for 15 - 20 years 95 5 -
Minimum monthly savings of Rs. 100 required 97 3 -
Savings cannot be withdrawn before age 58 76 21 3
Minimal tax bene�ts will be available 58 28 14
Contributors will decide how their savings are invested 87 10 3
Contributors will be o�ered periodic opportunities to alter 80 13 7their chosen investment preferences
Contributors may choose to invest their savings in securities 34 22 44
Savings held in an account that is the sole property of the contributor 87 12 1
Nominees to be paid savings in the event of the 93 5 2premature death of the contributor
Contributor accounts will not be impacted by change of job or address 84 14 2
Bene�ts will be paid as a regular monthly amount post-retirement 89 8 3
Acceptance Levels of Normative Pension Design Features*
* Percents have been rounded to the nearest whole percent.
In percent
4

Private Pension Markets in India
Profile of the Pension Ready Population
On the basis of IISS 2007 results, we estimate that at the present time there are some eight crore workers in the paid workforce, or approximately one in four paid workers, who are prepared to consider making regular savings for their retirement, if a voluntary regulated pension scheme is launched immediately.
What is most encouraging about the nature of this latent demand is that it is broad based, with interest spread reasonably evenly across States and across age, income and occupational cohorts. Latent demand is also overrepresented in urban areas lessening the potential logistical obstructions of rural marketing requirements.
Customer Segment Model summary (key in�uencing factors)
Aged below 30 years · A part of your savings will be paid to you as a regular monthly payment after you retire · You will be given regular opportunities to change your investment choices · The amount you want to save each month is up to you but would need to be at least Rs. 100 per month
Aged 30 – 45 years · A part of your savings will be paid to you as a regular monthly payment after you retire · You will be given regular opportunities to change your investment choices · You will keep the same account even if you change your job or place of residence
Aged above 45 years · A part of your savings will be paid to you as a regular monthly payment after you retire · You will be given regular opportunities to change your investment choices
With incomes less than 1 lakh · A part of your savings will be paid to you as a regular monthly payment after you retire · You will be given regular opportunities to change your investment choices · The amount you want to save each month is up to you but would need to be at least Rs. 100 per month
With incomes 1 - 2.5 lakh · A part of your savings will be paid to you as a regular monthly payment after you retire · You will be given regular opportunities to change your investment choices With incomes above 2.5 lakh · A part of your savings will be paid to you as a regular monthly payment after you retire · You will be able to invest in stock market shares if you want · The amount you want to save each month is up to you but would need to be at least Rs. 100 per month
Proposed Model Characteristics for Di�erent Customer Segments
Bank Account Coverage of Latent Demand
Percent in the group with bank accounts
More than 5
2 - 5
1 - 2
0.5 - 1
Less than 0.5
99
98
93
76
47
Ann
ual i
ncom
es(R
upee
s la
kh)
Retirement Intentions of the Latent Demand
Retirement is front of mind
Retirement is not front of mind
May never retire
43 million
20 million16 million
Bank Account Penetration of the Immediate DemandIn percent
In the total immediate demand group
Among those who are already making retirement savings
Among those who would be making retirement savings for
the �rst time
97
72
80
5
Private Pension Markets in India
Equally encouraging is the degree of interest among younger workers to commence retirement savings early which will impact positively on the medium-to-long-term stability of savings corpuses and associated asset management possibilities and options. Similarly, interest in retirement savings among middle and higher income groups is strong inferring that retirement savings values will be commercially attractive
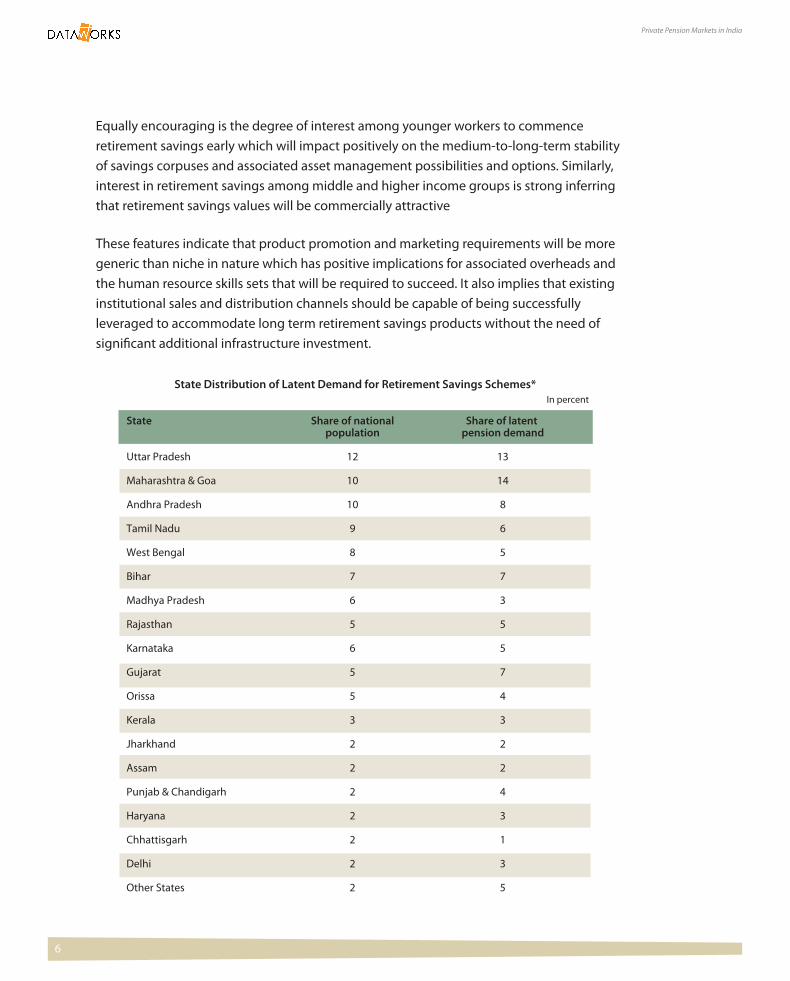
These features indicate that product promotion and marketing requirements will be more generic than niche in nature which has positive implications for associated overheads and the human resource skills sets that will be required to succeed. It also implies that existing institutional sales and distribution channels should be capable of being successfully leveraged to accommodate long term retirement savings products without the need of significant additional infrastructure investment.
State Share of national Share of latent population pension demand Uttar Pradesh 12 13
Maharashtra & Goa 10 14
Andhra Pradesh 10 8
Tamil Nadu 9 6
West Bengal 8 5
Bihar 7 7
Madhya Pradesh 6 3
Rajasthan 5 5
Karnataka 6 5
Gujarat 5 7
Orissa 5 4
Kerala 3 3
Jharkhand 2 2
Assam 2 2
Punjab & Chandigarh 2 4
Haryana 2 3
Chhattisgarh 2 1
Delhi 2 3
Other States 2 5
Totals 100 100
State Distribution of Latent Demand for Retirement Savings Schemes*
* Percents rounded to the nearest whole percent.
In percent
Location Share of national population Share of latent demand at the location at the location Rural 71 59
Metro cities 6 10
Cities/towns with populations between 1 and 10 lakhs 13 17
Smaller towns 10 14
Rural/ Urban Shares*
* Percents rounded to the nearest whole percent.
In percent
Age in years Share of national population Percent of latent demand from the age group from the age group Below or at 25 15 12
26 - 35 32 33
36 - 45 29 34
46 - 55 24 21
Age Distribution*
* Percents rounded to the nearest whole percent.
In percent
6

Private Pension Markets in India
Distribution of Latent Demand in Urban Areas Distribution of Latent Demand in Rural Areas
less than 1 million
2 - 3 million
1 - 2 million
greater than 3 million
not covered in the survey
Latent Demand as a Proportion of Total Workforce in Each State
10% - 20%
30% - 40%
20% - 30%
greater than 40%
Minimum percent latent demand for NPS within state being 11%
7

Private Pension Markets in India
State Share of national Share of latent population pension demand Uttar Pradesh 12 13
Maharashtra & Goa 10 14
Andhra Pradesh 10 8
Tamil Nadu 9 6
West Bengal 8 5
Bihar 7 7
Madhya Pradesh 6 3
Rajasthan 5 5
Karnataka 6 5
Gujarat 5 7
Orissa 5 4
Kerala 3 3
Jharkhand 2 2
Assam 2 2
Punjab & Chandigarh 2 4
Haryana 2 3
Chhattisgarh 2 1
Delhi 2 3
Other States 2 5
Totals 100 100
State Distribution of Latent Demand for Retirement Savings Schemes*
* Percents rounded to the nearest whole percent.
In percent
Location Share of national population Share of latent demand at the location at the location Rural 71 59
Metro cities 6 10
Cities/towns with populations between 1 and 10 lakhs 13 17
Smaller towns 10 14
Rural/ Urban Shares*
* Percents rounded to the nearest whole percent.
In percent
Age in years Share of national population Percent of latent demand from the age group from the age group Below or at 25 15 12
26 - 35 32 33
36 - 45 29 34
46 - 55 24 21
Age Distribution*
* Percents rounded to the nearest whole percent.
In percentAnnual Incomes Percent of national population Percent of latent demand(Rupees lakh) in the income group from the income group Less than or at 0.5 68 44
0.5 - 1 19 33
1 - 2 8 14
2 - 5 3 6
More than 5 2 3
Income Distribution*
* Percents rounded to the nearest whole percent.
In percent
Occupations Percent of Percent of national population latent demand Agricultural producers 24 26
Wage labourers 35 18
Salaried workers in private enterprise 9 14
Government salaried workers 8 13
Businessmen with employees 6 10
Shopkeepers 5 8
Self employed - non-professional 5 4
Street vendors 4 4
Self employed professionals 1 2
Others 3 2
Occupation Distribution*
* Percents rounded to the nearest whole percent.
In percent
8

Private Pension Markets in India
Underpinning a positive sales and distribution environment is the fact that the latent demand can be reached through bank channels in most cases as 68 percent of workers interested in making retirement savings already have bank accounts. For those workers with higher incomes (above one lakh) bank coverage is higher again, approaching the 100 percent mark for upper and upper middle income groups. Moreover, the average annual bank savings of individuals with bank accounts at Rupees 39,000 suggests that the financial capabilities of the group can easily support regular and meaningful pension contributions. For those without bank accounts, we estimate that a further 17 percent have postal savings accounts which provide a secondary distribution pipe to help close the bank coverage gap, although average annual per capita postal savings are lower at Rupees 15,000. Life insurance channels offer a further potential distribution pipe as 51 percent of the eight crore potential pension customers have existing life insurance plans involving an average annual premium commitment of Rupees 6,000.
Annual Incomes Percent of national population Percent of latent demand(Rupees lakh) in the income group from the income group Less than or at 0.5 68 44
0.5 - 1 19 33
1 - 2 8 14
2 - 5 3 6
More than 5 2 3
Income Distribution*
* Percents rounded to the nearest whole percent.
In percent
Occupations Percent of Percent of national population latent demand Agricultural producers 24 26
Wage labourers 35 18
Salaried workers in private enterprise 9 14
Government salaried workers 8 13
Businessmen with employees 6 10
Shopkeepers 5 8
Self employed - non-professional 5 4
Street vendors 4 4
Self employed professionals 1 2
Others 3 2
Occupation Distribution*
* Percents rounded to the nearest whole percent.
In percent
Bank Account Coverage of Latent Demand
Percent in the group with bank accounts
More than 5
2 - 5
1 - 2
0.5 - 1
Less than 0.5
99
98
93
76
47
Ann
ual i
ncom
es(R
upee
s la
kh)
Retirement Intentions of the Latent Demand
Retirement is front of mind
Retirement is not front of mind
May never retire
43 million
20 million16 million
Bank Account Penetration of the Immediate DemandIn percent
In the total immediate demand group
Among those who are already making retirement savings
Among those who would be making retirement savings for
the �rst time
97
72
80
9

Private Pension Markets in India
An issue that has overshadowed the political debate on a broad based pension system in India is what should be the optimum asset management and investment norms that are applied, and in particular how to correctly position investment of contributions in equity markets. On one side of this debate is the paternalistic view that contributions should have minimal, if any, equity exposure because of the risks involved. On the other side are
State Percent in the state with postal savings Kerala 39
Assam 27
Maharashtra & Goa 25
Punjab & Chandigarh 23
Gujarat 22
Karnataka 19
West Bengal 18
Tamil Nadu 18
Orissa 17
Rajasthan 16
Andhra Pradesh 15
Jharkhand 12
North Eastern States 11
Haryana 10
Delhi 10
Bihar 10
Northern Hilly States 10
Madhya Pradesh 10
Chattisgarh 9
Uttar Pradesh 8
Postal Savings Customers Among the Latent Demand Group *
* Percents rounded to the nearest whole percent.
Note: Over 10 million of these have both bank and postal savings.
Insurance Brand Number of insured persons Percent of insured persons (in lakhs) with the brand Life Insurance Corporation 371 96.1
Private Insurers 15 3.9
Both 11 2.8
Insurance Brand Attachments of the Latent Demand Group
* All �gures are rounded to the nearest.
Bank Number of bank customers Percent of bank customers (in lakhs) State Bank of India 165 31
Cooperative banks 77 14
Punjab National Bank 44 8
Central Bank of India 32 6
ICICI Bank 25 5
Bank of Maharashtra 25 5
Bank of Baroda 22 4
Canara Bank 19 4
Allahabad Bank 17 3
Bank of India 16 3
Dena Bank 15 3
HDFC Bank 12 2
Union Bank of India 11 2
UCO Bank 11 2
Other banks 135 21
Bank Brand Attachments of The Latent Demand Group
Multiple responses possible, numbers do not add up to total bank customers and percents do not add up to 100.
* All Figures rounded to the nearest.
10

Private Pension Markets in India
those who argue that positioning retirement savings in booming equity markets, whether directly or per medium of mutual fund investments, should be a key objective to maximise the long term value of savings and boost the eventual income replacement rates that retirement savings produce for customers.
In the following Table we show the IISS 2007 results on the risk perceptions of the latent demand group in relation to 17 different asset classes. What this reveals is that active resistance to investing in securities is relatively low compared to a number of other asset classes, including the renowned appetite of Indians for buying precious metals. The
State Percent in the state with postal savings Kerala 39
Assam 27
Maharashtra & Goa 25
Punjab & Chandigarh 23
Gujarat 22
Karnataka 19
West Bengal 18
Tamil Nadu 18
Orissa 17
Rajasthan 16
Andhra Pradesh 15
Jharkhand 12
North Eastern States 11
Haryana 10
Delhi 10
Bihar 10
Northern Hilly States 10
Madhya Pradesh 10
Chattisgarh 9
Uttar Pradesh 8
Postal Savings Customers Among the Latent Demand Group *
* Percents rounded to the nearest whole percent.
Note: Over 10 million of these have both bank and postal savings.
Insurance Brand Number of insured persons Percent of insured persons (in lakhs) with the brand Life Insurance Corporation 371 96.1
Private Insurers 15 3.9
Both 11 2.8
Insurance Brand Attachments of the Latent Demand Group
* All �gures are rounded to the nearest.
11

Private Pension Markets in India
problem is that this result in the case of equities is principally a function of the lack of familiarity of most workers with equity markets (the “no opinion group” in the Table) which tends to validate the concerns of those who argue that offering direct equity investment options to the uninformed customer may lead them unwittingly into an investment that they would not choose otherwise on the basis of their risk perceptions.
However, this appears to be less of an issue with mutual funds as the majority of those who have familiarity with mutual funds perceive there being no risk involved in mutual fund investments. This suggests that mutual fund investment opportunities if offered to contributors would, unlike direct equity investment options, achieve a high take up without necessarily impinging on the risk perceptions of the uninformed contributor.
In either case, risk would be rendered a non-issue if effective customer information arrangements that inform customers of the potential benefits and risks of securities
Financial instrument Risky Not risky No opinion Gold 31 66 3
Silver 30 67 3
Chit funds 27 31 42
Livestock 26 61 13
Non Bank Financial Companies 21 38 41
Equities 20 10 70
Self help groups 15 55 30
Micro�nance bodies 13 27 60
Commodity futures 13 11 76
Mutual funds 12 17 71
Residential housing 8 89 3
Agricultural land 8 89 3
Residential plot 7 90 3
Central government securities 4 57 39
Bank deposits 3 96 1
Life Insurance 4 91 5
Postal savings schemes 3 95 2
Risk Perceptions of Latent Demand*
* Percent are rounded to the nearest whole percent.
In percent
12

Private Pension Markets in India
investments were in place. In this scenario informed choices would be possible, leaving only those who assess the risks as acceptable as investors.
Kick Starting the Market
The groups of most immediate interest in terms of establishing a pensions customer base are those who are already actively planning their retirement needs and those who are expecting to retire but who for the moment are not making active plans in that direction. These two groups should be rather easier to mobilise than others because retirement needs are already a front of mind issue for them. Together these two groups represent some 5 percent of paid workforce, or some 16 million workers. About one third have entitlements under mandated government pension schemes leaving 11 million informal sector workers who presently are not members of a mandated retirement savings scheme.
This suggests that there are two distinct market segments that need to be targeted differently in initial sales and marketing efforts. The larger segment of over one crore workers who would be making retirement savings for the first time, and a smaller segment of about half that size who while already members of a mandated retirement savings scheme are concerned to top up their mandated benefits with additional savings.
As can be seen from the first of the following Tables, however, the rank order of States of most interest is different to the larger latent demand group. States where demand is highest in the former case are Andhra Pradesh, Bihar Madhya Pradesh, Maharashtra, Tamil Nadu, Uttar Pradesh and West Bengal, while in the latter case Gujarat, Orissa, Punjab and Rajasthan appear towards the top of the list with Bihar, Madhya Pradesh, Tamil Nadu and West Bengal and dropping down the list. Common States in both lists are Andhra Pradesh, Maharashtra and Uttar Pradesh suggesting that that the early market might most easily be established in those locations. Latent demand for top-up retirement savings for those in mandated pension schemes, over 90 percent of which is sourced with salaried government workers, is also high in these three States.
The rural constituency for the more immediate market is also slightly smaller, and there is a slight drift in favour of metro cities which is on the whole positive in terms of wider sales and distribution constraints. Similarly the age profile of this group is younger with an estimated 45 percent being under the age of 36 compared to 22 percent for the larger latent demand group. A high proportion also has existing bank affiliations with 80 percent having a bank account. However, the incomes of the group are significantly lower with 77 percent having annual incomes of less than one lakh Rupees compared to 41 percent in the case of the larger latent demand group.
13

Private Pension Markets in India
State Percent share of those who Percent share of those would be making retirement who are already making savings for the �rst time retirement savings Maharashtra & Goa 9.7 7.6
Orissa 8.6 12.1
Uttar Pradesh 8.4 19.8
Andhra Pradesh 7.5 9.6
Punjab & Chandigarh 6.9 4.9
Rajasthan 6.3 3.8
Gujarat 6.2 3.6
Northern Hilly States 5.8 1.0
Bihar 4.7 9.6
Delhi 4.5 2.2
West Bengal 4.3 2.7
Karnataka 3.9 2.8
Chattisgarh 3.7 3.2
Kerala 3.6 2.6
Haryana 3.5 3.6
Madhya Pradesh 3.4 4.8
Tamil Nadu 2.8 2.0
Assam 2.4 1.3
Jharkhand 2.0 1.9
North Eastern States 1.7 0.9
Totals 100 100
State Distribution of Immediate Demand for Retirement Savings Schemes
* Percents rounded to the nearest whole percent.
Location Percent share of those who Percent share of those would be making retirement who are already making savings for the �rst time retirement savings Rural 68 44
Metro cities 8 11
Cities/ towns with populations 15 23between 1 and 10 lakhs
Smaller towns 11 21
Rural/Urban Shares*
* Percents rounded to the nearest whole percent.
14

Private Pension Markets in India
Age in years Percent share of those who Percent share of those would be making retirement who are already making savings for the �rst time retirement savings Below or at 25 8 2
26-35 32 20
36-45 33 40
46 - 55 27 38
Age Distribution*
* Percents rounded to the nearest whole percent.
Annual incomes Percent share of those who Percent share of those(Rupees lakh) would be making retirement who are already making savings for the �rst time retirement savings Less than or at 0.5 47 4
0.5-1 31 37
1 - 2 11 43
2 - 5 6 11
More than 5 5 5
Income Distribution*
* Percents rounded to the nearest whole percent.
Occupation Percent share of those who would be making retirement savings for the �rst time Agricultural producers 34
Wage labourers 16
Salaried workers in private enterprise 13
Government contractual workers 3
Businessmen with employees 12
Shopkeepers 10
Self employed - non-professional 5
Street vendors 3
Self employed professionals 3
Others 1
Occupation Distribution*
* Percents rounded to the nearest whole percent.
15

Private Pension Markets in India
Effective promotional strategies will be key to growing the voluntary retirement savings market and commercial and government providers alike who are prepared to invest in building public awareness of the dangers of the need to put aside sufficient savings for retirement can position appropriate products with good effect. To date efforts of this
Banks Percent share of those who Percent share of those Percent share of the would be making retirement who are already making total group savings for the �rst time retirement savings State Bank of India 31.9 48.4 38.3
Cooperative banks 13.6 10.9 12.6
Punjab National Bank 9.5 8.9 9.3
Central Bank of India 13.5 1.8 9
ICICI Bank Ltd. 5.3 4.9 5.2
UCO Bank 5.2 2.9 4.3
Bank of India 3.5 4 3.7
Allahabad Bank 3.6 3.2 3.4
Canara Bank 2.8 3.2 3
Union Bank of India 3.1 2.3 2.8
Bank of Baroda 2.1 3.8 2.8
HDFC Bank Ltd. 2.3 2.1 2.2
Andhra Bank 2.4 1.8 2.2
Other banks 21.4 30.9 25.1
Bank Brand Attachments of the Bank Account Holders in the Immediate Market
Multiple responses possible, percents do not add to 100.
Bank Account Coverage of Latent Demand
Percent in the group with bank accounts
More than 5
2 - 5
1 - 2
0.5 - 1
Less than 0.5
99
98
93
76
47
Ann
ual i
ncom
es(R
upee
s la
kh)
Retirement Intentions of the Latent Demand
Retirement is front of mind
Retirement is not front of mind
May never retire
43 million
20 million16 million
Bank Account Penetration of the Immediate DemandIn percent
In the total immediate demand group
Among those who are already making retirement savings
Among those who would be making retirement savings for
the �rst time
97
72
80
16

Private Pension Markets in India
kind, undertaken primarily by life insurance companies, have centered more on emotive messages concerned with an independent, and comfortable retirement free of financial worries. With the benefit of IISS 2007 findings a more evidence led approach is possible that focuses on the paradigm shifts in underlying settings that are as yet not being registered sufficiently in the public consciousness. The two key themes in this regard are:
1. Expectations of support from family and government in old age; and2. Longevity risks.
Notwithstanding that the nuclear family is increasingly the norm in India, at the present time many aged parents continue to reside in joint and extended family situations. It is important to appreciate however that the reason that the growth in the number of nuclear families has not impacted the present aged population significantly because of traditionally large family sizes and the fact that only one offspring needs to accept responsibility for the housing needs of aged parents for them to be accommodated. As family sizes, decline in the future (as they surely will) present opportunities can be expected to reduce accordingly indicating a greater need for younger workers to save now towards a future when in their old age they will not be supported by children in this way.
IISS 2007 data show that expectations of support from children in old age are remarkably linear with there being little difference in expectations irrespective of age, income, occupation, family type, family size or education (see Tables below). It can be safely assumed therefore that overriding this question is a well entrenched cultural norm that is dismissive of the fact that significant social change in India is already in train and that the pace of that change is, if anything, likely to accelerate. The issue is what happens a generation out from this point in time should this assumption prove to be wrong for significant numbers of people.
Having said that it is also clear from the following Tables that there is already a sizable audience that will listen because they are concerned that traditional familial support practices in their own case is at best a fragile proposition. In fact, nearly half (47 percent) of those workers who indicated in IISS that they would be prepared to consider making voluntary retirement savings fit into this category. However, most of this large group is as yet not self-providing for their retirement needs. Educating this audience to connect cause and effect and accept the need to save for their retirement will require some skill and sensitivity, but crafting the correct messages that can be effective for this purpose should be possible by conducting further market research to yield the necessary understandings for doing so.
17

Private Pension Markets in India
Percieved role of Latent demand Less than or at 0.5 - 1 lakh 1 - 2 lakh More thanchildren regarding group 0.5 lakh 2 lakhold age security Percent in the income group
will ful�ll entire requirements 28.5 29.4 28.0 27.1 28.4
will provide part of requirements 14.5 14.7 14.4 15.4 12.8
will provide as much as they can a�ord 36.2 34.9 37.1 38.3 36.7
unlikely to provide signi�cant help 7.4 9.4 6.9 4.2 4.2
may not provide help at all 4.4 5.2 4.8 2.7 1.8
wouldnot like to accept help from them 3.9 2.7 3.8 6.9 5.6
wouldnot need their help 5.0 3.8 5.1 5.4 10.5
Total 100 100 100 100 100
Perceived Role of Children Regarding Old Age Security - Income Group-wise Comparision
Percieved role of Latent demand Below or at 26 - 35 years 36 - 45 years Abovechildren regarding group 25 years 45 yearsold age security Percent in the Age group
will ful�ll entire requirements 28.5 25.6 26.0 29.8 31.9
will provide part of requirements 14.5 13.5 16.1 14.1 13.1
will provide as much as they can a�ord 36.2 29.9 37.0 37.6 36.3
unlikely to provide signi�cant help 7.4 9.4 7.4 7.1 6.6
may not provide help at all 4.4 6.1 4.8 3.8 3.9
wouldnot like to accept help from them 3.9 6.9 4.1 2.9 3.6
wouldnot need their help 5.0 8.5 4.5 4.7 4.6
Total 100 100 100 100 100
Perceived Role of Children Regarding Old Age Security - Age Group-wise Comparision
Percieved role of Salaried Self employed Businessmen/ Self employed Agricultural Wage Otherschildren regarding workers professional shopkeepers non-professional producers labourers old age security Percent in the occupation group
will ful�ll entire requirements 27 24 30 32 31 25 30
will provide part of requirements 16 13 14 16 14 14 16
will provide as much as they can a�ord 34 35 37 33 39 37 34
unlikely to provide signi�cant help 5 9 6 9 8 11 7
may not provide help at all 6 2 4 4 3 5 5
wouldnot like to accept help from them 6 7 4 3 2 4 2
wouldnot need their help 7 9 6 3 3 4 5
Perceived Role of Children Regarding Old Age Security - Occupational Comparision
18
Percieved role of Latent demand Less than or at 0.5 - 1 lakh 1 - 2 lakh More thanchildren regarding group 0.5 lakh 2 lakhold age security Percent in the income group
will ful�ll entire requirements 28.5 29.4 28.0 27.1 28.4
will provide part of requirements 14.5 14.7 14.4 15.4 12.8
will provide as much as they can a�ord 36.2 34.9 37.1 38.3 36.7
unlikely to provide signi�cant help 7.4 9.4 6.9 4.2 4.2
may not provide help at all 4.4 5.2 4.8 2.7 1.8
wouldnot like to accept help from them 3.9 2.7 3.8 6.9 5.6
wouldnot need their help 5.0 3.8 5.1 5.4 10.5
Total 100 100 100 100 100
Perceived Role of Children Regarding Old Age Security - Income Group-wise Comparision
Percieved role of Latent demand Below or at 26 - 35 years 36 - 45 years Abovechildren regarding group 25 years 45 yearsold age security Percent in the Age group
will ful�ll entire requirements 28.5 25.6 26.0 29.8 31.9
will provide part of requirements 14.5 13.5 16.1 14.1 13.1
will provide as much as they can a�ord 36.2 29.9 37.0 37.6 36.3
unlikely to provide signi�cant help 7.4 9.4 7.4 7.1 6.6
may not provide help at all 4.4 6.1 4.8 3.8 3.9
wouldnot like to accept help from them 3.9 6.9 4.1 2.9 3.6
wouldnot need their help 5.0 8.5 4.5 4.7 4.6
Total 100 100 100 100 100
Perceived Role of Children Regarding Old Age Security - Age Group-wise Comparision
Percieved role of Salaried Self employed Businessmen/ Self employed Agricultural Wage Otherschildren regarding workers professional shopkeepers non-professional producers labourers old age security Percent in the occupation group
will ful�ll entire requirements 27 24 30 32 31 25 30
will provide part of requirements 16 13 14 16 14 14 16
will provide as much as they can a�ord 34 35 37 33 39 37 34
unlikely to provide signi�cant help 5 9 6 9 8 11 7
may not provide help at all 6 2 4 4 3 5 5
wouldnot like to accept help from them 6 7 4 3 2 4 2
wouldnot need their help 7 9 6 3 3 4 5
Perceived Role of Children Regarding Old Age Security - Occupational Comparision

Private Pension Markets in India
Perc
ieve
d ro
le o
f Ill
itera
te
Lite
rate
Sc
hool
ing
Com
plet
ed
Com
plet
ed
Ente
red
but
Gra
duat
e in
G
radu
ate
inch
ildre
n re
gard
ing
with
no
less
than
pr
imar
y bu
t se
cond
ary
but
not c
ompl
eted
non
-tec
hnic
al
tech
nica
lol
d ag
e se
curi
ty
fo
rmal
sch
oolin
g pr
imar
y no
t sec
onda
ry
not e
nter
ed
grad
uatio
n st
ream
st
ream
gr
adua
tion
Pe
rcen
t of p
erso
ns w
ith th
e ed
ucat
ion
qual
i�ca
tion
will
ful�
ll en
tire
requ
irem
ents
31
36
27
26
30
27
28
28
will
pro
vide
par
t of r
equi
rem
ents
14
12
12
14
15
14
16
17
will
pro
vide
as
muc
h as
they
can
a�o
rd
32
35
45
38
36
40
33
32
unlik
ely
to p
rovi
de s
igni
�can
t hel
p 12
11
7
9 6
4 6
5
may
not
pro
vide
hel
p at
all
5 3
4 5
4 3
6 2
wou
ldno
t lik
e to
acc
ept h
elp
from
them
3
3 3
2 4
5 5
8
wou
ldno
t nee
d th
eir h
elp
3 1
3 5
6 5
7 8
Tota
l 10
0 10
0 10
0 10
0 10
0 10
0 10
0 10
0
Perc
eive
d Ro
le o
f Chi
ldre
n Re
gard
ing
Old
Age
Sec
urity
- Ed
ucat
ion
Att
ainm
ent-
wis
e Co
mpa
risi
on
Perc
ieve
d ro
le o
f Th
ose
with
Th
ose
with
Th
ose
with
Th
ose
with
Th
ose
with
Th
ose
with
Th
ose
with
child
ren
rega
rdin
g
no
1 2
3 4
5 m
ore
than
5
old
age
secu
rity
de
pend
ents
de
pend
ent
depe
nden
ts
depe
nden
ts
depe
nden
ts
depe
nden
ts
depe
nden
ts
Perc
ent i
n th
e gr
oup
will
ful�
ll en
tire
requ
irem
ents
29
29
29
26
27
32
30
will
pro
vide
par
t of r
equi
rem
ents
13
16
14
15
15
14
14
will
pro
vide
as
muc
h as
they
can
a�o
rd
29
29
35
37
40
37
36
unlik
ely
to p
rovi
de s
igni
�can
t hel
p 9
9 7
6 6
7 10
may
not
pro
vide
hel
p at
all
5 5
5 5
4 4
3
wou
ldno
t lik
e to
acc
ept h
elp
from
them
4
4 5
5 4
2 2
wou
ldno
t nee
d th
eir h
elp
11
8 5
5 4
4 4
Tota
l 10
0 10
0 10
0 10
0 10
0 10
0 10
0
Perc
eive
d Ro
le o
f Chi
ldre
n Re
gard
ing
Old
Age
Sec
urity
- D
epen
dent
-wis
e Co
mpa
risi
on
Perc
ieve
d ro
le o
f N
ucle
ar
Join
t or e
xten
ded
All
hous
ehol
ds
child
ren
rega
rdin
g ho
useh
old
hous
ehol
dol
d ag
e se
curi
ty
Pe
rcen
t in
the
occu
patio
n gr
oup
will
ful�
ll en
tire
requ
irem
ents
28
.1
28.9
28
.5
will
pro
vide
par
t of r
equi
rem
ents
14
.2
14.9
14
.5
will
pro
vide
as
muc
h as
they
can
a�o
rd
37.6
34
.7
36.2
unlik
ely
to p
rovi
de s
igni
�can
t hel
p 7.
1 7.
7 7.
4
may
not
pro
vide
hel
p at
all
4.1
4.8
4.4
wou
ldno
t lik
e to
acc
ept h
elp
from
them
4.
0 3.
7 3.
9
wou
ldno
t nee
d th
eir h
elp
4.8
5.4
5.0
Tota
l 10
0 10
0 10
0
Perc
eive
d Ro
le o
f Chi
ldre
n Re
gard
ing
Old
Age
Sec
urity
- H
ouse
hold
Typ
e-w
ise
Com
pari
sion
19

Private Pension Markets in India
Among those who do not expect that support from children in old age will be forthcoming are those who believe that governments will provide them with full or partial support (see following Table).
National Census data show clearly that longevity in India is extending and workers now in their thirties can expect to live on average twenty years longer than their grandparents. National survey data from 2004 showed that for the majority of the parents of older survey respondents where their parents were deceased at that time the parents had died in their fifties. For younger respondents whose parents were at that time still living however longevity was appreciably higher with most of the parents concerned being in their sixties. In other words, longevity in these three overlapping generations had extended dramatically, and with improvements in living standards, nutrition and medical services this trend can be expected to continue into the future. The generation presently approaching sixty therefore is the first generation for whom life after sixty is a relevant issue for most. This we believe largely explains why retirement savings in India is not a
20
Percieved role of Nuclear Joint or extended All households children regarding household householdold age security Percent in the occupation group
will ful�ll entire requirements 28.1 28.9 28.5
will provide part of requirements 14.2 14.9 14.5
will provide as much as they can a�ord 37.6 34.7 36.2
unlikely to provide signi�cant help 7.1 7.7 7.4
may not provide help at all 4.1 4.8 4.4
wouldnot like to accept help from them 4.0 3.7 3.9
wouldnot need their help 4.8 5.4 5.0
Total 100 100 100
Perceived Role of Children Regarding Old Age Security - Household Type-wise Comparision

Private Pension Markets in India
front of mind issue for most people because their own and their parent’s life experiences have not indicated any need for it to be so.
This fact is evident from IISS 2007 data also that show that longevity expectations are still calibrated to the experiences of earlier generations both in terms of expected age of retirement and longevity post-retirement. In the case of the former, over two thirds expect to retire before age 60 and in the latter case only one in twelve expects to survive beyond the age of 68. Both assumptions obviously will prove false for most and bringing people to terms with the actual situation should see a sea change in retirement savings behaviours.
In tandem with bringing longevity risks to attention is a need to educate contributors about desirable savings patterns. On a positive note, the realisation that even a small amount of regular savings over a long period of working life will add to a substantial sum. For example, saving even Rupees 100 per month for thirty five years will yield a corpus at age sixty of Rupees Rs.1,82,641. Similarly, any delay in starting savings has a significant impact on end benefits. In the example quoted for example a single year’s delay in beginning savings would reduce end benefits not by the Rupees 1,200 contributions that were not made, but by Rupees 14,688.
21

Private Pension Markets in India
As the following Tables show, for the smaller immediate demand group the story is similar with only 27 percent being confident that their children will fully support them in old age, with two thirds expecting little or no support from government in old age and less than 15 percent expecting to survive into their seventies. In other words, this audience is already well primed to be attracted to retirement savings products and with some more aggressive marketing of such products the prospects are very bright for quickly establishing mass in the customer base.
Expectation of Latent demand Less than or at 0.5 - 1 lakh 1 - 2 lakh More than Government support group 0.5 lakh 2 lakhin old age Percent in the income group
Yes 29 27 27 39 31
Partly 21 19 22 22 25
No 50 54 51 39 44
Total 100 100 100 100 100
Expectation of Government Support in Old Age - Income-wise Comparision
Age at which Latent demand Less than or at 0.5 - 1 lakh 1 - 2 lakh More than expect to retire group 0.5 lakh 2 lakh Percent in the income group
51-60 years 68 66 64 76 66
After age 60 27 27 30 20 29
Other ages 5 7 6 4 5
Total 100 100 100 100 100
Expected Age of Retirement for Those Planning to Retire
Perceived longevity Latent demand Less than or at 0.5 - 1 lakh 1 - 2 lakh More than from 60 years of age group 0.5 lakh 2 lakh Percent in the income group
Less than 4 years 18 15 20 20 16
4 to 8 years 67 62 72 63 70
More than 8 years 15 23 8 17 14
Total 100 100 100 100 100
Expected Longevity of Those Planning to Retire
Expectation of Immediate demand Less than or at 0.5 - 1 lakh 1 - 2 lakh More than Government support group 0.5 lakh 2 lakhin old age Percent in the income group
Yes 35 25 35 46 42
Partly 22 25 21 22 22
No 43 50 44 32 36
Total 100 100 100 100 100
Expectation of Government Support in Old Age
Perceived longevity Immediate demand Less than or at 0.5 - 1 lakh 1 - 2 lakh More than from 60 years of age group 0.5 lakh 2 lakh Percent in the income group
Less than 4 years 18 16 20 20 16
4 to 8 years 67 62 72 63 70
More than 8 years 15 22 8 17 14
Total 100 100 100 100 100
Expected Longevity of Those Planning to Retire
Percieved role of Immediate demand Less than or at 0.5 - 1 lakh 1 - 2 lakh More thanchildren regarding group 0.5 lakh 2 lakhold age security Percent in the income group
will ful�ll entire requirements 27 24 25 30 35
will provide part of requirements 18 21 17 17 10
will provide as much as they can a�ord 36 38 43 31 29
unlikely to provide signi�cant help 5 7 5 3 5
may not provide help at all 5 7 4 4 2
would not like to accept help from them 4 1 2 8 9
would not need their help 5 2 4 8 10
Total 100 100 100 100 100
Perceived Role of Children Regarding Old Age Security
22

Private Pension Markets in India
Expectation of Latent demand Less than or at 0.5 - 1 lakh 1 - 2 lakh More than Government support group 0.5 lakh 2 lakhin old age Percent in the income group
Yes 29 27 27 39 31
Partly 21 19 22 22 25
No 50 54 51 39 44
Total 100 100 100 100 100
Expectation of Government Support in Old Age - Income-wise Comparision
Age at which Latent demand Less than or at 0.5 - 1 lakh 1 - 2 lakh More than expect to retire group 0.5 lakh 2 lakh Percent in the income group
51-60 years 68 66 64 76 66
After age 60 27 27 30 20 29
Other ages 5 7 6 4 5
Total 100 100 100 100 100
Expected Age of Retirement for Those Planning to Retire
Perceived longevity Latent demand Less than or at 0.5 - 1 lakh 1 - 2 lakh More than from 60 years of age group 0.5 lakh 2 lakh Percent in the income group
Less than 4 years 18 15 20 20 16
4 to 8 years 67 62 72 63 70
More than 8 years 15 23 8 17 14
Total 100 100 100 100 100
Expected Longevity of Those Planning to Retire
Expectation of Immediate demand Less than or at 0.5 - 1 lakh 1 - 2 lakh More than Government support group 0.5 lakh 2 lakhin old age Percent in the income group
Yes 35 25 35 46 42
Partly 22 25 21 22 22
No 43 50 44 32 36
Total 100 100 100 100 100
Expectation of Government Support in Old Age
Perceived longevity Immediate demand Less than or at 0.5 - 1 lakh 1 - 2 lakh More than from 60 years of age group 0.5 lakh 2 lakh Percent in the income group
Less than 4 years 18 16 20 20 16
4 to 8 years 67 62 72 63 70
More than 8 years 15 22 8 17 14
Total 100 100 100 100 100
Expected Longevity of Those Planning to Retire
Percieved role of Immediate demand Less than or at 0.5 - 1 lakh 1 - 2 lakh More thanchildren regarding group 0.5 lakh 2 lakhold age security Percent in the income group
will ful�ll entire requirements 27 24 25 30 35
will provide part of requirements 18 21 17 17 10
will provide as much as they can a�ord 36 38 43 31 29
unlikely to provide signi�cant help 5 7 5 3 5
may not provide help at all 5 7 4 4 2
would not like to accept help from them 4 1 2 8 9
would not need their help 5 2 4 8 10
Total 100 100 100 100 100
Perceived Role of Children Regarding Old Age Security
Marketing Strategies
The development of a pension system for the wider Indian workforce is inevitable, if for no other reason than pension systems are a standard feature of developed economies and India in certainly headed in that direction. In the more immediate term, as we have demonstrated in this Report, a large number of workers are concerned that their old age security is not assured by traditional family support norms and this together with extending longevity provides potent incentives for self providing for old age. For the moment however these concerns appear not to be front of mind for many workers because the experience of parents and grandparents has been different. Developing the information tools to bring these issues to attention are required. If that can be achieved, a mass market of considerable size can be expected to grow quickly as the financial capabilities of Indian workers to support long term savings continues to improve.
Notwithstanding, there appears to be a market of attractive size in prospect in the short term, with a latent market size at the present time of up to eight crore workers. As this market is dichotomous, consisting of first time retirement savers with little or no present savings for retirement and workers who are members of mandate government pension schemes looking to top up their mandated pension entitlements to higher levels, different marketing strategies for these two groups will be required.
The issue for commercial interests therefore is not whether but when to make the necessary business investments that will be required to gain market share of this emerging market. To date, making an informed assessment in this regard has been problematic because of a lack of empirical evidence and other market intelligence, and uncertainties in the political process concerning the full mobilisation of the NPS.
23

Private Pension Markets in India
For commercial interests pondering this issue there are three possible scenarios of interest.
The first is to attempt to gain a position, as a potential NPS partner with the PFRDA that can be converted to market position once the prevailing political malaise is resolved. The upside of this approach is averting potential losses involved with premature business investments. The downside is the uncertainties involved with the political process that may for reasons unrelated to market capabilities choose partners for extraneous reasons.
The second is a wait and see policy by keeping a weather eye on emerging trends but not committing as a player until the signs of the market mobilising become evident. The upside of this approach again is averting potential losses involved with premature business investments. The downside is that first mover advantage is lost and the opportunity losses occasioned by the time lag between deciding to move and actually entering the provider market.
The third is to seize the moment by mobilising and marketing products that fit the latent demand profile presented in this Report.
For those willing to consider the third scenario, the business at least three alternative business models are possible:
1. Institutional Approach: For larger institutions that already have as customers a significant share of latent demand, retirement savings products could be promoted directly to customers either as individual or group savings plans. Larger banks and life insurance companies are best positioned to consider this model.
2. Target Market Approach: Because of the sheer size of the Indian workforce and the mass of latent demand for retirement savings products, it is not necessary to attempt to, or to succeed at, marketing products at the pan-India level to capture significant business volumes. Rather, by targeting specific locations where latent demand is higher attractive sales volumes should be possible. On the basis of IISS 2007 results Andhra Pradesh, Maharashtra and Uttar Pradesh appeal as the three States where a targeted approach should be well placed to succeed at the present time.
3. Holistic Approach: Under this approach products would be marketed in an open ended campaign aimed at interested individuals irrespective of location or their existing institutional attachments. Under this approach interested institutions could consider partnering with others as required to bring the full suite product, marketing, sales and distribution and customer servicing requirements into place. For larger institutions this approach could be attempted in combination with an institutional approach also.
24

Private Pension Markets in India
Under all three approaches the key would be strategic investment in market research to craft an effective promotional campaign to ensure resonance with the actual concerns and preferences of the target audience.
The Wider Residual Market
In addition to the 79 million individual earners who together constitute the latent demand for voluntary pensions in India, there is a wider constituency who could and should be communicated with and be convinced to join the scheme in the long run for their own old age financial security.
For the purpose of this analysis, this wider constituency is being defined as
a) Those who liked the NPS features and were interested in the scheme but not willing to join immediately or
b) Who could not put forward an opinion regarding their interest in joining a voluntary pension arrangement
c) Who do have annual incomes of above Rs.25,000 (and therefore can execute a SIP of atleast Rs.100 p.m. if they contribute at least 5% of their income to NPS)
d) Who already have some financial savings
e) Who are aged between 18 and 55 years
f ) Who are not currently covered by any mandated social security scheme, i.e. part of the informal sector workforce
Based on the above criteria, the number of earners who constitute the wider constituency of potential NPS entrants works out to be 40.9 million. The characteristics of this population have been highlighted below:
Customer profile
• 49% of the group has incomes of less than Rs.50,000 per annum. 82% have incomes less than 1 lakh
• 65% of the group located in rural India and 23% in larger cities and towns, including metros.
• 43% of the group aged below 35 years
• 29% are engaged in primary sector activities; 20% are self employed running their own businesses;
25

Private Pension Markets in India
• 13% are salaried workers in the unorganised sector
Information, education, communication
What sets apart this group of earners from those who constitute the latent demand for NPS despite being very similar in their socio-economic profile is that while the latter has already gotten convinced to join NPS, the former has yet to do so the moment it is launched.
Savings instruments Percent in the group Percent of total investment with investment in the by the group into the savings instrument savings instrument Bank savings 78 53
Life insurance 53 18
Mutual funds /equity investments 3 9
Postal savings 20 8
SHGs /chit funds /NBFCs 16 2
Gold 10 10
Savings Attachments of The Wider Residual Market
* Percents rounded to the nearest whole percent.
Wider Residual Market as a Proportion of Total Workforce in the State
< 10%
15% - 20%
10% - 15%
greater than 20%
26

Private Pension Markets in India
We believe that a major reason behind their current lack of conviction as regards the merits of joining up is inherent in their current level of financial literacy, especially with regard to long term savings and time value of money.
For instance,
a) 46% of the respondents are not at all concerned about their financial capabilities to take care of their needs when they grow old
b) 86% believe government guarantees full deposits in a nationalized bank
c) 80% were happy to accept lower returns to their investments as long as their money was in a safe institution
d) Only 14.6% believe that capital market investments will yield better returns in the long run than bank deposits
e) Less than 50% has any comprehension of the effect of inflation on low yielding deposits
f ) Only 15% are either actively preparing for retired life or have given this a thought
g) When asked what would be the ideal time to start retirement savings, almost all the earners who expected to retire one day mentioned an age several years away from their present age
To offset this attitudinal predisposition towards savings, it is imperative that a concerted effort be undertaken, both by the regulator and the fund managers, to launch a mass financial literacy campaign which seeks to educate the population of the importance of long term savings, the cost of every year delay and finally, the power of compounding.
27

Private Pension Markets in India
28
This page has been deliberately kept blank

Private Pension Markets in India
APPENDIX A
NPS Corpus Projections
The estimates are based on three income groups:
• Those earning less than 1 lakh per annum; • Those earning between 1 lakh and 2.5 lakhs per annum; and• Those earning more than 2.5 lakhs per annum
Differential contribution rates have been assumed for each group based on their actual savings rate, as follows:
The basis of the assumed rate for each income group stems from the fact that at the low income levels, earners would probably seek to realign their current savings into a pension fund rather than putting in fresh investments, while at the upper end, their will be realignment as well as supplementary savings.
On the basis of these contribution rates, the expected aggregate contribution from each income band assuming everyone joins in year one (say, 2008-09) as they have declared in the survey is as follows:
Annual Incomes Actual Savings Rate Assumed Contribution Rate Less than 1 lakh 13.4% of income 5% of income
1 - 2.5 lakh 21.1% of income 6.25% of income
> 2.5 lakh 23.0% of income 7.5% of income
Annual Incomes Contribution projection Less than 1 lakh Rs. 17,152 crores
1 - 2.5 lakh Rs. 11,467 crores
> 2.5 lakh Rs. 28,205 crores
Total Rs. 56,824 crores
29

Private Pension Markets in India
An attempt has been made to project the corpus for the coming decade. The assumptions used to arrive at annual figures are as follows:
1. Exit age is fixed at 58 years2. The number of contributors in any given year has been calculated after taking into consideration (i) The number of people who are likely to exit the system after reaching the age of 59 years (ii) The average annual growth in the labour force (2.3%) and the expected increase in NPS contributors within this increased population base3. Contribution capacity of new entrants (at any age) is calculated on the basis of the sectors in which they have been absorbed 4. Contribution rate increased by 2% per annum (8% wage growth minus 6% inflation) and RoR to investment is taken at 8% compounded annually5. From year 4 onwards, contributors who joined at age 55 will exit the system with their contributions and accumulated returns and simply go and buy annuity
Illustrative Growth of NPS Corpus
1,250,000
1,000,000
750,000
500,000
250,000
Reference year
0
2008
- ‘0
9
2009
- ‘1
0
2010
- ‘1
1
2011
- ‘1
2
2012
- ‘1
3
2013
- ‘1
4
2014
- ‘1
5
2015
- ‘1
6
2016
- ‘1
7
2017
- ‘1
8
2018
- ‘1
9
2019
- ‘2
0
56,824
1,203,538
Corp
us (R
s. Cr
ores
)
Reference year 2008 - ‘09 2009 - ’10 2010 - ‘11 2011 - ’12 2012 - ‘13 2013 - ’14 Corpus (Rs. Cr.) 56,824 120,578 191,918 266,151 350,112 442,032
Reference year 2014 - ‘15 2015 - ’16 2016 - ‘17 2017 - ’18 2018 - ‘19 2019 - ’20 Corpus (Rs. Cr.) 542,599 652,559 772,721 903,959 1,047,222 1,203,538
542,599
30

Private Pension Markets in India
APPENDIX B
Synopsis of Existing Retirement Savings Schemes in India
Mandated Schemes
Central Civil Services Pension: Defined benefit scheme for those employed prior to 1 January 2004, and defined contribution scheme for those employed thereafter .
General Provident Fund: Voluntary defined contribution scheme open to permanent Central Government employees recruited prior to 1 January 2004, with an administered rate of return paid by Government.
Contributory Provident Fund: Defined contribution scheme open to permanent government employees. Employees of departments, offices & organisations where CPF rules apply with an administered rate of return paid by Government
Employees Provident Fund: Defined contribution scheme for employees in firms of 20 or more employees managed by the Employees Provident Fund Organisation (EPFO).
Employees Pension Scheme: Defined benefit scheme for EPF eligible employees with fixed contribution and pension rates.
Public Sector Bank Pensions: contributory defined benefit scheme for certain bank employees.
Seamen’s Provident Fund: Defined contribution scheme for Indian merchant navy seamen.
Coal Miners Pension and Provident Fund: Defined contribution scheme for employees of coal mines.
Voluntary Schemes
Employer Trust Funds: Defined benefit or defined contribution schemes operating as either Provident Funds or Superannuation Funds.
Group Superannuation Schemes: Defined contribution plans offered by life insurance firms.
31

Private Pension Markets in India
Public Provident Fund: Government sponsored defined contribution scheme offered to individual investors without restrictions.
Unit Linked Pension Plans: Defined contribution schemes offered to individuals by life insurance firms.
Mutual Fund Pension Plans: Defined contribution schemes offered to individuals by asset management companies.
32

Private Pension Markets in India
Annexure Tables
33

Private Pension Markets in India
Stat
es
Rura
l are
as
Met
ro c
ities
La
rger
citi
es &
tow
ns
Smal
ler t
owns
To
tal U
rban
To
tal
Nor
ther
n H
illy
Stat
es
992
,583
3
50,8
77
350
,877
1
,343
,460
Punj
ab &
Cha
ndig
arh
1,7
19,1
14
1
,032
,028
6
08,2
38
1,6
40,2
66
3,3
59,3
80
Har
yana
1
,686
,026
245
,256
1
72,1
32
417
,388
2
,103
,414
Del
hi
142
,196
2
,406
,179
2
,406
,179
2
,548
,375
Raja
stha
n 2
,502
,928
870
,972
4
39,4
21
1,3
10,3
93
3,8
13,3
21
Utt
ar P
rade
sh
7,3
72,8
84
1
,889
,151
9
22,9
37
2,8
12,0
88
10,
184,
972
Biha
r 5
,029
,686
471
,851
2
70,9
86
742
,837
5
,772
,523
Nor
th E
aste
rn S
tate
s 8
89,8
91
180
,802
1
80,8
02
1,0
70,6
93
Ass
am
940
,887
198
,019
2
14,8
59
412
,878
1
,353
,765
Wes
t Ben
gal
1,6
72,2
48
471
,701
1
,091
,798
6
21,8
07
2,1
85,3
06
3,8
57,5
54
Jhar
khan
d 9
50,7
72
3
55,8
23
252
,097
6
07,9
20
1,5
58,6
92
Oris
sa
2,5
06,6
01
3
13,5
26
229
,978
5
43,5
04
3,0
50,1
05
Chat
tisga
rh
585
,443
103
,938
4
6,37
4
150
,312
7
35,7
55
Mad
hya
Prad
esh
1,2
07,4
14
6
46,9
86
272
,892
9
19,8
78
2,1
27,2
92
Guj
arat
2
,981
,299
8
04,2
50
1,0
79,0
37
843
,621
2
,726
,908
5
,708
,207
Mah
aras
htra
& G
oa
5,4
48,6
76
2,9
09,3
97
2,1
07,0
41
1,4
17,0
86
6,4
33,5
24
11,
882,
200
And
hra
Prad
esh
4,5
83,8
32
362
,076
8
58,9
43
992
,556
2
,213
,575
6
,797
,407
Karn
atak
a 2
,475
,390
2
36,3
49
814
,987
7
37,3
18
1,7
88,6
54
4,2
64,0
44
Kera
la
1,9
11,0
63
2
22,6
41
525
,688
7
48,3
29
2,6
59,3
92
Tam
il N
adu
1,3
60,6
33
750
,418
7
96,7
45
1,8
12,5
39
3,3
59,7
02
4,7
20,3
35
All
Indi
a 4
6,95
9,56
6
7,9
40,3
70
13,
098,
742
1
0,91
2,20
8
31,
951,
320
7
8,91
0,88
6
Dis
trib
utio
n of
Lat
ent D
eman
d G
roup
Acr
oss
Geo
grap
hic
Sub-
stru
ctur
e in
Di�
eren
t Sta
tes
Stat
es
Life
Insu
ranc
e M
utua
l fun
ds
Dir
ect e
quiti
es
Nor
ther
n H
illy
Stat
es
97.4
9 10
.19
11.8
1
Punj
ab &
Cha
ndig
arh
98.4
2 29
.15
43.2
5
Har
yana
96
.41
8.04
14
.41
Del
hi
98.1
5 60
.61
67.9
0
Raja
stha
n 97
.96
13.0
6 22
.69
Utt
ar P
rade
sh
96.4
6 8.
20
8.88
Biha
r 92
.54
6.26
7.
68
Nor
th E
ast
76.7
1 18
.75
9.80
Ass
am
98.4
7 17
.69
36.1
7
Wes
t Ben
gal
90.9
8 25
.41
32.0
4
Jhar
khan
d 90
.34
15.3
1 14
.75
Oris
sa
93.6
9 16
.23
18.4
3
Chat
tisga
rh
98.7
1 11
.37
41.9
8
Mad
hya
Prad
esh
91.2
0 17
.15
25.1
3
Guj
arat
93
.43
21.3
5 33
.61
Mah
aras
htra
& G
oa
96.0
8 33
.54
44.7
4
And
hra
Prad
esh
94.3
3 3.
00
4.00
Karn
atak
a 89
.85
7.14
9.
35
Kera
la
81.5
7 36
.30
79.7
8
Tam
il N
adu
81.7
3 5.
23
9.04
All
Indi
a 93
.35
17.8
1 25
.07
Aw
aren
ess
leve
ls o
f the
Di�
eren
t Fin
anci
al In
stru
men
ts A
mon
g th
e La
tent
Dem
and
Gro
up
Perc
ent w
ith th
e aw
aren
ess
34

Private Pension Markets in India
States Below or at 30 years 31 - 45 years Above 45 years Maharashtra & Goa 42.5 40.1 17.4
Uttar Pradesh 49.2 30.2 20.6
Andhra Pradesh 44.2 31.7 24.1
Bihar 48.1 30.4 21.5
Gujarat 48.5 30.7 20.8
Tamil Nadu 46.2 33.1 20.8
Karnataka 40.3 31.9 27.9
West Bengal 40.1 36.3 23.6
Rajasthan 51.6 32.0 16.5
Punjab & Chandigarh 37.6 43.2 19.2
Orissa 50.4 32.5 17.1
Kerala 42.5 30.7 26.8
Delhi 31.2 48.1 20.7
Madhya Pradesh 45.1 29.4 25.4
Haryana 52.4 31.1 16.5
Jharkhand 52.3 25.9 21.8
Assam 44.1 35.6 20.4
Northern Hilly states 35.6 46.2 18.3
North Eastern states 49.0 28.4 22.5
Chattisgarh 40.8 37.0 22.3
All India 45.0 34.1 20.9
Distribution of the Latent Demand Group in Di�erent States Across Di�erent Age GroupsIn percent
35

Private Pension Markets in India
States Annual Incomes of the Latent Demand Group
<= 0.5 lakh 0.5 - 1 lakh 1 - 2 lakh > 2 lakh Maharashtra & Goa 23.1 36.4 20.0 20.5
Uttar Pradesh 48.0 35.9 13.1 3.0
Andhra Pradesh 42.0 38.0 15.9 4.1
Bihar 82.1 14.7 3.0 0.2
Gujarat 48.9 35.6 10.6 4.8
Tamil Nadu 58.9 27.9 10.6 2.5
Karnataka 54.2 32.0 10.4 3.4
West Bengal 60.1 30.0 7.7 2.2
Rajasthan 46.9 37.0 7.6 8.5
Punjab & Chandigarh 16.3 27.7 23.0 33.0
Orissa 69.3 22.7 6.3 1.7
Kerala 25.7 40.8 26.7 6.8
Delhi 7.8 23.3 26.1 42.8
Madhya Pradesh 44.2 32.9 9.4 13.4
Haryana 32.3 41.1 21.3 5.3
Jharkhand 59.1 25.7 9.5 5.8
Assam 56.6 30.8 10.0 2.6
Northern Hilly states 24.6 43.8 15.0 16.6
North Eastern states 21.6 59.5 16.7 2.3
Chattisgarh 42.4 31.5 23.4 2.7
All India 44.3 32.7 13.8 9.1
Distribution of the Latent Demand Group in Di�erent States Across Di�erent Income GroupsIn percent
36

Private Pension Markets in India
States Budgets easily Budgets easily most of the times Not able to budget easily Maharashtra & Goa 44.5 24.6 30.9
Uttar Pradesh 21.1 14.1 64.8
Andhra Pradesh 51.0 34.9 14.0
Bihar 37.2 11.4 51.4
Gujarat 69.6 25.7 4.7
Tamil Nadu 36.8 18.0 45.2
Karnataka 52.2 27.2 20.5
West Bengal 19.2 17.5 63.4
Rajasthan 44.8 13.0 42.2
Punjab & Chandigarh 41.8 41.4 16.8
Orissa 56.6 14.8 28.7
Kerala 61.6 29.2 9.2
Delhi 43.8 29.1 27.1
Madhya Pradesh 30.4 11.0 58.6
Haryana 28.2 22.9 48.9
Jharkhand 33.2 13.1 53.6
Assam 20.9 70.7 8.4
Northern Hilly states 33.5 29.3 37.2
North Eastern states 57.7 27.9 14.4
Chattisgarh 5.0 46.7 48.3
All India 41.2 23.2 35.6
Budgeting Capabilities of the Latent Demand Group in Di�erent StatesIn percent
37

Private Pension Markets in India
States Comprehends correctly Wrong comprehension No opinion Maharashtra & Goa 37.3 47.0 15.7
Uttar Pradesh 66.4 18.4 15.3
Andhra Pradesh 28.1 70.3 1.7
Bihar 68.1 13.7 18.2
Gujarat 52.6 35.3 12.1
Tamil Nadu 20.2 71.3 8.6
Karnataka 35.5 41.7 22.8
West Bengal 72.3 18.3 9.4
Rajasthan 75.0 11.6 13.3
Punjab & Chandigarh 84.8 5.4 9.8
Orissa 65.0 22.4 12.7
Kerala 17.8 79.4 2.7
Delhi 81.4 16.2 2.4
Madhya Pradesh 42.8 33.2 24.0
Haryana 56.6 26.0 17.4
Jharkhand 88.8 4.0 7.2
Assam 92.7 3.3 4.0
Northern Hilly states 75.2 16.1 8.6
North Eastern states 21.4 23.2 55.4
Chattisgarh 6.1 50.4 43.6
All India 52.7 34.1 13.2
Comprehension Levels of In�ation Concept Among the Latent Demand Group in Di�erent StatesIn percent
38

Private Pension Markets in India
States Lost money in a �nancial fraud Haven’t lost money/ haven’t experienced �nancial fraud Maharashtra & Goa 10.7 89.3
Uttar Pradesh 5.5 94.5
Andhra Pradesh 13.3 86.7
Bihar 11.4 88.6
Gujarat 12.5 87.5
Tamil Nadu 9.9 90.1
Karnataka 12.0 88.0
West Bengal 29.9 70.1
Rajasthan 14.2 85.8
Punjab & Chandigarh 11.1 88.9
Orissa 10.3 89.7
Kerala 24.1 75.9
Delhi 17.5 82.5
Madhya Pradesh 21.9 78.1
Haryana 9.3 90.7
Jharkhand 17.2 82.8
Assam 7.2 92.8
Northern Hilly states 2.7 97.3
North Eastern states 5.5 94.5
Chattisgarh 5.2 94.8
All India 12.3 87.7
Experience of Financial Fraud Among the Latent Demand Group in Di�erent StatesIn percent
39

Private Pension Markets in India
Stat
es
Put a
side
som
e Pa
y o�
the
bills
St
art s
pend
ing
for
OTh
ers
m
oney
for s
avin
gs
re
gula
r hou
seho
ld n
eeds
M
ahar
asht
ra &
Goa
10
.7
15.0
69
.6
4.7
Utt
ar P
rade
sh
11.2
12
.0
76.3
0.
5
And
hra
Prad
esh
30.8
37
.2
31.4
0.
5
Biha
r 5.
4 8.
5 86
.0
0.1
Guj
arat
15
.9
32.1
50
.4
1.5
Tam
il N
adu
8.6
10.3
80
.9
0.3
Karn
atak
a 15
.2
5.9
77.0
1.
9
Wes
t Ben
gal
13.1
25
.2
60.8
0.
9
Raja
stha
n 10
.4
13.3
75
.9
0.5
Punj
ab &
Cha
ndig
arh
29.4
23
.1
47.5
0.
0
Oris
sa
40.7
5.
9 53
.2
0.2
Kera
la
11.2
16
.4
72.3
0.
1
Del
hi
12.6
24
.5
62.8
0.
0
Mad
hya
Prad
esh
12.3
24
.2
62.4
1.
0
Har
yana
23
.2
8.5
65.6
2.
7
Jhar
khan
d 21
.2
8.9
69.4
0.
4
Ass
am
26.9
23
.5
49.6
0.
0
Nor
ther
n H
illy
stat
es
43.8
6.
2 49
.7
0.2
Nor
th E
aste
rn s
tate
s 38
.3
18.3
32
.2
11.3
Chat
tisga
rh
60.3
7.
5 17
.1
15.2
All
Indi
a 17
.0
17.2
64
.2
1.5
Spen
ding
Pra
ctis
es o
f the
Lat
ent D
eman
d G
roup
in D
i�er
ent S
tate
s on
Rec
iept
of S
ome
Inco
me
In p
erce
nt
40

Private Pension Markets in India
States Rural areas Metro cities Larger cities & towns Smaller towns Total Urban Total
Northern Hilly States 992,583 350,877 350,877 1,343,460
Punjab & Chandigarh 1,719,114 1,032,028 608,238 1,640,266 3,359,380
Haryana 1,686,026 245,256 172,132 417,388 2,103,414
Delhi 142,196 2,406,179 2,406,179 2,548,375
Rajasthan 2,502,928 870,972 439,421 1,310,393 3,813,321
Uttar Pradesh 7,372,884 1,889,151 922,937 2,812,088 10,184,972
Bihar 5,029,686 471,851 270,986 742,837 5,772,523
North Eastern States 889,891 180,802 180,802 1,070,693
Assam 940,887 198,019 214,859 412,878 1,353,765
West Bengal 1,672,248 471,701 1,091,798 621,807 2,185,306 3,857,554
Jharkhand 950,772 355,823 252,097 607,920 1,558,692
Orissa 2,506,601 313,526 229,978 543,504 3,050,105
Chattisgarh 585,443 103,938 46,374 150,312 735,755
Madhya Pradesh 1,207,414 646,986 272,892 919,878 2,127,292
Gujarat 2,981,299 804,250 1,079,037 843,621 2,726,908 5,708,207
Maharashtra & Goa 5,448,676 2,909,397 2,107,041 1,417,086 6,433,524 11,882,200
Andhra Pradesh 4,583,832 362,076 858,943 992,556 2,213,575 6,797,407
Karnataka 2,475,390 236,349 814,987 737,318 1,788,654 4,264,044
Kerala 1,911,063 222,641 525,688 748,329 2,659,392
Tamil Nadu 1,360,633 750,418 796,745 1,812,539 3,359,702 4,720,335
All India 46,959,566 7,940,370 13,098,742 10,912,208 31,951,320 78,910,886
Distribution of Latent Demand Group Across Geographic Sub-structure in Di�erent States
States Life Insurance Mutual funds Direct equities
Northern Hilly States 97.49 10.19 11.81
Punjab & Chandigarh 98.42 29.15 43.25
Haryana 96.41 8.04 14.41
Delhi 98.15 60.61 67.90
Rajasthan 97.96 13.06 22.69
Uttar Pradesh 96.46 8.20 8.88
Bihar 92.54 6.26 7.68
North East 76.71 18.75 9.80
Assam 98.47 17.69 36.17
West Bengal 90.98 25.41 32.04
Jharkhand 90.34 15.31 14.75
Orissa 93.69 16.23 18.43
Chattisgarh 98.71 11.37 41.98
Madhya Pradesh 91.20 17.15 25.13
Gujarat 93.43 21.35 33.61
Maharashtra & Goa 96.08 33.54 44.74
Andhra Pradesh 94.33 3.00 4.00
Karnataka 89.85 7.14 9.35
Kerala 81.57 36.30 79.78
Tamil Nadu 81.73 5.23 9.04
All India 93.35 17.81 25.07
Awareness levels of the Di�erent Financial Instruments Among the Latent Demand Group
Percent with the awareness
41

Private Pension Markets in India
Stat
es
Gol
d Ch
it fu
nds
NBF
Cs
Stoc
k Se
lf he
lp
Mut
ual f
unds
Re
al e
stat
e
Bank
Li
fe in
sura
nce
mar
kets
gr
oups
de
posi
ts
Perc
ent o
f the
late
nt d
eman
d in
the
grou
p fe
elin
g th
at th
e in
vest
men
t is
risk
y
N
orth
ern
Hill
y St
ates
21
11
10
8
10
5 2
0 0
Punj
ab &
Cha
ndig
arh
33
14
9 32
15
15
0
0 1
Har
yana
47
22
25
13
15
4
1 0
0
Del
hi
21
27
14
55
16
17
0 0
1
Raja
stha
n 17
12
9
22
13
6 2
4 3
Utt
ar P
rade
sh
25
27
25
9 16
3
1 0
1
Biha
r 37
11
27
7
4 4
0 0
1
Nor
th E
ast
45
9 2
7 31
5
48
9 5
Ass
am
26
9 9
9 11
7
15
10
14
Wes
t Ben
gal
34
59
35
34
22
27
17
7 8
Jhar
khan
d 36
24
10
12
24
9
4 1
9
Oris
sa
71
50
22
17
32
17
16
5 4
Chat
tisga
rh
67
8 1
14
1 9
0 0
0
Mad
hya
Prad
esh
16
13
3 18
15
11
3
1 1
Guj
arat
42
24
34
36
19
17
11
11
9
Mah
aras
htra
& G
oa
37
26
20
26
20
17
6 2
2
And
hra
Prad
esh
27
33
22
6 5
6 25
9
5
Karn
atak
a 15
17
6
8 2
6 4
5 4
Kera
la
33
52
48
49
18
35
7 4
7
Tam
il N
adu
11
43
24
11
9 10
7
3 3
All
Indi
a 31
27
21
20
15
11
8
4 4
Risk
Per
cept
ions
Am
ong
the
Late
nt D
eman
d on
Di�
eren
t Fin
anci
al In
stru
men
ts
42

Private Pension Markets in India
Occ
upat
ions
Ba
nks
Post
al s
avin
gs L
ife in
sura
nce
Smal
l sav
ings
M
utua
l fun
ds
Dir
ect e
quiti
es
Gol
d A
vera
ge
savi
ngs
rate
Perc
ent s
hare
of a
ggre
gate
sav
ings
�ow
into
the
savi
ngs
inst
rum
ent
Prim
ary
prod
ucer
s 62
.0
6.5
19.6
1.
1 3.
6 1.
8 5.
3 12
.6
Gov
ernm
ent s
alar
ied
wor
kers
58
.4
8.4
19.7
0.
5 4.
8 2.
6 5.
5 19
.0
Priv
ate
sala
ried
wor
kers
56
.8
7.6
15.9
0.
4 7.
0 3.
8 8.
4 15
.0
Self
empl
oyed
pro
fess
iona
ls
56.5
3.
5 10
.8
0.1
12.8
9.
8 6.
6 23
.2
Busi
ness
men
with
em
ploy
ees
56.4
4.
2 12
.2
0.3
11.4
9.
4 6.
1 18
.6
Self
empl
oyed
- no
n-pr
ofes
sion
al
55.4
7.
9 19
.1
0.8
7.6
4.2
5.0
15.4
Shop
keep
ers
53.7
6.
5 14
.7
0.8
9.0
6.9
8.3
17.9
Wag
e la
bour
ers
45.7
13
.1
31.0
4.
4 0.
6 0.
2 5.
0 10
.8
Stre
et v
endo
rs
42.1
7.
3 34
.0
2.9
0.5
0.1
13.1
11
.5
Oth
ers
47.9
13
.7
18.3
1.
4 4.
4 6.
6 7.
7 15
.8
Tota
l 56
.9
6.6
16.6
0.
7 7.
4 5.
3 6.
5 15
.2
Shar
es o
f Agg
rega
te S
avin
gs F
low
s in
Pas
t 12
Mon
ths
into
Di�
eren
t Sav
ings
Inst
rum
ents
Acr
oss
Occ
upat
ion
Gro
ups
Stat
es
Bank
s Po
stal
sav
ings
Life
insu
ranc
e Sm
all s
avin
gs
Mut
ual f
unds
D
irec
t equ
ities
G
old
Ave
rage
savi
ngs
rate
Perc
ent s
hare
of a
ggre
gate
sav
ings
�ow
into
the
savi
ngs
inst
rum
ent
N
orth
ern
Hill
y St
ates
71
.2
7.8
17.2
0.
1 0.
1 1.
4 2.
3 13
.1
Pu
njab
& C
hand
igar
h 68
.3
7.9
13
0.2
7.5
1.5
1.7
18.4
Har
yana
64
.3
5.7
24.8
0.
2 2.
8 0.
9 1.
3 15
.9
D
elhi
57
.7
2.9
9.1
0.1
17.5
9.
6 3
26.3
Raja
stha
n 56
.9
9.7
17.3
0.
4 3.
6 4.
6 7.
5 16
.9
U
ttar
Pra
desh
59
.3
5.6
28.7
0.
5 3.
7 0.
7 1.
4 14
.2
Bi
har
47.5
5.
8 43
.9
1.6
0.1
0.3
0.8
12.9
Nor
th E
aste
rn S
tate
s 43
.6
5.6
40.9
2.
3 1.
8 0.
7 5
12.4
Ass
am
46.9
7.
6 23
.5
1.5
0.5
0.3
19.7
20
.6
W
est B
enga
l 47
.4
8.1
24.7
0.
3 4.
9 4.
9 9.
7 13
.2
Jh
arkh
and
50.4
9.
7 28
.8
2.5
1.6
0.6
6.3
14.9
Oris
sa
52.5
10
.2
19.7
3.
1 4.
6 0.
3 9.
7 12
.8
Ch
attis
garh
75
.8
2.6
20.4
0.
1 0
0 1.
2 10
.7
M
adhy
a Pr
ades
h 61
.2
4.5
14.6
0.
7 4.
9 8.
5 5.
6 18
.4
G
ujar
at
52.6
9.
9 20
0.
7 4.
4 4.
7 7.
7 13
.1
M
ahar
asht
ra &
Goa
55
.3
5.3
11.7
0.
3 9.
6 9.
3 8.
6 17
.2
A
ndhr
a Pr
ades
h 62
.7
6 20
.3
3.7
3.2
2.3
1.8
10.6
Karn
atak
a 49
.9
9.3
27.8
1.
8 1.
7 1.
2 8.
3 14
.2
Ke
rala
48
.6
17.1
15
.5
1.7
2.4
1 13
.6
17.6
Tam
il N
adu
36.3
12
.2
16.2
1.
5 2.
3 0.
7 30
.8
13.5
All
Indi
a 56
.9
6.6
16.6
0.
7 7.
4 5.
3 6.
5 15
.2
Shar
es o
f Agg
rega
te S
avin
gs F
low
s in
Pas
t 12
Mon
ths
into
Di�
eren
t Sav
ings
Inst
rum
ents
Acr
oss
Stat
es
43

Private Pension Markets in India
Occ
upat
ions
Ba
nks
Post
al s
avin
gs L
ife in
sura
nce
Smal
l sav
ings
M
utua
l fun
ds
Dir
ect e
quiti
es
Gol
d A
vera
ge
savi
ngs
rate
Perc
ent s
hare
of a
ggre
gate
sav
ings
�ow
into
the
savi
ngs
inst
rum
ent
Prim
ary
prod
ucer
s 62
.0
6.5
19.6
1.
1 3.
6 1.
8 5.
3 12
.6
Gov
ernm
ent s
alar
ied
wor
kers
58
.4
8.4
19.7
0.
5 4.
8 2.
6 5.
5 19
.0
Priv
ate
sala
ried
wor
kers
56
.8
7.6
15.9
0.
4 7.
0 3.
8 8.
4 15
.0
Self
empl
oyed
pro
fess
iona
ls
56.5
3.
5 10
.8
0.1
12.8
9.
8 6.
6 23
.2
Busi
ness
men
with
em
ploy
ees
56.4
4.
2 12
.2
0.3
11.4
9.
4 6.
1 18
.6
Self
empl
oyed
- no
n-pr
ofes
sion
al
55.4
7.
9 19
.1
0.8
7.6
4.2
5.0
15.4
Shop
keep
ers
53.7
6.
5 14
.7
0.8
9.0
6.9
8.3
17.9
Wag
e la
bour
ers
45.7
13
.1
31.0
4.
4 0.
6 0.
2 5.
0 10
.8
Stre
et v
endo
rs
42.1
7.
3 34
.0
2.9
0.5
0.1
13.1
11
.5
Oth
ers
47.9
13
.7
18.3
1.
4 4.
4 6.
6 7.
7 15
.8
Tota
l 56
.9
6.6
16.6
0.
7 7.
4 5.
3 6.
5 15
.2
Shar
es o
f Agg
rega
te S
avin
gs F
low
s in
Pas
t 12
Mon
ths
into
Di�
eren
t Sav
ings
Inst
rum
ents
Acr
oss
Occ
upat
ion
Gro
ups
Stat
es
Bank
s Po
stal
sav
ings
Life
insu
ranc
e Sm
all s
avin
gs
Mut
ual f
unds
D
irec
t equ
ities
G
old
Ave
rage
savi
ngs
rate
Perc
ent s
hare
of a
ggre
gate
sav
ings
�ow
into
the
savi
ngs
inst
rum
ent
N
orth
ern
Hill
y St
ates
71
.2
7.8
17.2
0.
1 0.
1 1.
4 2.
3 13
.1
Pu
njab
& C
hand
igar
h 68
.3
7.9
13
0.2
7.5
1.5
1.7
18.4
Har
yana
64
.3
5.7
24.8
0.
2 2.
8 0.
9 1.
3 15
.9
D
elhi
57
.7
2.9
9.1
0.1
17.5
9.
6 3
26.3
Raja
stha
n 56
.9
9.7
17.3
0.
4 3.
6 4.
6 7.
5 16
.9
U
ttar
Pra
desh
59
.3
5.6
28.7
0.
5 3.
7 0.
7 1.
4 14
.2
Bi
har
47.5
5.
8 43
.9
1.6
0.1
0.3
0.8
12.9
Nor
th E
aste
rn S
tate
s 43
.6
5.6
40.9
2.
3 1.
8 0.
7 5
12.4
Ass
am
46.9
7.
6 23
.5
1.5
0.5
0.3
19.7
20
.6
W
est B
enga
l 47
.4
8.1
24.7
0.
3 4.
9 4.
9 9.
7 13
.2
Jh
arkh
and
50.4
9.
7 28
.8
2.5
1.6
0.6
6.3
14.9
Oris
sa
52.5
10
.2
19.7
3.
1 4.
6 0.
3 9.
7 12
.8
Ch
attis
garh
75
.8
2.6
20.4
0.
1 0
0 1.
2 10
.7
M
adhy
a Pr
ades
h 61
.2
4.5
14.6
0.
7 4.
9 8.
5 5.
6 18
.4
G
ujar
at
52.6
9.
9 20
0.
7 4.
4 4.
7 7.
7 13
.1
M
ahar
asht
ra &
Goa
55
.3
5.3
11.7
0.
3 9.
6 9.
3 8.
6 17
.2
A
ndhr
a Pr
ades
h 62
.7
6 20
.3
3.7
3.2
2.3
1.8
10.6
Karn
atak
a 49
.9
9.3
27.8
1.
8 1.
7 1.
2 8.
3 14
.2
Ke
rala
48
.6
17.1
15
.5
1.7
2.4
1 13
.6
17.6
Tam
il N
adu
36.3
12
.2
16.2
1.
5 2.
3 0.
7 30
.8
13.5
All
Indi
a 56
.9
6.6
16.6
0.
7 7.
4 5.
3 6.
5 15
.2
Shar
es o
f Agg
rega
te S
avin
gs F
low
s in
Pas
t 12
Mon
ths
into
Di�
eren
t Sav
ings
Inst
rum
ents
Acr
oss
Stat
es
44

Private Pension Markets in India
Stat
es
Conc
ious
ly p
repa
ring
N
ot p
repa
ring
now
H
ave
not t
houg
ht
Do
not e
xpec
t
for r
etir
emen
t bu
t do
expe
ct to
retir
e ab
out r
etir
emen
t to
retir
e M
ahar
asht
ra &
Goa
5.
9 5.
2 48
.2
40.7
Utt
ar P
rade
sh
5.4
20.0
62
.2
12.5
And
hra
Prad
esh
3.6
17.3
53
.4
25.6
Biha
r 4.
2 18
.1
65.2
12
.5
Guj
arat
7.
8 4.
5 57
.6
30.1
Tam
il N
adu
2.1
5.4
61.6
30
.8
Karn
atak
a 3.
1 8.
6 28
.7
59.6
Wes
t Ben
gal
3.1
10.1
83
.5
3.3
Raja
stha
n 7.
6 11
.7
51.2
29
.5
Punj
ab &
Cha
ndig
arh
17.6
8.
6 58
.2
15.6
Oris
sa
25.8
31
.8
38.0
4.
5
Kera
la
6.8
10.8
28
.7
53.8
Del
hi
8.6
9.8
57.5
24
.1
Mad
hya
Prad
esh
14.0
18
.6
58.3
9.
0
Har
yana
11
.0
16.0
46
.0
27.0
Jhar
khan
d 8.
0 12
.0
74.8
5.
1
Ass
am
3.6
15.4
67
.7
13.3
Nor
ther
n H
illy
stat
es
11.1
18
.9
37.2
32
.8
Nor
th E
aste
rn s
tate
s 4.
8 12
.5
59.8
22
.9
Chat
tisga
rh
67.8
4.
6 13
.0
14.6
All
Indi
a 7.
6 12
.6
54.4
25
.4
Retir
emen
t Out
look
of t
he L
aten
t Dem
and
Gro
up in
Di�
eren
t Sta
tes
In p
erce
nt
45

Private Pension Markets in India
Stat
es
Yes
Yes,
but
par
tially
N
o M
ahar
asht
ra &
Goa
21
28
51
Utt
ar P
rade
sh
23
14
63
And
hra
Prad
esh
17
50
33
Biha
r 56
9
35
Guj
arat
22
16
62
Tam
il N
adu
55
9 36
Karn
atak
a 62
21
17
Wes
t Ben
gal
20
20
60
Raja
stha
n 30
16
54
Punj
ab &
Cha
ndig
arh
28
27
45
Oris
sa
21
14
65
Kera
la
4 18
78
Del
hi
30
16
54
Mad
hya
Prad
esh
30
4 66
Har
yana
42
20
37
Jhar
khan
d 40
26
33
Ass
am
11
33
56
Nor
ther
n H
illy
stat
es
50
13
37
Nor
th E
aste
rn s
tate
s 7
58
34
Chat
tisga
rh
19
33
48
All
Indi
a 29
21
50
Expe
ctat
ion
of G
over
nmen
t Sup
port
in O
ld A
ge b
y th
e La
tent
Dem
and
Gro
up in
Di�
eren
t Sta
tes
In P
erce
nt
46

Private Pension Markets in India
Stat
es
Bank
cus
tom
ers
Post
al s
avin
gs c
usto
mer
s Li
fe in
sura
nce
cust
omer
s M
ahar
asht
ra &
Goa
1
0,07
7,70
6
2,9
40,6
27
7,6
16,6
10
Utt
ar P
rade
sh
7,0
63,6
31
830
,243
3
,925
,581
And
hra
Prad
esh
3,6
40,4
98
1,0
34,0
12
3,6
35,3
25
Biha
r 2
,802
,903
5
51,1
43
2,0
30,1
48
Guj
arat
4
,233
,697
1
,226
,014
2
,900
,225
Tam
il N
adu
1,7
88,6
95
840
,741
1
,443
,172
Karn
atak
a 2
,848
,174
8
17,6
49
2,2
21,1
22
Wes
t Ben
gal
2,4
36,1
01
692
,563
1
,971
,254
Raja
stha
n 2
,228
,015
6
15,2
79
1,7
88,5
19
Punj
ab &
Cha
ndig
arh
2,7
13,8
70
769
,052
2
,305
,983
Oris
sa
2,2
10,9
99
520
,844
1
,581
,415
Kera
la
2,0
27,3
47
1,0
44,7
50
1,5
99,4
44
Del
hi
2,2
82,6
22
260
,016
2
,034
,935
Mad
hya
Prad
esh
1,4
05,4
25
203
,999
1
,053
,638
Har
yana
1
,436
,707
2
03,4
57
957
,274
Jhar
khan
d 1
,091
,269
1
82,2
60
737
,348
Ass
am
998
,803
3
60,8
66
892
,763
Nor
ther
n H
illy
stat
es
1,1
38,5
67
132
,364
8
16,7
60
Nor
th E
aste
rn s
tate
s 6
01,4
80
115
,224
4
45,9
22
Chat
tisga
rh
511
,570
6
6,37
1
439
,258
All
Indi
a 5
3,53
8,08
0
13,
407,
475
4
0,39
6,69
8
Out
reac
h of
the
Late
nt D
eman
d G
roup
in D
i�er
ent S
tate
s Th
roug
h D
i�er
ent F
inan
cial
Sec
tors
Num
ber o
f per
sons
47

Private Pension Markets in India
Savi
ngs
inst
rum
ent
Ann
ual i
ncom
es (R
upee
s la
kh)
<=0.
5 0.
5 - 1
1
-2
2 - 5
>
5 To
tal
Life
insu
ranc
e D
eman
d fr
om e
xist
ing
cust
omer
s 78
9,31
7 80
3,04
0 71
3,85
2 33
2,04
1 10
3,49
3 2,
741,
743
D
eman
d fr
om n
ew c
usto
mer
s 3,
344,
258
1,67
0,39
0 53
5,06
3 85
,445
14
,146
5,
649,
303
Fe
nce
sitt
ers
3,80
6,05
4 5,
360,
278
3,40
4,20
1 1,
787,
619
1,05
4,05
4 15
,412
,205
Mut
ual f
unds
D
eman
d fr
om e
xist
ing
cust
omer
s no
t pro
ject
ible
62
,585
89
,244
24
7,41
7 15
8,87
2 56
0,06
6
D
eman
d fr
om n
ew c
usto
mer
s 11
3,67
8 96
,941
11
1,13
5 10
4,62
1 22
,088
44
8,46
3
Fenc
e si
tter
s 43
6,73
4 1,
110,
805
1,39
3,30
7 1,
302,
923
886,
327
5,13
0,09
6
Equi
ties
Dem
and
from
exi
stin
g cu
stom
ers
not p
roje
ctib
le
42,8
82
53,6
97
258,
020
94,1
01
458,
601
D
eman
d fr
om n
ew c
usto
mer
s 87
,093
57
,421
50
,530
46
,818
33
,792
27
5,65
4
Fe
nce
sitt
ers
4155
70
6429
55
6511
08
8641
68
7323
83
3,30
6,18
4
Buyi
ng In
tent
ions
of t
he L
aten
t Dem
and
Gro
up
48

Private Pension Markets in India

Private Pension Markets in India
Invest India Market Solutions Private LimitedD-26, Sector 3, Noida 201 301, India
Phone: +91 98718 69585 and +91 98715 73585. Facsimile: +91 120 4232122Email: [email protected]. URL: http://www.iimsdataworks.com
IIMS Dataworks
Invest India Market Solutions (IIMS Dataworks) was established in 2005 and is the only market research firm in India focused exclusively on researching the composition and operation of retail finance markets.
A largely government controlled finance sector in past had little incentive to invest in the necessary information platforms for market research and market monitoring purposes. The opening of the sector to competition in an environment of accelerated economic growth has accentuated the need for the sector to track consumer sentiment, behaviour and preferences. IIMS Dataworks specialises in producing national level primary datasets on retail markets to support retail finance providers to better evaluate existing and new business opportunities. This enables better reading of composition and direction of retail demand, and extends the framework for public policy formulation and regulatory development. The IIMS business orientation also focuses on retail finance sales and distribution models. Commission led, non-transparent and labour intensive sales and distribution models that currently characterize the sector create financial disincentives for smaller investors to participate in the markets. IIMS Dataworks believes that greater innovation is required to rebase sales and distribution by leveraging available technologies and network to create more effective and affordable sales channels for consumers. This is particularly the case in rural and semi urban locations and for social groupings that do not have adequate access to formal financial channels. IIMS Dataworks is working in dedicated partnerships with a number of institutions for these purposes.
IIMS Dataworks has already produced India’s largest privately funded pan – India incomes and Savings Survey, cutting across geographies, settlement sub-structures, occupational groups and all income grades. Based on this database, IIMS Dataworks has already produced several publications on Indian Retail Finance Markets, including several handbooks that focus on helping financial distributors and intermediaries in expanding the current retail customer base.
Going forward, IIMS Dataworks plans to launch a two-year collaborative research project titled ‘Indian Retail Finance – the next 100 million customers’. IIMS Dataworks also plans to launch its next round of pan – India survey in 2009, wherein an exclusive panel will be dedicated to the research needs of the Pensions sector.
Price: INR 25,000/ US$ 625